
Abstract
Objective
This study aims to enhance the early diagnosis of Mpox through machine learning (ML) and deep learning (DL) models, integrating an ensemble approach to improve classification accuracy.
Methods
We used the Mpox Skin Lesion Dataset v2.0, comprising six skin lesion categories, including chickenpox, cowpox, Mpox, measles, hand-foot-mouth disease, and healthy skin. Four models—Logistic Regression, K-Nearest Neighbors, Vision Transformer (ViT), and ConvMixer—were evaluated based on their classification performance. An ensemble model combining ViT and ConvMixer predictions was developed to further improve accuracy and robustness. Performance metrics such as accuracy, precision, recall, F1-score, and AUC were used for evaluation.
Results
The ViT model outperformed traditional ML models, achieving 93.03% accuracy in detecting Mpox lesions. The ensemble model further improved diagnostic performance, yielding balanced precision and recall across all lesion categories. The proposed approach demonstrated superior classification accuracy compared to previous studies, highlighting the efficacy of DL-based models in distinguishing Mpox from visually similar conditions.
Conclusion
The integration of ML and DL models in an ensemble framework significantly enhances Mpox detection. This AI-driven diagnostic approach offers a scalable, accurate, and efficient solution, particularly in resource-limited settings. Future research will focus on improving model interpretability, federated learning integration, and validation with real-world clinical data.
Introduction
Mpox (monkeypox) poses a significant global public health challenge, as evidenced by the 2022 outbreak that showed unprecedented geographic spread outside the traditional endemic regions of West and Central Africa. 1 This viral disease, caused by a member of the Orthopoxvirus genus, the same genus that includes smallpox virus, has historically occurred in two distinct genetic clades: Clade I (Congo Basin clade) and Clade II (West African clade).1–3 The typical clinical presentation of Mpox involves a prodromal phase characterized by fever, headache, myalgia, low back pain, asthenia, and lymphadenopathy, the latter representing a distinguishing feature that may help differentiate it from other orthopoxvirus infections and diseases such as chickenpox. 4 The incubation period, between exposure and onset of symptoms, typically ranges from one to two weeks, but can extend up to 21 days. 5 Following the prodromal phase, a characteristic rash appears that progresses through distinct stages over two to four weeks, from macules to papules, vesicles, pustules, and finally scabs, which may lead to scarring. 6 The rash may occur in a localized or diffuse manner, commonly affecting the face, palms of the hands, soles of the feet, as well as the mouth, genitals, and anal regions. Transmission of Mpox virus occurs primarily through close contact with an infected person, including direct skin-to-skin contact, intimate relationships such as sexual activity, mouth-to-mouth contact, and exposure to respiratory particles during close face-to-face interaction. 7 The 2022 global outbreak highlighted a significant role of sexual contact in Mpox Clade II transmission, underscoring a change in the predominant mode of spread from previous outbreaks8,9 and the need for rapid and accurate diagnostic tools to contain the spread of the virus and effectively manage cases. The diagnosis of Mpox is based on a combination of laboratory testing and clinical evaluation. Laboratory confirmation is the cornerstone of definitive diagnosis, particularly considering the clinical similarities with other infectious diseases. The preferred laboratory test for Mpox is the detection of viral DNA by PCR (polymerase chain reaction). 10 The optimal samples for PCR testing are swabs taken directly from skin lesions, including fluids or scabs, obtained by vigorous swabbing. Antibody detection, also known as serologic testing, is generally not recommended for the acute diagnosis of Mpox, mainly because of the significant antigenic cross-reactivity between different orthopoxviruses, which can lead to false positive results and make it difficult to distinguish Mpox from other related viral infections or from past smallpox vaccination. 11
Despite advances in diagnostic methods, significant limitations remain in the current Mpox diagnostic landscape, particularly in resource-limited settings where access to specialized laboratories may be reduced. 4 These limitations include the need for specific laboratory infrastructure, trained personnel, and processing times that can delay diagnosis and, consequently, implementation of infection control measures. In addition, variability in the clinical presentation of Mpox, including cases with atypical lesion distribution or absence of typical prodromal symptoms, can complicate diagnosis based solely on clinical evaluation. To address the existing gaps and limitations in Mpox diagnostics, particularly the need for rapid, reliable, and accessible tools, especially in resource-limited settings, this study proposes an innovative automatic detection and classification system to differentiate Mpox from other skin conditions that share similar clinical features, such as chickenpox and measles.
Our findings demonstrate that deep learning (DL) models, particularly the Vision Transformer (ViT), consistently surpass traditional machine learning (ML) approaches in classifying skin lesions. Vision Transformer's self-attention mechanisms allow it to effectively capture global contextual information, enabling precise differentiation of subtle visual features that distinguish Mpox from other dermatological conditions. This capability is especially critical for minimizing misdiagnoses and improving clinical decision-making. To further enhance diagnostic accuracy, robustness, and generalizability, we developed an ensemble model that integrates predictions from both ML and DL techniques. This approach leverages the complementary strengths of different models, combining the structured feature extraction of ML with the advanced pattern recognition capabilities of DL. Performance evaluations indicate that the ensemble model achieves superior classification accuracy compared to individual models, offering greater reliability and consistency across diverse datasets. These results highlight the transformative potential of AI-driven diagnostic tools in improving Mpox detection, particularly in settings where access to specialized laboratory testing is limited. By providing a fast, accurate, and scalable diagnostic solution, this approach could significantly contribute to global public health efforts aimed at controlling and managing Mpox outbreaks more effectively.
The rest of the paper is organized as follows. “Related works” section reviews the most significant approaches in medical diagnostics, with a particular focus on skin lesion classification. “Methods” section outlines the methodology and implementation details, including the dataset used and the evaluation metrics. “Results and discussion” section presents the experiments conducted, highlighting performance comparisons. Finally, “Strength and limitations” section concludes the paper and outlines future research directions.
Related works
In recent years, the application of ML and DL techniques 12 has demonstrated significant potential in transforming medical diagnostics, particularly in the early detection of infectious diseases such as Mpox. By addressing the limitations of conventional diagnostic methodologies, summarized in Table 1, these advanced computational approaches enable the analysis of diverse data sources—including electronic medical records, medical images, and laboratory results—unveiling complex patterns that support accurate and timely diagnoses.
Comparison of standard Mpox diagnostic techniques.

Machine learning techniques were widely applied in medical diagnostics, especially for the automated detection and classification of skin lesions. 13 Various algorithms, such as Decision Trees, Random Forests, Support Vector Machines (SVMs), and K-Nearest Neighbors (KNN), have been used to analyze medical images—particularly dermoscopic images—to identify patterns indicative of different skin conditions. 14 In parallel, DL has shown remarkable promise in this field, with Convolutional Neural Networks (CNNs) playing a central role in extracting complex features from skin lesion images. 15 Several studies have explored the application of ML algorithms for Mpox diagnosis, leveraging their ability to learn from diverse data sources. A systematic review 16 examining research published between 2022 and 2024 assessed the effectiveness of ML models in detecting Mpox. Following PRISMA guidelines, the review analyzed studies from multiple databases, including ScienceDirect, Pubmed, IEEE Xplore, ACM Digital Library, and Springer Link. The findings indicate that ML algorithms—particularly CNNs and SVMs—demonstrated high accuracy and sensitivity in identifying Mpox, outperforming traditional diagnostic methods such as contact tracing. Moreover, integrating ML with imaging techniques, such as dermoscopy and radiography, has further improved diagnostic accuracy. 17
Recent advancements in DL have focused on distinguishing Mpox from visually similar conditions, such as chickenpox, measles, and cowpox. Traditional CNN architectures, including VGG16, ResNet50, and InceptionV3, have been extensively utilized for this purpose. For example, Sahin et al. 18 evaluated the performance of several pretrained DL models, including MobileNetV2, on a dataset of Mpox skin lesions, achieving an accuracy of 91.11% in binary classification. Similarly, Sitaula and Shahi 19 compared various pretrained models, reporting an accuracy of 87.13% using an ensemble approach. Although these models achieved promising results, their performance was often constrained by dataset complexity and visual similarities among different lesions.
The use of ensemble learning, which combines multiple models to enhance classification accuracy and robustness, has also gained traction in medical image analysis. Zhang et al. 20 introduced an integrated learning framework that merges the strengths of different DL models to improve skin lesion classification. Their approach, leveraging ensemble techniques and model fusion, demonstrated notable improvements in accuracy and generalization, particularly in challenging datasets. In the context of Mpox detection, integrated learning methods have proven especially effective. Gupta et al. developed a multimodal DL system, MPXCN-Net, which integrates CNNs and ML algorithms, achieving an average classification accuracy of 90.4%. 21 Transfer learning has further contributed to improving DL performance in medical image analysis, particularly in scenarios with limited labeled data. Chen et al. 22 reported a comprehensive review of transfer learning techniques in medical imaging, emphasizing their effectiveness when applied to constrained datasets. By fine-tuning pretrained models on domain-specific datasets, researchers have been able to achieve state-of-the-art results in skin lesion classification. For example, Ahsan et al. 23 applied transfer learning and federated learning techniques to enhance Mpox diagnosis, utilizing modified versions of VGG16 and ViT. Their method, which incorporates privacy-preserving federated learning, achieved high accuracy in both binary and multiclass classification tasks, with the M-VGG16 model reaching 88% accuracy in binary classification and the M-ResNet50 model achieving 89% in multiclass classification. In addition to individual diagnostics, DL has shown great promise in public health applications, particularly for early detection and outbreak surveillance. Visibelli et al. 24 studied the role of DL patterns in the early identification of smallpox and other infectious diseases, underscoring the critical need for rapid and accurate diagnostic tools in outbreak response. The results suggest that DL patterns can serve as valuable resources for public health surveillance, especially in settings with limited access to laboratory testing and dermatological expertise.
A review of existing literature reveals several key trends in the application of ML and DL for Mpox diagnosis: (i) A predominance of image-based diagnostic approaches utilizing DL, particularly CNNs and transfer learning. 25 (ii) Growing interest in hybrid approaches that combine DL for feature extraction with traditional ML classifiers. 26 (iii) Increasing adoption of transformer-based architectures 27 for multiclass classification of skin lesions, including Mpox. (iv) A rising emphasis on interpretable AI in medical diagnostics, as demonstrated by the use of techniques such as Grad-CAM for model explainability. 28 Despite notable advancements, distinguishing Mpox from visually similar conditions remains a significant challenge. The development of larger, high-quality, and diverse datasets is essential to enhance the generalizability and robustness of ML/DL models. Additionally, research on nonimage-based diagnostic approaches—such as genomic data analysis and electronic health records—remains limited, highlighting the need for broader exploration in this area. Clinical validation and real-world implementation of ML/DL tools are crucial to ensure their practical applicability. Furthermore, federated learning techniques warrant further investigation to enable collaborative model training while safeguarding data privacy. Interpretability is another key consideration, as enhancing the transparency of AI-based diagnostics is vital for clinical trust. Evaluating the cost-effectiveness and accessibility of ML/DL-driven diagnostic tools, particularly in resource-limited settings, is also essential for promoting equitable healthcare solutions.
Methods
The overall workflow for skin lesion classification, including dataset preprocessing, model training, and evaluation, is summarized in Figure 1. We used the Mpox Skin Lesion Dataset Version 2.0 (MSLD v2.0), publicly available on Kaggle (https://www.kaggle.com/datasets/joydippaul/mpox-skin-lesion-dataset-version-20-msld-v20/data). The dataset comprises six categories of skin lesions: Chickenpox (75 images), Cowpox (66 images), Mpox (284 images), Measles (55 images), Hand-foot-mouth disease (HFMD, 161 images), and Healthy skin (114 images). In total, 755 original clinical images were collected from 541 unique patients, ensuring diverse representation. Notably, the dataset has been validated by professional dermatologists and received appropriate regulatory approval, establishing its reliability for algorithm development.

Workflow diagram for skin lesion classification and detection.
The dataset is organized into two main directories: (1) Original Images, containing a “FOLDS” subfolder with five cross-validation folds (fold1–fold5), each subdivided into train, validation, and test sets; and (2) Augmented Images, housing systematically transformed versions created using MATLAB R2020a. The augmentation process applied multiple transformations including rotation (±30°), translation (±10%), reflection, shearing (±15%), scaling (0.8–1.2×), hue adjustments (±10%), saturation alterations (±15%), contrast enhancement (0.8–1.2×), brightness jittering (±15%), and controlled noise addition. This strategy expanded the dataset approximately 14-fold to 7532 total images, organized within a “FOLDS_AUG” subfolder that preserves the original fold structure.
Each image follows a standardized naming convention: DiseaseCode_PatientNumber_ImageNumber. Disease codes are assigned as follows: Chickenpox (CHP), Cowpox (CWP), Mpox (MKP), Measles (MSL), HFMD, and Healthy (HEALTHY). For example, “MKP_17_01” represents the first photograph from patient #17 with Mpox. The dataset includes comprehensive metadata in “datalog.xlsx” with five sheets corresponding to each cross-validation fold, explicitly listing image filenames allocated to train, validation, and test sets. All images underwent preprocessing including dimensional standardization to 128 × 128 × 3 pixels, pixel normalization to the range,[0,1] and class encoding (Chickenpox: 0, Cowpox: 1, HFMD: 2, Healthy: 3, Measles: 4, Mpox: 5). During training, additional transformations were applied: random horizontal flipping (probability: 0.5), random rotation (factor: 0.02), and random zooming (height/width factors: 0.2). Following preprocessing, the dataset was partitioned with 6025 images (80%) for training and 1507 images (20%) for testing.
Computational tasks were executed in Python 3.8.10 using specialized libraries including NumPy (1.22.3), Pandas (1.4.2), Matplotlib (3.5.1), Seaborn (0.11.2), and TensorFlow (2.9.1) with Keras (2.9.0). Model training was conducted on a workstation with an NVIDIA GeForce RTX 3090 GPU, Intel Core i9-11900 K CPU, and 64GB RAM, utilizing CUDA 11.6 and cuDNN 8.4.0 for acceleration.
We investigated four models, that is, two classical ML approaches (Logistic Regression [LR] and KNN) and two DL architectures (ViT and ConvMixer). This specific combination of models was deliberately chosen to provide a comprehensive evaluation framework balancing interpretability, computational efficiency, and state-of-the-art performance. Logistic Regression was selected as our baseline model due to its established interpretability in multiclass classification tasks and robust performance in high-dimensional feature spaces. Its linear decision boundaries provide valuable insights into feature importance, enabling clear identification of discriminative image characteristics across different skin lesion types. K-Nearest Neighbors was chosen as our second classical approach due to its nonparametric nature and ability to capture complex local patterns without assuming specific data distributions—an important consideration given the heterogeneous visual presentation of dermatological conditions.
For DL approaches, we specifically selected ViT to leverage its innovative attention mechanism that excels at capturing long-range dependencies in images—crucial for identifying subtle distinctions between similar-appearing skin lesions. The ViT architecture's ability to model global image context makes it particularly well-suited for differentiating conditions with similar localized features but distinct overall patterns. ConvMixer was chosen as our second DL model because it effectively combines the inductive biases of CNNs with aspects of transformers, providing strong performance with lower computational requirements. This architecture's design allows efficient processing of spatial hierarchies while maintaining the ability to identify critical diagnostic features across different scales. This strategic selection of complementary models enables robust comparative analysis across different algorithmic paradigms, with each model offering distinct advantages: LR for interpretability and baseline performance; KNN for nonparametric pattern recognition; ViT for global context modeling; and ConvMixer for efficient hierarchical feature extraction. Together, these four models provide a balanced evaluation framework that spans the spectrum from classical statistical approaches to current state-of-the-art DL architectures, allowing comprehensive assessment of classification capabilities for Mpox and similar skin conditions.
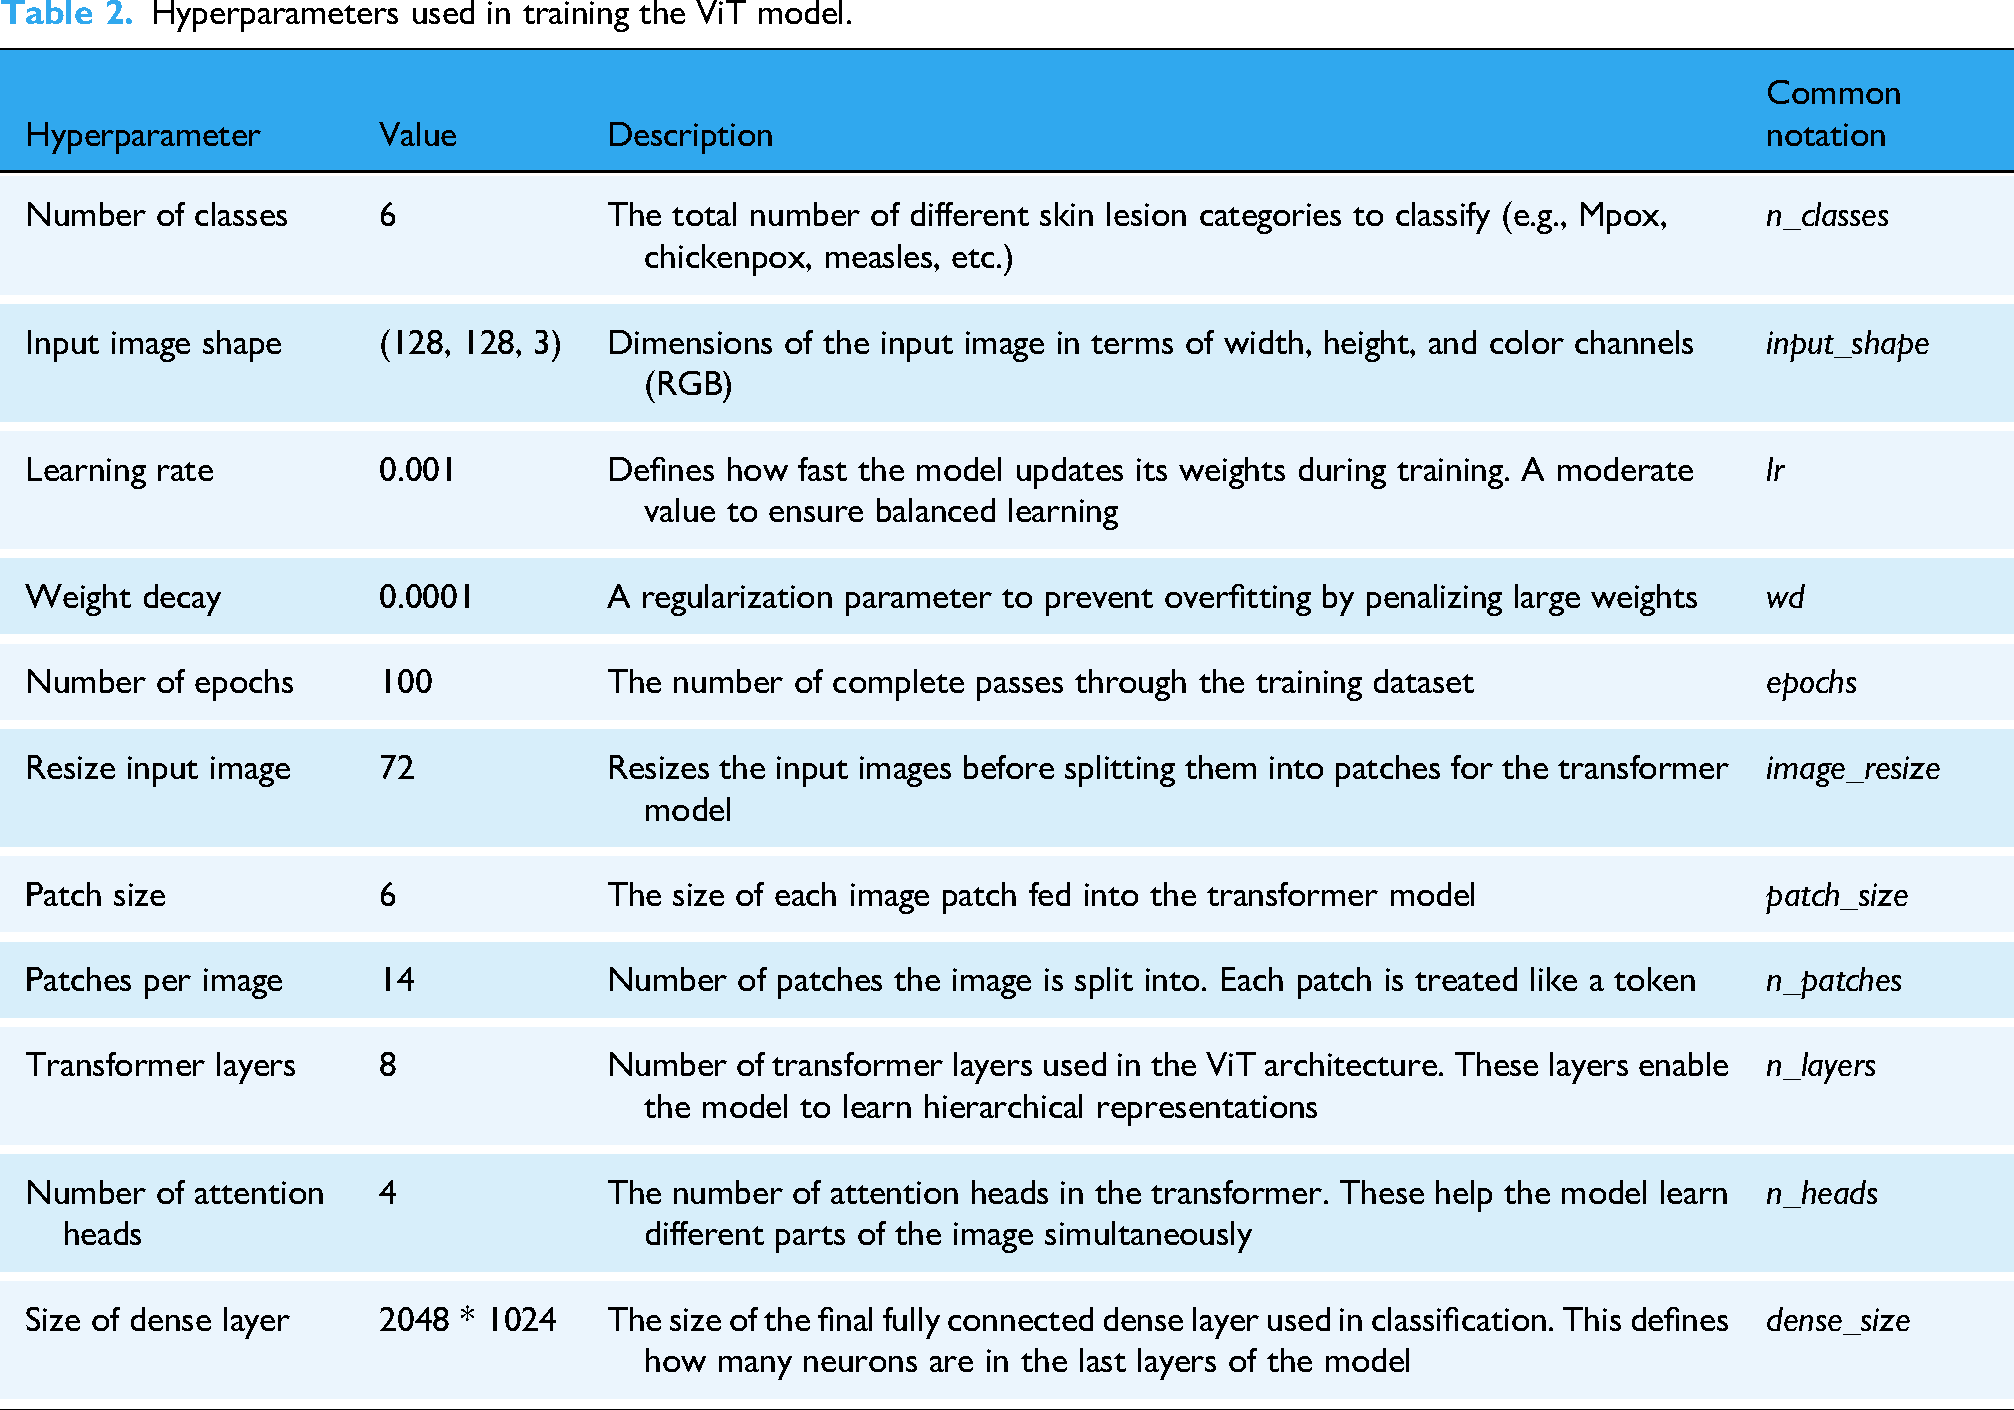
The hyperparameters for both ViT and ConvMixer models were determined through a systematic grid search approach. For the ViT model, we experimented with patch sizes (4, 6, 8), transformer layers (4, 8, 12), and attention heads (2, 4, 8), using a validation set comprising 20% of the training data. Learning rates were tuned using a logarithmic scale ranging from 0.0001 to 0.01, with 0.001 showing the optimal balance between convergence speed and stability. For ConvMixer, we explored kernel sizes (3, 5, 7), embedding dimensions (256, 512, 1024), and depth variations (8, 12, 16). The final hyperparameter configurations were selected based on validation accuracy and convergence behavior, with early stopping implemented to prevent overfitting. We observed that smaller patch sizes (6) for ViT resulted in better feature representation for skin lesion details, while deeper transformer architectures (8 layers) improved classification performance without excessive computational demands. Additionally, we employed weight decay as a regularization technique, with the value 0.0001 determined experimentally to provide optimal generalization capabilities for both models.
To address the potential for overfitting, particularly given the relatively smaller dataset size, we implemented several strategies. First, extensive data augmentation were applied to increase the diversity of the training data, expanding the dataset from 755 to 7532 images. Second, we employed stratified 5-fold cross-validation to ensure robust evaluation across different subsets of the data. Third, regularization techniques such as weight decay (L2 regularization) with a value of 0.0001 and dropout were used to penalize large weights and randomly deactivate neurons during training. Fourth, early stopping with a patience of 15 epochs was implemented to halt training if the validation loss did not improve. Fifth, class weights inversely proportional to class frequencies were applied to address class imbalance, ensuring that the model did not bias its predictions toward majority classes. Finally, learning rate scheduling using ReduceLROnPlateau was employed to dynamically reduce the learning rate when the validation loss plateaued, fine-tuning the model and avoiding large updates to the weights. These measures collectively ensured that our models generalized well to unseen data.
All models were trained using a comprehensive optimization strategy. For DL models, we employed categorical cross-entropy loss with class weights inversely proportional to class frequencies to address data imbalance. Optimization utilized Adam with an initial learning rate of 0.001, β1 = 0.9, β2 = 0.999, and ε = 1e-07. Learning rate management followed a dynamic reduction strategy (ReduceLROnPlateau with patience = 5, factor = 0.2, and minimum rate = 1e-6), decreasing the rate when validation loss plateaued. Training incorporated early stopping (patience = 15, monitoring validation loss) to prevent overfitting, with a batch size of 32 determined through memory constraint analysis and training efficiency experiments. Data shuffling was performed at each epoch to enhance model robustness.
Vision transformer
Vision Transformer model marks a significant advance in image classification by exploiting transformer architectures, originally designed for natural language processing, for computer vision tasks. Unlike CNNs, which process images as grids of pixels with spatial localization, ViT divides the input image into patches of fixed size and treats each patch as a token, analogous to how words are treated in a sentence. Each image is divided into patches, which are serialized into vectors and then mapped into a low-dimensional space through matrix multiplication. This allows the transformation model to focus on the global relationships within the image, making it particularly effective for tasks that require understanding both local and global patterns. The key feature of ViT is its self-attention mechanism, which computes the relationships between all patches in parallel, capturing dependencies across the entire image. This approach contrasts with CNNs, where the receptive field gradually expands as layers increase. By utilizing this global self-attention, ViT excels in learning long-range dependencies between image patches, enhancing its ability to perform complex visual tasks. Additionally, ViT retains the spatial coherence of patches using a positional embedding matrix, which is added to the patch embeddings to maintain the relative positioning of the patches, despite treating them as independent tokens. Vision Transformer's ability to capture intricate image features without relying on convolutions makes it highly scalable and adaptable. Studies, such as those by Touvron et al., 29 demonstrate that ViT can outperform conventional CNN models like ResNet in various tasks. However, as noted by Yuan et al., 30 ViT requires large datasets and substantial computational resources to fully exploit its capabilities, a limitation in low-resource settings. Table 2 summarizes the hyperparameters used in training the ViT model for this study.
Hyperparameters used in training the ViT model.
ConvMixer
ConvMixer is an innovative architecture designed specifically for computer vision tasks that process input images by operating directly on patches. Unlike CNNs, which focus on local spatial hierarchies, ConvMixer maintains consistent resolution and dimension representation across all layers. This departure from conventional CNN models allows the model to separate channel mixing from spatial mixing, enabling more refined feature extraction essential to distinguish between similar visual patterns. The architecture consists of a patch embedding layer followed by a fully convolutional block. In the patch embedding layer, the input image is divided into smaller segments (patches), which are then processed independently. This approach allows the model to capture fine-grained details within each patch while maintaining the spatial structure of the original image. The mathematical representation of the image patch embedding is given by the following equation:
The unique design of the ConvMixer allows it to process patches independently, harnessing the power of convolutional operations for effective spatial feature extraction. This hybrid approach improves the model's ability to learn complex patterns within images, proving particularly useful in tasks such as image classification, object detection, and segmentation. Recent studies have shown that architectures such as ConvMixer can perform competitively in various benchmarks, highlighting the effectiveness of ConvMixer in extracting relevant features while maintaining computational efficiency. In particular, ConvMixer has been shown to outperform traditional CNNs in image classification tasks without incurring the same computational overhead. In this regard, it has been observed that the architecture enables higher computational efficiency and better generalization than CNN-based approaches, making it particularly suitable for applications in the health field, where medical image analysis requires high accuracy in pattern recognition. 32 In addition, the model exploits the potential of hybrid architectures that combine the strengths of convolutional networks and transformer-like structures. Research indicates that models such as ConvMixer can better generalize to unseen data, a crucial factor for implementing ML models in real-world scenarios. 33 This is especially relevant for applications in the healthcare field, where robust tools for diagnosis and image analysis are needed.
K-Nearest neighbors
K-Nearest Neighbors algorithm is one of the most widely used supervised ML models for classification and regression tasks,34,35 known for its simplicity and effectiveness in various applications, including image recognition, recommender systems, and medical diagnosis. 36 Unlike more complex models, KNN operates on a simple principle: it classifies new instances based on similarity to instances in the training dataset, effectively capturing local patterns in the data. This algorithm works on the basis of proximity, relying on the idea that similar data points are likely to have similar outcomes. During the prediction phase, the algorithm calculates the distance between the input data point and all examples in the training set, using various distance metrics, including Euclidean distance, Manhattan distance, and Minkowski distance. The choice of distance metric can significantly affect the performance of the model, as different metrics may capture the underlying structure of the data differently. For example, Euclidean distance is often preferred for continuous variables, while Manhattan distance may be more suitable in high-dimensional spaces where features vary significantly in scale. After calculating the distances, KNN identifies the k nearest neighbors of the input data point based on these distances. The hyperparameter k is critical, as it determines the number of neighbors to be considered. A smaller k can lead to a model sensitive to data noise, resulting in overfitting, while a larger k can blur distinctions between classes and lead to underfitting. 37 The algorithm then assigns the most common class among the k close to the input data point, effectively making the prediction. 38 The nonparametric nature of KNN allows it to adapt to various data distributions without the need to make assumptions about the underlying data structure, making it particularly attractive for tasks where the data may not conform to traditional parametric assumptions. 36 In addition, KNN can be combined with various techniques, such as dimensionality reduction methods (e.g., PCA) or feature scaling (e.g., normalization or standardization), to improve its performance, especially in high-dimensional datasets. However, despite its strengths, KNN has some limitations. Its computational complexity increases significantly with the size of the training dataset, as it requires computing the distance with all training examples for each prediction, which can be prohibitive in large-scale applications. 39 In addition, KNN is susceptible to the curse of dimensionality, whereby the distance between points becomes less significant as the number of dimensions increases, potentially deteriorating the performance of the model. 40 In conclusion, KNN remains a fundamental algorithm in the ML toolkit, particularly useful for beginners because of its intuitive approach. Its versatility in various applications and its ability to produce interpretable results contribute to its continued popularity in the fields of data analysis and predictive modeling. 41
Logistic regression
Logistic regression is a widely used supervised ML model
42
employed for both regression and classification tasks. For classification, it leverages the logit transformation function, which ensures that the predicted outcomes are constrained between 0 and 1:

Performance metrics
Evaluating the performance of a classification model is crucial to understanding its effectiveness and suitability for a given task. Several key metrics are commonly used to assess classification performance (precision, accuracy, recall, and the F1 score). Each of these metrics provides different insights into the model's behavior, particularly in the context of imbalanced datasets. Accuracy is the most straightforward performance metric and is defined as the proportion of correctly predicted instances out of the total instances evaluated:
where TP (True Positives) are correctly predicted positive instances, TN (True Negatives) are correctly predicted negative instances, FP (False Positives) are incorrectly predicted positive instances, and FN (False Negatives) are incorrectly predicted negative instances. While accuracy is easy to understand and compute, it can be misleading, especially in scenarios where classes are imbalanced. For example, in a dataset where 95% of the instances belong to one class, a model that predicts the majority class for all instances could achieve high accuracy but fail to identify the minority class correctly.
Precision focuses on the quality of the positive predictions made by the model. It is the ratio of true positive predictions to the total number of positive predictions (TP plus FP):
High precision indicates that the model has a low false positive rate (FPR), which is particularly important in scenarios where false positives carry significant costs, such as spam detection or medical diagnoses. In these cases, a high precision ensures that when the model predicts a positive outcome, it is likely to be correct.
Recall is called sensitivity or true positive rate (TPR), measures the model's ability to identify all relevant instances. It is the ratio of true positive predictions to the total actual positives (TP plus FN):
High recall is essential in contexts where missing a positive instance has severe consequences, such as in disease detection, where failing to identify a positive case could lead to detrimental health outcomes. Thus, while precision focuses on the accuracy of positive predictions, recall emphasizes the completeness of capturing positive instances.
The F1 score is the harmonic mean of precision and recall, which provides a single metric that balances both concerns. It is particularly useful when dealing with imbalanced datasets, as it does not solely favor precision or recall but finds a middle ground. The F1 score is beneficial in situations where both FP and FN are critical to address, allowing for a more nuanced evaluation of the model's performance:
In addition to these primary metrics, the ROC (Receiver Operating Characteristic) curve and AUC are valuable tools for assessing model performance across various thresholds. The ROC curve plots the rate of true positives (sensitivity) against the rate of FP at different threshold settings, providing insight into the trade-offs between sensitivity and specificity. The AUC quantifies the overall ability of the model to discriminate between positive and negative classes, with a value of 1 indicating perfect classification and a value of 0.5 indicating no ability to discriminate (random guess). 47
Results and discussion
Performance comparison of Ml/Dl models
In this section, we evaluate the performance of various ML and DL models in classifying Mpox and other skin conditions. Table 3 presents a detailed comparison of the performance metrics for each model. Among the models evaluated, the ViT consistently outperformed others across all lesion categories. For chickenpox detection, the ViT model achieved an impressive accuracy of 0.93, along with a precision of 0.91, recall of 0.87, F1-score of 0.89, and an AUC of 0.93. Similarly, for cowpox, the model recorded accuracy, precision, recall, F1-score, and AUC values of 0.93, 0.95, 0.80, 0.87, and 0.90, respectively. The ViT model demonstrated exceptional capability in distinguishing healthy skin, achieving an accuracy of 0.93, precision of 0.93, recall of 0.94, F1-score of 0.93, and an AUC of 0.96. For HFMD, it recorded scores of 0.93, 0.94, 0.96, 0.95, and 0.97, reflecting high reliability in detecting this condition. Similarly, the model excelled in classifying measles, with values of 0.93 for accuracy, 0.99 for precision, 0.90 for recall, 0.94 for F1-score, and 0.95 for AUC. Most notably, the ViT model delivered remarkable results in detecting and classifying Mpox skin lesions, achieving an accuracy of 0.93, precision of 0.92, recall of 0.96, F1-score of 0.94, and an AUC of 0.95. These results highlight the model's potential in handling diverse skin conditions with high accuracy and reliability.
Performance comparison of ml/dl models for skin lesion classification.
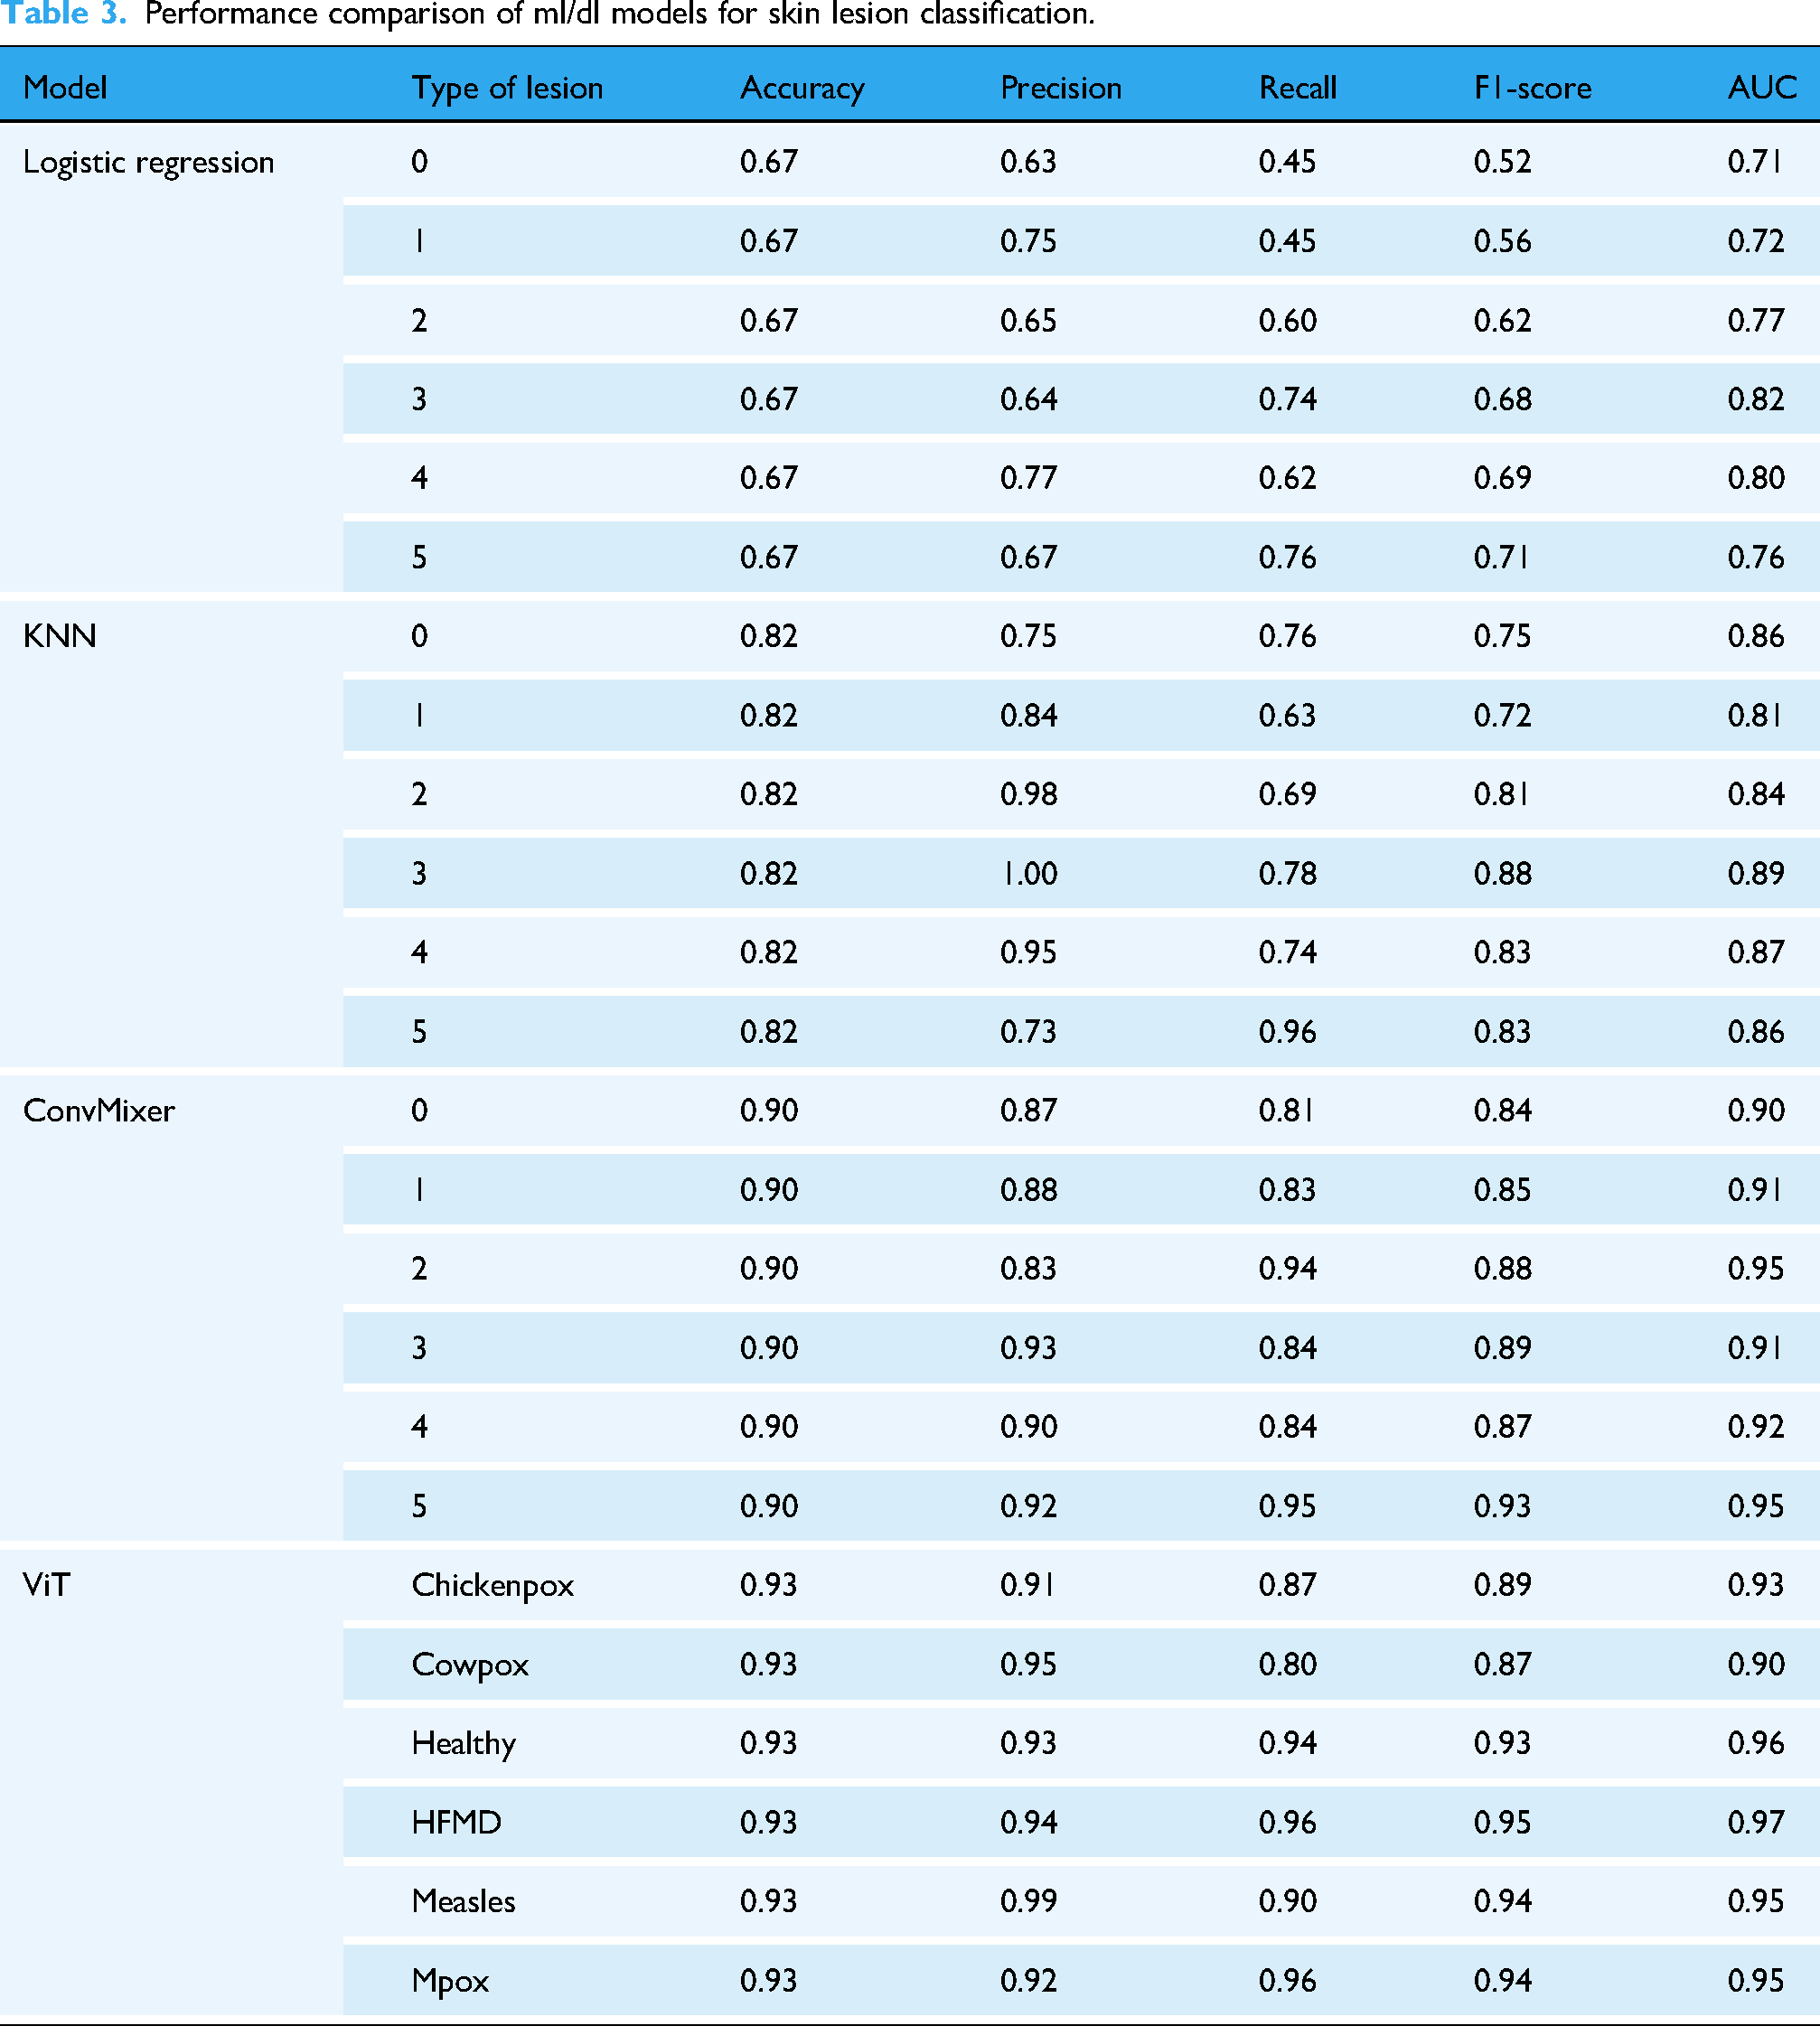
Figure 2 graphically represents ROC curves for each algorithm used in this work. These curves measure the efficiency of each model in correctly distinguishing between the six classes of skin lesions. The AUC provides a numerical evaluation of the discriminative ability of the model, where a value of 1.0 represents a perfect classification and 0.5 equals a random classification. The ROC curve for the LR model (Figure 2(a)) indicates a moderate discriminative ability, with AUC ranging between 0.71 (for chickenpox) and 0.82 (for HFMD). Although the model succeeds in separating some classes relatively effectively (e.g., HFMD and measles with AUCs of 0.82 and 0.80, respectively), it shows limitations for other classes, such as chickenpox and Mpox, where AUCs are less than 0.75. This result reflects the simplicity of the LR model and its dependence on linear features, which may not fully capture the visual complexities of the images. The ROC curve of the KNN model (Figure 2(b)) shows an improvement over the LR, with AUC values ranging from 0.81 (for chickenpox) to 0.89 (for measles). The KNN benefits from its nonparametric nature, which allows it to better fit more complex distributions in the data. However, its slightly inferior performance for some classes (such as Mpox with an AUC of 0.86) suggests that the model may suffer from the choice of hyperparameters (e.g., number of neighbors) or inherent variability in the data. The ViT model (Figure 2(c)) clearly stands out for its excellent discriminative ability, with AUC ranging from 0.90 (for cowpox) to 0.96 (for HFMD). The ROC curves of ViT are significantly closer to the upper left corner of the graph, indicating high sensitivity and specificity. This result highlights the effectiveness of ViT in analyzing complex images, exploiting its ability to model global relationships between pixels through attention mechanisms. The ROC curves of the ConvMixer (Figure 2(d)) present the highest AUCs among all models, with values ranging from 0.91 (for cowpox) to 0.98 (for HFMD). The superiority of the ConvMixer can be attributed to its architecture that combines local convolutions and global channel mixing, allowing the model to capture both detailed features and global image patterns. This approach is particularly advantageous for classes with high visual variability, such as Mpox and measles, where AUCs reach values of 0.96 and 0.98, respectively.
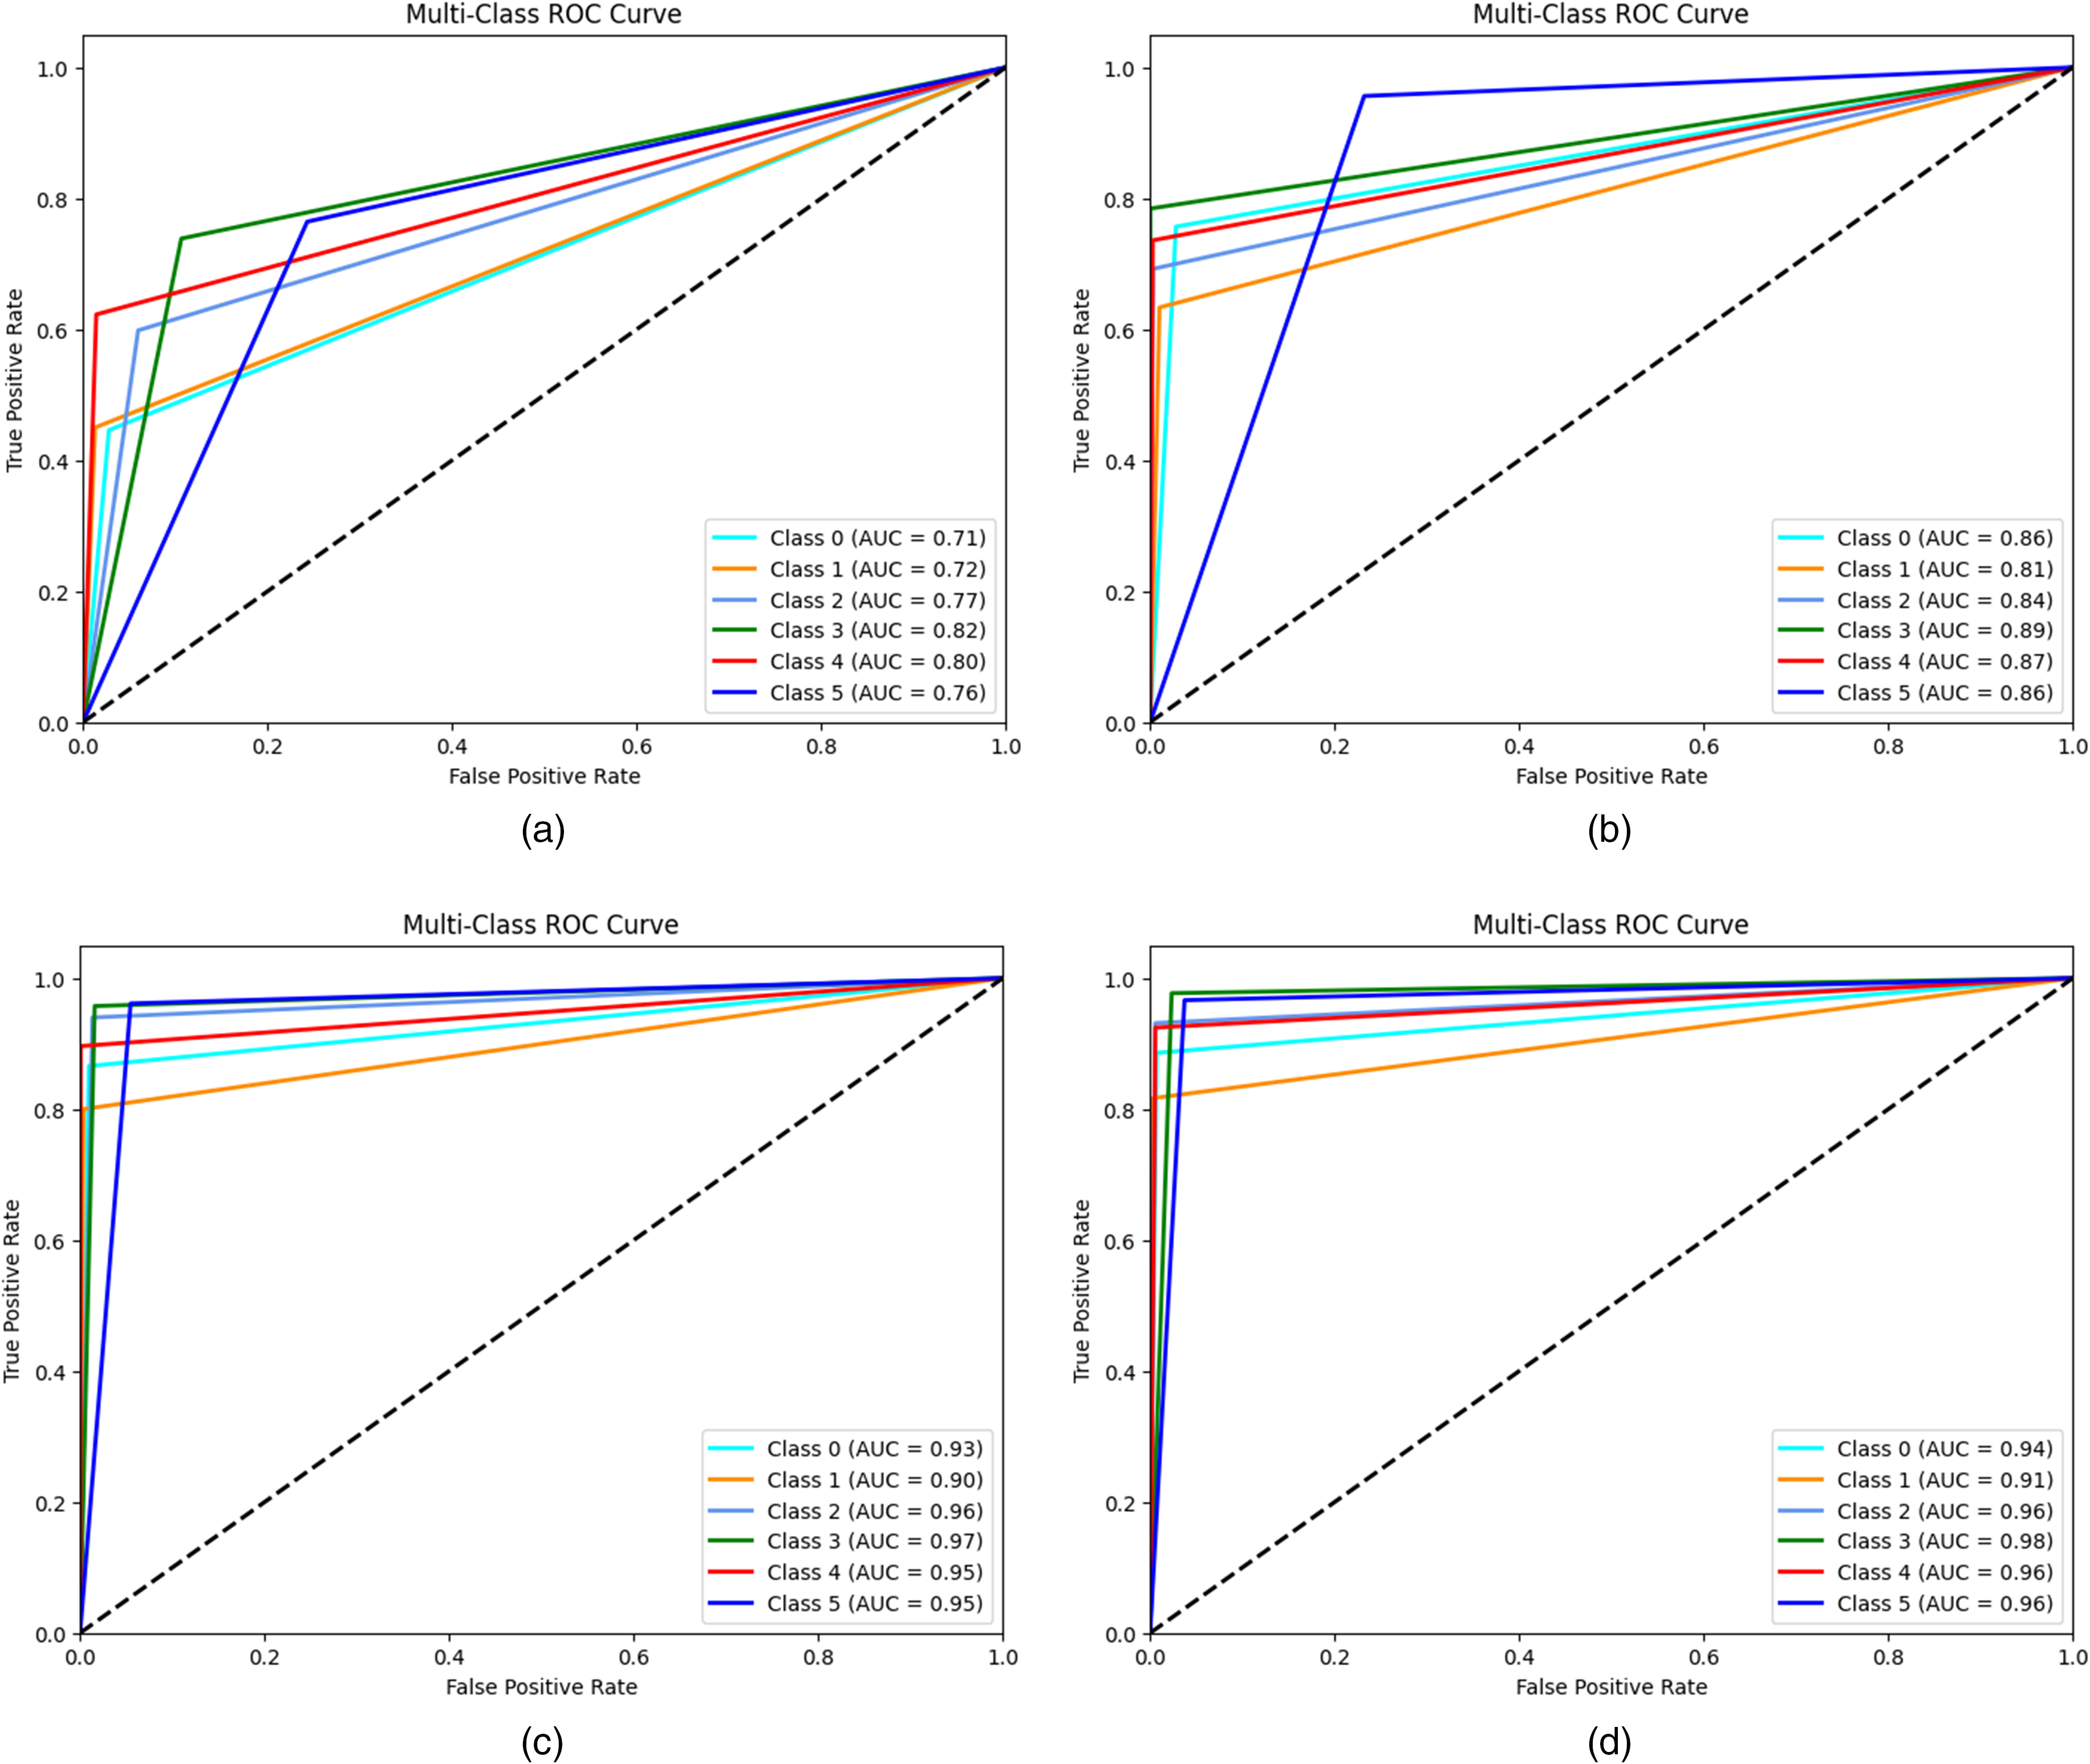
Receiver operating characteristic (ROC) curves of (a) LR, (b) KNN, (c) ViT, and (d) ConVmixer.
Figure 3 represents the P-R curves of the four models, applied to the classification of six skin lesion classes. This analysis focuses on the balance between accuracy (ability of a model to avoid false positives) and recall (ability to detect all true positives), which is particularly useful in contexts with unbalanced classes. Specifically, the LR model (Figure 3(a)) shows modest performance, with precision-recall values ranging from 0.34 for chickenpox to 0.54 for measles. The low performance for most classes points to difficulties in handling the complexity of the data, with a high incidence of false positives and missed true positives, making it less suitable for complex clinical scenarios. The KNN model (Figure 3(b)) improves significantly over LR, with precision-recall values between 0.54 for cowpox and 0.83 for HFMD. However, KNN shows some variability between classes, indicating that its generalization ability may be affected by the spatial distribution of the data. The ViT (Figure 3(c)) stands out for its superior performance, with P-R values between 0.78 (cowpox) and 0.91 (HFMD). Thanks to the attention mechanisms, the ViT is able to capture both global and local patterns, ensuring high and consistent performance for almost all classes, with a low incidence of false positives and negatives. The ConvMixer (Figure 3(d)) emerges as the best-performing model, with precision-recall values ranging between 0.80 per cowpox and 0.93 per Mpox. The ConvMixer's ability to extract features at different abstraction levels results in excellent results for all classes, ensuring consistency and reliability even in critical clinical settings.

Precision recall curve of (a) LR, (b) KNN, (c) ViT, and (d) ConvMixer.
Confusion matrix analysis
To better understand classification performance, we analyze the confusion matrices of each model (see Figure 4). This analysis allows us to identify misclassification patterns, assess the distribution of false positives and false negatives, and evaluate the ability of each model to distinguish between different types of skin lesions. The confusion matrices provide a visual representation of the diagnostic reliability of the models and highlight areas for potential improvement. The confusion matrix of the LR model (Figure 4(a)) shows a high number of false negatives for several classes, such as chickenpox and cowpox, indicating difficulty in distinguishing between these two similar conditions. Sensitivity (recall) is particularly low for classes that are less well represented or have less pronounced visual characteristics. This suggests that the model struggles to accurately identify more complex lesions, resulting in limited overall accuracy. The confusion matrix of the KNN model (Figure 4(b)) shows significant improvements over LR, with more true positives for all classes. However, there are still errors in the classification of visually similar classes, such as cowpox and measles, which are sometimes confused. This behavior is consistent with the nature of KNN, which bases its decisions on similarities in neighboring data, being more sensitive to the quality and distribution of the dataset. The confusion matrix for ViT (Figure 4(c)) demonstrates remarkable precision and a balance between precision and recall. The number of true positives is high for all classes, with a significant reduction in false positives and false negatives. For example, for complex classes such as Mpox and HFMD, ViT manages to maintain high accuracy due to its ability to capture global and local relationships in images. Residual errors are sporadic and concentrated in classes with margins of visual overlap. The ConvMixer confusion matrix (Figure 4(d)) stands out for its excellent overall performance, with a high number of true positives and a very low number of errors. This model demonstrates maximum uniformity in the classification of all classes, as evidenced by the almost complete absence of false negatives. For example, for the Mpox class, the ConvMixer shows accuracy and sensitivity close to 100%, making it the most reliable model for clinical applications in real-world scenarios.
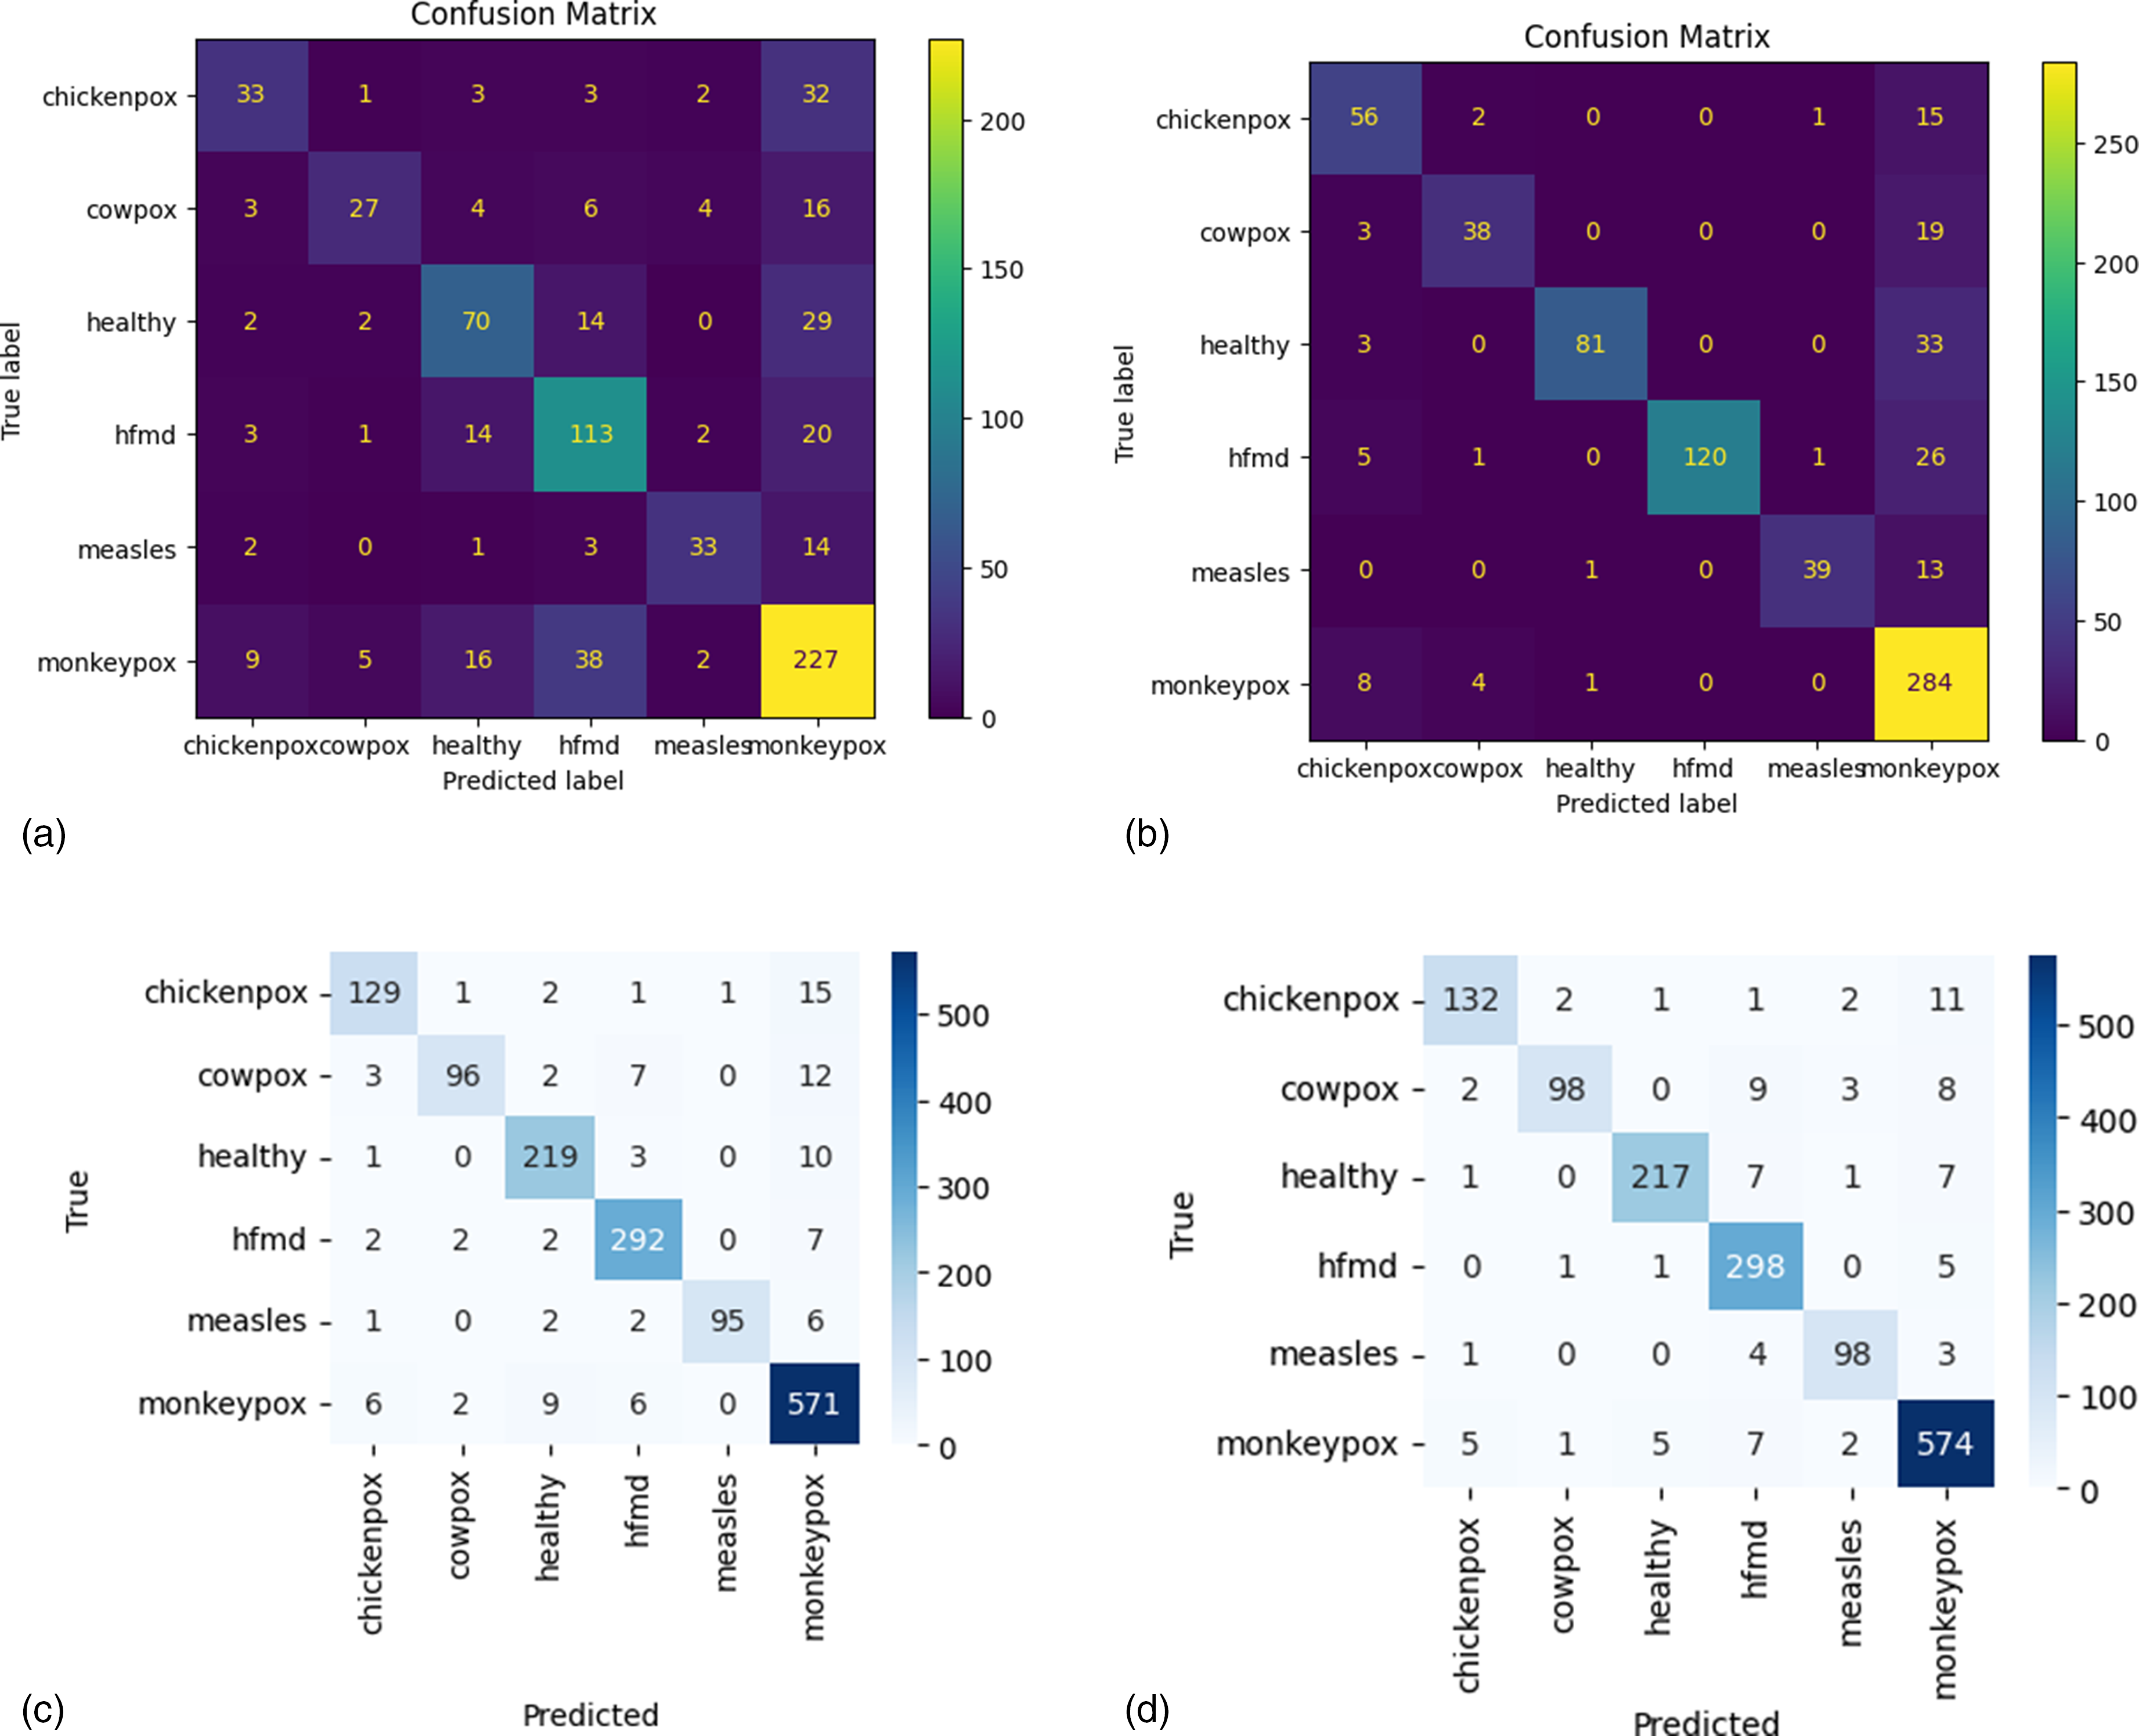
Confusion matrix of (a) LR, (b) KNN, (c) ViT, and (d) ConvMixer.
The parameters of the confusion matrix for each ML and DL model are summarized in Tables 3, 4, 5, and 6. Analyzing the results of each model, for the LR model, the TP, TN, FP, and FN values for each skin lesion show variable performance. The LR model (Table 4) performed better overall with the diagnosis of HFMD, with 113 true positives and a good number of true negatives (577), but with a higher number of false positives (64) and false negatives (40). For measles diagnosis, the model achieved 33 true positives, with 711 true negatives and 10 false positives, but 20 false negatives, indicating some room for improvement. For the diagnosis of Mpox, LR obtained 227 true positives and 346 true negatives, but 111 false positives and 70 false negatives, suggesting that the model may be less accurate in diagnosing this condition than other lesions.
Confusion matrix metrics for LR.

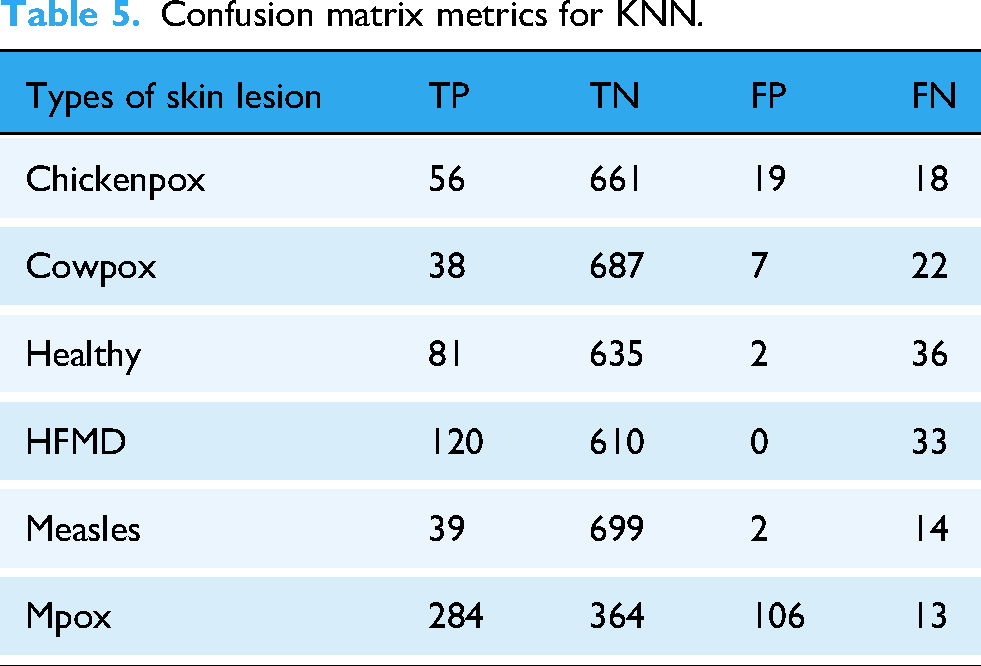
Confusion matrix metrics for KNN.
Confusion matrix metrics for ViT.

The KNN model (Table 5) showed generally better performance than LR. For varicella, the model obtained 56 true positives, 661 true negatives, 19 false positives, and 18 false negatives, demonstrating a good balance between detecting varicella and reducing false positives. For cowpox, the model scored 38 true positives, 687 true negatives, 7 false positives, and 22 false negatives, while for HFMD it detected 120 true positives, with no false positives but 33 false negatives. For measles, the model identified 39 true positives, with 699 true negatives and only 2 false positives, but with 14 false negatives. For Mpox, KNN identified 284 true positives, but with a relatively high number of false positives (106) and 13 false negatives.
The ViT model (Table 6) achieved particularly impressive results, with high TP and low FP values for all skin lesion categories. For chickenpox, ViT identified 129 true positives and 1345 true negatives, with only 13 false positives and 20 false negatives, showing a remarkable ability to distinguish chickenpox from other lesions. For cowpox, ViT identified 96 true positives, with 1382 true negatives, 5 false positives, and 24 false negatives, indicating a low incidence of misclassification. Performance for measles diagnosis was equally strong, with 95 true positives, 1411 true negatives, and only 1 false positive and 11 false negatives. For Mpox, ViT achieved 571 true positives, 863 true negatives, 50 false positives, and 23 false negatives, showing a good balance between sensitivity and specificity, although the number of false positives could be reduced.
Finally, the ConvMixer model (Table 7) showed similar good results to ViT, with 132 true positives for chickenpox, 1349 true negatives, 9 false positives, and 17 false negatives. For cowpox, ConvMixer obtained 98 true positives and 1405 true negatives, with 4 false positives and 22 false negatives, while for HFMD it identified 298 true positives, with 1181 true negatives and 28 false positives. For measles, ConvMixer identified 98 true positives, with 1401 true negatives, 8 false positives, and 8 false negatives. For Mpox, the model identified 574 true positives and 899 true negatives, with 34 false positives and 20 false negatives, suggesting that ConvMixer performed well, but could improve on reducing false positives.
Confusion matrix metrics for convMixer.

As shown in Figure 5(a), the ViT model for detecting and classifying Mpox skin lesions achieved a training loss of 0.0430 and a training accuracy of 98.65%, while during the testing phase, it resulted in a loss of 0.2825 and an accuracy of 93.03%, with a total CPU wall time for the simulation of 27 min and 4 s. The ConvMixer model (Figure 5(b)) exhibited a training loss of 0.0300 and a training accuracy of 99.19%, with a testing loss of 0.4088 and a testing accuracy of 91.37%, requiring a longer simulation time of 1 h, 6 min, and 31 s. The outputs from both models are presented in Figure 6, and given their performance, an ensemble model combining the ViT and ConvMixer was created to enhance accuracy and reliability, achieving a training loss of 0.09 and a training accuracy of 97.23%, with a validation loss of 0.15 and a validation accuracy of 95.36%, while the total CPU time was 1 h, 5 min, and 59 s, the system time was 28 min and 35 s, and the overall wall time for the simulation was 2 h, 12 min, and 13 s.

Training and testing accuracy and loss curves for (a) the ViT model and (b) the ConvMixer model.

Model outputs for studied DL models.
Ensemble model performance
To further improve the accuracy and robustness of classification, an ensemble model integrating ViT and ConvMixer predictions was developed. This section presents the performance of the ensemble model compared with individual classifiers, demonstrating its ability to combine the strengths of different architectures to improve lesion classification.
Figure 7 illustrates the accuracy and loss curves for the ensemble model, demonstrating its performance during both the training and validation phases. The accuracy curve shows a steady increase in training accuracy, indicating the model's ability to correctly classify the skin lesions over time. During the early stages of training, the model experiences rapid improvements, eventually stabilizing as it approaches its optimal performance. The loss curve, on the other hand, reflects the gradual decrease in the model's loss value, signifying that the model is learning to minimize errors effectively as training progresses. The validation accuracy also follows a similar pattern, showing a strong correlation with training accuracy, while the validation loss decreases steadily, indicating that the model generalizes well to unseen data. These curves provide insights into the model's convergence behavior, highlighting its efficiency and robustness in learning to detect and classify skin lesions accurately.

Accuracy and loss curve of ensemble model.
Table 8 presents the performance metrics of the ensemble model for the classification of various skin lesions, including chickenpox, smallpox, healthy skin, HFMD, measles, and Mpox. These performance metrics—accuracy, precision, recall, and F1 score—provide a comprehensive assessment of the model's ability to classify each type of skin lesion. For chickenpox, the model achieved an accuracy of 94%, with a precision of 94%, a recall of 89%, and an F1 score of 91%. This indicates that the ensemble model is highly accurate in identifying chickenpox, though there is room for improvement in its ability to detect all true instances of chickenpox (as reflected in the recall). For cowpox, the ensemble model achieved an accuracy of 94%, with a precision of 96%, a recall of 82%, and an F1 score of 88%. The precision is notably high, suggesting that when the model classifies a lesion as cowpox, it is usually correct. However, the recall value indicates that the model misses some true cases of cowpox, leading to a lower F1 score. For healthy skin, the model achieved an accuracy of 94%, with a precision of 97%, a recall of 93%, and an F1 score of 95%. The ensemble model demonstrates strong performance in identifying healthy skin lesions, as evidenced by the high precision, recall, and F1 score. For HFMD, the accuracy is again 94%, with a precision of 91%, a recall of 98%, and an F1 score of 94%. The high recall indicates that the model is effective at detecting most instances of HFMD, while the precision is slightly lower, suggesting that there are some false positives. For measles, the model obtained an accuracy of 94%, a precision of 92%, a recall of 92%, and an F1 score of 92%. The balanced precision and recall values suggest that the model performs well in detecting and classifying measles lesions. Finally, for Mpox, the accuracy was 94%, with a precision of 94%, a recall of 97%, and an F1 score of 96%. The ensemble model performs excellently in classifying Mpox, with both high precision and recall, resulting in a very high F1 score.
The performance parameter values of ensemble model.

Figure 8 presents the confusion matrix for the ensemble model, showing the TP, TN, FP, and FN values for the classification of each skin lesion type. These values are essential for understanding the model's performance in terms of correct and incorrect classifications. For chickenpox, the model correctly identified 132 instances as positive (TP) and correctly classified 1349 instances as negative (TN). However, it incorrectly identified 9 instances of chickenpox as other lesions (FP) and missed 17 true cases of chickenpox (FN). This indicates a fairly strong ability to detect chickenpox, with a relatively low number of misclassifications. For cowpox, the model detected 98 true positives (TP) and correctly classified 1384 true negatives (TN). There were 4 false positives (FP), where other lesions were mistakenly classified as cowpox, and 22 false negatives (FN), where true cowpox cases were missed. The performance for cowpox is slightly lower than for chickenpox, as indicated by the higher number of false negatives. For healthy skin, the model detected 217 true positives (TP) and correctly classified 1273 instances as negative (TN). The model misclassified 7 instances of healthy skin as other lesions (FP) and missed 16 true healthy skin cases (FN). The performance is again quite strong, though the relatively small number of false positives and false negatives suggests that there might be occasional misclassifications between healthy skin and other lesion types. For HFMD, the model correctly identified 298 true positives (TP) and 1181 true negatives (TN), but there were 28 false positives (FP) and 7 false negatives (FN). The recall for HFMD is high, indicating that most true cases were detected, but the presence of false positives suggests some confusion with other lesion types. For measles, the model identified 98 true positives (TP) and 1401 true negatives (TN). It made eight false positive (FP) and eight false negative (FN) errors. The model performs well in identifying measles, with a low number of misclassifications. For Mpox, the model achieved 574 true positives (TP) and 879 true negatives (TN). The model made 34 false positives (FP) and missed 20 true cases of Mpox (FN). The performance is quite strong for Mpox, with relatively few errors in both false positives and false negatives.

Confusion matrix of ensemble model.
Figure 9 analyses the performance of the ensemble model through ROC and P-R plots, providing detailed numerical information on classification accuracy. In Figure 9(a), the ROC graph represents the performance of the TPR as a function of the FPR for each class, with the AUC shown in the legend. The AUC values for the different classes are Class 0: 0.98, Class 1: 0.98, Class 2: 0.97, Class 3: 0.98, Class 4: 0.99, and Class 5: 0.98. These values demonstrate a high discriminative ability of the model, with the curves approaching the upper left corner of the graph, indicating a low FPR and a high TPR. The highest AUC value of 0.99 for Class 4 highlights the excellent performance of the model on this specific class. Figure 9(b) shows the P-R curve, where the horizontal axis represents Recall and the vertical axis Precision, two metrics that measure, respectively, the sensitivity of the model in correctly detecting true positives and its accuracy in limiting false positives. Also in this chart, the curves show high values for both Precision and Recall, with uniform performance between classes remaining close to the upper right corner. This representation highlights the ability of the ensemble model to maintain high accuracies even for high values of Recall, which is particularly significant in multiclass contexts. The combined analysis of AUC, Precision, and Recall confirms that the model is highly performing and well balanced in correctly classifying instances while reducing both false negatives and false positives.
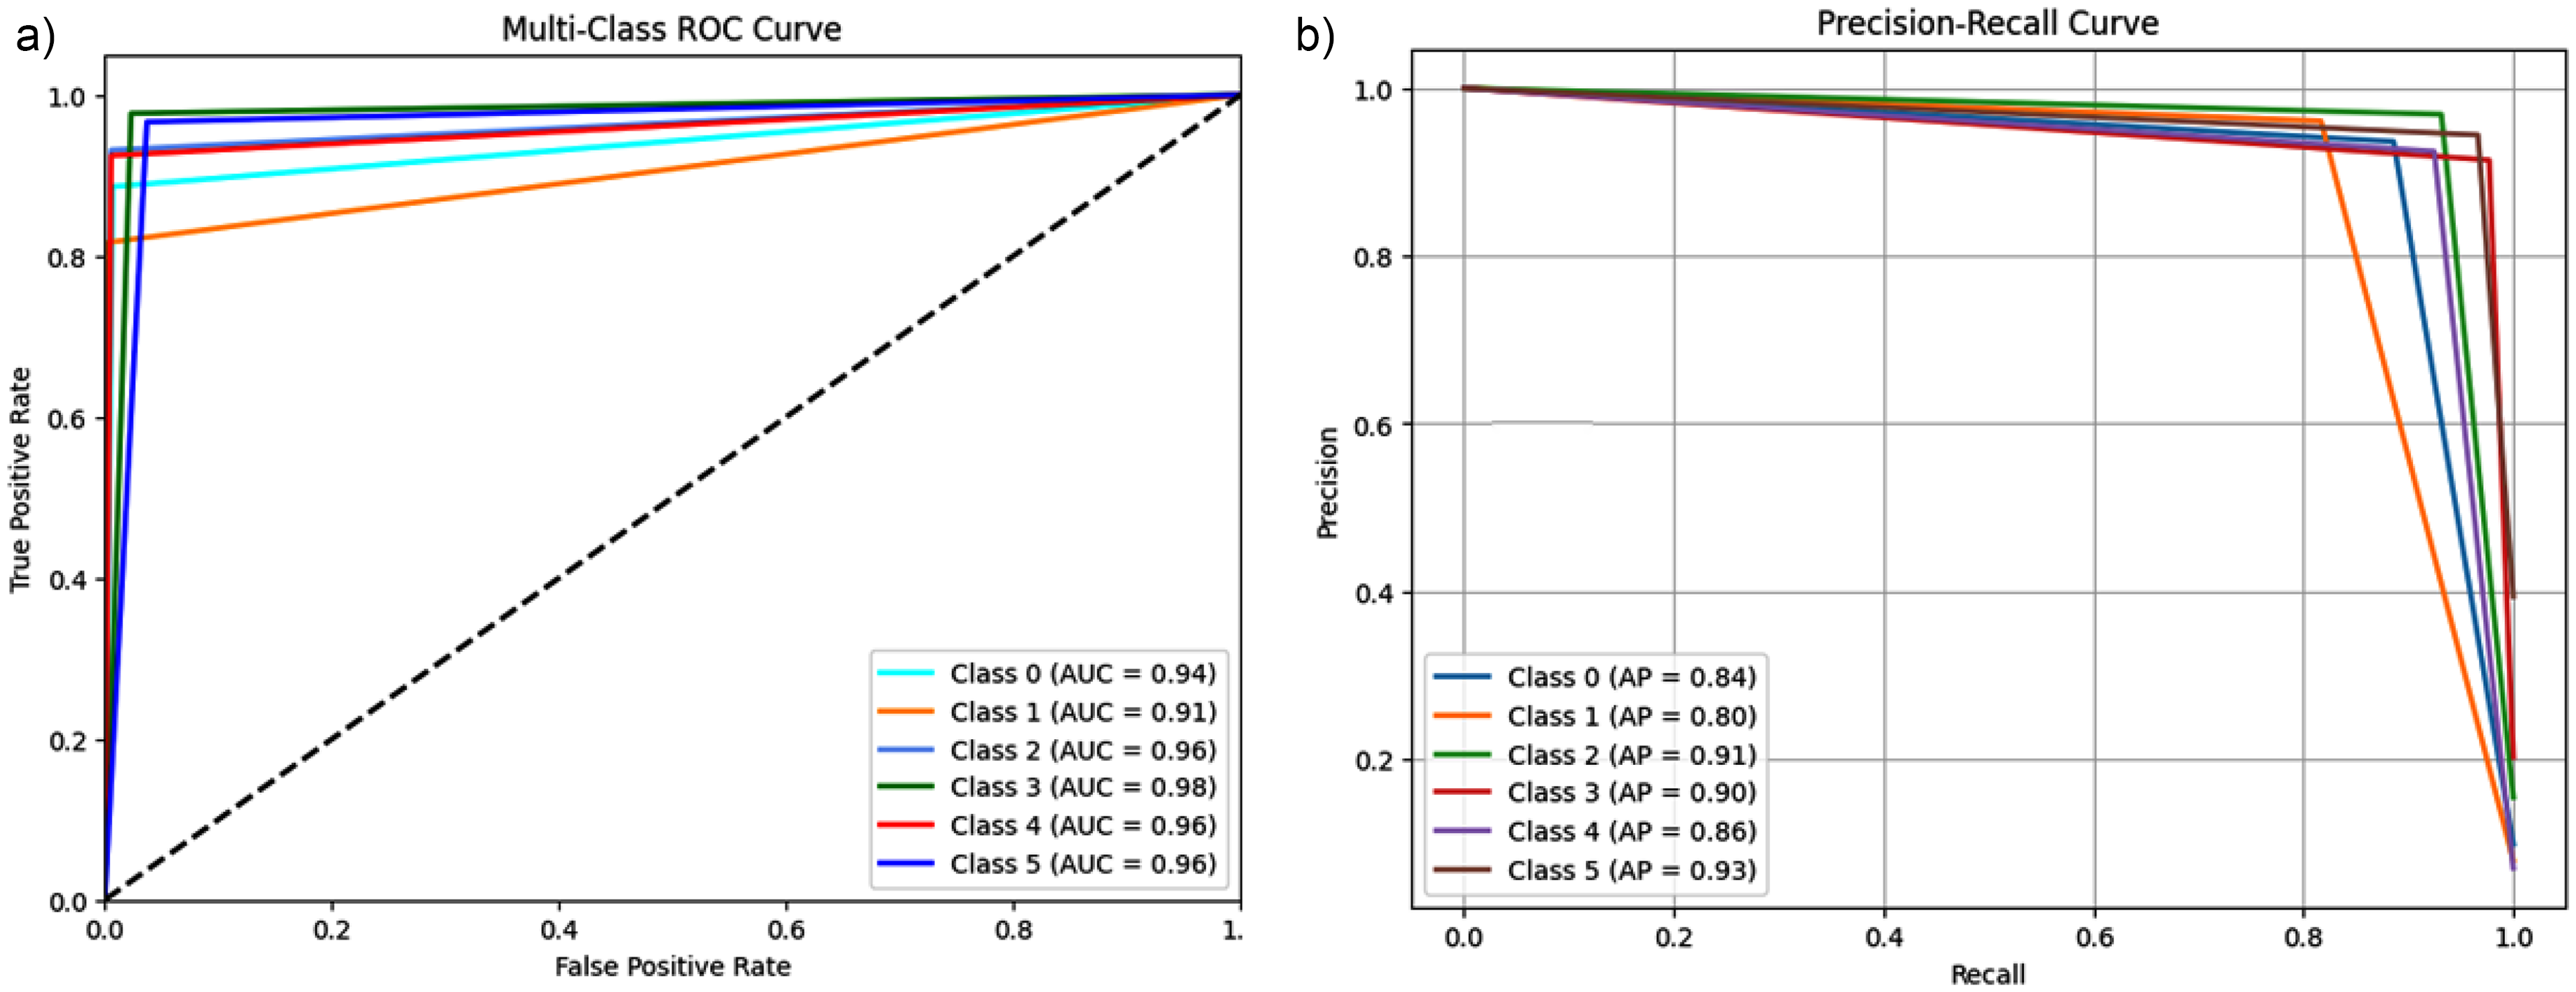
(a) ROC of ensemble model, (b) P-R curve of ensemble model.
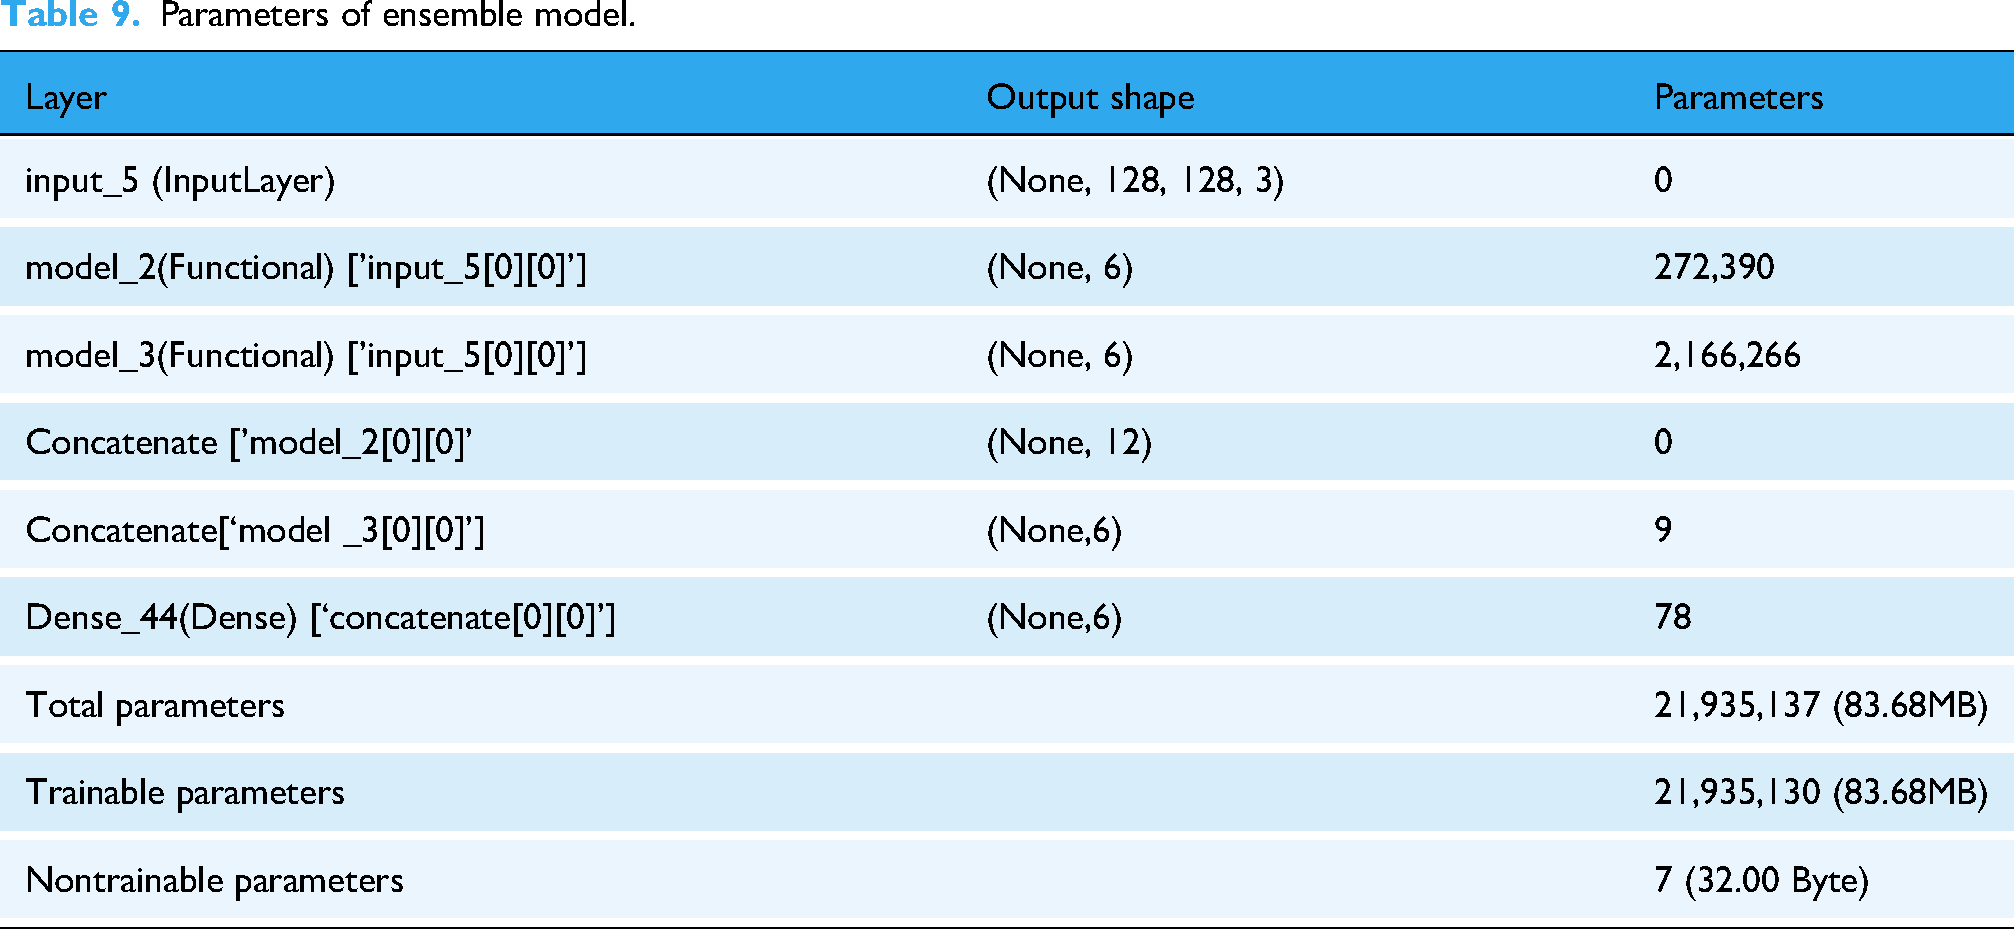
Table 9 describes the architecture and parameters of the ensemble model in detail. The first layer, named input_5, is an input layer that receives RGB images of size 128 × 128 × 3 as input. This layer has no trainable parameters, as evidenced by the value of 0. The model includes two functional subnetworks, model_2, and model_3, which process the input independently. Layer model_2, which is directly connected to input_5, produces an output of form (None, 6) and has a total of 272390 parameters. Similarly, layer model_3, also connected to input layer input_5, generates a form output (None, 6) and has a total of 2166266 parameters. The two outputs generated by the functional subnetworks are subsequently concatenated into a single output layer with a resulting form of (None, 12); this operation does not add any parameters to the model, as it is a purely combinatorial operation. The concatenated output is then passed to a dense layer, named Dense_44, which generates the final output of the model with a form of (None, 6) and incorporates 78 trainable parameters. Overall, the ensemble model has 21935137 total parameters, of which 21935130 are trainable, while only 7 are untrainable. These parameters in total occupy 83.68 MB of memory, with only the nontrainable parameters requiring a negligible 32 Byte space. This architecture shows a highly complex and parameterized model, optimized for high performance in a multiclass classification task.
Parameters of ensemble model.
Comparison with state-of-the-art models
This section compares the proposed models with existing approaches in the literature to assess their relative performance (see Table 10). The proposed model was compared with major architectures in the literature for Mpox skin lesion classification, evaluating key metrics such as accuracy, precision, recall, F1-score, and AUC. Several studies have adopted pretrained CNNs, such as ResNet50 and VGG16, for binary classification of Mpox lesions, achieving accuracies between 76% and 85%.23,48 However, these models show limitations in their ability to generalize to multiclass tasks, especially when they have to distinguish lesions with similar visual patterns. Other approaches have employed ensemble learning techniques to improve classification robustness, achieving superior results compared to single models, but remaining constrained to four-class datasets and without taking advantage of architectures optimized for learning complex relationships between classes.19,21 In this context, our model introduces two distinctive elements: the use of the Mpox Skin Lesion Dataset v2.0 dataset with six classes, which allows it to address the challenge of multiclass classification with a wider variety of lesions, and the adoption of a transformer-based architecture based on modified ViT, which improves discriminability between visually similar skin conditions by exploiting self-attention to capture long-range spatial relationships.27,30 This approach achieved an accuracy of 93.03%, with precision, recall, and F1-score above 92% and an AUC of 94.33%, results that significantly exceed those reported in previous studies based on CNN or conventional model ensembles.18,19,23,27,48 Compared with DenseNet-201, which had obtained an F1-score of 89.61% for the four-class classification, our model showed better handling of multiclass complexity, with an F1-score above 92%. 49 The high AUC value confirms the effectiveness of our architecture in distinguishing between closely related classes, filling a gap left by previous studies that had focused on binary classifications or with a limited number of classes.19,22 This result demonstrates that the use of transformer-based models represents a significant advance in the automated classification of Mpox skin lesions, overcoming the limitations of traditional CNNs in dealing with complex, multiclass problems.
Performance comparison of proposed work with other reported works.

Strength and limitations
This study presents a comprehensive evaluation of ML and DL models for the classification of Mpox and related skin conditions, addressing critical gaps in previous research. Unlike previous studies that focused primarily on binary (2 classes) or limited multiclass (4 classes) classification, this work introduces a six-class classification framework that more accurately reflects real-world clinical challenges. By distinguishing Mpox from similar dermatologic conditions (varicella, measles, cowpox, HFMD, and healthy skin), this approach improves diagnostic accuracy, reducing the risk of misclassification and delayed treatment. From the tested models, ViT showed superior performance with 93.03% accuracy.
However, ViT also has some limitations, including high computational demand, dependence on large labeled datasets, and limited interpretability, which may limit its use in resource-limited settings. To address these limitations and further improve diagnostic reliability, this study introduced an ensemble model that combines ViT and ConvMixer predictions. This hybrid approach exploits the strengths of both architectures, where ViT effectively captures global patterns, while ConvMixer excels at extracting fine-grained local features.
Conclusion and future research
Among the models evaluated, ViT demonstrated superior performance, achieving 93.03% accuracy, 93.10% precision, 93.03% recall, 92.97% F1-score, and 94.33% AUC. Compared with traditional CNN-based architectures such as VGG16 and ResNet50, which have reported accuracy values of less than 85%, ViT's self-attention mechanism enables effective global feature extraction, making it particularly suitable for distinguishing skin conditions with subtle visual differences. In addition, its robustness to variations in lesion appearance contributes to its high generalization ability.
The ensemble model demonstrated more consistent performance across all lesion classes, reducing errors related to model-specific weaknesses, such as ViT's sensitivity to hyperparameters and ConvMixer's longer training time. The high AUC values, ranging from 90% to 96% for ViT and reaching 98% for ConvMixer, further highlight the discriminative power of these models in identifying Mpox cases with high accuracy. In contrast, traditional ML models (e.g., LR and KNN) have shown lower accuracy and sensitivity, particularly when it comes to distinguishing complex or visually similar conditions, reinforcing the necessity of advanced DL architectures for precise skin lesion classification.
The main strengths of this study lie in its ability to address the limitations of previous classification models of Mpox by implementing a more complex and clinically relevant six-class classification task that provides a broader and more accurate representation of real-world dermatologic challenges. Unlike previous studies that relied on binary or four-class classification, the proposed framework ensures a more nuanced differentiation between Mpox and other visually similar conditions, thus reducing the risks of misclassification. The integration of ML and DL models, with a focus on more advanced architectures such as ViT and ConvMixer, enables in-depth performance comparisons, demonstrating the superiority of attention-based models over traditional CNN-based approaches. The development of an ensemble model, which combines the global pattern recognition capabilities of ViT with the fine-grained feature extraction of ConvMixer, further improves the accuracy and robustness of classification. In addition, the use of the updated Mpox Skin Lesion Dataset v2.0, which includes a diverse and representative set of images, contributes to the generalizability of the model, ensuring that it can be effectively applied to various real-world cases. From a clinical perspective, the study underscores the practical utility of AI-driven diagnostic tools, particularly in resource-limited settings where laboratory confirmation of Mpox and related diseases may not always be readily available. By providing an accurate, automated, and scalable diagnostic approach, this research has the potential to significantly improve early diagnosis, patient management, and outbreak control strategies.
Despite promising results, this study has some limitations that deserve further investigation. A key limitation is the computational complexity of transform-based architectures such as ViT, which require significant computational and memory resources, making real-time implementation difficult in low-resource settings. Furthermore, although the dataset used in this study represents a significant improvement over previous versions, it remains relatively small in size, especially in terms of clinical variability. Future research should focus on expanding the dataset with a larger and more diverse set of real-world clinical images to improve the robustness and generalization of the model. Another critical limitation is the lack of interpretability of DL models, particularly transformers, which may hinder their adoption in clinical settings where explainability is critical to medical decision-making. To address this issue, future work should explore explainable AI techniques, such as Grad-CAM or attention visualization, to provide greater transparency in model predictions. In addition, although this study demonstrated the effectiveness of ensemble models, further optimizations could be explored by combining CNN-based architectures, transformers, and hybrid attention to balance accuracy and computational efficiency. Future research should also investigate the integration of federated learning techniques to improve generalization of models across multiple institutions while ensuring data privacy. Finally, to confirm the practical applicability of this approach, the proposed models should be validated using real-world clinical data from different patient populations, ensuring that performance remains consistent across different demographics and healthcare settings.
Footnotes
Acknowledgements
The authors are grateful to their respective Institutions/Universities for the cooperation and support rendered. The authors extend their appreciation to Taif University, Saudi Arabia for supporting this work through project number (TU-DSPP-2024-20).
Ethical consideration
The nature of this article does not require any ethical approval.
Author contributions
MP and FB: formal analysis, methodology, and writing—original draft; AQA, AKS, HBS, LT, BB, SMB, LST, and MY: validation, data curation, and writing—original draft; RKM: conceptualization, supervision, and writing—review and editing.
Funding
The authors disclosed receipt of the following financial support for the research, authorship, and/or publication of this article: This research was funded by Taif University, Saudi Arabia, Project No. (TU-DSPP-2024-20).
Declaration of conflicting interests
The authors declared no potential conflicts of interest with respect to the research, authorship, and/or publication of this article.
Guarantor:
MP and FB.