
Abstract
Objective
To develop an explainable lightweight skin disease high-precision classification model that can be deployed to the mobile terminal.
Methods
In this study, we present HI-MViT, a lightweight network for explainable skin disease classification based on Modified MobileViT. HI-MViT is mainly composed of ordinary convolution, Improved-MV2, MobileViT block, global pooling, and fully connected layers. Improved-MV2 uses the combination of shortcut and depth classifiable convolution to substantially decrease the amount of computation while ensuring the efficient implementation of information interaction and memory. The MobileViT block can efficiently encode local and global information. In addition, semantic feature dimensionality reduction visualization and class activation mapping visualization methods are used for HI-MViT to further understand the attention area of the model when learning skin lesion images.
Results
The International Skin Imaging Collaboration has assembled and made available the ISIC series dataset. Experiments using the HI-MViT model on the ISIC-2018 dataset achieved scores of 0.931, 0.932, 0.961, and 0.977 on F1-Score, Accuracy, Average Precision (AP), and area under the curve (AUC). Compared with the top five algorithms of ISIC-2018 Task 3, Marco's average F1-Score, AP, and AUC have increased by 6.9%, 6.8%, and 0.8% compared with the suboptimal performance model. Compared with ConvNeXt, the most competitive convolutional neural network architecture, our model is 5.0%, 3.4%, 2.3%, and 2.2% higher in F1-Score, Accuracy, AP, and AUC, respectively. The experiments on the ISIC-2017 dataset also achieved excellent results, and all indicators were better than the top five algorithms of ISIC-2017 Task 3. Using the trained model to test on the PH2 dataset, an excellent performance score is obtained, which shows that it has good generalization performance.
Conclusions
The skin disease classification model HI-MViT proposed in this article shows excellent classification performance and generalization performance in experiments. It demonstrates how the classification outcomes can be applied to dermatologists’ computer-assisted diagnostics, enabling medical professionals to classify various dermoscopic images more rapidly and reliably.
Keywords
Introduction
Dermatosis is a common disease, frequently occurring disease in medicine. The World Health Organization once said that skin diseases will be the most common disease in human history in the 21st century, with the highest morbidity rate and the highest disability rate. About 30% to 70% of people of different races and ages in the world suffer from skin diseases. 1 Dermatologists employ dermoscopy, a noninvasive skin imaging method, to aid in diagnosis. 2 Although qualified human experts can correctly identify a substantial proportion of dermoscopic images with an accuracy of 80%, it requires considerable time and work to do so. 3 Therefore, research that uses computer-aided diagnosis methods to categorize images of skin illnesses is extremely significant.
The traditional method of classifying skin disease images is based on a series of processes including preprocessing, lesion extraction, and feature extraction. 4 First, use effective methods such as asymmetrical, border, color, diameter Rule, Menzie's rule, or seven-point checklist to extract features from skin lesion images, and then use various machine learning methods such as eXtreme gradient boosting, decision tree, or support vector machine to classify hand-designed features. 5 Because the traditional method relies heavily on the quantity and quality of manually designed features, it cannot be used for more types of skin lesion image classification, and cannot meet the classification requirements of higher accuracy. 6 Compared with traditional methods, methods based on convolutional neural networks (CNN) can learn meaningful features directly from data, Esteva et al.7 employed a CNN framework based on Inception-V3 to train a skin disease classification model with an accuracy rate of 71.2% and verified that the algorithm was capable of categorization accuracy on par with 21 dermatologists who hold board certification. Duman et al. 8 propose a novel ensemble method that combines various advantages of several existing CNN models to deal with large-scale imbalanced datasets. By using the weighted aggregation method, the accuracy score is improved by 5% to 10%, compared with the state-of-the-art, the average sensitivity and area under the curve (AUC) values are 0.825 and 0.923, respectively, ranking second. Compared with traditional methods, the classification of images of skin diseases has been improved using CNN-based techniques. The following difficulties still exist in the more effective categorization of skin lesions because of the uniqueness of skin disease images: (1) The dermoscopic image only contains a small portion of the skin lesion region; the majority of the space is taken up by normal tissues or other unimportant details, which could skew the findings of the recognition process. (2) The classification process is more challenging and it is challenging to acquire reliable findings due to the similarities between classes and differences within classes of skin lesions. 9 Figure 1 shows images of three skin diseases: melanocytic nevi, melanoma, and actinic keratosis. It is evident that while various types of dermoscopic images may share geometric shapes or colors, the same type of dermoscopic images may have stark visual contrasts, which would negatively impact the model's capacity to generalize.
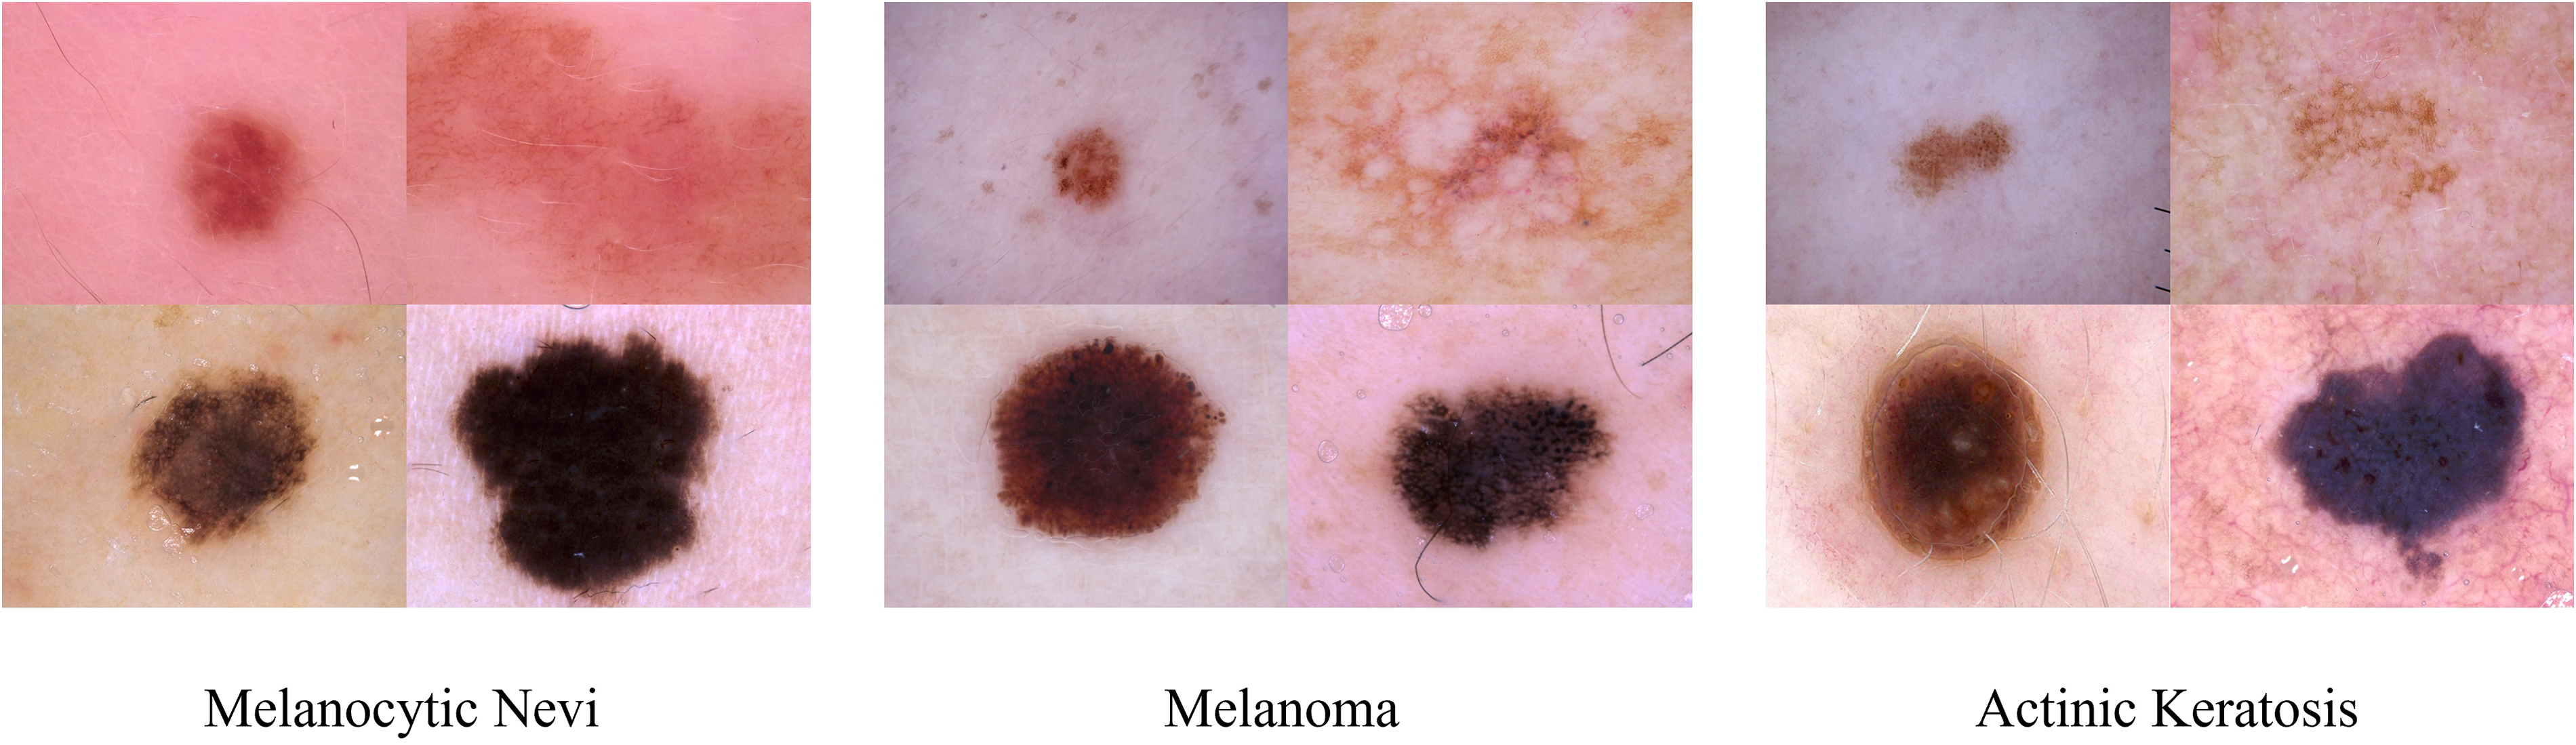
Dermoscopy images of melanocytic nevi, melanoma, and actinic keratosis.
For these factors, it is typically more challenging to categorize images of skin lesions than it is to classify the objects and settings in natural images. As a result, better models must be created to improve the efficacy of the classification of skin lesions. In 2020, the Google team applied the Transformer 10 technology widely used in the field of natural language processing to the field of computer vision and proposed Vision Transformer 11 (ViT). This study has established a new standard for employing Transformer-based techniques to solve issues related to computer vision. Transformer-based techniques are currently being commonly applied in the area of medical image processing, significantly cutting down on time and labor expenses. Using the ISIC-2017 dataset, 12 Wang et al. 13 created the O-Net algorithm to categorize dermoscopy images. However, compared with the CNN-based lightweight model, ViT still has a big gap in terms of model parameters and inference speed, and it is very difficult to implement it on the mobile terminal. Sachin et al. 14 offered a lightweight general visualization Transformer for mobile devices as a solution to these problems, which is the first lightweight ViT work based on the performance of lightweight CNN networks. According to experimental findings, MobileViT outperforms MobileNetV3, CrossViT, and other nets on a wide range of tasks and datasets.
To better understand the development process and latest progress of skin lesion image classification technology, we review the relevant work of skin lesion image classification models based on deep learning15–28 in recent years in Table 1. It details the keywords, methods, data, modality, dermatology categories, and results of the relevant models.
Related work on image classification models for skin diseases based on deep learning.

AUC: area under the curve; CNN: convolutional neural networks.
Building on related work, we propose HI-MViT, a lightweight model for explainable skin disease classification and the goal is to model local and global information with fewer parameters to achieve fast and robust dermoscopic image classification performance on the mobile side. It uses MobileNet
29
and Vision Transformer hybrid architecture MobileViT as the basis, and innovatively designed the Improved-MV2 block to improve it, which can substantially scale back on the number of calculations and facilitate better landing on the mobile terminal. Experiments on the ISIC-2018 dataset
30
show that F1-Score, Accuracy, average precision (AP), and AUC have achieved excellent scores of 0.931, 0.932, 0.961, and 0.977, respectively. The following is a summary of this article's major contributions:
This study proposes an explainable skin disease classification lightweight model HI-MViT, which is mainly composed of ordinary convolution, Improved-MV2, MobileViT block, global pooling, and fully connected layers. The network is much more concentrated on the skin lesion area thanks to the Transformer's unique self-attention mechanism and global vision, which increases the classification accuracy of skin lesion images. The framework also inherits the lightweight and high efficiency of CNN. Innovatively proposed the Improved-MV2 block. The combination of the expansion layer, projection layer, and depthwise separable convolution uses a shortcut to drastically cut back on calculation while ensuring the efficient implementation of information interaction and memory. It is more suitable for the use of lightweight models and facilitates the implementation of models on mobile terminals. A large number of performance experiments and visualization experiments were conducted on the ISIC-2018 and ISIC-2017 skin lesion classification datasets released by the International Skin Imaging Collaboration to fully verify the superiority of the model. Under the same data processing and experimental conditions, HI-MViT achieved better performance than the selected existing mainstream classification models. At the same time, the trained model is tested on the PH2 dataset, and excellent classification performance is obtained, which proves that it has good generalization performance and robustness.
Methods
HI-MViT structure
The structure of the HI-MViT model proposed in this article is shown in Figure 2. Its purpose is to build a lightweight interpretable deep learning model that can be deployed on the mobile terminal for accurate and fast classification of skin lesion images. HI-MViT is mainly composed of ordinary convolution, Improved-MV2, MobileViT block, global pooling, and fully connected layers. Blocks marked with a down arrow represent the need for downsampling.

Network structure diagram of HI-MViT.
MobileViT block
The MobileViT block can efficiently encode local and global information. In MobileViT block, for a given input tensor
We extend 
As a result the fact that

In MobileViT block, every pixel is aware of other pixels. Gray grids represent pixels, and black grids composed of gray grids represent patches. Through the transformer, the red pixel processes the blue pixel at the corresponding point in other patches. This enables the red pixel to encode information from every pixel in the image since the blue pixel has previously used convolution to encode data from nearby pixels.
Improved-MV2 block
The Improved-MV2 block executes a depthwise separable convolution operation, a 1 × 1 expansion layer to raise the total amount of channels, and a 1 × 1 projection layer to return the channel count to its initial size. 31 The skip connection is established between two bottleneck layers with fewer channels, which is just the opposite of the residual structure in ResNet. 32 Figure 4(a) depicts the structure when stride = 1 and Figure 4(b) depicts the architecture when stride = 2.

Improved-MV2 block structure: (a) stride = 1 and (b) stride = 2.
Depthwise convolution and pointwise convolution are the two components of Depthwise Separable Convolution (DSC). Every convolution kernel is convolved with a different dimension of the input feature matrix in a standard convolution. Every channel of the input feature map is given its convolution kernel using depthwise convolution, which then combines the outcomes of all the convolution kernels to get the final output. Typically, a depthwise convolution layer comes after a pointwise convolution operation. Pointwise convolution is a 1 × 1 convolution that executes channel merging on the feature map produced by depthwise convolution in addition to allowing users to flexibly modify the number of output channels. Therefore, DSC not only has the advantages of fewer parameters and faster calculation but also overcomes the disadvantage of lack of information interaction in group convolution. 33 Ordinary convolution is contrasted with depthwise convolution and pointwise convolution in Figure 5.

Comparison of ordinary convolution with depthwise convolution and pointwise convolution.
Through this modification to the feature map's channel splitting, DSC has decreased the total amount of parameters, which has improved the network's lightweight. Every spot in the spatial position of the related feature map will undergo a convolution operation under the assumption that the input feature map is
Therefore, for N convolutions, the total calculation amount is:
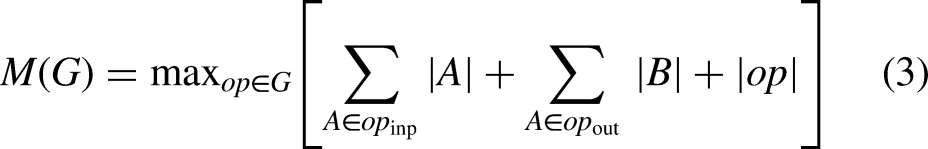
Improved-MV2 additionally permits memory-efficient implementation, which is crucial for the use of lightweight models on mobile terminals. Create a directed acyclic computational hypergraph G with nodes representing tensors of intermediate calculations and edges representing operations to use a typical efficient inference implementation in PyTorch. The overall amount of tensors that must be maintained in memory is kept as low as possible by scheduling computations accordingly. As a whole, all reasonable calculation sequences are searched and the smallest one is selected. The specific operation process is shown in equation 2:


For HI-MViT, 

HI-MViT parameter
Table 2 displays the details of the configuration of the HI-MViT model's specific network parameters, where d stands for the input dimension of the transformer layer in the MobileViT block.
Specific network parameter configuration information of the HI-MViT model.

Evaluation metrics
Precision, Recall, Accuracy, F1-Score, AP, and AUC were chosen as the network assessment metrics to thoroughly assess the efficacy of the HI-MViT classification algorithm,
36
and the definitions are shown in equations (7) to (12):


The percentage of the real positive class (
Results
Datasets
This is a diagnostic study aimed at developing and validating the diagnostic accuracy of our proposed model. In this article, we conduct a series of experiments on the HI-MViT model on two skin lesion classification challenge datasets (i.e. ISIC-2017 and ISIC-2018 datasets) and a publicly available dermoscopic image dataset (i.e. PH2 dataset). Among them, the PH2 dataset is only used in the test, mainly for the evaluation of the generalization performance of the model. The 10,015 dermoscopic images for the HAM10000 dataset were collected over a 20-year period from 2 different sites: Dermatology at the Medical University of Vienna, Austria, and the Cliff Rosendahl Skin Cancer Clinic in Queensland, Australia. Inclusion criteria: (1) included dermoscopic images were of sufficient quality for analysis and diagnosis and (2) ensure that each image has appropriate clinical diagnostic labeling, as well as labeling of dermoscopic features (e.g. pigment grid, structure, blood vessels, etc.). Exclusion criteria: (1) exclusion of poor-quality images, which may include blurred, overexposed, or underexposed images and (2) unmarked or poorly marked images are excluded.
The ISIC series datasets are aggregated and published by the International Skin Imaging Collaboration. The ISIC-2017 classification dataset consists of 2750 dermoscopic images, which are divided into 3 different categories: melanoma, seborrheic keratosis, and nevus. The HAM10000 dataset, also known as the ISIC-2018 skin lesion classification dataset, has 10,015 dermoscopic images with a size of 600 × 450 pixels that span 7 main categories of skin illnesses. The PH2 dataset is released by the Dermatology Service of Pedro Hispano Hospital, which contains 200 dermatoscopy images with a resolution of 768 × 560 pixels, consisting of 80 nevus, 80 atypical nevus, and 40 melanomas images. In the ISIC-2018 dataset, we divided the dataset into training set, verification set, and test set according to the ratio of 6:3:1. Then, data enhancement is performed on the divided training set, and the data processing process is strictly controlled to prevent data leakage. While on the ISIC-2017 dataset, we use the division ratio specified in the official challenge. Table 3 displays the dataset's precise distribution of data.
The specific data distribution of ISIC-2017, ISIC-2018, and PH2 classification datasets.

When preprocessing the dermoscopic images in the dataset, we first resize the images to 256 × 256 and use CenterCrop to return a center-cropped image. 38 Then a variety of data enhancement methods are used, including random rotation ([−90◦,+90◦]), random vertical flip, random horizontal flip, adding noise, adjusting contrast, and normalization to prevent excessive model training. As it is known, deep networks are data-hungry and a lot of augmentation methods have been applied with dermoscopy images to increase reliability and robustness.39–41 Therefore, an increased number of data has been used in this work to improve the performance of the proposed approach. Specifically, we use the min–max normalization method to adjust the pixel values of the image to the range [0,1]. Intensities in medical images are usually inhomogeneous and significantly affect the performance of automated image analysis techniques. Although various normalization algorithms with different image types have been applied to obtain high performance in the literature,42,43 they can cause increased computational costs. At the same time, we also randomly add Gaussian noise and Salt noise to the image to achieve data enhancement. Although generally Gaussian or speckle type of noise occurs in dermoscopy images, they may include different types of noise that can be caused by different reasons such as imaging techniques or environmental factors. 44
Figure 6 shows schematic diagrams of images of different categories in the ISIC-2017, ISIC-2018, and PH2 classification datasets.

Schematic diagram of images of different categories in (a) ISIC-2017, (b) ISIC-2018, and (c) PH2 classification datasets.
Implementation details
The deep learning framework PyTorch 1.12.1 was employed to implement each experiment in this article. The hardware device used in the experiment is a computer equipped with four GeForce RTX 2080 Ti GPUs and 64GB of memory, and the operating system is Ubuntu 20.04.3. After a series of detailed comparative experiments, this article selects the AdamW 45 adaptive learning rate optimization algorithm as the optimizer and the loss function selects the cross entropy function. The weight decay is adjusted to 1E-2, the batch size is 16, and the epoch is 50. The starting learning rate has been set to 0.0002. On the ImageNet 21 K dataset, 27 the network is pretrained in this study, and the pretraining variables are obtained. After loading it into the HI-MViT model, transfer learning is performed to ensure the best results for skin disease image classification. Specifically, first, migrate the pretrained parameters obtained on ImageNet, modify the number of categories of the classification head, and then use the dermoscopic image to fine-tune some parameters of the model until convergence.
To fairly compare the performance of different methods and reduce the impact of chance and error, we conducted a five-fold cross-validation on ISIC-2017 and ISIC-2018, and showed the average performance and standard deviation.
Comparative experiment
We conducted comparative experiments on the ISIC-2018 dataset to explore the hyperparameter selection in model design and verify the effectiveness of Improved-MV2.
Hyperparameter optimization
We designed comparative experiments to select training hyperparameters, including optimizers and loss functions, for the HI-MViT skin lesion image classification model. In the comparison experiment, the optimizer selected the current mainstream and cutting-edge adaptive learning rate optimization algorithms: NAdam, AdaMax, 46 and AdamW, and the loss function selected FocalLoss, 47 PolyLoss, 48 and Cross Entropy Loss function. The classification results of the HI-MViT structure employing various optimizers and loss functions are shown in Table 4.
Classification performance of the HI-MViT model using different optimizers and loss functions.

AUC: area under the curve.
Table 4 shows that the HI-MViT model performs best when AdamW is employed as the optimizer and Cross Entropy Loss is utilized as the loss function. The scores of Precision, Recall, F1-Score, Accuracy, AP, and AUC are respectively 0.931, 0.932, 0.931, 0.932, 0.961, and 0.977, respectively. Compared with the AdamW + FocalLoss combination and AdamW + PolyLoss combination with the second-best performance, the indicators have increased by 5.8%, 5.4%, 5.9%, 5.4%, 3.1%, and 0.9%, respectively.
To more intuitively understand the changes in indicators during training and verification, Figure 7 depicts the accuracy and loss values’ tendency as the number of model training and verification steps grows for various optimizer and loss function configurations. Figure 7 shows that the optimal performance combination AdamW + Cross Entropy Loss can learn the features contained in the images in the dataset in fewer epochs during training and verification. And it converges quickly under the premise of ensuring stability.

Accuracy and loss value changes of different optimizers and loss function combinations during training and verification.
Improved-MV2 validity verification
We performed comparison studies on the Improved-MV2 block in the HI-MViT architecture suggested in this article to confirm its efficacy. We set the activation functions in the original MV2 block to ReLU6, Gaussian error linear unit (GELU), 49 exponential linear unit (ELU), 50 leaky rectified linear unit (Leaky ReLU), 51 parametric rectified linear unit (PReLU) 52 respectively. The pooling layer of the model is divided into two methods of global average pooling 53 and global maximum pooling 54 for discussion and experimentation. The comparative experimental findings on the ISIC-2018 classification dataset are displayed in Table 5.
Validation of the Improved-MV2 block on the ISIC-2018 classification dataset.

AUC: area under the curve; ELU: exponential linear unit; GELU: Gaussian error linear unit; PRLU: parametric rectified linear unit.
Table 5's results indicate that HI-MViT performs highest in the experiment when the pooling layer is adjusted to Global Average Pooling, with grades of 0.931 for F1-Score, 0.932 for Accuracy, 0.961 for AP, and 0.977 for AUC. Compared with the original MobileViT model (using ReLU6), the improvements are 5.1%, 5%, 7.4%, and 2.5%, respectively. Compared with the suboptimal model in the performance of each indicator, it has increased by 4.9%, 4.5%, 3.1%, and 0.8%, respectively. When HI-MViT uses global average pooling, F1-Score, Accuracy, AP, and AUC are increased by 1.1%, 1.2%, 1.3%, and 0.7%, respectively, compared with the case of using global maximum pooling. It can be known from the above conclusions that the innovative design of the Improved-MV2 block is very effective in the HI-MViT model.
Classification results on the ISIC-2018 dataset
Compared with mainstream algorithms
The comparative evaluation between this model and the currently mainstream methods on the ISIC-2018 classification dataset is shown in Table 6, including ResNeXt, 55 ShuffleNet, 56 MnasNet, 57 MobileNet, 31 MobileOne, 58 ConvNeXt, 59 Vision Transformer, 11 Swin Transformer, 60 MetaFormer, 61 EfficientFormer, 62 MaxViT, 63 and FasterViT. 64
Performance comparison between the method in this article and the mainstream models on the ISIC-2018 dataset.

AUC: area under the curve; CNN: convolutional neural networks.
As can be seen from the results in Table 6, compared with the mainstream classification models based on CNN or Transformer selected in the experiment, our scheme performs better in various evaluation indicators. Compared with ConvNeXt, the most competitive CNN architecture, our model is 5.0%, 3.4%, 2.3% and 2.2% higher in F1-Score, Accuracy, AP and AUC, respectively. Compared with FasterViT, which has the highest AUC score in the Transformer architecture, the F1-Score, Accuracy, and AP of HI-MViT have increased by 5.2%, 5.0%, and 3.4%, respectively. The experimental results fully demonstrate that the method proposed in this article has excellent performance in the comprehensive performance of skin lesion classification.
Compared with the top algorithms in the ISIC-2018 classification challenge
The top five algorithms on ISIC-2018 Task 3 are contrasted with the results of the HI-MViT model provided in this article in Table 7. These algorithms do not use additional data. The deep learning strategies adopted by the top five teams are the deep neural network (DCNN) integrated model 65 (Team-1), CNN-based model 66 (Team-2), Xception + DenseNet121 hybrid model 67 (Team-3), Inceptionv4 + ResNet-152 +DenseNet-161 Hybrid model 68 (Team-4), and improved DCNN model 69 (Team-5).
Performance comparison between the method in this article and the top five algorithms of the ISIC-2018 classification challenge.

AUC: area under the curve; BCC: basal cell carcinoma; CNN: convolutional neural networks; DF: dermatofibroma; MEL: melanoma.
Table 7 shows that, except for BCC and NV, the HI-MViT framework yields the best results for all evaluation markers across the five categories. The AUC score on BCC is only 0.1% lower than the best performance, which is 0.991, but it improves the best performance obtained by the model of Team-1 by 2.3% and 1.6% on F1-Score and AP. Although only 0.3% below the best performance in NV's AP score, 0.978, HI-MViT improves the best performance obtained by the model of Team-1 F1-Score and AP by 2.1% and 0.3%. Taking AKIEC as an example, compared with the top five algorithms, HI-MViT performed suboptimally in terms of various indicators. F1-Score, AP, and AUC increased by 18.9%, 16.6%, and 0.9%, respectively, achieving 0.939, 0.993, and 1 good results. Macro-average can more comprehensively measure the classification performance of the model in each category. The scores of F1-Score, AP, and AUC of HI-MViT are 0.899, 0.960, and 0.986, respectively. Compared with the models of Team-1 and Team-2 with suboptimal performance, they have improved by 6.9%, 6.8%, and 0.8%.
Figure 8 shows the grouped histogram of the evaluation indicators of the HI-MViT model on the ISIC-2018 test set. The model performs optimally overall for classifying images of different skin diseases. especially the AUC, which is the gold standard for evaluation, and the scores of each category are close to full marks.

Grouped histogram of evaluation indicators of HI-MViT model on ISIC-2018 test set.
To understand the classification effect of HI-MViT for different categories in the ISIC-2018 dataset more clearly and intuitively, Figure 9 shows the confusion matrix of HI-MViT on the test set. By observing Figure 9, it can be found that there are relatively more misjudgments in the NV and MEL categories, which may be caused by the high similarity images between the NV and MEL categories.

Confusion matrix of HI-MViT on the ISIC-2018 test set.
The PR and ROC curves of HI-MViT on the test set are displayed in Figure 10. AP is a representation of the region beneath the PR curve. The PR curve implies improved model performance when it is more inclined to the upper right. The square value under the ROC curve, or AUC, is a measure of how well the algorithm generalizes. The nearer the ROC curve is to the (0,1) point, the greater. It can be observed that in the PR curve, the AP values of AKIEC, DF, and VASC are the highest, which are 0.993, 0.992, and 1, respectively. In the ROC curve, the curves of AKIEC, BCC, DF, and VASC are all very close to the (0,1) point, and the AUC values are 1, 0.991, 1, and 1, respectively.
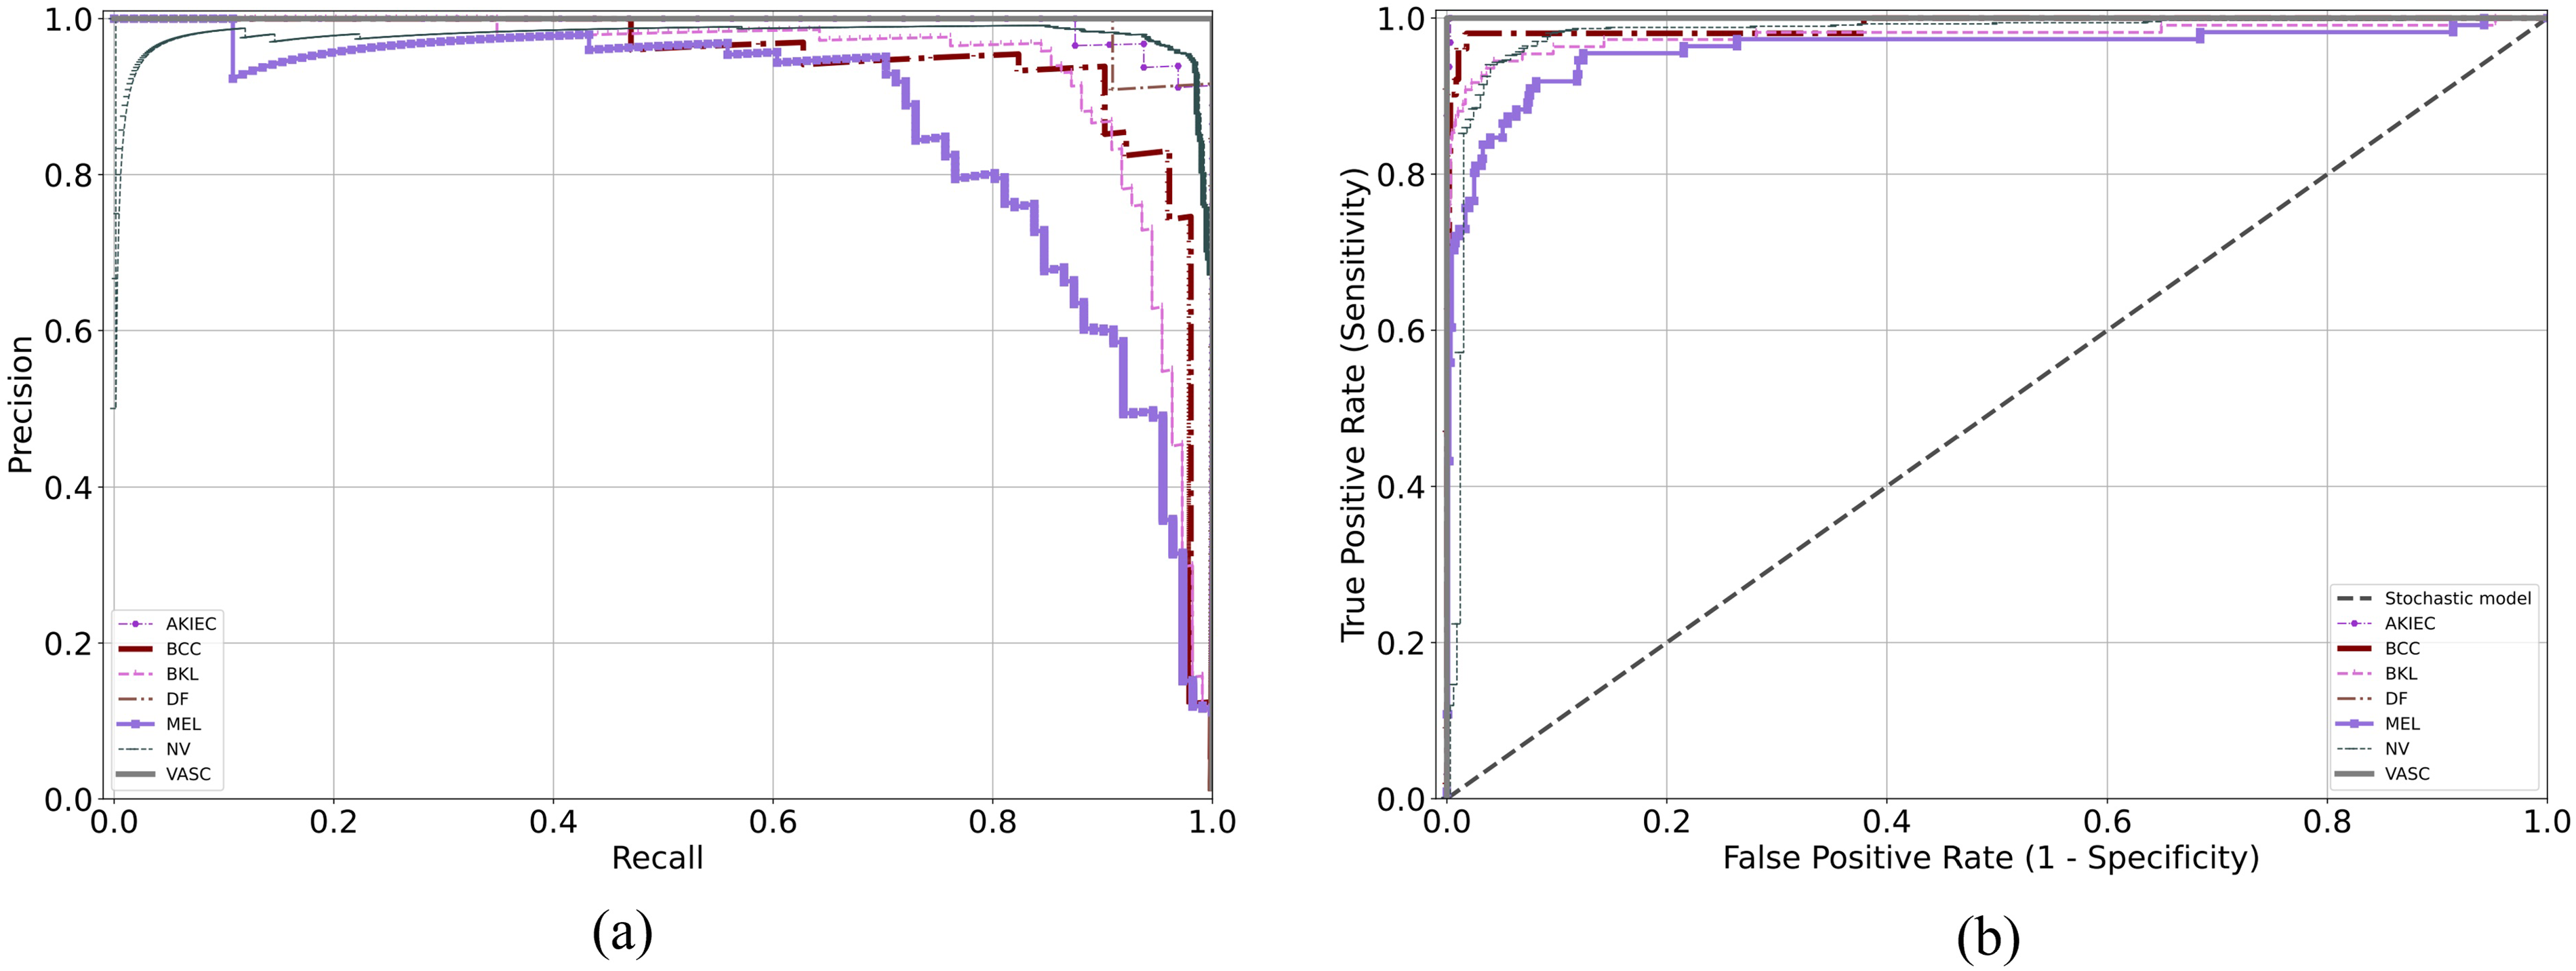
(a) Precision-recall curve and (b) ROC curve of HI-MViT on the ISIC-2018 test set. ROC: receiver operating characteristic.
Compared with the latest skin lesion classification models
To better represent the good performance of HI-MViT in skin lesion classification, we selected six latest networks70–75 specifically designed for skin lesion classification for comparison, and the results are shown in Table 8. As can be seen, Table 8 covers CNN-based, Transformer-based, and lightweight networks, and in comparison, our method has a better accuracy score on the ISIC-2018 dataset.
Performance comparison between the method in this article and the latest skin lesion classification models on the ISIC-2018 dataset.
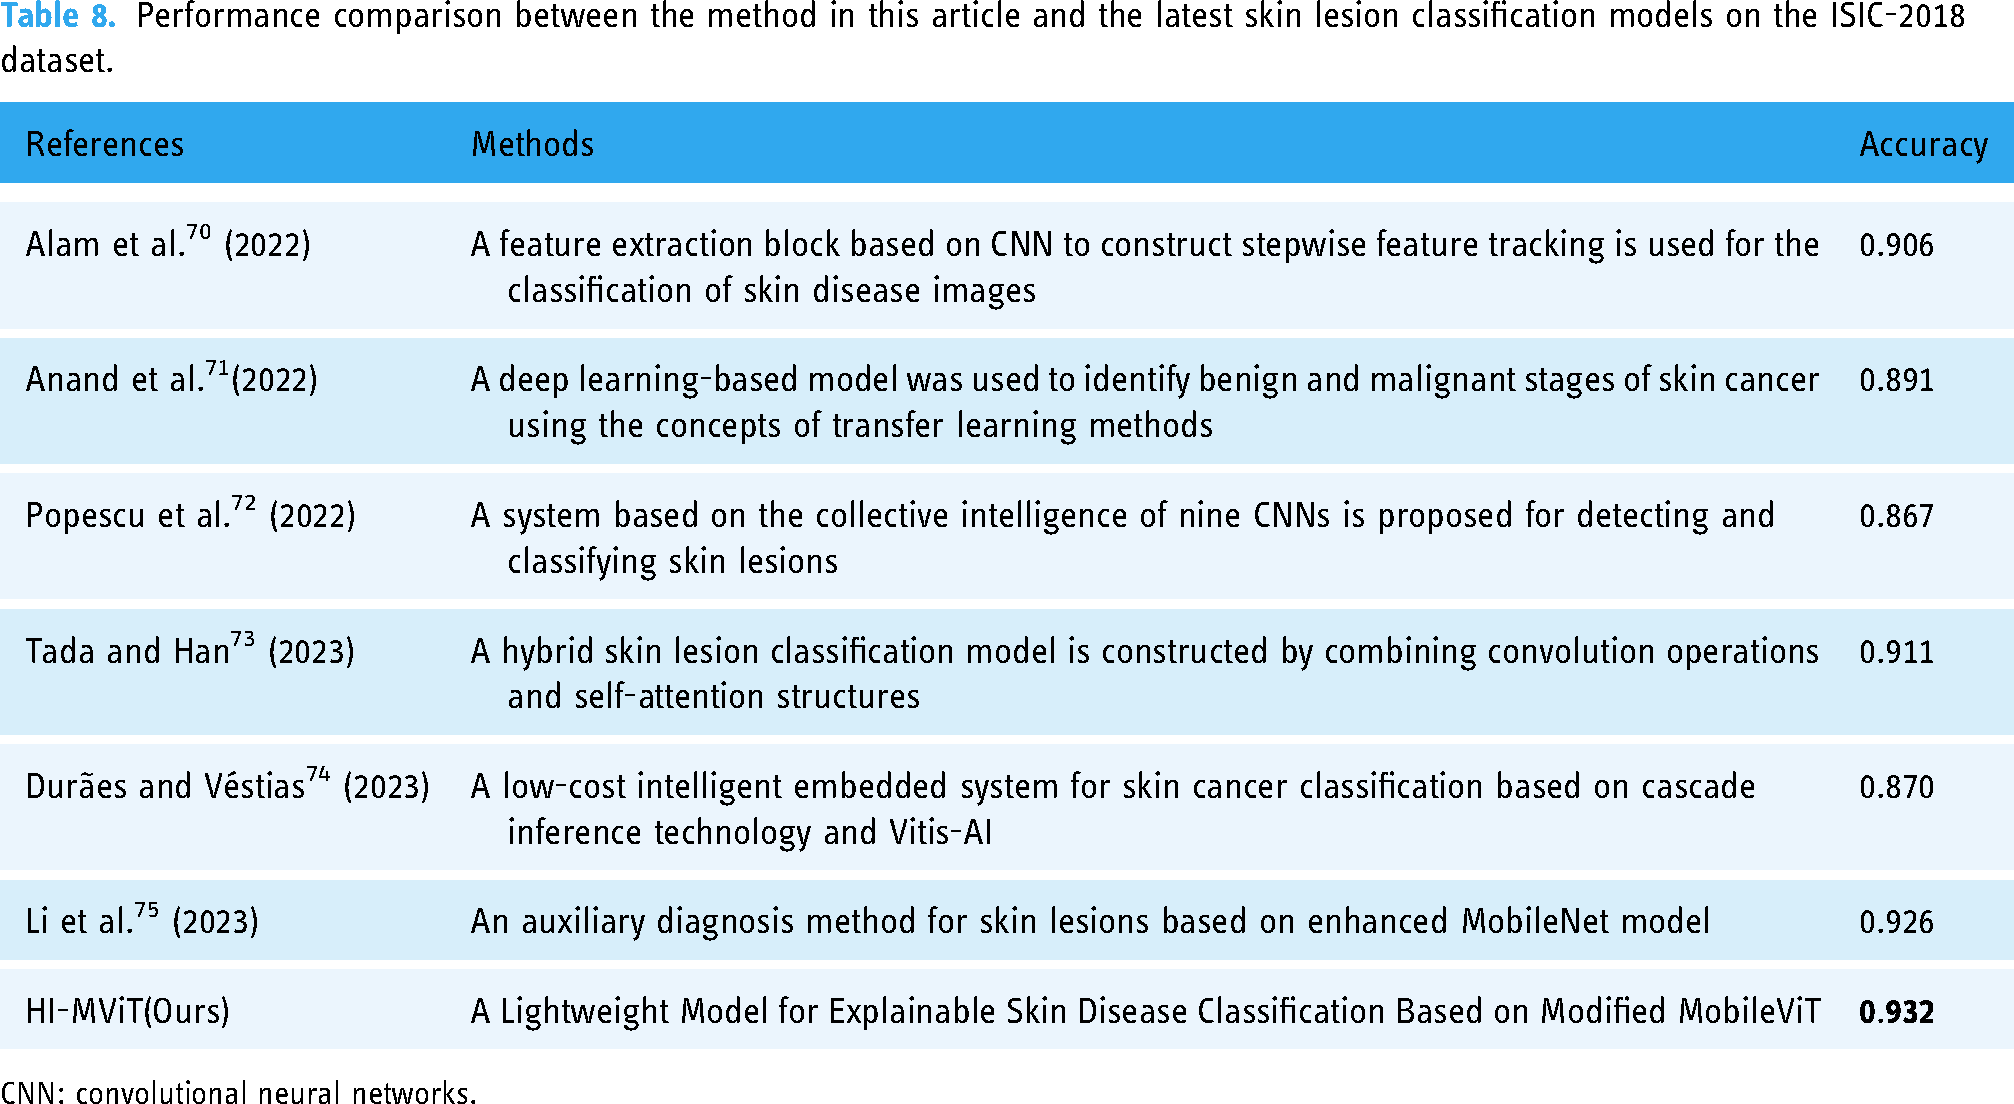
CNN: convolutional neural networks.
Visualization of the learned embeddings and CAMs
To enable the model to concentrate more on the skin lesion area and enhance the classification effect, HI-MViT employs the Transformer-based multihead self-attention method to acquire the global representation of the image. To verify this, we used two methods to visually compare the ConvNeXt and HI-MViT: one is to visualize the dimensionality reduction of semantic features in the test set, and the other is to visualize the Class Activation Map (CAM).
First, we use a linear dimensionality reduction method (PCA 76 ) and two nonlinear dimensionality reduction methods (t-SNE 77 and UMAP 78 ) to visualize the features learned by a specific layer of the model. Figure 11 shows the results of ConvNeXt and HI-MViT using PCA, t-SNE, and UMAP on the ISIC-2018 test set for dimensionality reduction visualization, which can reflect the ability of the model to distinguish different types of samples. It can be seen from Figure 10 that among the three dimensionality reduction visualization algorithms, the visualization results of HI-MViT are better than ConvNeXt, with smaller intraclass distances, larger interclass distances, clear cluster boundaries, and fewer mixed samples. This reflects that HI-MViT has a stronger ability to discriminate images of skin lesions.

Dimensionality reduction visualization results of ConvNeXt and HI-MViT on the ISIC-2018 test set.
CAM visualizes which pixels of an image a neural network pays attention to when predicting a class. In this article, six different CAM methods are used to generate class activation heatmaps for skin disease images, including GradCAM, 79 Guided Grad-CAM, GradCAM++, 80 AblationCAM, 81 ScoreCAM, 82 and EigenCAM. 83 Among them, Guided Grad-CAM can generate high-resolution fine-grained thermal maps. Figure 12 shows the class activation heatmap obtained by HI-MViT on different categories of skin disease images in the ISIC-2018 dataset. It can be observed that there are differences in the specific subregions and concentrations that different CAM algorithms focus on HI-MViT, but they all focus on the attention region representing the location of the skin lesion when performing classification, rather than the surrounding normal skin tissue and hair tissue.

HI-MViT class activation heatmap on the ISIC-2018 dataset.
Visualization of effective receptive fields and attention maps
Different from traditional CNN's process of gradually expanding the receptive field by using larger convolution kernels and deeper convolutions, the Transformer-based HI-MViT model we propose can obtain global representation earlier by modeling long-distance dependencies. We visualize the average effective receptive field at different stages of the ConvNeXt and HI-MViT models, 84 and the results are shown in Figure 13. It can be observed that compared with the convolutional neural network, the global information interaction capability of HI-MViT can help the feature extractor to quickly establish a global receptive field, thereby achieving faster context understanding.

Effective receptive field visualization at different stages of ConvNeXt and HI-MViT.
To better understand the change of attention of HI-MViT in the process of classifying skin lesion images, we visualized the attention maps of different stages 85 of the model on ISIC-2018, as shown in Figure 14. It can be observed that HI-MViT can model the global information through the self-attention mechanism, thereby improving the ability to identify skin lesions from the global receptive field. At the same time, with the deepening of the module, the attention will gradually focus on the skin lesion area, so the lesion type of the skin lesion area can be more accurately identified.

Visualization of HI-MViT's attention map at different stages on ISIC-2018.
Classification results on the ISIC-2017 dataset
Compared with mainstream algorithms
Table 9 shows the performance comparison between HI-MViT and mainstream classification models for skin lesion classification on the ISIC-2017 dataset. It can be seen that HI-MViT performs better in all indicators than other comparison models in Table 9. Compared with ConvNeXt, the master of the convolutional neural network, our method improves F1-Score, Accuracy, AP, and AUC by 7.6%, 7.4%, 8.8%, and 5.0%, respectively. In the Transformer architecture, EfficientFormer, which is also a lightweight network, is considered to be the most competitive method. Compared with its scores in F1-Score and AUC, HI-MViT increased by 4.3% and 1.9%, respectively, which reflects the strong performance of HI-MViT in skin lesion classification.
Performance comparison between the method in this article and the mainstream models on the ISIC-2017 dataset.

AUC: area under the curve; CNN: convolutional neural networks.
Compared with the top algorithms in the ISIC-2017 classification challenge
The effectiveness of the technique used in this article is contrasted with the top 5 algorithms used in ISIC-2017 Task 3 in Table 10. The deep learning strategies adopted by the top five teams are the ResNet ensemble model 86 (Team-1), CNN-based model 87 (Team-2), transfer learning-based model 88 (Team-3), deep residual network model 89 (Team-4), and multitask deep learning model 90 (Team-5). The strategies outlined in this study have produced the best outcomes across all categories of evaluation metrics.
Performance comparison between the method in this article and the top five models of ISIC-2017 Task3.

AUC: area under the curve.
Figure 15 is a grouped histogram of the evaluation indicators of the HI-MViT model on the ISIC-2017 test set. The model's performance on every indication of each class can be observed to be fairly balanced, and its total performance is quite outstanding. At the same time, the weighted average AUC score as the ISIC-2017 challenge evaluation standard is 0.962. The Accuracy, AP, and AUC scores on the seborrheic keratosis category achieved good results of 0.933, 0.968, and 0.988, respectively.

Grouped histogram of evaluation indicators of HI-MViT model on ISIC-2017 test set.
The confusion matrix for the algorithm on the ISIC-2017 test set is shown in Figure 16, and the deviation between the real category and the predicted category can be seen. It can be seen that a part of nevus is misjudged as melanoma because the division of nevus species does not exist in the original dataset. To fully exploit the training potential of the dataset, we generally divide all the images not marked as melanoma and seborrheic keratosis into nevus for classification. Certain nevus images may be incorrectly assessed due to the similarities between classes and the variations within classes.

Confusion matrix of HI-MViT on the ISIC-2017 test set.
Figure 17 is the PR and ROC curves of the network in this article on the ISIC-2017 test set. It can be seen that in the PR curve, the overall trend of all categories is close to (1,1), which shows that the model is well-balanced between the two indicators of Precision and Recall. In the ROC curve, the inflection points of the three classifications are very close to (0,1), and the outstanding overall effectiveness of the model may be assessed based on the area under the curve, which is very near 1.

(a) Precision-recall curve and (b) ROC curve of HI-MViT on the ISIC-2017 test set. ROC: receiver operating characteristic.
Compared with the latest skin lesion classification models
Table 11 shows the accuracy scores of six networks specifically designed for skin lesion classification13,91–95 compared to our method on the ISIC-2017 dataset. Table 11 contains a variety of methods based on EfficientNet B3, CNN, Transformer, metaheuristic optimization algorithms, and noise label correction methods. It can be seen that our lightweight classification model HI-MViT obtains better accuracy performance.
Performance comparison between the method in this article and the latest skin lesion classification models on the ISIC-2017 dataset.

CNN: convolutional neural networks.
Visualization of the learned embeddings and CAMs
Figure 18 compares the results of semantic feature extraction and dimension reduction visualization of HI-MViT and ConvNeXt on the ISIC-2017 test set. It can be seen in the three dimensionality reduction visualization algorithms that there is the existence of the mixing of data points of different categories in ConvNeXt. The intercluster distribution distance of HI-MViT is far, the intracluster distribution is similar, the cluster boundary is clear, and the data is less mixed.

Dimensionality reduction visualization results of ConvNeXt and HI-MViT on the ISIC-2017 test set.
The CAM visualization results shown in Figure 19 allow us to more intuitively understand which pixels HI-MViT pays more attention to as the basis for classification when classifying the ISIC-2017 dataset. It can be seen that HI-MViT mainly focuses on the skin lesion area in the image, and does not pay too much attention to the surrounding skin tissue, which is also a prerequisite for ensuring accurate classification results.

HI-MViT class activation heatmap on the ISIC-2017 dataset.
Validate generalization performance on PH2 dataset
The generalization ability reflects the ability of the model to judge unknown data. A model with good generalization ability can make correct judgments when the data fluctuates. We used the model trained on ISIC-2017 to test on a skin disease dataset PH2 with an unknown distribution to verify the generalization effect of HI-MViT. Table 12 shows the test results of different mainstream classification models on the PH2 dataset.
The performance results of the trained model tested on the PH2 dataset.

AUC: area under the curve; CNN: convolutional neural networks.
Compared with the most competitive ConvNeXt and EfficientFormer, our method improves Accuracy by 3.9% and 1.7%, and AUC by 3.5% and 2.4%, respectively. Therefore, according to the experimental results shown in Table 12, it can be shown that HI-MViT has good model generalization performance and robustness, and can still maintain good classification performance in the face of unknown data and parameters.
Discussions
Using dermoscopic images, our technique successfully achieves high classification accuracy of skin lesion classifications. The F1-Score, Accuracy, AP, and AUC scores for experiments utilizing the HI-MViT skin disease image classification algorithm were 0.931, 0.932, 0.961, and 0.977, respectively. Compared with the top five algorithms of ISIC-2018 Task 3, the scores of Marco's average F1-Score, AP, and AUC of HI-MViT are 0.899, 0.960, and 0.986, respectively. The improvements were 6.9%, 6.8%, and 0.8% when compared to the second-best-performing model, respectively. This demonstrates the effectiveness of the skin disease classification methodology used in this study. Compared with FasterViT, which has the highest AUC score in the Transformer architecture, the F1-Score, Accuracy, and AP of HI-MViT have increased by 5.2%, 5.0%, and 3.4%, respectively. It can be seen that the HI-MViT findings have lower intraclass distances and higher interclass distances compared to ConvNeXt using the dimensionality reduction visualization method. This reflects that HI-MViT has a stronger ability to discriminate images of skin lesions. While performing classification findings, the model appears to focus more on the lesion site than on irrelevant skin tissue, according to explainable class-activation heatmaps. We also visualized the effective receptive field and attention map at different stages of HI-MViT, to more intuitively recognize the ability of HI-MViT to model local and global information. The performance experiment on the ISIC-2017 dataset also achieved excellent results, and the results of 0.898, 0.895, 0.947, and 0.962 were obtained on F1-Score, Accuracy, AP, and AUC, respectively. All indicators are better than the top five algorithms of ISIC-2017 Task 3. Using the trained model to test on the PH2 dataset, compared with the most competitive ConvNeXt and EfficientFormer, HI-MViT has improved Accuracy by 3.9% and 1.7%, and AUC has increased by 3.5% and 2.4%. This shows that HI-MViT has good generalization enough to face changes in data and parameters. Dermatologists can use the HI-MViT skin disease classification model's classification result as an evaluation index to aid in their diagnosis, which will enable them to more rapidly and accurately identify various dermoscopic images.
The International Skin Digital Imaging Society sponsors ISIC, a global organization devoted to skin cancer diagnosis (ISDIS). It sponsors the ISIC-2017 and ISIC-2018 Challenge, which focuses on the study and diagnosis of skin lesions. Task 3 is skin disease classification. 96 For the categorization of skin diseases, convolutional neural network-based structures have been employed in the majority of the studies that have been published to date. Alwakid et al. 97 classified skin lesions in images by using a convolutional neural network system and a modified version of ResNet50. The HAM10000 dataset's seven skin cancer cases with uneven samples were used in the analysis. The F1-Score is 0.86, the average accuracy is 0.86, the precision is 0.84, the recall rate is 0.86, and so on. Ali et al. 98 applied transfer learning to pretrained ImageNet weights and improved convolutional neural networks to train EfficientNets B0-B7 on the HAM10000 dataset. With an F1-Score of 87% and a Top-1 accuracy of 87.91%, EfficientNet B4 was the best model. Chaturvedi et al. 99 employed a MobileNet-based model that had been pretrained on approximately 1.28 million images from the 2014 ImageNet Competition and then was refined via transfer learning on 10,015 dermoscopic images from the HAM10,000 dataset. The precision, recall, and F1-Score weighted average scores for the model employed in this study are 89%, 83%, and 83%, respectively, with an overall accuracy rate of 83.1% for the 7 classes in the dataset. The method in this article is superior to all the abovementioned models using the ISIC-2018 Task 3 dataset, with scores of 0.931, 0.932, 0.961, and 0.977 on F1-Score, Accuracy, AP, and AUC, respectively. Compared with the best-performing EfficientNet B4 in the above model, this article improves F1-Score and Accuracy by 6.1% and 5.29%, respectively.
Most significantly, this work makes use of the MobileViT-based explainable lightweight skin disease classification algorithm. Unlike earlier CNN-based techniques, HI-MViT combines the strengths of the Transformer and CNN: Transformer may offer spatial inductive bias, allowing it to eliminate positional bias. Also, the addition of CNN can hasten network convergence and improve the stability of the structure training process. The Transformer's self-attention mechanism can efficiently gather global information, and numerous heads can map it to various areas, strengthening the model's capacity for expression. 100
Table 4's hyperparameter comparison experiment findings show that each combination that chooses AdamW as the optimizer performs much better than the other unselected combinations. This is because AdamW, as a variant of Adam, can automatically adjust the learning rate without requiring too many parameter adjustments, reducing redundancy. It can also automatically adjust the weight decay coefficient to make the model more stable and avoid overfitting. In terms of the loss function, FocalLoss performs relatively poorly. The reason is that FocalLoss is very susceptible to noise interference, and since it values difficult samples more, wrong samples in the data may mislead the direction of model learning. 101 However, finding the ideal collection of hyperparameters for a given dataset is challenging due to the large adjustment costs of its hyperparameters.
The efficacy verification findings for the Improved-MV2 block on the ISIC-2018 classification dataset are displayed in Table 5. Compared with global max pooling, global average pooling performs better on the same model. This is because there is no need to optimize parameters and fixed input size in global average pooling, which can effectively avoid overfitting this layer. The spatial data is summarized using the global average pooling, which is more resistant to the spatial modification of the input.
After choosing the ISIC-2018 dataset's performance comparison of modern mainstream algorithms in Table 6, ViT performed poorly, even worse than some lightweight models whose parameters are much smaller than it. This is mainly due to the following reasons: (1) large data demand: Training Vision Transformer with less than 100 million images cannot get an optimal solution. It is hard to compile a dataset of more than 100 million images in the medical field of image analysis; occasionally, a medical image dataset only contains thousands or perhaps a few hundred images. (2) A large number of calculations and parameters: the global attention mechanism has a large number of calculations, and the calculation cost squared with the input length greatly limits its application on high-resolution input. (3) The number of stacked layers is limited, and there is an excessive smoothing problem. (4) The ViT model's training procedure is unstable and parameter sensitive. 102
From the confusion matrix in Figure 9, it can be found that different categories will misjudge each other. This is because, as shown in Figure 1, there are significant interclass similarities and intraclass differences in skin disease images, making it difficult to distinguish. Even dermatologists often require an extensive histopathological examination to draw concrete conclusions at the time of diagnosis. 103 On the other hand, due to the problem of unbalanced samples in the dataset, the number of samples of benign lesions is often dozens of times that of malignant lesions, which makes it easy for us to think of expanding the data to improve the classification performance of model. 104 To verify this conjecture, this article uses traditional methods such as flipping, rotating, and adding noise, to amplify the data. Among them, the samples of AKIEC, BCC, DF, and VASC are increased by 10 times, the samples of MEL and BKL are increased by 4 times, and the samples of data enhancement are resized as the training set. Surprisingly, the effect of the model trained using the dataset after data augmentation is even worse, and it does not achieve the effect of enhancing the classification ability of the model. This is due to the blind pursuit of the balance between classes and the abuse of data enhancement methods will introduce a large amount of additional noise, resulting in excessive differences between the training set and the test set. More specifically, incorrect data augmentation causes the original distribution of data to change, and the similarity of data distribution before and after data augmentation is low. 105 Therefore, before performing data amplification, it is necessary to ensure that the distribution of the data does not change significantly before and after the amplification, and at the same time ensure the quality of the new image generated by the data amplification.
Our research still has certain limitations. First always foremost, medical ethics mandate thorough testing of any new technology's effectiveness and security in clinical settings. Medical artificial intelligence that uses dermoscopic information to diagnose diseases carries some risks. Only dermatologists should use the study's findings as a guide. Secondly, to strengthen the model's capacity for generalization, our research solely relies on dermoscopic images and fails to incorporate any other categories of medical indicators into the model's design or training, including the patient's age, race, or location of the disease. 106 Third, there are very few case samples from people of color in the existing skin disease dataset, and the deep learning algorithm trained with the skin disease data of white people may not be able to better diagnose people of color. 107 Fourth, dermoscopic image-based deep learning approaches for skin disease diagnosis rely on their databases or public databases and lack external validation with a large number of samples, which is also the path of our future study. In light of the aforementioned issues, we will continue working with the Xiangya Hospital Dermatology Department to produce a dataset of dermoscopic images that contains more members of the yellow race, more skin conditions, and more metadata. And test our model in a real medical setting, taking into account the interobserver variance. At the same time, we plan to further optimize the HI-MViT model and deploy it to the mobile terminal, so that patients can easily and quickly identify whether the lesion area is malignant or not through the smart terminal device. Combined with the online diagnosis of dermatologists, it meets the public's requirements for timeliness and convenience of diagnosis.
Conclusions
In this study, we propose HI-MViT, a lightweight model for explainable skin disease classification based on Modified MobileViT. HI-MViT is mainly composed of ordinary convolution, Improved-MV2, MobileViT block, global pooling, and fully connected layers. Improved-MV2 uses the combination of shortcut and depth classifiable convolution to substantially scale back on the number of calculations while ensuring the efficient implementation of information interaction and memory. The MobileViT block can efficiently encode local and global information. In addition, HI-MViT uses semantic feature dimension reduction visualization and class activation mapping visualization methods to further understand the model's attention area when learning skin lesion images, and better improve the classification effect. We evaluate the performance of HI-MViT on ISIC-2017 and ISIC-2018 datasets. The results show that HI-MViT achieves superior performance scores on the ISIC-2017 and ISIC-2018 datasets compared to the comparison models. At the same time, the performance of testing on the PH2 dataset using the trained model is also very good, reflecting the good generalization performance of HI-MViT. In addition, the results of comparative experiments verify the effectiveness of the Improved-MV2 module in HI-MViT. As a future work, the performance of the proposed HI-MViT method can be compared with the performance of a capsule network because capsule-based networks can preserve spatial relationships of learned features and have been used in recently published works for image classification. 108 In the future, we plan to further cooperate with the Dermatology Department of Xiangya Hospital to build a more diversified image database of skin lesions and deploy HI-MViT to mobile devices to better provide patients with convenient medical services.
Footnotes
Acknowledgements
We would like to thank the ISIC-2017 and ISIC-2018 databases for providing valuable data.
Contributorship
YD, ZY, and YW conceived and supervised the study. ML, JL, and SL contributed to data collection and assembly. ZY, YD, and YG performed data analysis and interpretation. YD, PF, and CZ performed software, visualization, and validation. All authors contributed to writing the manuscript. All authors reviewed and approved the final manuscript.
Declaration of conflicting interests
The authors declared no potential conflicts of interest with respect to the research, authorship, and/or publication of this article.
Funding
The authors disclosed receipt of the following financial support for the research, authorship, and/or publication of this article: This work was supported by the grant from Hunan Provincial Natural Science Foundation of China (2021JJ41026).
Ethical approval
This study was an analysis of third-party de-identified publicly available databases with pre-existing ethical review board approval. All data were fully anonymized. All participants signed informed consent.
Guarantor
YJW.