
Abstract
Most studies evaluating the impact of electronic prescribing on prescribing safety have used comparatively weak study designs such as uncontrolled before-and-after studies. This study aimed to apply a more robust naturalistic stepped wedge study design to compare the prevalence and types of prescribing errors for electronic prescribing and paper prescribing. Data were collected weekly during a phased electronic prescribing implementation across 20 wards in a large English hospital. We identified 511 (7.8%) erroneous orders in 6523 paper medication orders, and 312 (6.0%) in 5237 electronic prescribing orders. Logistic regression suggested no statistically significant effect of electronic prescribing use or of study week; patient and ward had significant effects. Errors involving incorrect doses and illegible or incomplete orders were less common with electronic prescribing; those involving duplication, omission, incorrect drug and incorrect formulation were more common. Actions are needed to mitigate these error types; future studies should give more consideration to the effects of patient and ward.
Background
Medication errors are a global priority, 1 with prescribing errors in the hospital setting a significant concern. An international systematic review reported a median prescribing error rate of 7 per cent of medication orders, and 52 errors per 100 admissions. 2 Studies in the United Kingdom have reported prescribing errors in 7.5–14.7 per cent of inpatient medication orders.3–6 While not all such errors result in patient harm, all can create additional work and reduce patients’ confidence in their care. 4 Many initiatives have been proposed in an attempt to reduce such errors; in particular, electronic prescribing (eP) systems, allowing ordering or prescribing of medication electronically with varying degrees of clinical decision support, have been widely advocated to improve prescribing safety. 7
Studies of the impact of eP on prescribing errors generally demonstrate significant reductions in medication errors.8–11 However, the majority of studies have used comparatively weak study designs, such as uncontrolled before-and-after studies, rather than more robust designs such as a stepped wedge study 12 where different clinical areas change from paper to eP at different times. There are few UK studies, with the majority of studies originating in the United States. 13 Of the few UK studies published, most are in specific clinical areas.14–17 The English Government is committed to increasing use of eP in hospitals with its use expected to increase significantly in coming years.7,18–19 It is therefore important to understand the impact of introducing eP using a robust study design in the UK setting, where practices differ in some respects from those in the United States. In particular, UK hospitals do not mandate pharmacist verification of each medication order prior to any doses being administered, unit dose drug distribution is not used and there is greater use of ward stock and patients’ own medication supplies.
Our aim was to evaluate the impact of introducing eP on prescribing errors in an English teaching hospital, using a stepped wedge study design. Objectives were to compare the following for paper-based prescribing and eP: (1) prescribing error rates, (2) types of prescribing errors, (3) the number of doses given (or omitted) before erroneous medication orders were corrected and (4) to make recommendations as needed to improve prescribing safety in English hospitals in the context of eP.
Methods
Study design and setting
We studied a 500-bed London teaching hospital introducing eP as part of a wider implementation of a commercially available electronic health record and electronic ordering system (Cerner Millennium). The hospital implemented eP during 2016 in all 20 adult non-critical care inpatient areas during a phased roll-out according to the organisation’s eP implementation plan. We therefore used a naturalistic stepped wedge study design 20 based on the organisation’s implementation plan, rather than a cluster randomised stepped wedge design in which the order in which clinical areas implemented eP would have been randomised. 12
At the start of the study, all inpatient prescribing was paper-based. Prescribers hand-wrote medication orders on pre-formatted paper drug-charts. This involved writing the drug name, dose, route, frequency, time of administration and any additional instructions, and signing and dating each medication order. Following eP implementation, medication was ordered using the eP system by specifying these details using either drop-down menus or free text. Clinical decision support in operation at the time of the study comprised pre-programmed suggested dosing regimens (‘order sentences’) for commonly used drugs, lists of multiple orders typically required for particular situations (‘care sets’), patient-specific drug-allergy notifications and reminder alerts to encourage timely review of medication such as anti-infectives. For anti-infective medications, prescribers were also required to state its indication and duration. Drug interaction checking and dose range alerts were not in operation at the time of data collection.
Pharmacists provided a typical UK ward pharmacy service, with most wards visited by a pharmacist for 1–3 h each weekday. Pharmacists checked inpatient medication orders to ensure they were clear, legal and clinically appropriate. Standard practice was that any prescribing errors identified were rectified as needed, usually by contacting a prescriber.
Data collection
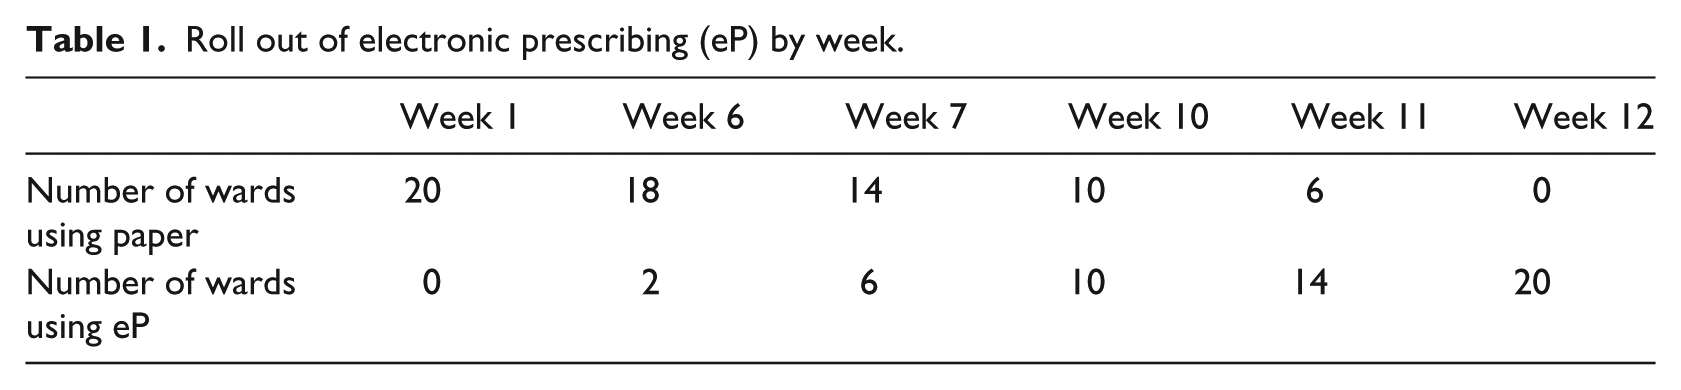
Following briefings in team meetings and via email, ward pharmacists were asked to collect data once a week on all included wards for 16 weeks from 13 January 2016 to 28 April 2016 inclusive. At the start of the data collection period, all prescribing was paper-based; data collection continued as wards went live with eP in five stages at weeks 6, 7, 10, 11 and 12 (Table 1).
Roll out of electronic prescribing (eP) by week.
Data were collected as part of pharmacists’ usual clinical duties; data were ideally collected on Wednesdays, but we allowed some flexibility for pharmacists to collect data on Tuesday or Thursday instead if necessary.
A data collection form was developed based on previous work; 4 this was given to pharmacists together with a written and verbal briefing. Data were recorded for all new ‘regular’ and ‘when required’ medication orders that had not already been screened by a pharmacist or discontinued. Drugs prescribed on supplementary paper drug charts, oxygen, ‘once only’ doses and continuous intravenous infusions were excluded to simplify data collection, as these types of medication order are less common and/or not consistently screened by pharmacists. Recorded data comprised the bed number, number of previously unscreened medication orders and, for any errors identified, brief details of drugs involved and the error type. As a measure of system resilience, we also asked pharmacists to record the number of doses given or omitted before the error was corrected. 4 Each individual prescribing error was classified into one of 13 mutually exclusive types; 4 each medication order could be associated with more than one error. If a patient was an inpatient for at least 2 consecutive weeks, they could be included more than once.
Sample size calculation
Based on 20 wards being included and 40 new medication orders being screened each day on each ward, 4 we estimated that we would be able to include 800 medication orders at each of the 16 weekly time points. If the baseline prescribing error rate was 10 per cent, 4 we anticipated identifying 100 prescribing errors at each time point. Based on a simple two group comparison with 6400 orders on each of paper and eP, this was calculated to be a sufficient sample to identify a reduction to 8.5 per cent as being statistically significant using the 95 per cent confidence interval (CI) for the difference between two proportions using alpha of 0.05 and beta of 0.8. 21
Definitions
A medication order was defined as one drug prescribed for an inpatient; there are usually multiple medication orders on each patient’s inpatient drug chart or electronic prescription. 4
The definition of a prescribing error was A prescribing error occurs when, as a result of a prescribing decision or prescription writing process, there is an unintentional, significant: reduction in the probability of treatment being timely and effective or increase in the risk of harm when compared to generally accepted practice.
22
This definition is accompanied by a list of situations that should be included and excluded as prescribing errors.
Analysis
Data were entered into an Excel database. Errors that did not meet the study definition of an error were removed; pharmacists’ classifications of error types were checked by the authors and recoded where necessary to ensure consistency of classification.
Univariate analysis was first conducted without taking into account clustering by patient or ward, and without controlling for time. The denominator for calculating the error rate was the number of newly written regular and ‘when required’ medication orders screened by ward pharmacists, plus any medication orders omitted.4,23 Ninety-five per cent CI were presented for prescribing error rates with non-overlapping CIs taken to indicate statistical significance. 24
We then fitted a multivariable three-level fixed effects generalised linear model (logistic) using STATA IC version 15. The dependent variable was whether or not each medication order was erroneous; independent variables were ‘paper versus eP’ (categorical) and ‘study week’ (linear). The three levels of hierarchy were to account for clustering of medication orders within patients and clustering of patients within wards. Covariates were removed from the model if the likelihood ratio test of the hierarchical model was not significant (p > 0.05). Random intercept logistic regression analysis confirmed there to be no significant effect of study week (p = 0.153) together with a non-significant likelihood ratio test. The fixed-effect variable ‘study week’ was therefore removed from the model. The final model contained only ‘paper versus eP’ as a fixed-effect variable. Types of error and number of doses given before error correction were summarised descriptively.
Ethical considerations
The study was approved locally as a service evaluation; ethics approval was not required. No patient or prescriber identifiers were recorded. Pharmacists’ names were recorded to permit follow up of any queries on data collection forms and then replaced with codes prior to analysis.
Results
Pre- and post-eP data were collected for 20 wards in total, by 39 different pharmacists. Overall, 241 data collection forms were completed of a possible of 320 (75%). Return rates by week ranged from 55 (week 11) to 95 per cent (weeks 2 and 4).
Prevalence of prescribing errors
A total of 11,586 newly written medication orders were reviewed by ward pharmacists during the study, of which 9184 (79.3%) were for regular medication and 2402 (20.7%) for ‘when required’. There were 174 prescribing omissions also identified, giving a total denominator of 11,760 for calculating the error rate. Of the 11,760 medication orders prescribed or omitted, 6523 (55.4%) were on paper and 5237 (44.5%) on eP. These relate to pharmacists reviewing charts for 4036 patients during the study period. There were 831 individual prescribing errors recorded in 823 (7.0%) of 11,760 medication orders, concerning 563 (13.9%) of 4036 patients.
Of the 6523 medication orders written on paper, 511 were erroneous, giving an error rate of 7.8 per cent (95% CI: 7.1%–8.5%); most erroneous orders had one error except for eight which had two errors. Of the 5237 eP orders, 312 were erroneous, giving an error rate of 6.0 per cent (95% CI: 5.4%–6.7%); all erroneous eP orders had only one error. The non-overlapping CIs suggest a significant difference, with a lower error rate for eP. Figure 1 presents prescribing error rates by weeks post-implementation on the ward concerned, suggesting no obvious learning effect in the 11 weeks following go-live.
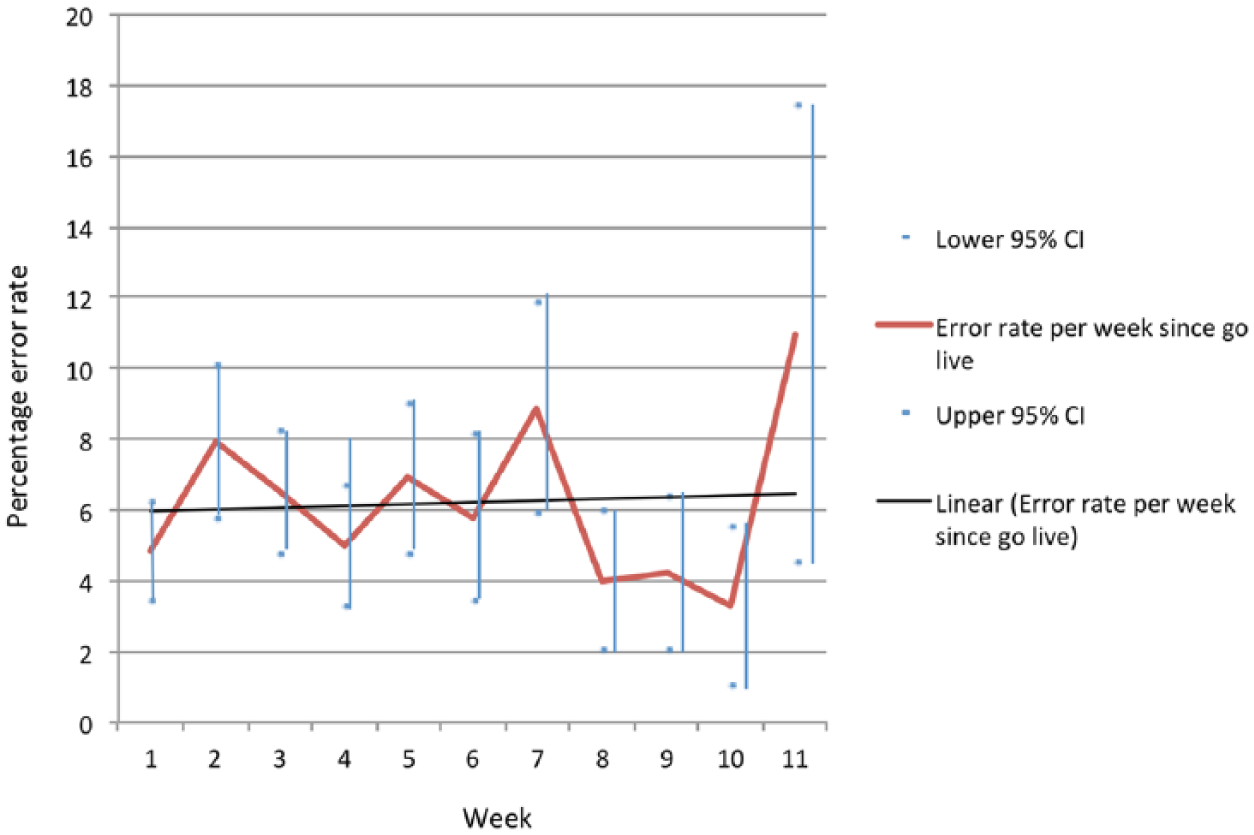
Prescribing error rates for electronic medication orders presented by weeks since electronic prescribing (eP) went live on the ward concerned.
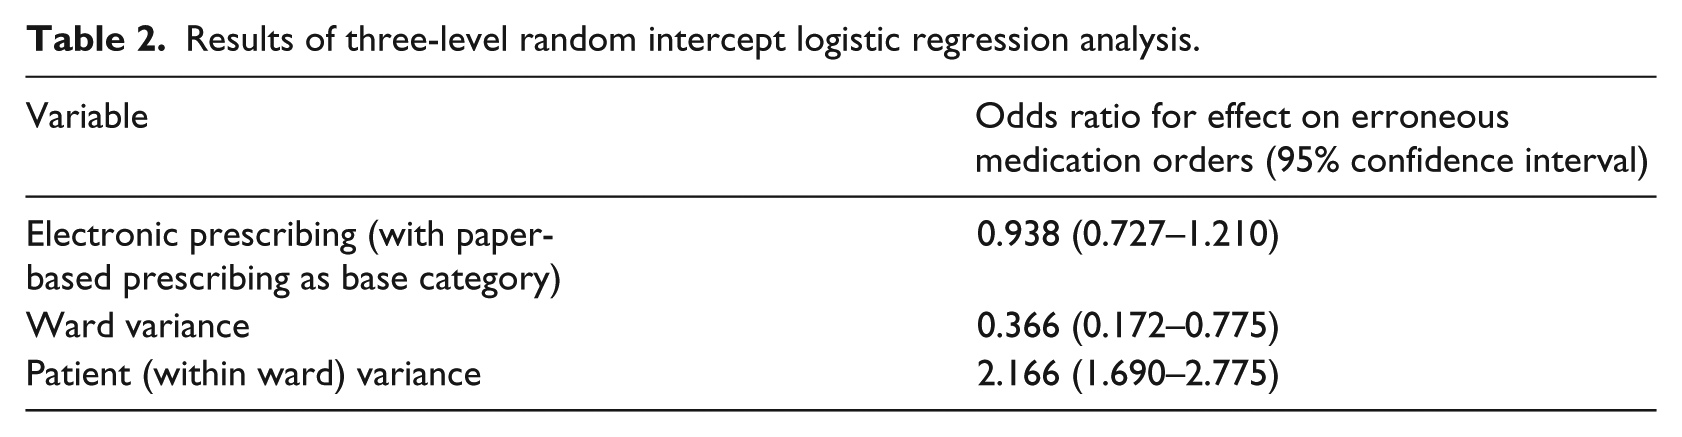
The final three-level random intercept model suggested no statistically significant effect of eP use once clustering by patient and ward was taken into account (odds ratio 0.938 eP versus paper; 95% CI: 0.727–1.210; p = 0.621). Ward and patient (clustered within ward) both had significant effects (Table 2).
Results of three-level random intercept logistic regression analysis.
A post hoc descriptive analysis of error rates by ward is presented in Figure 2, confirming that both error rates and the effect of eP varied by ward. The most dramatic error reductions associated with eP occurred on wards 1, 6, 10 and 19 which were day surgery, medical admissions, orthopaedics and neurology. The most dramatic increases occurred on wards 11, 14 and 15 which were gastroenterology, medicine for the elderly and acute stroke, respectively. The intraclass correlation coefficients were 0.063 (95% CI: 0.031–0.124) for ward and 0.435 (95% CI: 0.376–0.496) for patient (within ward), suggesting that the majority of this variation occurred at the patient level.
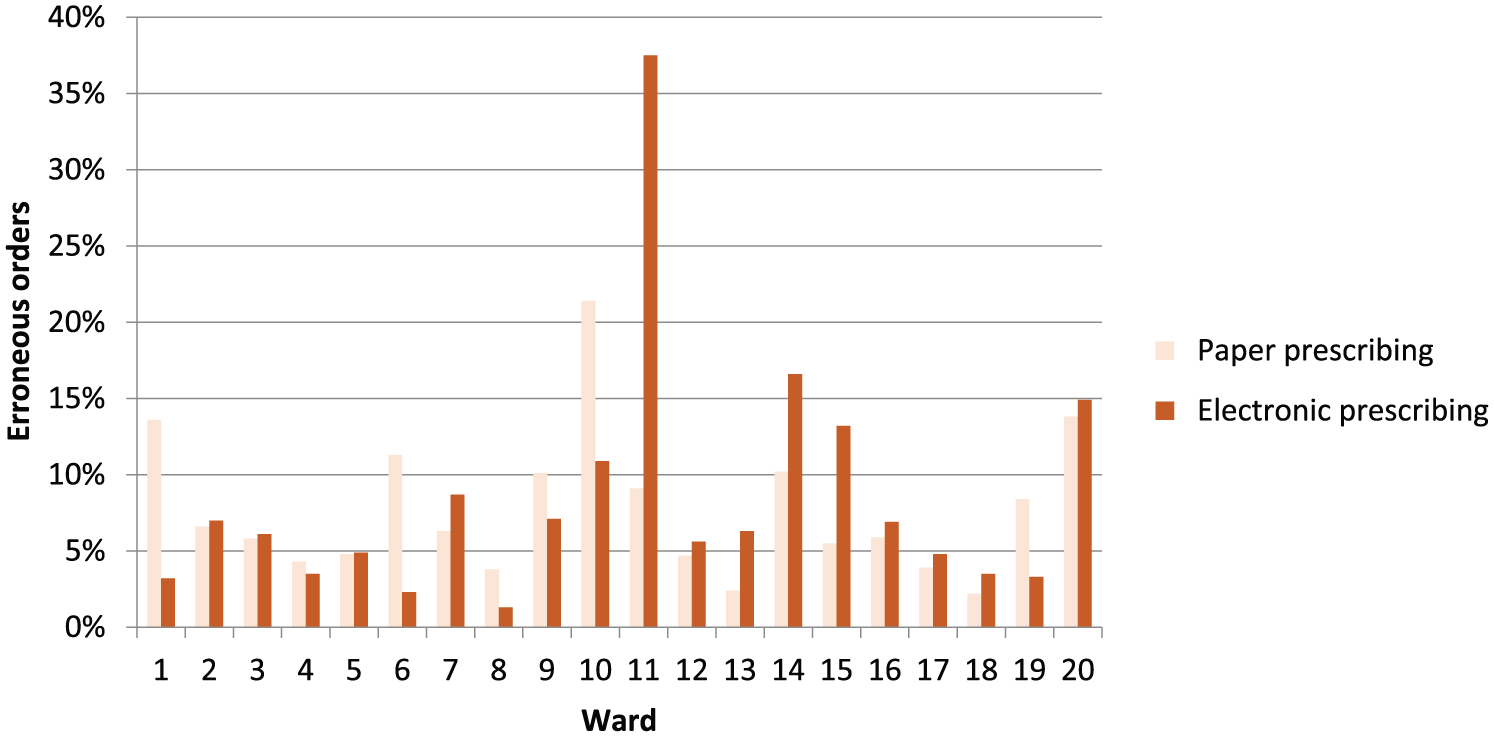
Analysis by ward.
Types of prescribing errors
A breakdown of the different error types for paper and eP is given in Figure 3, suggesting increases in duplication of the same drug, omission, incorrect drug and incorrect formulation with eP, and decreases in errors involving drugs that were not indicated or contraindicated, incorrect doses, illegible and incomplete orders with eP. Prevalence of other types of errors was similar.
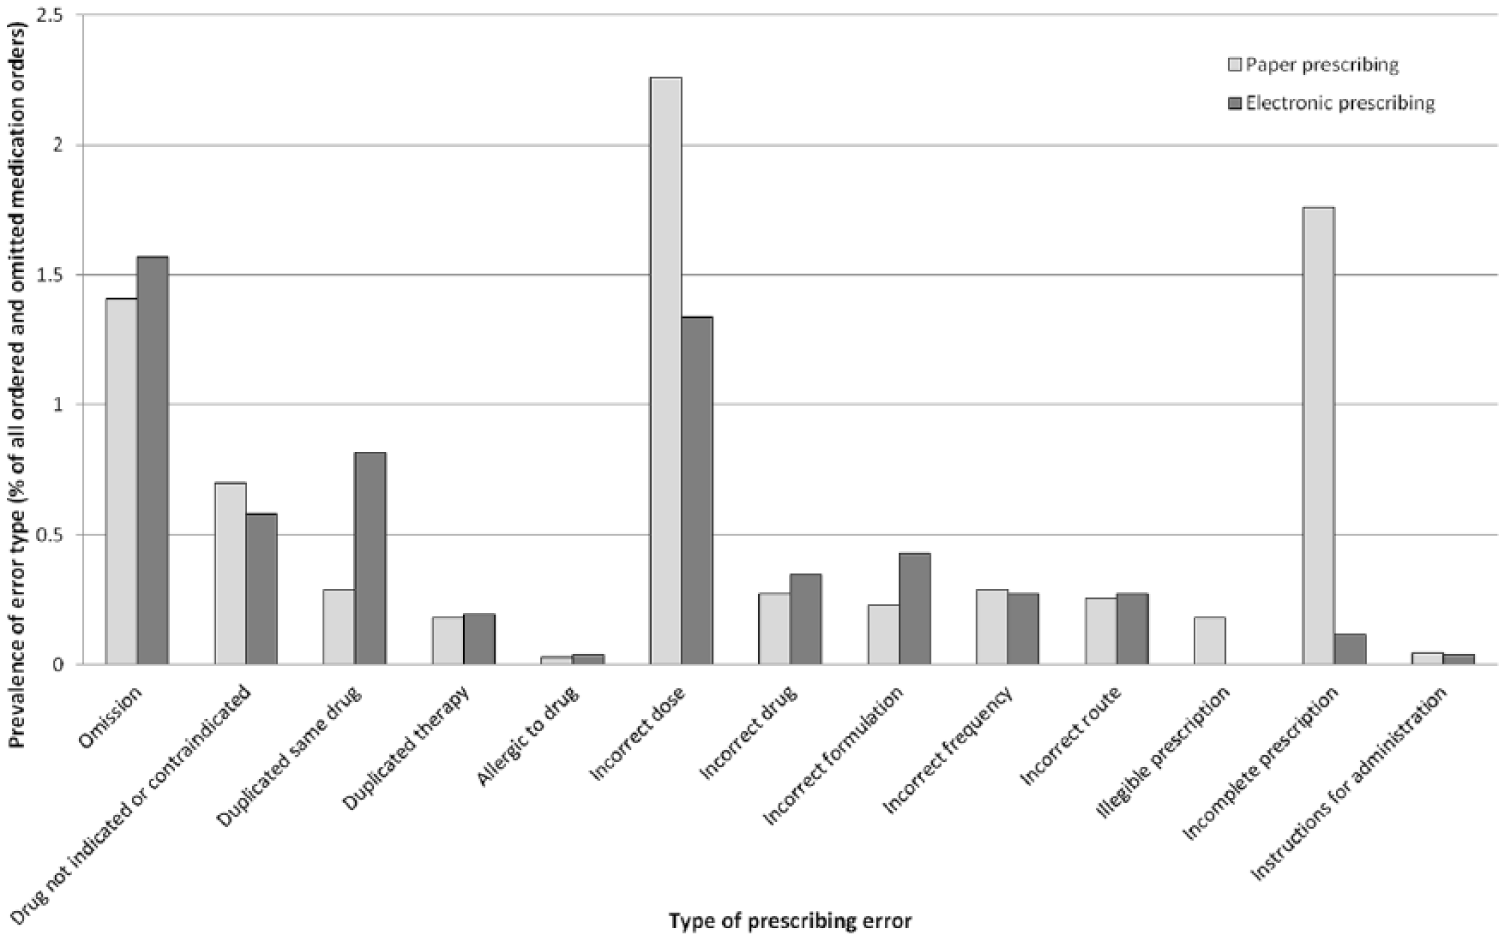
Types of prescribing errors identified using both paper and electronic prescribing (eP).
Rectification of errors
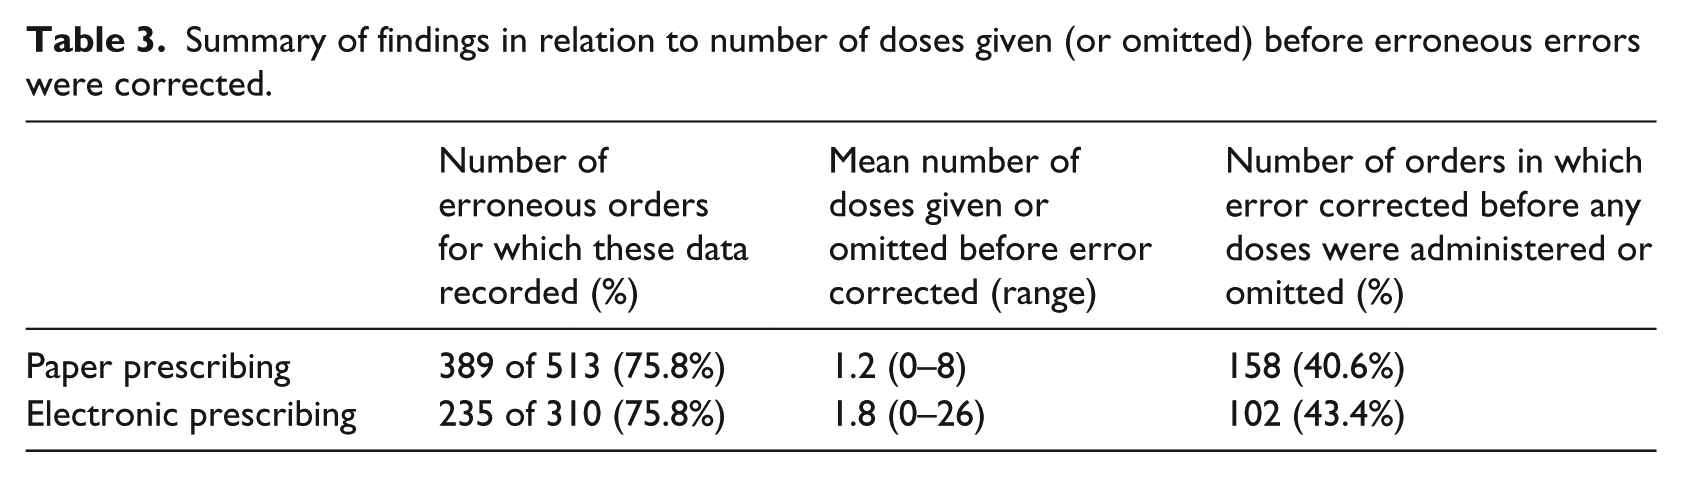
Pharmacists recorded the number of doses given or omitted before the error was corrected for 624 of 823 (75.8%) erroneous medication orders. These data suggest that erroneous doses were more likely to be rectified in a timely fashion for paper-based prescribing (Table 3).
Summary of findings in relation to number of doses given (or omitted) before erroneous errors were corrected.
Discussion
Key findings
Overall, errors were identified in 7.7 per cent of paper medication orders and 6.0 per cent with eP. While univariate analysis suggests that this indicates a decrease with eP, multivariable analysis taking into account clustering by patient and ward suggests no statistically significant difference. Instead, the effects of ward and patient (within ward) were significant, suggesting that factors other than type of prescribing system have a significant impact on prescribing safety and the effect of eP. Our findings also confirm that certain types of errors are more likely with eP with others less likely.
Interpretation and comparison with existing literature
Previous studies of the effect of eP on prescribing errors generally suggest a reduction in prescribing errors. However such studies have not taken into account the effect of ward or patient, precluding comparison with our findings in this respect. A recent study of medication administration errors 25 suggests clustering by ward to be an important factor; our study suggests that ward may also be important for prescribing errors.
In line with previous studies, our findings indicate that eP changes the types of prescribing errors that occur. 17 Perhaps unsurprisingly, there was a reduction in illegible and incomplete medication orders. Prescribing errors associated with the wrong dose also decreased, which is likely to be associated with the use of order sentences and order sets that are pre-populated with commonly used dosing regimens. However, other error types increased. As in our study, previous research suggests an increase in errors associated with duplication of medication and the failure to discontinue drugs that are no longer needed.26–28 New errors have also been attributed to factors associated with the eP system itself and its usability, such as mis-selection from drop-down menus, inability to view all medication concomitantly and failure to change default settings.28–30
A previous study in the context of paper prescribing suggested that 0.9 doses were administered (or omitted) prior to errors being corrected, 4 which compares to our figure of 1.2 for paper prescribing. However we also identified a higher figure of 2.0 with eP; it is not clear why errors were corrected less swiftly with eP.
Strengths and limitations
The main strength of this study was the application of a stepped wedge study design, which is considered more robust in comparison to uncontrolled before-and-after studies. In contrast to previous work in this area, we also took into account clustering by ward and patient. While slightly smaller than anticipated, we still achieved a large sample size of more than 11,000 medication orders.
Limitations include the return rate for pharmacists’ data collection forms, which ranged from 55 to 95 per cent; weeks where the response rate was particularly low coincided with the introduction of eP on the ward concerned, suggesting that this affected data collection. Informal feedback suggested that failure to return data collection forms was due to forgetting to complete the forms or being too busy to record the data. The quality, accuracy and completeness of data collected may also vary depending on individual pharmacists. For example, data regarding the number of doses given or omitted before errors were rectified was recorded for only 76 per cent of errors. It was not possible to take into account any effect of prescriber since we did not record the prescriber for medication orders written or for errors identified, and although we had data on the pharmacist identifying each error, we were unable to take this into account in the model due to the large numbers of different pharmacists who collected data (n = 39) and considerable correlation of pharmacist with ward. Finally, we did not assess the likely clinical significance of errors as pharmacists were asked for only very brief error descriptions to facilitate data collection, with no details of patients’ clinical conditions.
Implications for practice and policy
Our findings suggest that one of the purported benefits of introducing eP, namely a reduction in prescribing errors, may not be realised in practice. Instead, we found a more nuanced effect with different effects on different wards, as well as different types of error. While other benefits in terms of legibility, clear audit trails and reduced reliance on paper storage mean that eP is likely to become ubiquitous, organisations introducing eP should take action to identify those error types that increase with eP and how they can be prevented. Based on our data, duplication of therapy is a key area on which to focus; a parallel qualitative study suggests that screen design is an important consideration in this respect, with eP screens often precluding viewing of all prescribed medication at one time. 30 Other eP-related factors that may influence prescribing errors include usability and system training.29–30 We recommend that organisations supplement implementation advice in published tools31–32 with local data on specific risks.
Implications for research
Our findings suggest ward to be a significant predictor of both prescribing error rates and the effect of eP. Subsequent research in this field should therefore take this into account in study design and analysis, as others have suggested elsewhere. 33 It is not clear why eP increased the error rate on some wards, decreased it on others and had no apparent effect on others. While possible reasons include the effect of different prescribers and different pharmacists and/or wider cultural issues around medication safety, our data suggest that patient factors may be a significant contributor to this variation. It is not clear whether this is due to differences in clinical conditions, medications, or prescribers. Further research, both qualitative and quantitative, should therefore explore these areas, taking into account the sociotechnical context as well as other factors that can affect prescribing errors in the context of eP. 29 Recent research also suggests that local implementation factors affect outcomes relating to safety and efficiency, even where the same commercial system is implemented. 34 Given that our findings suggest that errors were corrected less swiftly with eP, this is also an area for further investigation.
Conclusion
Our analysis suggests that eP has no statistically significant effect on the rate of erroneous medication orders, but that ward and patient have significant effects. Errors involving incorrect doses and illegible or incomplete orders were less common with eP; those involving duplication, omission, incorrect drug and incorrect formulation were more common. Actions are needed to mitigate these error types; future studies should give more consideration to the effect of ward and patient factors on prescribing error rates and the effect of eP.
Footnotes
Acknowledgements
The authors thank Helen Bell for assistance with data analysis and Ofran Almossawi for statistical advice.
Declaration of conflicting interests
The author(s) declared no potential conflicts of interest with respect to the research, authorship, and/or publication of this article.
Funding
The author(s) disclosed receipt of the following financial support for the research, authorship, and/or publication of this article: This article represents independent research funded by the National Institute for Health Research (NIHR) Imperial Patient Safety Translational Research Centre and the NIHR Health Protection Research Unit in Healthcare Associated Infections and Antimicrobial Resistance at Imperial College London, in partnership with Public Health England (PHE). The views expressed are those of the authors and not necessarily those of the National Health Service (NHS), the NIHR, PHE or the Department of Health and Care.
Bryony Dean Franklin supervises a PhD student part funded by Cerner, a supplier of hospital electronic health record systems including electronic prescribing (eP). Bryony Dean Franklin and Seetal Puaar received funding from Pfizer for delivering teaching at a one-off symposium on medication safety unrelated to this study.