
Abstract
This work focuses on adverse drug reaction extraction tackling the class imbalance problem. Adverse drug reactions are infrequent events in electronic health records, nevertheless, it is compulsory to get them documented. Text mining techniques can help to retrieve this kind of valuable information from text. The class imbalance was tackled using different sampling methods, cost-sensitive learning, ensemble learning and one-class classification and the Random Forest classifier was used. The adverse drug reaction extraction model was inferred from a dataset that comprises real electronic health records with an imbalance ratio of 1:222, this means that for each drug–disease pair that is an adverse drug reaction, there are approximately 222 that are not adverse drug reactions. The application of a sampling technique before using cost-sensitive learning offered the best result. On the test set, the f-measure was 0.121 for the minority class and 0.996 for the majority class.
Keywords
Introduction
Problem definition
With the vast amount of electronic health records (EHRs) that have been stored lately, text mining has turned into an important technique to extract information from them. Within the medical domain, the information about the drugs and the diseases of these records would help the medical staff in decision making. When we carry out text mining tasks such as event extraction in this type of records, the information that we want to detect typically consists in anomalous cases. If we use machine learning algorithms to detect, for example, adverse drug reactions (ADRs) or drug–drug interactions, the class imbalance problem appears. This consists in the highly unequal distribution of instances of each class, that is to say, there is a big amount of examples of one class (normal cases) and a small amount of the other one (anomalous cases). 1
Class imbalance makes the task of classifying correctly each example difficult. Machine learning algorithms are not prepared to infer a classifier able to predict the minority class under this situation because they expect balanced class distributions. 2
In this work, we want to extract ADRs, defined as harm directly caused by a drug at normal doses. 3 Thus, the ADR extraction involves a drug and a disease (the harmful reaction). According with the National Study on Hospitalization-Related Adverse Events, ENEAS report,4,5 a total of 37.4 percent of the adverse effects were related to the medication. The World Health Organization (WHO) 6 informed that the under-reporting of ADRs is common in all countries. However, under-reporting ADRs can produce a delay in the detection of the disease or the underestimation of the problem. The creation of a system able to obtain this information automatically can help to facilitate the reporting of ADRs and, as a result, benefit the patients” safety.
Following the definition of ADR, we consider an ADR event a drug–disease pair, as in literature;7–9 however, other authors10–13 consider just the disease. For instance, in an EHR, we found the sentence “type 2 diabetes mellitus brought on by corticoidal treatment and managed with a controlled diet,” the aim is to detect, automatically, that the disease “type 2 diabetes mellitus” was caused by the drug “corticoidal treatment.” In this work, the ADR candidates are all the possible drug–disease pairs, that is, both intra-sentence and inter-sentence events are considered. In addition, the drugs are usually prescribed to combat a disease and they are not the cause of them. As a consequence, we have to deal with a class imbalance problem. Our aim is to find an approach that allows us to tackle the class imbalance in a highly imbalanced ADR extraction task. Specifically, the imbalance ratio is 1:222, this means that for each drug–disease pair that is an ADR, there are, on average, 222 pairs that are not ADRs.
Related work
In the last years, several attempts were made to tackle the class imbalance problem. Some of them were based on sampling, cost-sensitive learning, ensemble learning or one-class classification. In addition, different evaluation metrics were studied to assess the performance of the classifiers with imbalanced classes.2,14 Next, we shall focus on related works dealing with ADR extraction task.
Shon et al. 8 used two approaches to detect sentences with ADR mentions in EHRs. The first approach was based on rules and the second one was a hybrid method including both rules and machine learning using C4.5 algorithm. The data had an imbalance ratio of 1:7. They used up-sampling to balance the class distribution.
Henriksson et al. 9 tackled ADR extraction using supervised machine learning and distributional semantics. Specifically, to classify relations between pairs of entities they applied Random Forest. The dataset had an imbalance ratio of 1:18. This was tackled by sampling and cost-sensitive methods, specifically, they sub-sampled the train set and they assigned weights to each class.
Botsis et al. 11 developed a system to detect reports with Vaccine Adverse Events. They used a rule-based classifier and some machine learning classifiers with two different feature representations. Their reports presented an imbalance ratio of 1:20. This was tackled with cost-sensitive learning by applying weights inversely proportional to the class distribution in some of the classifiers: Boosted Trees, Generalized Additive Model and Support Vector Machine (SVM).
Regarding the one-class classification, Joffe et al. 15 compared it with two-class classification and concluded that one-class SVM performed better than classical two-class classification strategies with imbalanced datasets.
Chan et al. 16 proposed a pattern model that used a g-mean optimization criterion with which an heuristic algorithm was created. Although this work was not based on texts, we have mentioned it because the algorithm was proposed for the prediction of imbalanced targets in clinical data. They assessed it with two datasets showing an imbalance ratio of 1:7 and 1:11, respectively. They observed that their approach outperformed others such as Logistic Regression, Naive Bayes (NB) and Decision Trees. However, when the imbalance was reduced with up-sampling approaches, the difference in the performance decreased.
Zhao et al. 10 detected the ADR-related diagnosis code in EHRs written in Swedish. They applied the Random Forest algorithm on different datasets, the one with the highest imbalance ratio had 1:43. The authors remarked that problems with class imbalance should be assessed with metrics that are insensitive to class distribution, such as the area under receiver operating characteristic (ROC) curve (AUC).
Patki et al. 12 extracted ADRs from social media. They tested Multinomial NB and SVM classifiers and a combination of their probabilities. The imbalance ratio between the comments belonging to the ADR class and the non-ADR class was 1:3. The class imbalance was tackled using cost-sensitive learning.
Ginn et al. 13 extracted ADR mentions from Twitter comments related to 74 drugs using NB and SVM classifiers. They created three subsets with different imbalance ratios, ranging from no-imbalance (ratio 1:1) to 1:2 ratio. The decrement in performance was made evident as the skewness increased.
In the ADR extraction, it is usual to find imbalanced datasets because the ADRs are exceptional cases. In our work, the imbalance has a ratio 1:222, which is higher than the ratio of the most imbalanced dataset of the aforementioned related works (1:43), and makes the ADR extraction difficult. One of the reasons of this imbalance can be that our ADR candidates are all the possible drug–disease pairs in each EHR. Our aim is to find the underlying relations between the diseases and the drugs that caused them, not just the caused disease entity. For instance, in the example “Diabetes Mellitus caused by corticosteroids,” our system would mark the cause–effect relation “Diabetes Mellitus–corticosteroids” as ADR, not only the caused reaction “Diabetes Mellitus.” In addition, we do not restrict the ADR extraction to a sentence, that is to say, both inter-sentence and intra-sentence events are considered.
Methods
Qualitative description of the corpus
In this work, we used a set of EHRs written in Spanish provided by a hospital of the Basque Country. On one hand, these records are subject to strict confidentiality regulations. On the other, the EHRs contain abbreviations and misspellings and do not follow the same structure. These issues make EHR processing difficult. 17
Furthermore, our corpus is biased toward the negative class because it is not usual to find ADRs in the EHRs and we relate all the drugs and diseases of the document. Among the 64,936 events labeled in the records, 99.6 percent events correspond to unrelated drug–disease pairs (non-ADRs) and only 0.4 percent of them are ADRs.
Approaches to overcome the class imbalance
In order to infer the predictive model, we used the Random Forest algorithm. 18 Random Forest combines decision trees in which the order of the nodes is randomly selected among the attributes that maximize the Information Gain. The attributes used to represent each drug–disease pair consisted of word-forms, lemmas and part-of-speech (POS) of the entities and their contexts. The context involved three words to the left and three to the right of each entity. This morpho-syntactic information was obtained with FreeLing-Med. 19 Besides, other features were used, such as the anatomical therapeutic chemical classification (ATC/DDD index) of the drug entity, presence of trigger words (e.g. “caused by,” “related with,” etc.) between the entities, number of apparitions of other drugs, presence of negation keywords (e.g. “no,” “absence of,” etc.) and the distance between the drug and disease entities in terms of words and sentences. Besides, the model allowed out-of-vocabulary (OOV) words to enable the presence of entities that had not been seen in the training stage and a feature subset selection was done.
The aforementioned classifier predicted all the instances as non-ADRs. The key point for this undesired behavior rested on the fact that the big majority of the instances used to infer the model corresponded to non-ADRs. Thus, the skewness of the class in this corpus made the system unable to infer patterns related to ADRs. In an attempt to overcome the class imbalance, we turned to these approaches: (1)
We would like to mention that, for all the cases, unless otherwise stated, we used the Weka’s libraries implemented in Java. 20
Sampling
On one hand, in order to make uniform the class distribution, we resorted to two techniques. The first one is the Resample which obtains a random sub-sample of the instances of the majority class and an over-sample of the instances of the minority class. The second one is the SpreadSubsample which obtains a random sub-sample of the instances of the majority class.
On the other hand, we employed two self-implemented techniques to reduce the number of instances of the majority class (they do not uniform the class distribution necessarily). The aim is to keep the instances that can be more informative to train the model without removing instances of the minority class. The first one, called NumericSubsample, discards those instances where the distances in terms of words between the entities are higher or lower than a given threshold. These thresholds are the maximum and minimum distance of the minority class. The second one, called NominalSubsample, discards those instances that correspond to the same drug and disease within the same document.
Cost-sensitive learning
We applied costs to each type of error.
21
The weights that we assigned to the False Positives (FPs) were the proportion of positive instances,
We used the MetaCost algorithm. 22 This approach forms multiple bootstrap samples from the training set and infers a classifier on each of them. For each example, the class probability is estimated by the fraction of votes that it receives from the ensemble, and the class that reduces the cost is assigned. Next, each training example is relabeled with the estimated optimal class and the classifier is reapplied to the relabeled training set.
Ensemble learning
On one hand, we used ensemble techniques that generate multiple versions of a classifier. Bagging 23 creates the multiple versions by making bootstrap replicates of the training set and using them as new training sets. It implements a plurality vote over the versions to make the predictions. For Boosting, 24 we employed the AdaBoostM1 classifier. This creates the multiple versions by increasing, in each round, the weight of the examples that were classified incorrectly in the training set. The final prediction is the one that maximizes the sum of the weight of each base classifier.
On the other hand, we used ensemble techniques that combined the outputs obtained by different classifiers. With Stacking, 25 the predictions of the base classifiers are the input of another classifier that is responsible of making the final predictions.
Furthermore, we employed other algorithms to combine the predictions of different classifiers. In the WeightedVoting approach, each base classifier has assigned a weight to their predictions and the final prediction is the class that maximizes the votes. In this case, the weights were set to the f-measure of the positive class obtained by each base classifier. In the MajorityVoting approach, the final prediction is the mathematical mode of the class assigned by the base classifiers. In the ORvoting approach, the minority class is assigned if, at least, one of the base classifiers predicted it.
One-class classification
The inference of these models is done with datasets composed by instances of the same class, that is, the predominant class. The instances that do not correspond to this class are classified as outliers. For our task, the outliers would be the ADRs, given that they form the minority class. To implement this approach, we used an extension of the LibSVM package, that is, One-class LibSVM. 26
Results
Quantitative description of the corpus
Our Gold-Standard consists of 75 documents annotated by the staff from the pharmacy and pharmacovigilance departments within the hospital that produced the EHRs. The Inter Annotator Agreement (IAA) was 90.53 percent for entities and 82.86 percent for events.
The Gold-Standard was randomly divided in three disjoint sets to train, develop and test the inferred models, denoted, respectively, as train, dev and test. The description of the corpus is given in Table 1. Note that the number of diseases of each set is more than the double of the number of drugs. What is more relevant to our task, appreciate the big imbalance between ADR and non-ADR events.
Quantitative description of the Gold-Standard, number of documents, word-forms, vocabulary, drug entities, disease entities, and positive (⊕) and negative (⊖) ADR events.
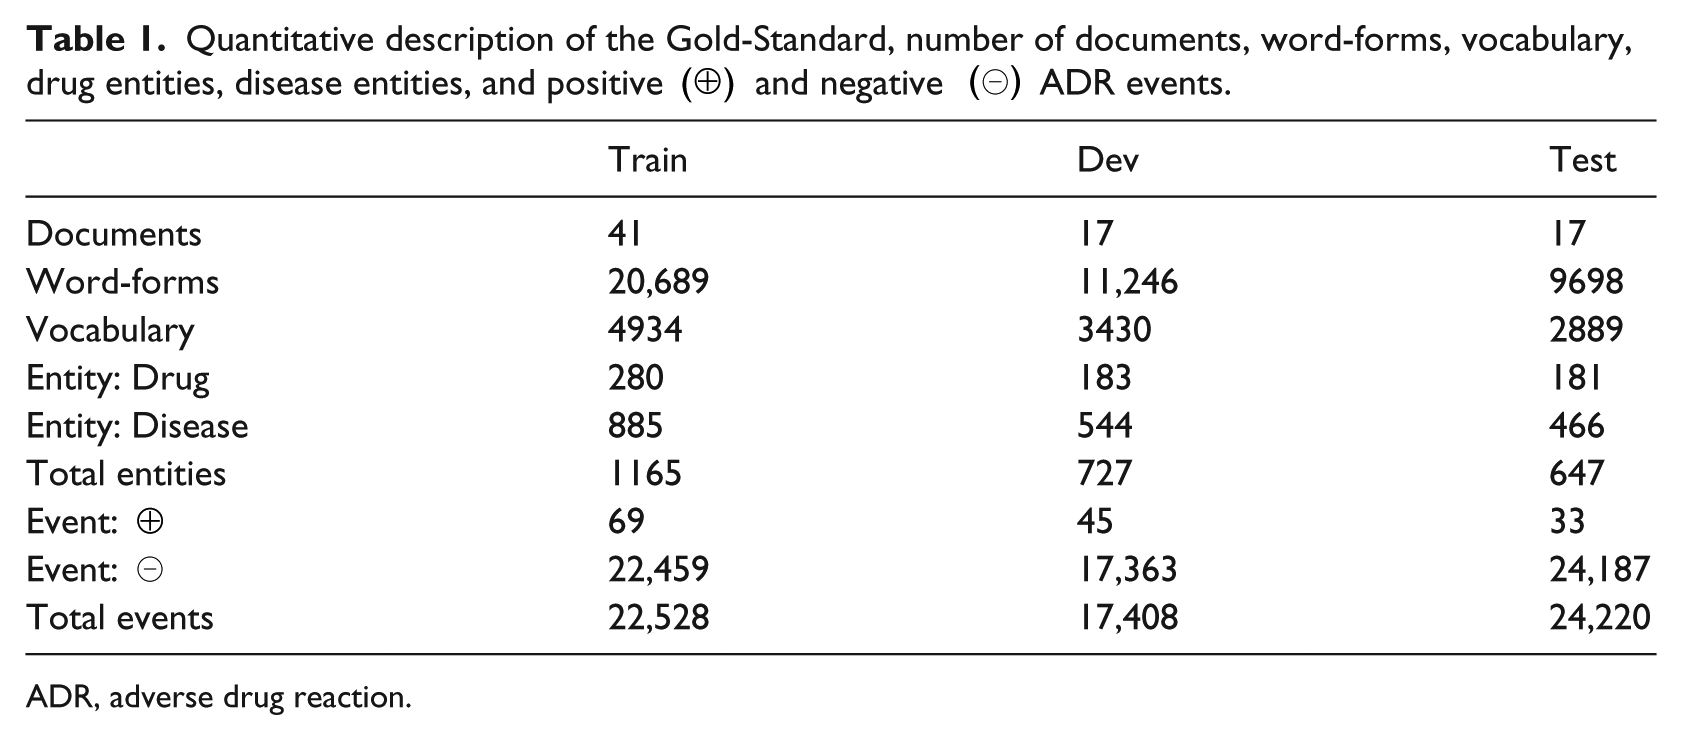
ADR, adverse drug reaction.
Performance of the system
To assess the system we used the hold-out scheme, training with the train set and making the predictions on the dev set to develop the system, and finally, the predictions on the test set were given training with the union of the train and dev sets.
The evaluation metrics were the True Positives (TPs), FNs, FPs and True Negatives (TNs), apart from the classical precision, recall and f-measure, calculated for both the positive and the negative class. Furthermore, the class weighted-average, micro-average and macro-average metrics were also calculated. The macro-average treats all classes equally, by contrast, the weighted-average and the micro-average favor densely populated classes. 27 Given the unequal distribution of the positive and negative class, we focus mainly on the performance of the positive class (ADR events) and the macro-average.
Note, however, that the aforementioned evaluation metrics are sensitive to class distribution and might result misleading in problems with skewed classes. To assess tasks with skewed class distribution, the recommended metrics are 28 the ROC curve and the AUC, which was used in other works such as Zhao et al. 10 The interest on using them rests on the fact that they are insensitive to class distributions.
In our experimental framework, we applied the individual techniques to overcome the class imbalance mentioned in the “Approaches to overcome the class imbalance” section. First, we carried out experiments using different individual techniques: (1) for
TPs, FPs and f-measure obtained in each experiment developed to overcome the class imbalance.
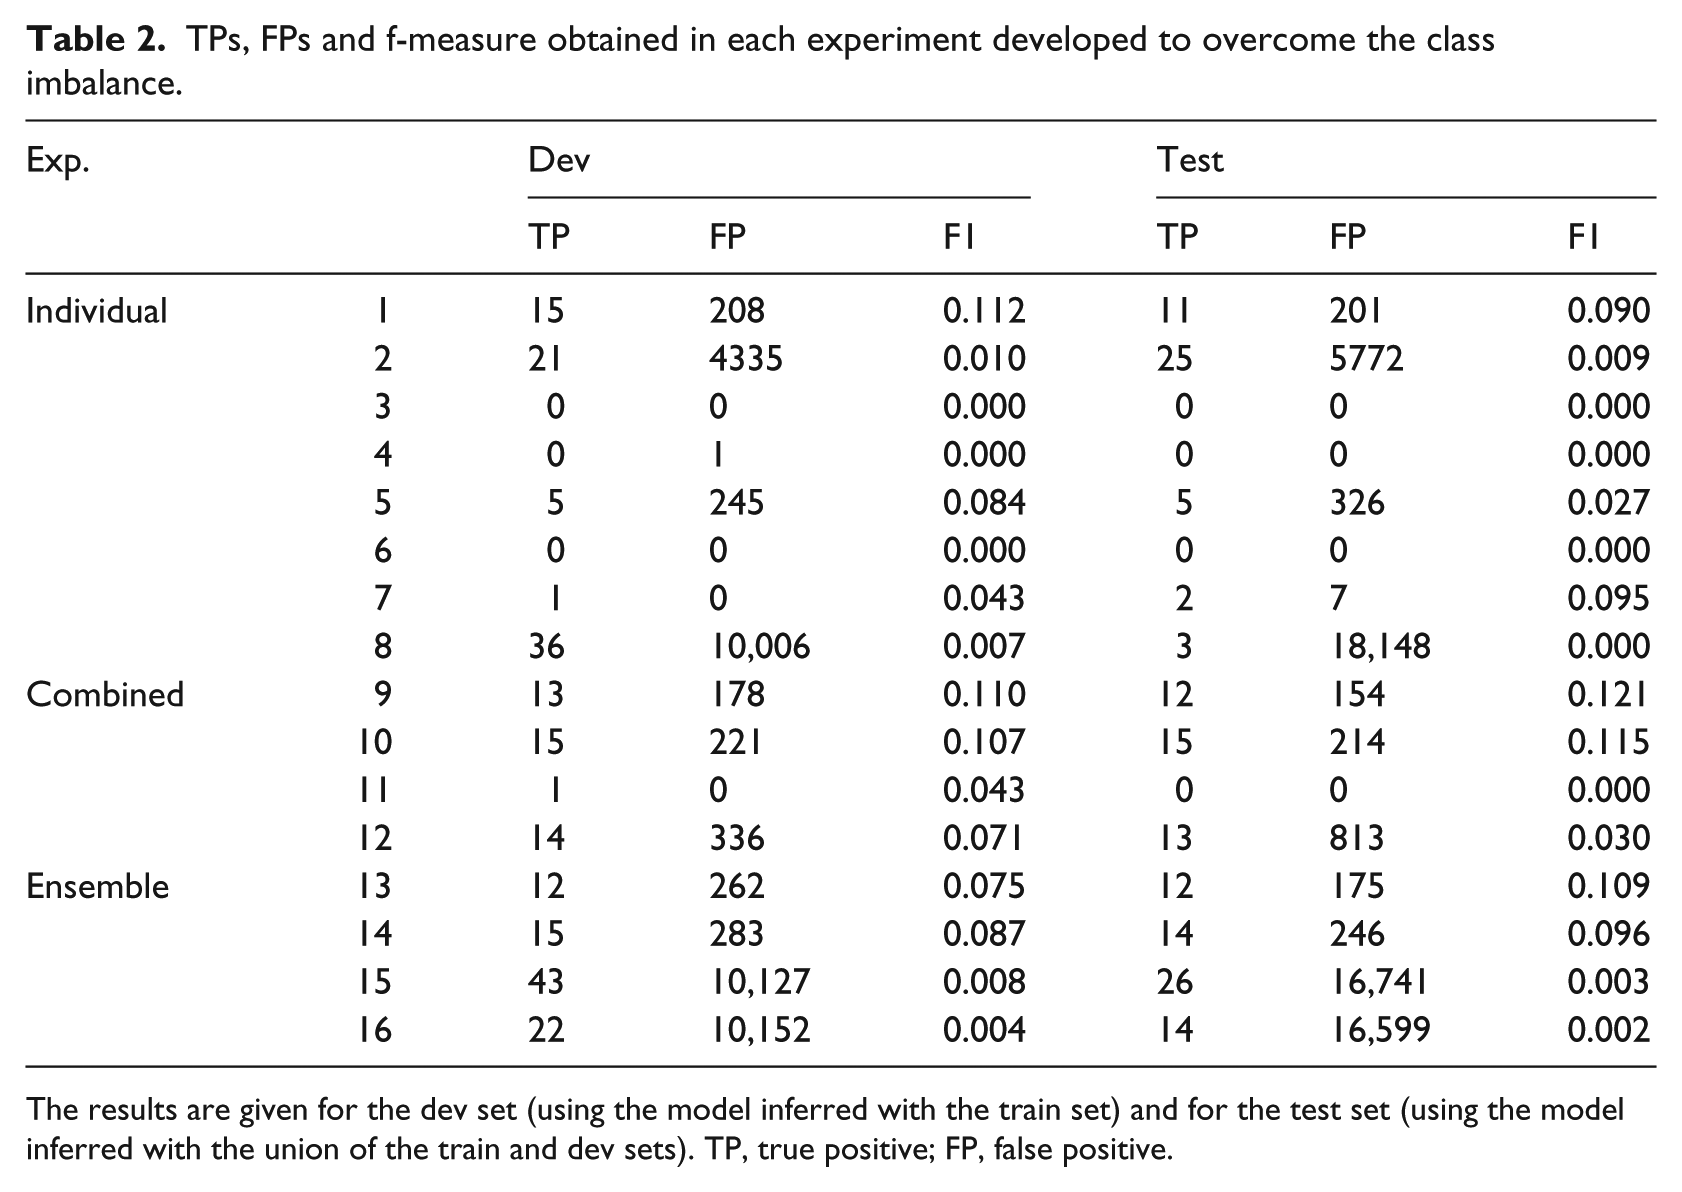
The results are given for the dev set (using the model inferred with the train set) and for the test set (using the model inferred with the union of the train and dev sets). TP, true positive; FP, false positive.
From the experimental framework, we found that the approaches that resulted robust to overcome this highly skewed classification task were the combination of
Results of the best experiment for the dev set.
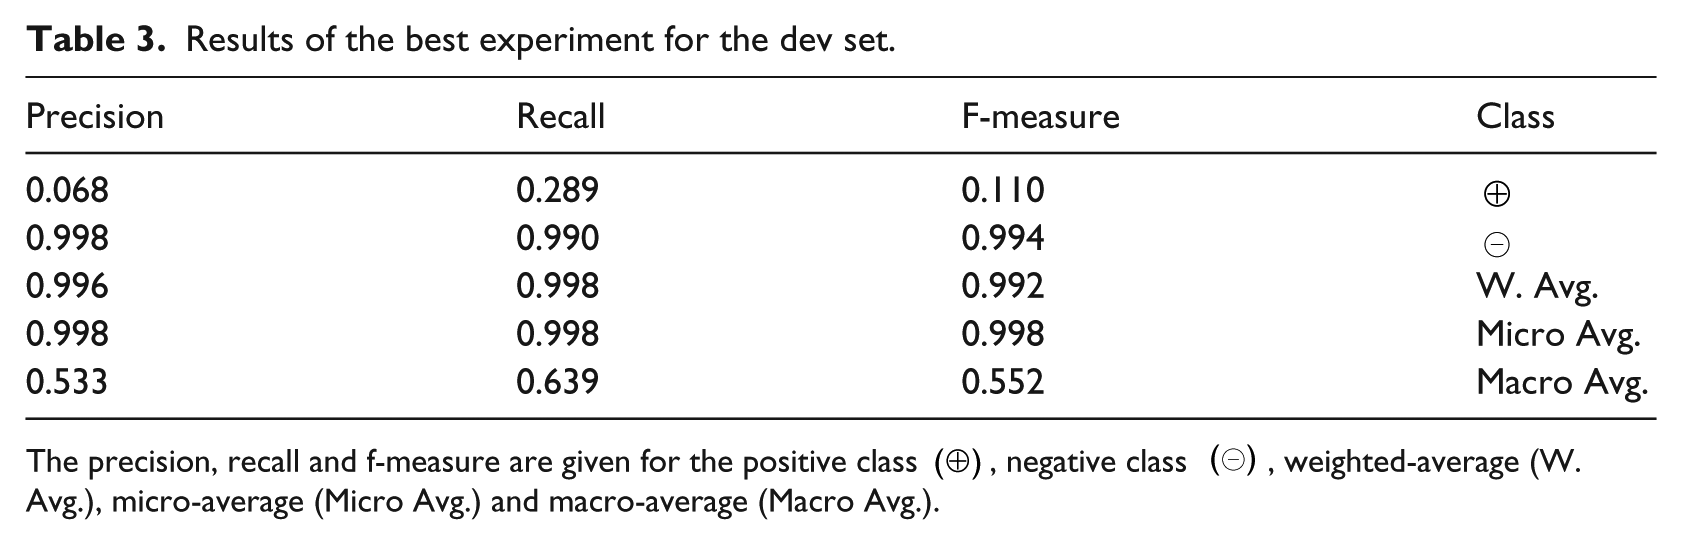
The precision, recall and f-measure are given for the positive class (⊕), negative class (⊖), weighted-average (W. Avg.), micro-average (Micro Avg.) and macro-average (Macro Avg.).
Table 4 provides the ADR classification results using train and dev sets to infer the model and the test as evaluation set. The f-measure for the positive class is 0.121 with 12 TPs, 21 FNs, 154 FPs and 24,033 TNs. Applying just the Resample filter, it is 0.090 with 11 TPs, 22 FNs, 201 FPs and 23,986 TNs; and with just the MetaCost classifier, it is 0.027 with 5 TPs, 28 FNs, 326 FPs and 23,861 TNs.
Results of the best experiment for the test set.

The precision, recall and f-measure are given for the positive class (⊕), negative class (⊖), weighted-average (W. Avg.), micro-average (Micro Avg.) and macro-average (Macro Avg.).
Figures 1 and 2 show the ROC curve and the AUC of the aforementioned experiments for the dev and test set, respectively. The ordinate is designed to True Positive Rate (TPR) and the abscissa the False Positive Rate (FPR). The bigger the TPR, the better, as opposed to FPRs (the smaller the better). The diagonal discloses situations in which the TPR is equal to the FPR, that is, the prediction does not show correlation with the ground truth, and correspond to random guessers. The aim is to build a classifier for which the ROC curve is above the diagonal, the more detached the better and, hence, get the largest AUC as possible. In both cases, we can see that the points are above the diagonal and the obtained AUC is above 0.85. This means that our classifier shows correlation with the ground truth and the performance is good.
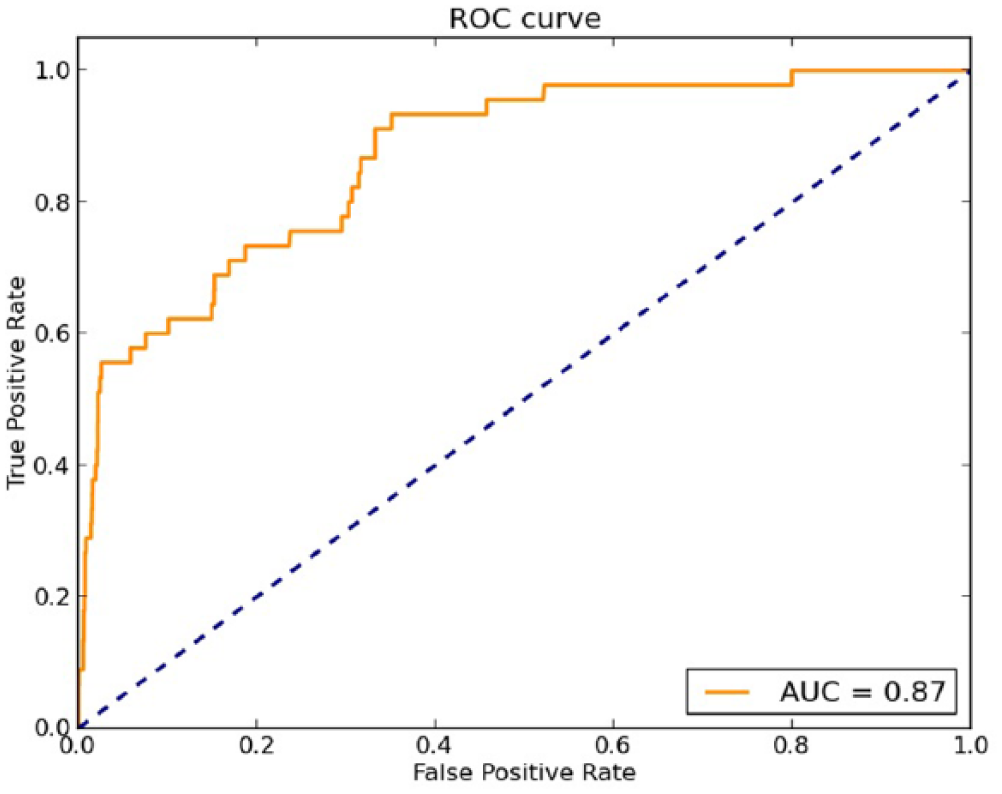
ROC curve and AUC for the dev set.
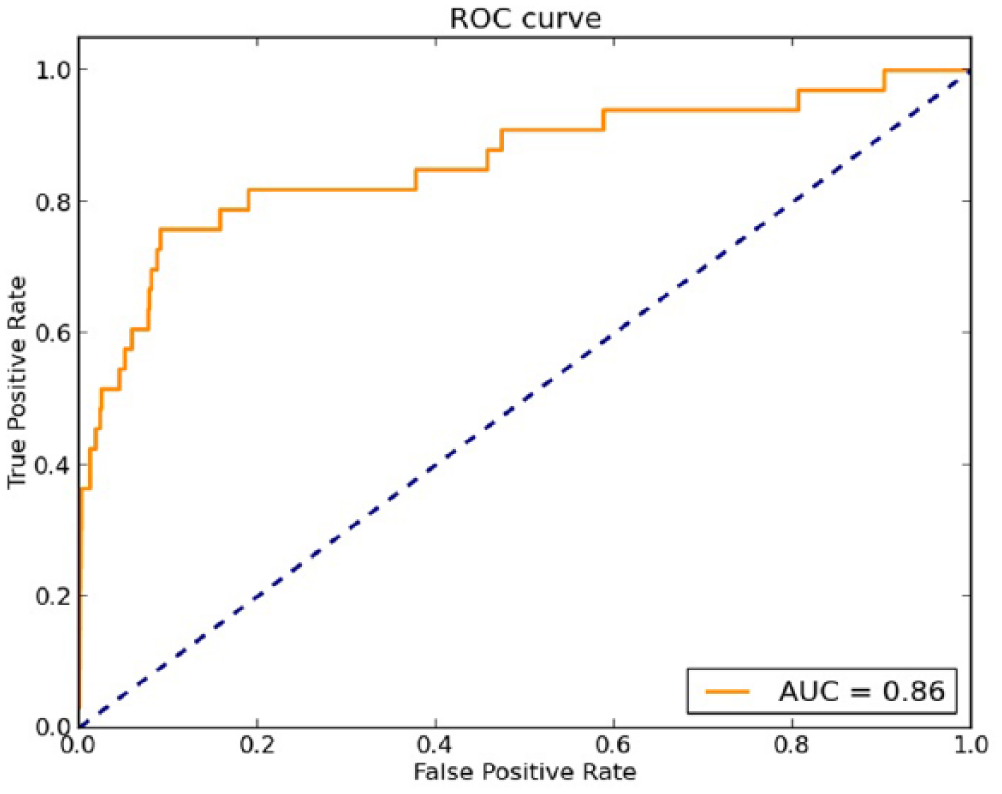
ROC curve and AUC for the test set.
In brief, the use of the MetaCost classifier after the Resample allowed us not only to detect a higher number of ADRs (i.e. to increase TPs) but also to reduce the cases of drug–disease pairs which had been previously incorrectly predicted to be ADRs (i.e. to decrease FPs). We have observed that in long sentences with lots of entities, where there are some drugs and diseases related as ADRs and others related as treatments, the models tend to generate FPs. However, some of these errors are avoided with different combinations of the approaches used to overcome the class imbalance.
Discussion
ADRs are infrequent events in EHRs. Trying to classify drug–disease pairs into ADR or non-ADR events is not straightforward due to the so-called class imbalance problem, 1:222 in our case. With supervised classification algorithms, we found that all the instances were predicted as non-ADR. This allows us to incorporate individual approaches to overcome the class imbalance, namely, Sampling, Cost-sensitive learning, Ensemble learning and One-class classification. Besides, we combined the aforementioned individual approaches. From the experimental results, we learned that in this task, individual techniques were not of much help, except for Sampling. Experiments disclosed that it is worth combining Sampling with Cost-sensitive learning. Particularly, among them, the best results, in terms of f-measure of the positive class, were achieved with MetaCost classifier after Resample filter. An analysis of the results attained with the use of the resampling approach, the best individual approach, revealed that the number of FPs was high (as discussed in the previous section). This happens because resampling provokes a small bias in the inference algorithm but, in this case, toward the positive class. It is, indeed, to penalize these errors that MetaCost learning is effective, since the weights penalize the aforementioned bias, leading to a decrement in FPs and an overall improvement in performance. Next, we discuss the results obtained with the rest of the experiments.
The results also show that if we include Bagging in these experiments, the f-measure gets worse (from 0.121 to 0.115). In addition, if we compare the Resample and MetaCost approaches independently with the combination of both of them, we can see that the difference with the filter Resample is lower than the difference with the MetaCost classifier (the f-measure for the positive class is 0.090 and 0.027, respectively). The reason is that with the MetaCost classifier, the number of TPs is very low and the number of FPs very high.
Furthermore, the ensemble techniques WeightedVoting and MajorityVoting did not outperform the f-measure obtained with the best experiment (0.109 and 0.096, respectively). The result obtained with MajorityVoting are similar to those obtained with AdaBoostM1 (0.095), the reason is also that the number of TPs and FPs is very low.
It is important to say that in the case of the two sub-sampling techniques (NumericSubsample and NominalSubsample) implemented by ourselves, although the number of instances of the majority class was reduced by half, the distribution of the class was still unbalanced. Because of this, almost all the instances were assigned to the majority class. Applying the Resample filter after the two types of sub-sampling, the f-measure for the positive class was 0.03, it is low because of the high number of FPs.
In the rest of the experiments, the f-measure for the positive class was not higher than 0.010. There are two main causes for it: (1) Both the number of TPs and the number of FPs is low, for example, this happened applying Bagging and (2) the number of TP is not low but there are too many FPs, for example, this happened applying SpreadSubsample, One-class LibSVM, Stacking and ORvoting.
Next, we try to make a comparison with the related works that we found closest to ours, that is, Henriksson et al. 9 and Botsis et al. 11 Note, however, that the results should not be compared strictly, since the corpora used are different. Both of them made the evaluation using hold-out and used the evaluation metrics given by us. Comparing our work with that by Henriksson et al., 9 they also used Random Forest classifier and considered ADR as a relation between a drug and a disease. Their best results achieved an f-measure for the positive class of 0.272. With our proposed approach, the f-measure is approximately 0.100 lower. In comparison with the work by Botsis et al., 11 their best result shows a macro f-measure of 0.816 for the test set. In our case, the macro f-measure for the test set is 0.585. If we focus on the precision and recall, they achieved 0.885 and 0.751, respectively, whereas we obtained 0.536 and 0.679. We can see that the main difference is in the precision, giving as a result more FPs. Note that their classification task consists in detecting if the document contains ADRs, while in our case, we are focusing on the detection of all individual ADR events in the document and marking both the causing drug and the resulting disease. Besides, the class imbalance in our task compared to theirs is notably higher: 1:222 in our case and 1:18 and 1:20 in theirs.
Conclusion
In this work, we tried different approaches to overcome the class imbalance problem within the medical domain. With imbalanced tasks, the machine learning algorithms tend to be biased and hardly learn to predict the minority class. Then, with the aim of improving the performance of an ADR extraction system, we explored individual techniques such as sampling, cost-sensitive learning, ensemble learning or one-class classification.
Empirically, we found that in this task, the techniques that detected more ADRs were, indeed, those that also produced more FPs. Thus, we needed more sophisticated techniques to overcome this highly imbalanced task. To this end, we combined the individual techniques. Among the combinations explored, the approach that yielded the best f-measure on the positive class was the combination of sampling with cost-sensitive learning, particularly, Resample and MetaCost.
Although the predictive capacity of the classifier was improved using some of the aforementioned techniques, there is room for improvement. In the future, we will explore some of the previous approaches for ADR extraction using different features for characterization. Our idea is to represent the drug–disease pairs using word-embeddings. The representation itself is a key factor to leverage the inference process.
Footnotes
Acknowledgements
The authors thank the reviewers for the accurate suggestions that helped to upgrade this work.
Declaration of conflicting interests
The author(s) declared no potential conflicts of interest with respect to the research, authorship, and/or publication of this article.
Funding
The author(s) disclosed receipt of the following financial support for the research, authorship, and/or publication of this article: We acknowledge the support provided by the Spanish Ministry of Science and Innovation (PROSAMED: TIN2016-77820-C3-1-R) and the Basque Government (DETEAMI: Department of Health 2014111003, BERBAOLA: KK-2017/00043, Predoctoral Grant: PRE 2016 2 0128).