
Abstract
This research extracted patient-reported symptoms from free-text EHR notes of colorectal and breast cancer patients and studied the correlation of the symptoms with comorbid type 2 diabetes, race, and smoking status. An NLP framework was developed first to use UMLS MetaMap to extract all symptom terms from the 366,398 EHR clinical notes of 1694 colorectal cancer (CRC) patients and 3458 breast cancer (BC) patients. Semantic analysis and clustering algorithms were then developed to categorize all the relevant symptoms into eight symptom clusters defined by seed terms. After all the relevant symptoms were extracted from the EHR clinical notes, the frequency of the symptoms reported from colorectal cancer (CRC) and breast cancer (BC) patients over three time-periods post-chemotherapy was calculated. Logistic regression (LR) was performed with each symptom cluster as the response variable while controlling for diabetes, race, and smoking status. The results show that the CRC and BC patients with Type 2 Diabetes (T2D) were more likely to report symptoms than CRC and BC without T2D over three time-periods in the cancer trajectory. We also found that current smokers were more likely to report anxiety (CRC, BC), neuropathic symptoms (CRC, BC), anxiety (BC), and depression (BC) than non-smokers.
Introduction
Cancer patients commonly experience symptoms such as pain, depression, and fatigue as a consequence of undergoing chemotherapy treatment, and these symptoms may develop or persist even after the chemotherapy ends. These symptoms add to patients’ distress and functional impairment if left untreated. The literature shows that individual differences have associations with the symptoms and patient experience.1,2 The symptoms could be gastrointestinal symptoms including nausea, vomiting, lack of appetite, or psychoneurological symptoms including depressive symptoms, anxiety, or other types.
The majority of research studies gather patient-reported symptoms through symptom measurement questionnaires.3–5 Cheung et al. 6 applied Principle Component Analysis (PCA) for the 1366 cancer patient cohort who completed the Edmonton Symptom Assessment Scale (ESAS) questionnaires to determine the inter-relationships of the nine symptoms. They identified two major symptom clusters from their study cohort. One included fatigue, drowsiness, nausea, decreased appetite, and dyspnea; the other included anxiety and depression. Marshall et al. 7 investigated symptom clusters in women with breast cancer using social media data. The k-medoid clustering method was used to cluster the symptoms. The similarity measure was developed based on the frequency of the co-occurrences of the 25 symptoms included in the survey. Unstructured EHR clinical notes include a vast amount of important information regarding patient-reported symptoms. However, there is limited research focused on extracting symptoms from the clinical notes, then analyzing the symptoms with other clinical data for risk assessment, outcome prediction, or clinical decision making. Vijayakrishnan et al. 8 developed a natural language processing (NLP) procedure to identify signs and symptoms of heart failure (HF) patients, using electronic health records (EHR). The method is designed to target HF patients specifically. Jackson et al. 9 developed a suite of language models to specifically capture key symptoms of severe mental illness (SMI) from clinical text. Forsyth et al. 10 developed a name entity recognition algorithm to extract breast cancer symptoms from the EHR. However, the semantic relations between various symptoms were not considered, and the symptoms were used to analyze any clinical outcomes. Divita et al. 11 developed a NLP pipeline to extract symptoms from the clinical notes. The pipeline considers the Part-Of-Speech (POS) and some syntactic rules, but no semantic similarity and embedding was used. Gundlapalli et al. 12 investigated an NLP pipeline to extract urinary symptoms to detect indwelling urinary catheter. They first defined a set of lexicons for urinary symptoms, then NLP tools were used to detect the positive and negative cases. Koleck et al. 13 did a systemic review on NLP techniques applied to clinical notes in the EHR for symptom analysis. They found that only 14 studies had symptom-related information as the primary outcome. Although the studies included various symptoms, only nine studies reported patient demographic characteristics. Vaci et al. 14 used a Long-Short Term Memory (LSTM) learning based name entity recognition (NER) model along with active learning to identify depression related symptoms from various sections of the EHR. However, this research focused on depression symptoms only, and patient outcomes were not measured.
In this research, we use EHR data and focus on mining and analyzing the symptom clusters of patients with or without type 2 diabetes (T2D) and diagnosed with colorectal or breast cancer. We analyzed eight different types of symptoms and their correlations with comorbidity—diabetes, race, and smoking status. The research presented in this paper is different from previous research as it includes: (1) extracting from the EHR clinical notes and selecting symptom types (such as fatigue, gastrointestinal issue, and so on) that are relevant to both cancer patients and people with T2D; (2) investigating pretrained BioWord2Vec for semantic analysis of the seed symptom representations, and applying a hierarchical clustering algorithm for symptom clustering in order to identify relevant symptom expressions in the clinical notes; and (3) exploring the symptoms and their association with comorbidity—T2D in colorectal cancer and breast cancer patients.
Study cohorts
The study cohort in this research consists of patients with a primary diagnosis of breast cancer (BC) or colorectal cancer (CRC) who have electronic medical records in a large academic medical center’s EHR system. BC and CRC patients were identified using the International Classification of Diseases (ICD). The ICD codes for BC are 174 (ICD-9) and C50 (ICD-10); the ICD codes for CRC are 153–154 (ICD-9) and C18–C20 (ICD-10). Through these ICD codes, we identify the BC and CRC cases that have received chemotherapy within the 10 years of 2007–2017. For each case, we extracted clinical notes, demographic data including gender, race, and smoking status, cancer characteristic data, including the pathologic stage of cancer, age at diagnosis, and the number of comorbidities.
In total, there were 1694 CRC patients, and 3458 BC patients included in this study. There were 112,298 clinical notes for CRC patients and 254,100 clinical notes for BC patients. Over 600 types of clinical reports were included.
Methods
System design
In this research study, we focused on eight types of symptoms—“Fatigue,” “Anxiety,” “Cognitive Issues,” “Neuropathy,” “Sleep Issues,” “Gastrointestinal (GI) Issues,” “Functional Status,” “Depression” defined by symptom clusters including a set of seed terms relevant to the corresponding symptoms. Based on our previous work 15 and current literature16–26 we identified the symptoms a priori. The seed symptoms selected for inclusion in this study are the most common symptoms reported by cancer survivors and people with type 2 diabetes. Table 1 provides the seed terms for each symptom cluster, which were provided by domain expert (Author Storey). However, the seed symptom terms cannot cover various representations of the symptoms in the EHR clinical notes. Hence, we developed an NLP framework to identify and extract all the terms relevant to these symptom clusters from the EHR.
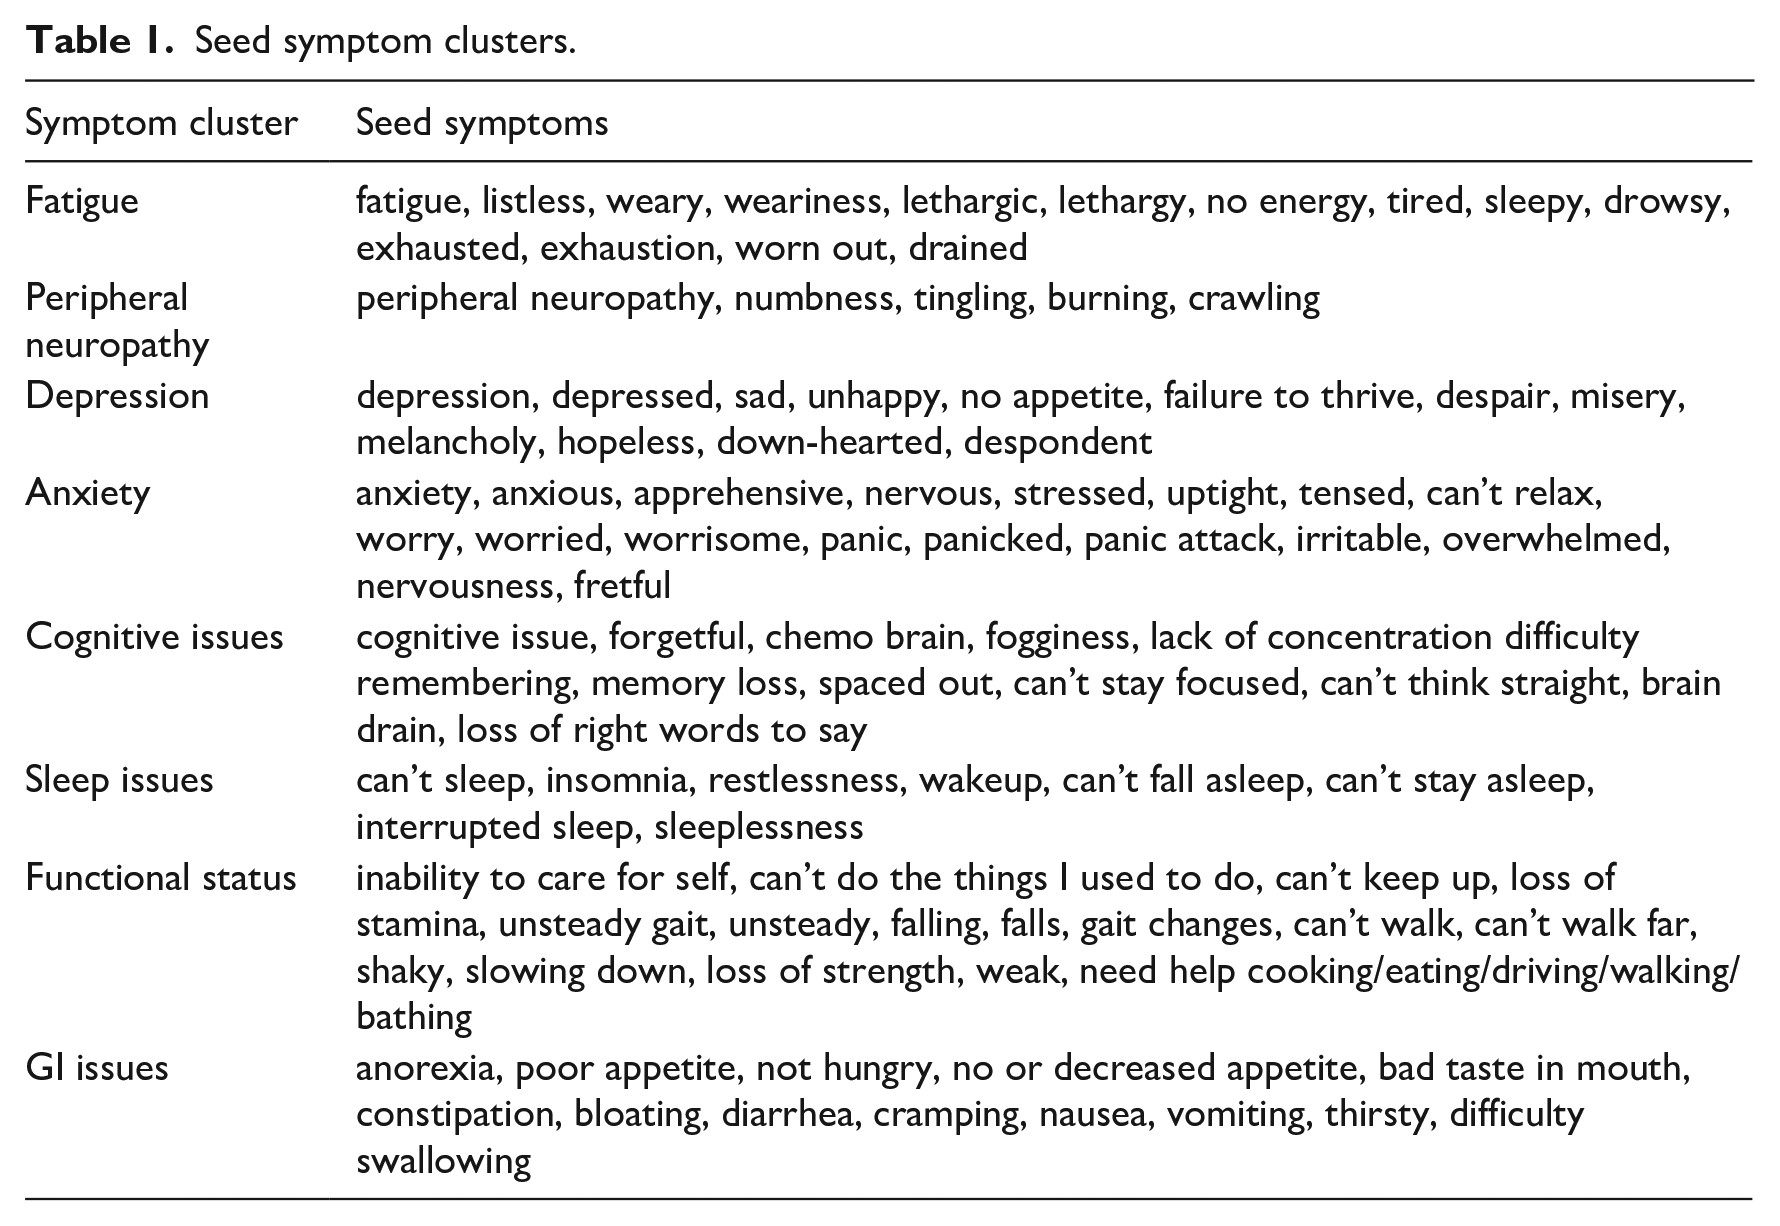
Seed symptom clusters.
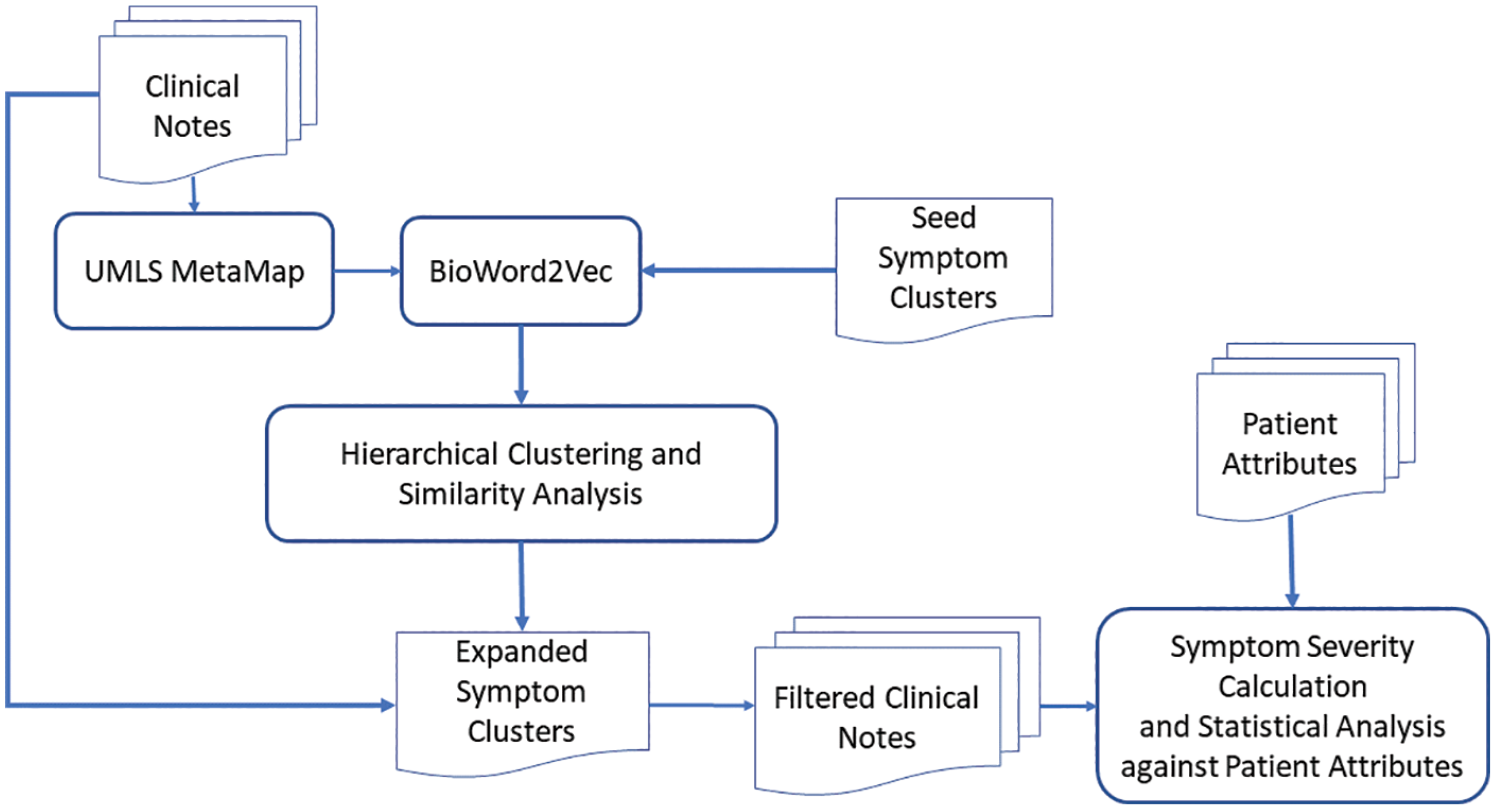
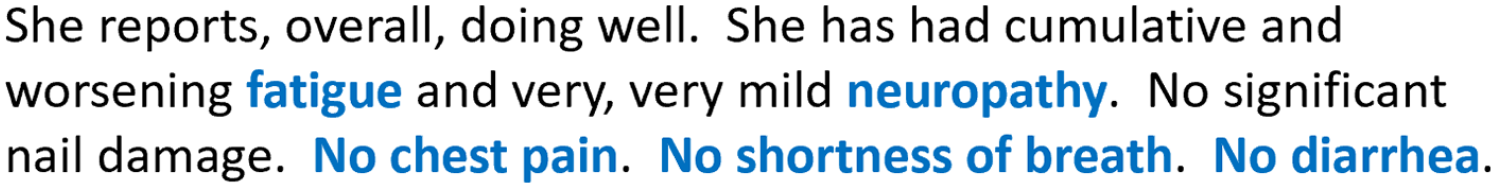
The overall system design for symptom extraction, clustering, and data analysis using the EHR clinical notes along with patient attributes (including diabetes status, smoking status) is shown in Figure 1. Given all the clinical notes of the study cohort, we first utilized UMLS MetaMap, 15 which is an NLP tool that uses various sources to categorize the phrases or terms in the text to different semantic types, to identify all the symptom terms. Based on the initial eight symptom clusters defined in Table 1, we selected the following semantic types: “Sign or Symptom,” “Mental and Behavioral Dysfunction,” “Mental Process,” “Finding,” “Daily or Recreational Activity,” “Home Care Activity.” Figure 2 provides an example of clinical notes with highlighted terms mapped into the selected semantic types using UMLS MetaMap. The negation detection and Word Sense Disambiguation (WSD) functionalities were turned on when using UMLS MetaMap. Therefore, negating and ambiguous terms are not included. After symptoms terms were identified and extracted from the clinical notes, symptom clustering through semantic analysis was used to expand the symptom clusters in Table 1 by adding more symptom expressions extracted from the clinical notes. We first used pretrained BioWord2Vec 27 to convert symptoms into vector representations. Research 16 showed that BioWord2Vec outperformed other word embeddings on multiple NLP tasks in the biomedical domain. We then used hierarchical clustering algorithm to generate sub-clusters of the symptoms. The reason to use hierarchical clustering algorithm is that the symptom terms within each symptom clusters are semantically related but might belong to different sub-clusters based on their representations. These extended eight symptom clusters were used to identify the patients with any of these symptoms, and then to calculate the severity of the symptoms. This, in turn, facilitated the ability to apply statistical analysis to examine the symptoms associated with other patient attributes, such as diabetes comorbidity and smoking status.
Overall system design.
Symptom extraction using UMLS MetaMap.
Semantic analysis of the symptoms and symptom clustering
To discover more symptom expressions that are not listed in Table 1. We used semantics analysis to first group symptom terms within each cluster into semantically meaningful sub-clusters, then employed further semantic analysis 28 to identify the symptoms expressions in the clinical notes that are close to the sub-clusters.
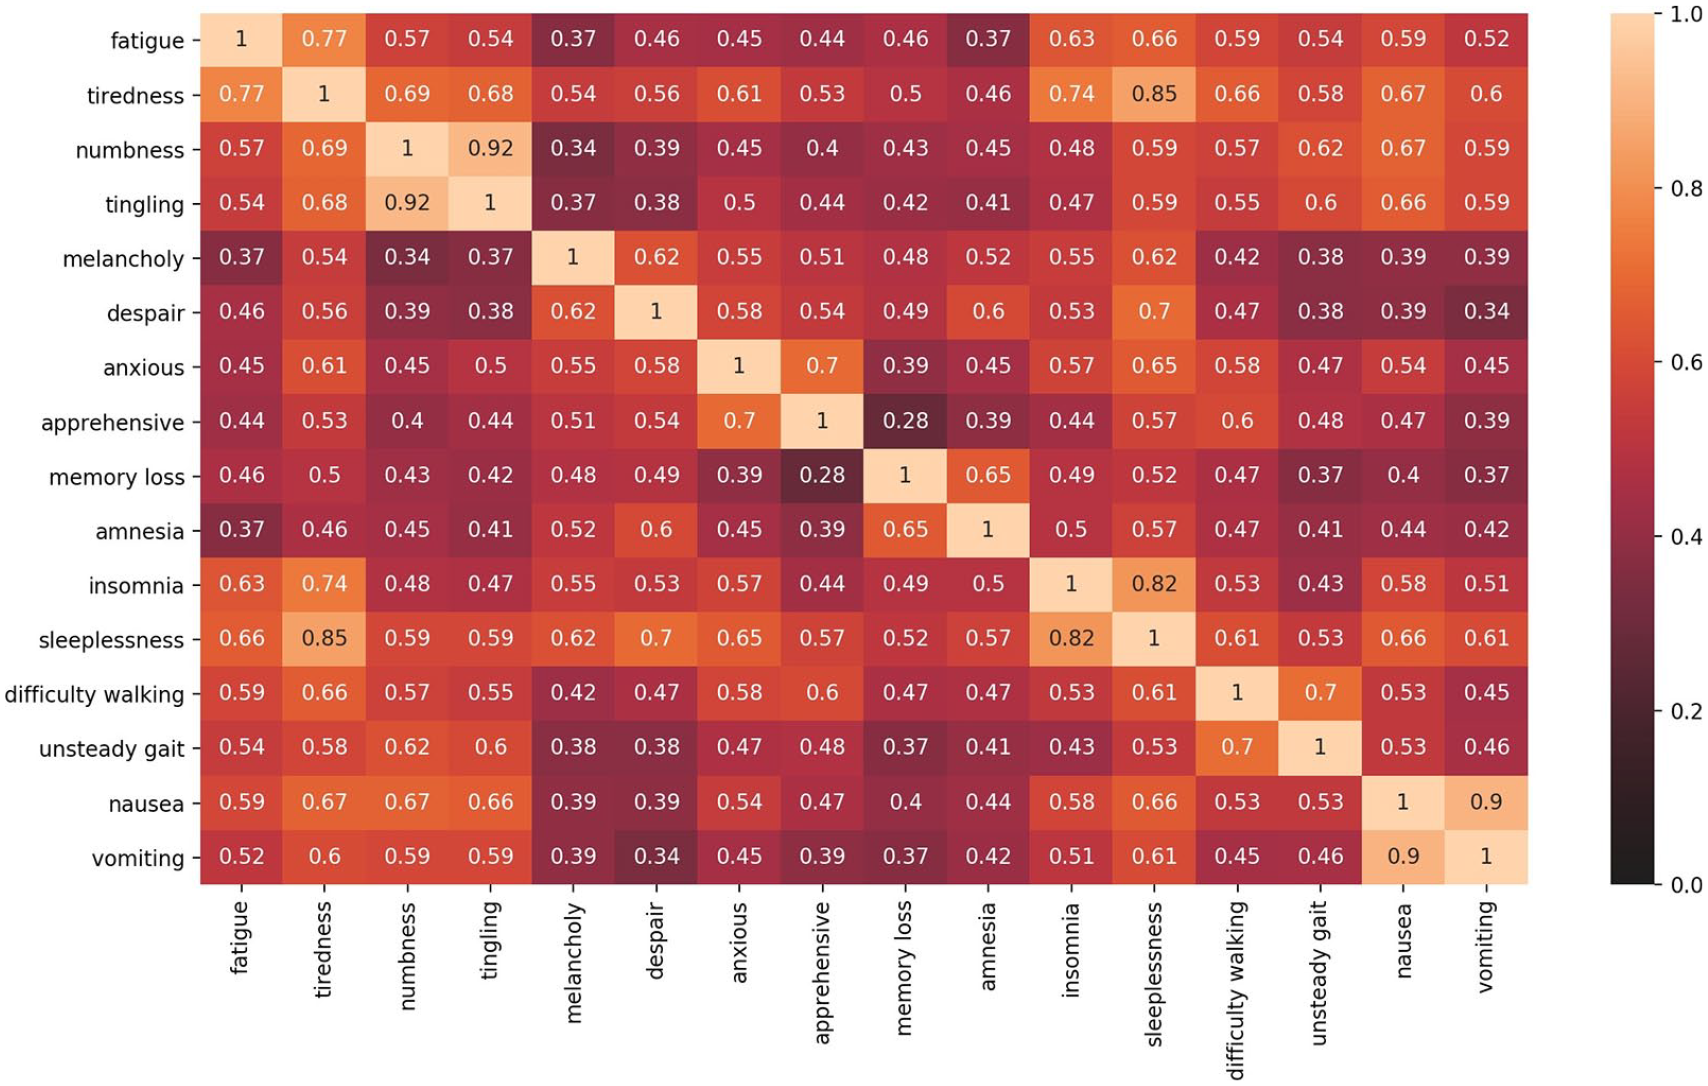
To analyze the semantic meaning of various symptom terms, we used concept embeddings to measure the semantic similarities between all extracted symptoms and the seed symptom clusters to identify additional symptom expressions within the EHR clinical notes. Since 2013, various neuron networks have been investigated for generating word or concept embeddings. The vector representation of the embeddings is capable of capturing the semantic associations between the words or concepts. The BioWord2Vec 29 includes pretrained biomedical word embeddings30,31 using PubMed and MeSH sequences. In this research, we utilized the pretrained BioWord2Vec to generate symptom embeddings. Given a symptom term consisting of more than one word, it computes the symptom embeddings by computing the element-wise sum of the representations of each word embedding. The semantic similarities between the symptoms can then be calculated by measuring cosine similarity between the embeddings. Figure 3 shows the selected symptoms in the clusters through the heatmap of the symptom cosine similarity matrix using embeddings generated from the BioWord2Vec. The higher the similarity score is (the lighter the cell is), the more similar the symptoms are from the semantic point of view. Based on similarities in Figure 3, symptoms within the same clusters show high similarities. For example, “numbness” and “tingling” both belong to cluster “Neuropathy,” and cosine similarity (0.92) between them is high, and higher than that seen among the rest of the terms in the other clusters. However, some symptoms from different clusters also show the semantic relationship. For example, the semantic similarity score between “tired” and “sleeplessness” is also high (0.85), which means “tired” often co-occurred or is semantically related to “sleeplessness.” This demonstrates that some symptom clusters are correlated.
Heatmap based on the cosine similarity matrix using BioWord2Vec embeddings.
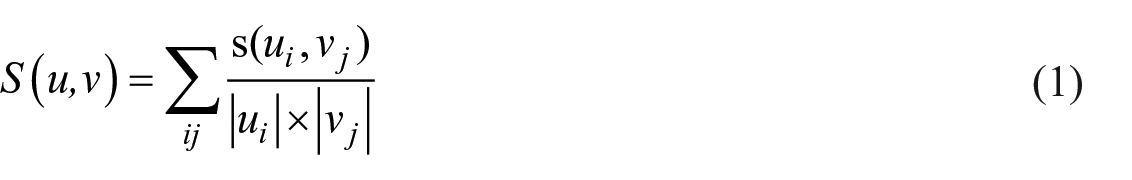
In order to identify the additional terms written in the EHR that are semantically close to the terms in the seed clusters, we first applied hierarchical clustering algorithm 32 to form sub-clusters within each seed symptom cluster. Then, we measured the similarity of a given new term to each of the sub-clusters to extend the seed symptom clusters. The hierarchical clustering works as an iterative process, which starts with the points as individual clusters and, at each iteration, merges the most similar pair of clusters. Before the process started, the similarities between all pairs of clusters were computed. It generates an initial similarity matrix (Z) whose Zuv entry gives the similarity (S(u, v)) between clusters u and v. This similarity matrix gets updated with every iteration to reflect the pairwise similarity between the new cluster and the original clusters. Equation (1) is the average linkage function to calculate the cosine similarity of the newly formed cluster u with the remaining clusters v, which sums the similarities between any data instances within cluster u and v.
However, hierarchical clustering does not inform the further steps to form proper number of clusters. so, we developed our approach to identify the optimal number of clusters. The following steps were taken to form the clusters, where
Step 0: Set k = 1
Step 1: Initialize the number of clusters to k
Step 2: Generate k clusters based on the hierarchical clustering results
Step 3: Calculate the selected centroid of each cluster (which contains
Step 4: If all clusters has a selected centroid output all clusters with centroids, otherwise,
Figure 4 shows the dendrogram visualization of hierarchical clustering results of the seed terms in category “Functional status.” The centroids of these three clusters are calculated using Step 3 described above. If there are two terms in a cluster, the centroid is randomly selected. The terms “falling” and “falls” connected with light blue lines are within one cluster, “falls” is selected as the centroid. The terms “unsteady” and “unsteady gait” connected with green lines are in one cluster, and “unsteady” is selected as centroid. The terms “need help cooking/walking/driving/eating/bathing” connected with purple lines are within one cluster, and “need help eating” is selected as the centroid. The rest of the terms are clusters with only one word in it, such as “weak,” “slowing down,” and so on. For the GI symptoms, the terms “poor/no/decreased appetite” were in one cluster with “no appetite” as the centroid. The terms “bloating” and “cramping” were in one cluster with “bloating” as centroid. The terms “nausea” and “vomiting” were in one cluster with “nausea” as the centroid. The rest of the terms were independent clusters. For anxiety symptoms, the terms “nervous” and “nervousness” were in a cluster with “nervous” as the centroid. The terms “worry” and “worried” were in a cluster with “worry” as the centroid. The terms “panic” and “panic attack” were in a cluster with “panic” as the centroid. The rest of the terms were independent clusters. For cognitive issues, all terms were independent clusters. For fatigue symptoms, the terms “exhaustion” and “exhausted” were in a cluster with “exhaustion” as the cluster centroid. The terms “lethargic” and “lethargy” were in a cluster with “lethargic” as centroid. The rest of terms were independent clusters. For sleep issues, the terms “can’t fall asleep” and “can’t stay asleep” were in a cluster with “can’t fall asleep” as the centroid. The terms “restlessness” and “sleeplessness” were in a cluster with “restlessness” as the centroid. The rest of the terms were independent clusters. For depression symptoms, “depression” and “depressed” were in a cluster with “depression” as the centroid. The rest of the terms were independent clusters.
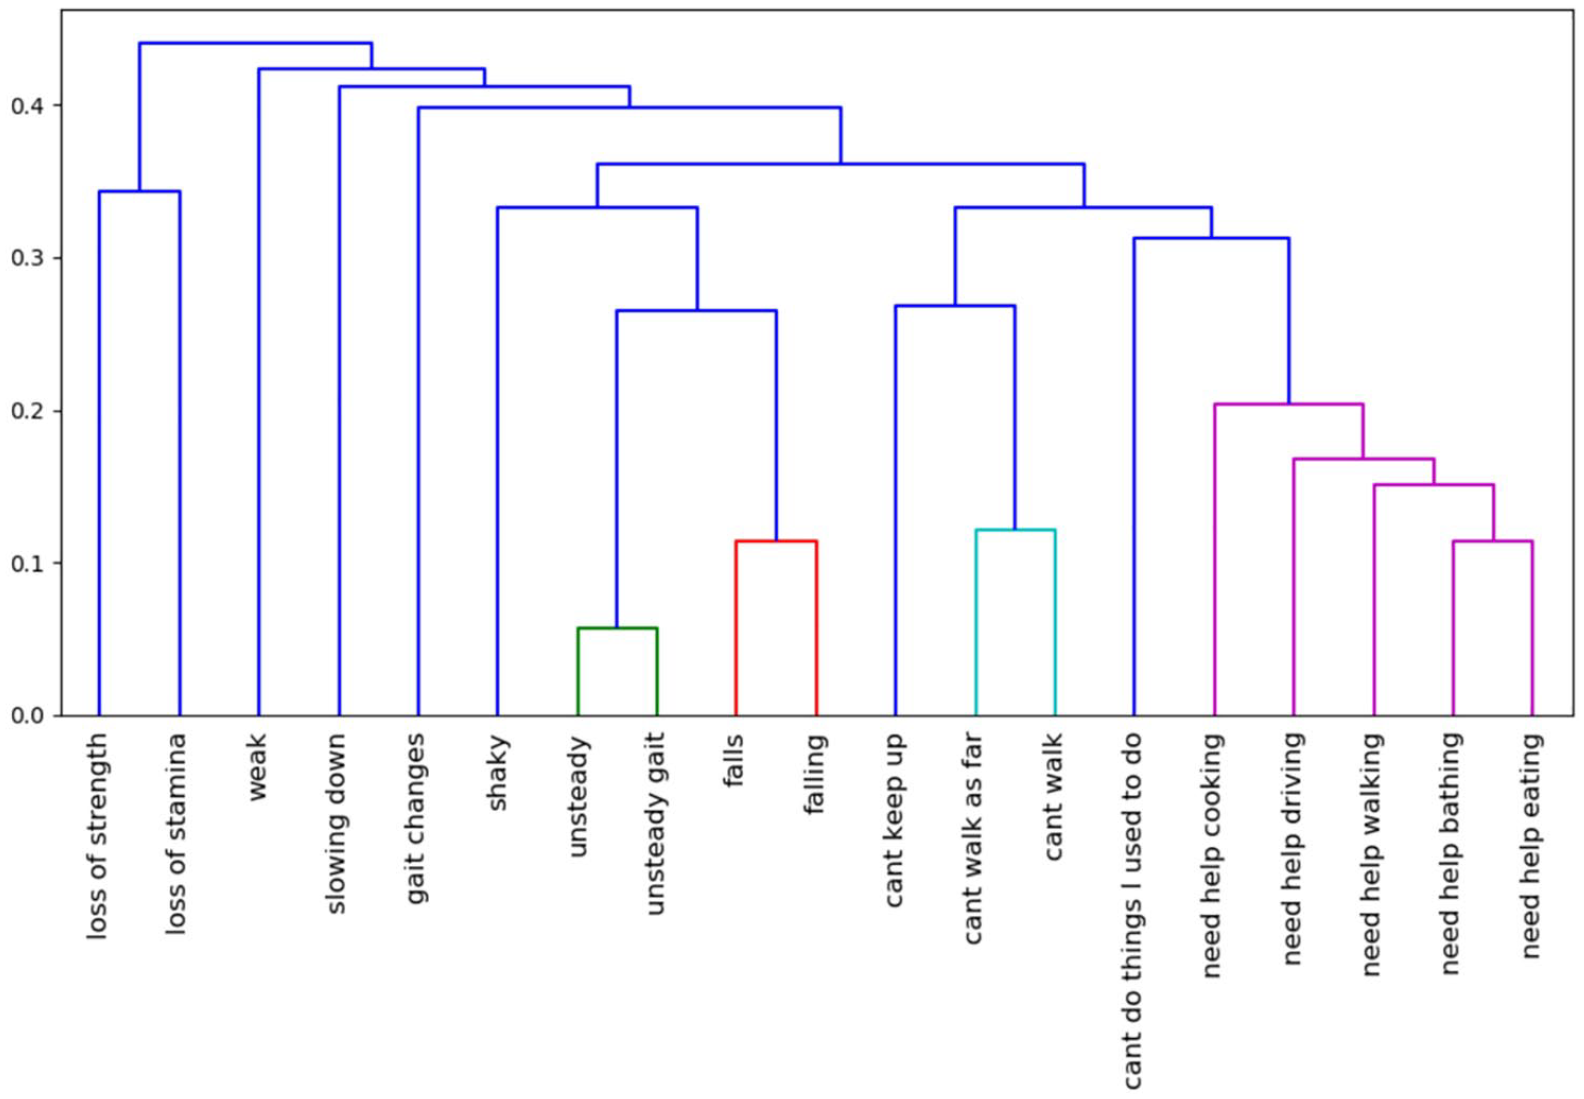
Hierarchical clustering results of the seed terms in category “functional status”.
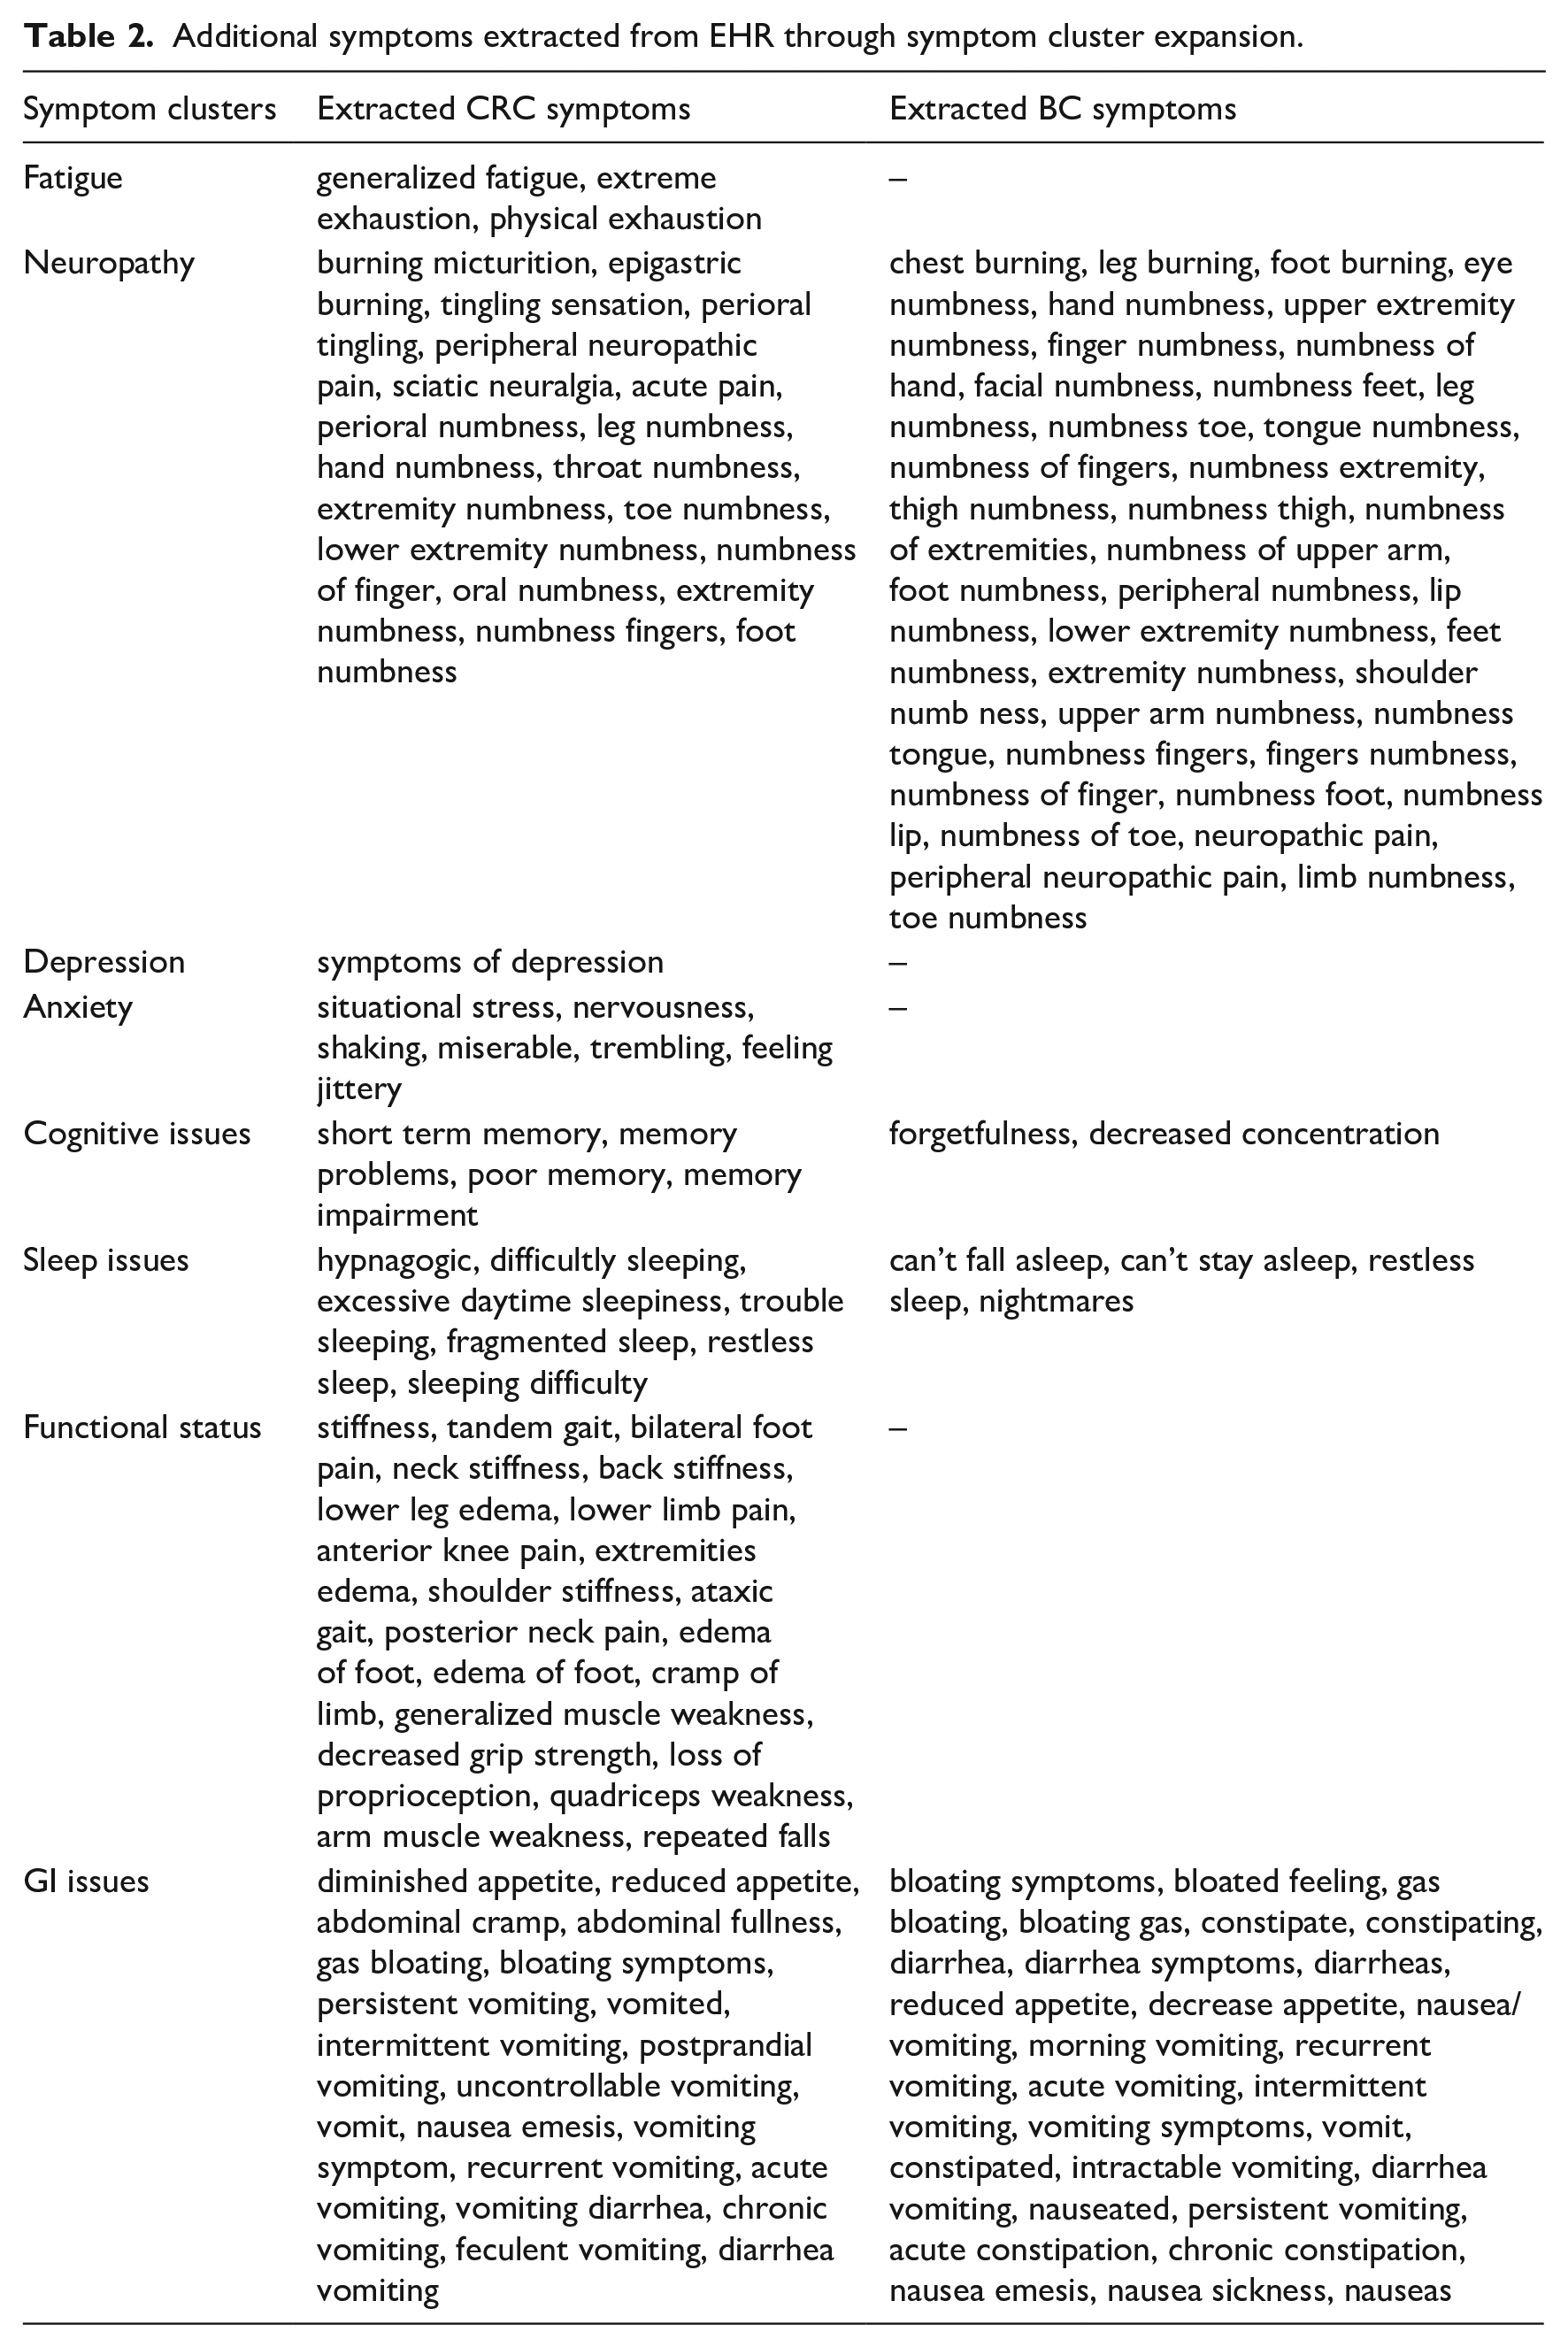
After the sub-clusters were identified, each symptom cluster is expanded through measuring the cosine similarity between the centroids of the clusters and the extracted terms from the EHR clinical notes. If cosine similarity between an extracted term and the centroid of a cluster is over the threshold θ (set to be 0.8 after we have done experiments with its value from 0.6 to 0.9), the extracted term was added to that cluster as a new representation. A new representation can be added to more than one cluster if it meets the requirements of the threshold. If the similarity between the extracted term and the centroid a cluster is below the threshold, it is not selected as a symptom relevant to the symptom clusters. For example, “cough” is an extracted symptom but close enough to any of the centroids. It will not be included in the symptoms. Through this process, terms extracted from the clinical notes were added to the clusters. For example, “neuropathic pain” is added to the cluster “Neuropathy”; “extreme exhaustion” is added to the “fatigue” cluster. Some symptoms, such as “finger numbness,” which has a body part to one of the seed symptoms clusters, are identified through this process. Table 2 shows the additional symptoms of CRC and BC cohorts extracted from the EHR, demonstrating that the semantic analysis and clustering algorithm are capable of identifying symptoms with similar semantic meaning within the EHR. Some typos are also captured through this analysis. Comparing the additional symptoms of the CRC and BC cohorts identified through the method, there are more neuropathy and GI symptom representations with the BC cohort, whereas more representations of functional status symptoms were extracted from the CRC cohort.
Additional symptoms extracted from EHR through symptom cluster expansion.
Frequency measure of the symptoms
This research aims to investigate the relationship between each symptom cluster and other variables, such as T2D status, of the study cohorts. We calculated the frequency of each symptom cluster within a timeframe using the document frequency (DF), which is often used in the NLP domain. In our study, each document is a clinical note. If a clinical note contains one or more than one symptom expression in one symptom cluster, the document frequency (DF) for that cluster is counted as 1. The higher the DF, the more frequently the same symptom clusters are reported to the physician in different clinical notes, indicating greater bother caused by the symptoms.
Statistical analysis
Descriptive statistics were used to describe demographic and medical characteristics, and covariates were summarized using frequencies with percentages (values in the parentheses) for categorical variables or means with standard deviations (values the parentheses) for continuous variables. Logistic regression (LR) was used to evaluate the effect of T2D on each of the eight symptoms (Fatigue, Anxiety, Cognitive Issues, Neuropathy, Sleep Issues, GI Issues, Functional Status, and Depression) during each of the three timeframes (within 6 months, between 12 to 18 months, and between 24 to 30 months) post the patient’s first chemotherapy. Logistic regression was performed with the symptom as the response variable, controlling for T2D, age, race, gender (only for CRC), and smoking status. All analyses were performed using SAS, version 9.4 (SAS Institute; Cary, NC).
Results
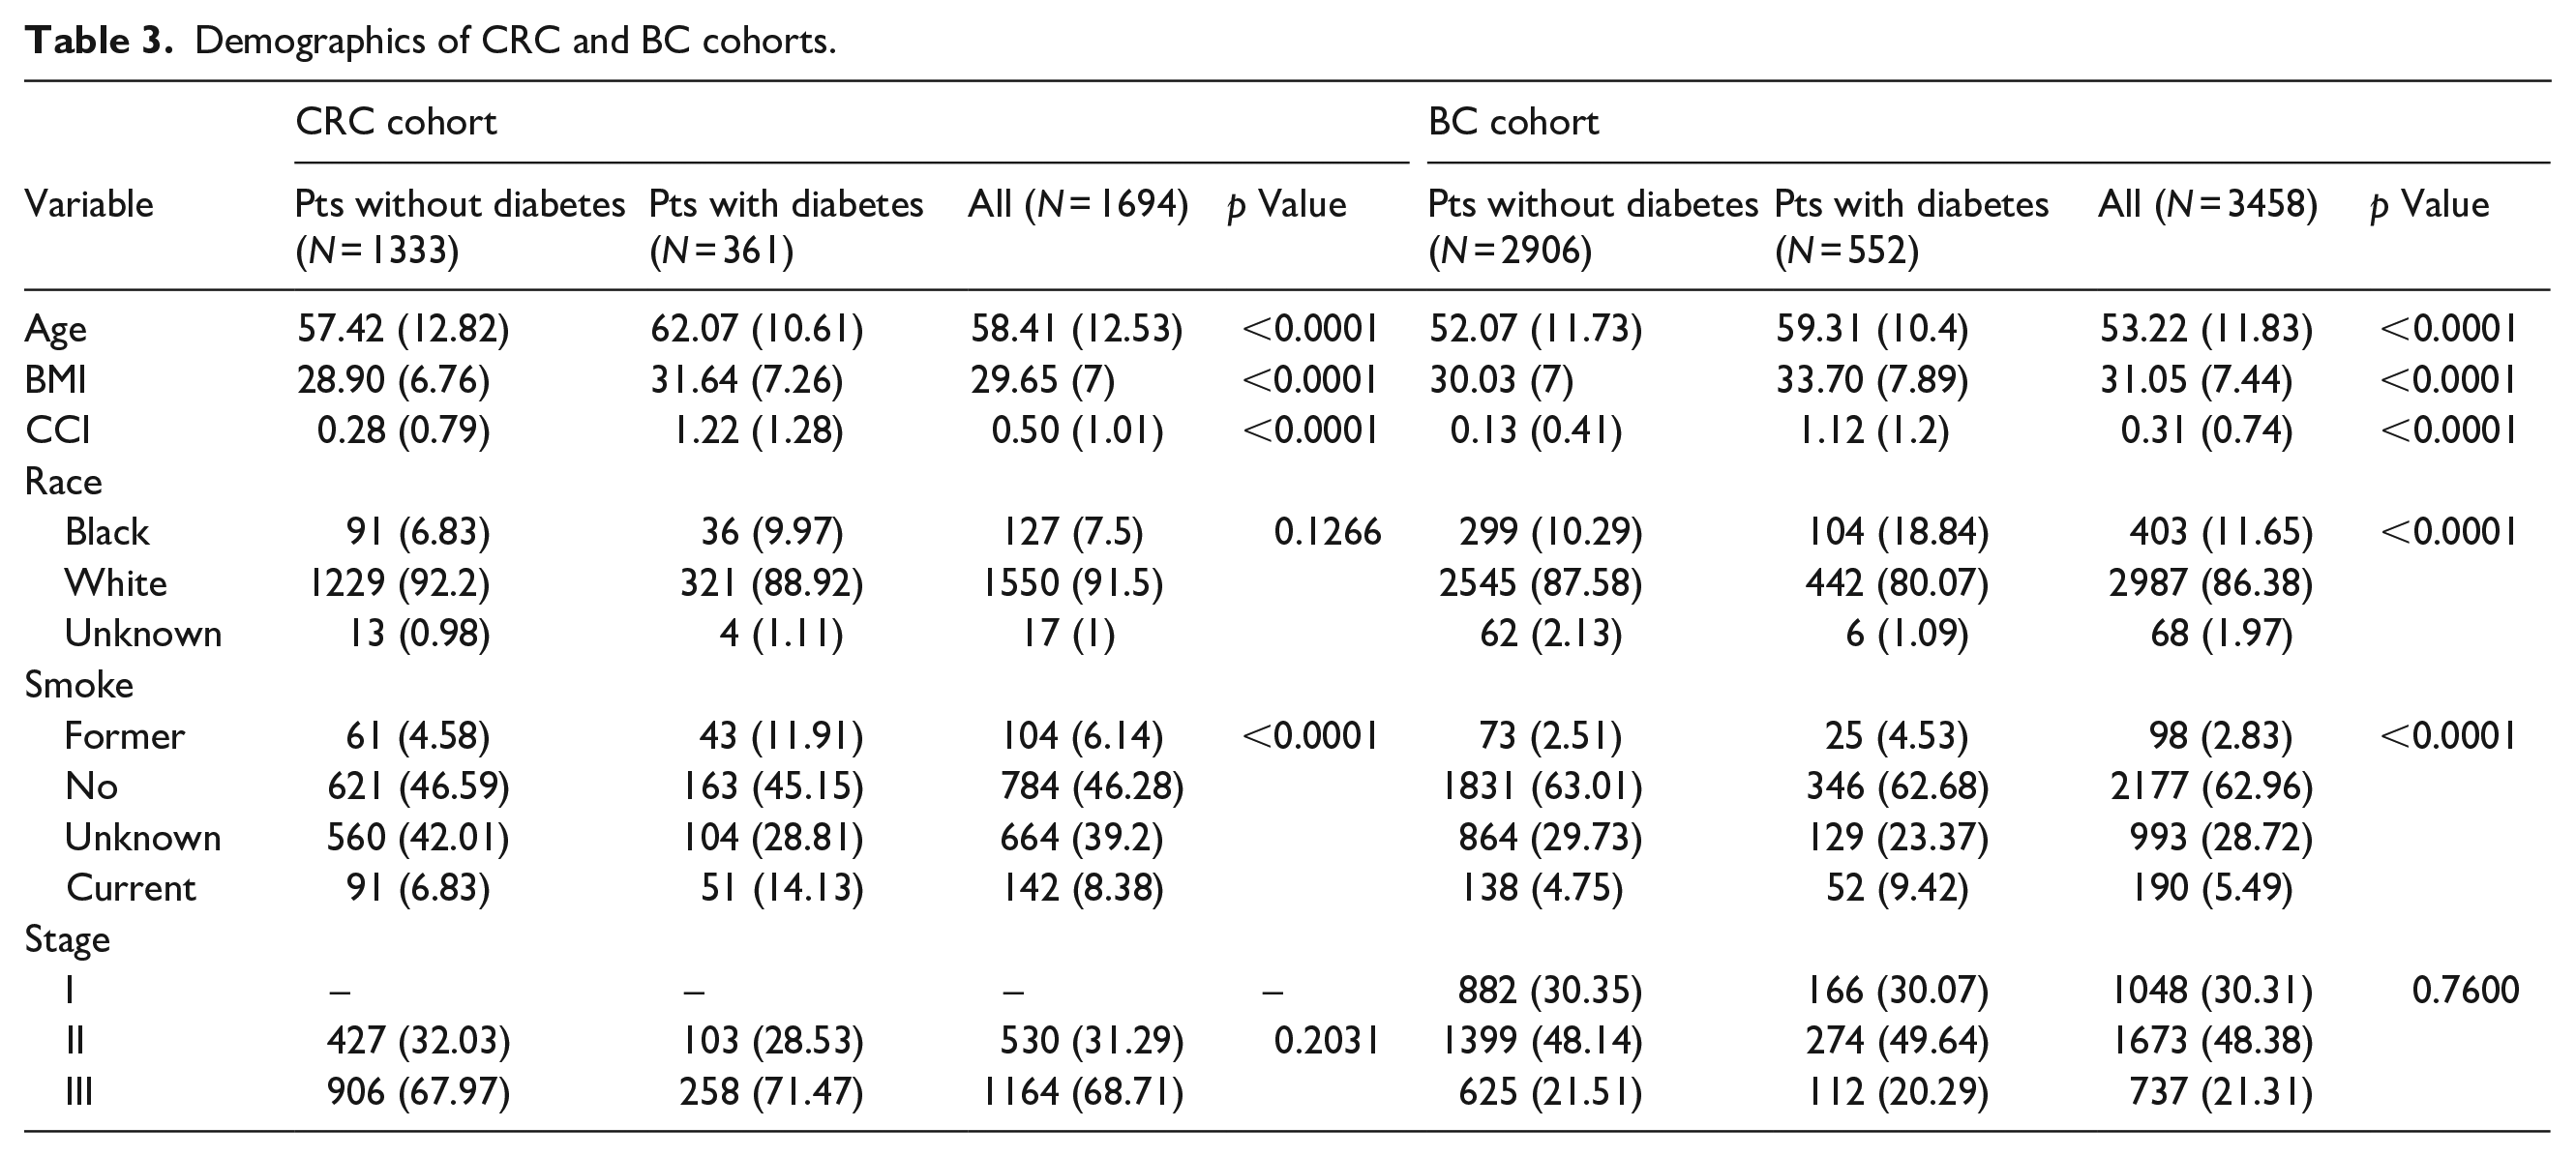
The clinical characteristics of the CRC cohort (n = 1694) and the BC cohort (n = 3458) are listed in Table 3. The percentage of patients’ with T2D is 21.3% in the CRC cohort, whereas the percentage of patients with T2D is 15.9% in the BC cohort. The mean age of the CRC cohort at diagnosis was 58.41 years, which is older than the mean age of the BC cohort at diagnosis (53.22 years). For both cohorts, the patients with T2D were older than the patients without T2D. This age difference is statistically significant (p < 0.0001). The mean BMI value of the CRC cohort is slightly less than that of the BC cohort, however for both cohorts those with T2D had higher BMI (p < 0.001) than those without T2D. The Charlson Comorbidity Index (CCI) value of the patients with T2D is much higher than that of the patients without T2D for both the CRC and BC cohorts. For the BC cohort, the ratio of black patients with T2D is higher than without T2D (p < 0.0001). For both cohorts, among former and current smokers, there are more patients with T2D (p < 0.0001).
Demographics of CRC and BC cohorts.
Symptom factor analysis: CRC patients with diabetes versus without diabetes
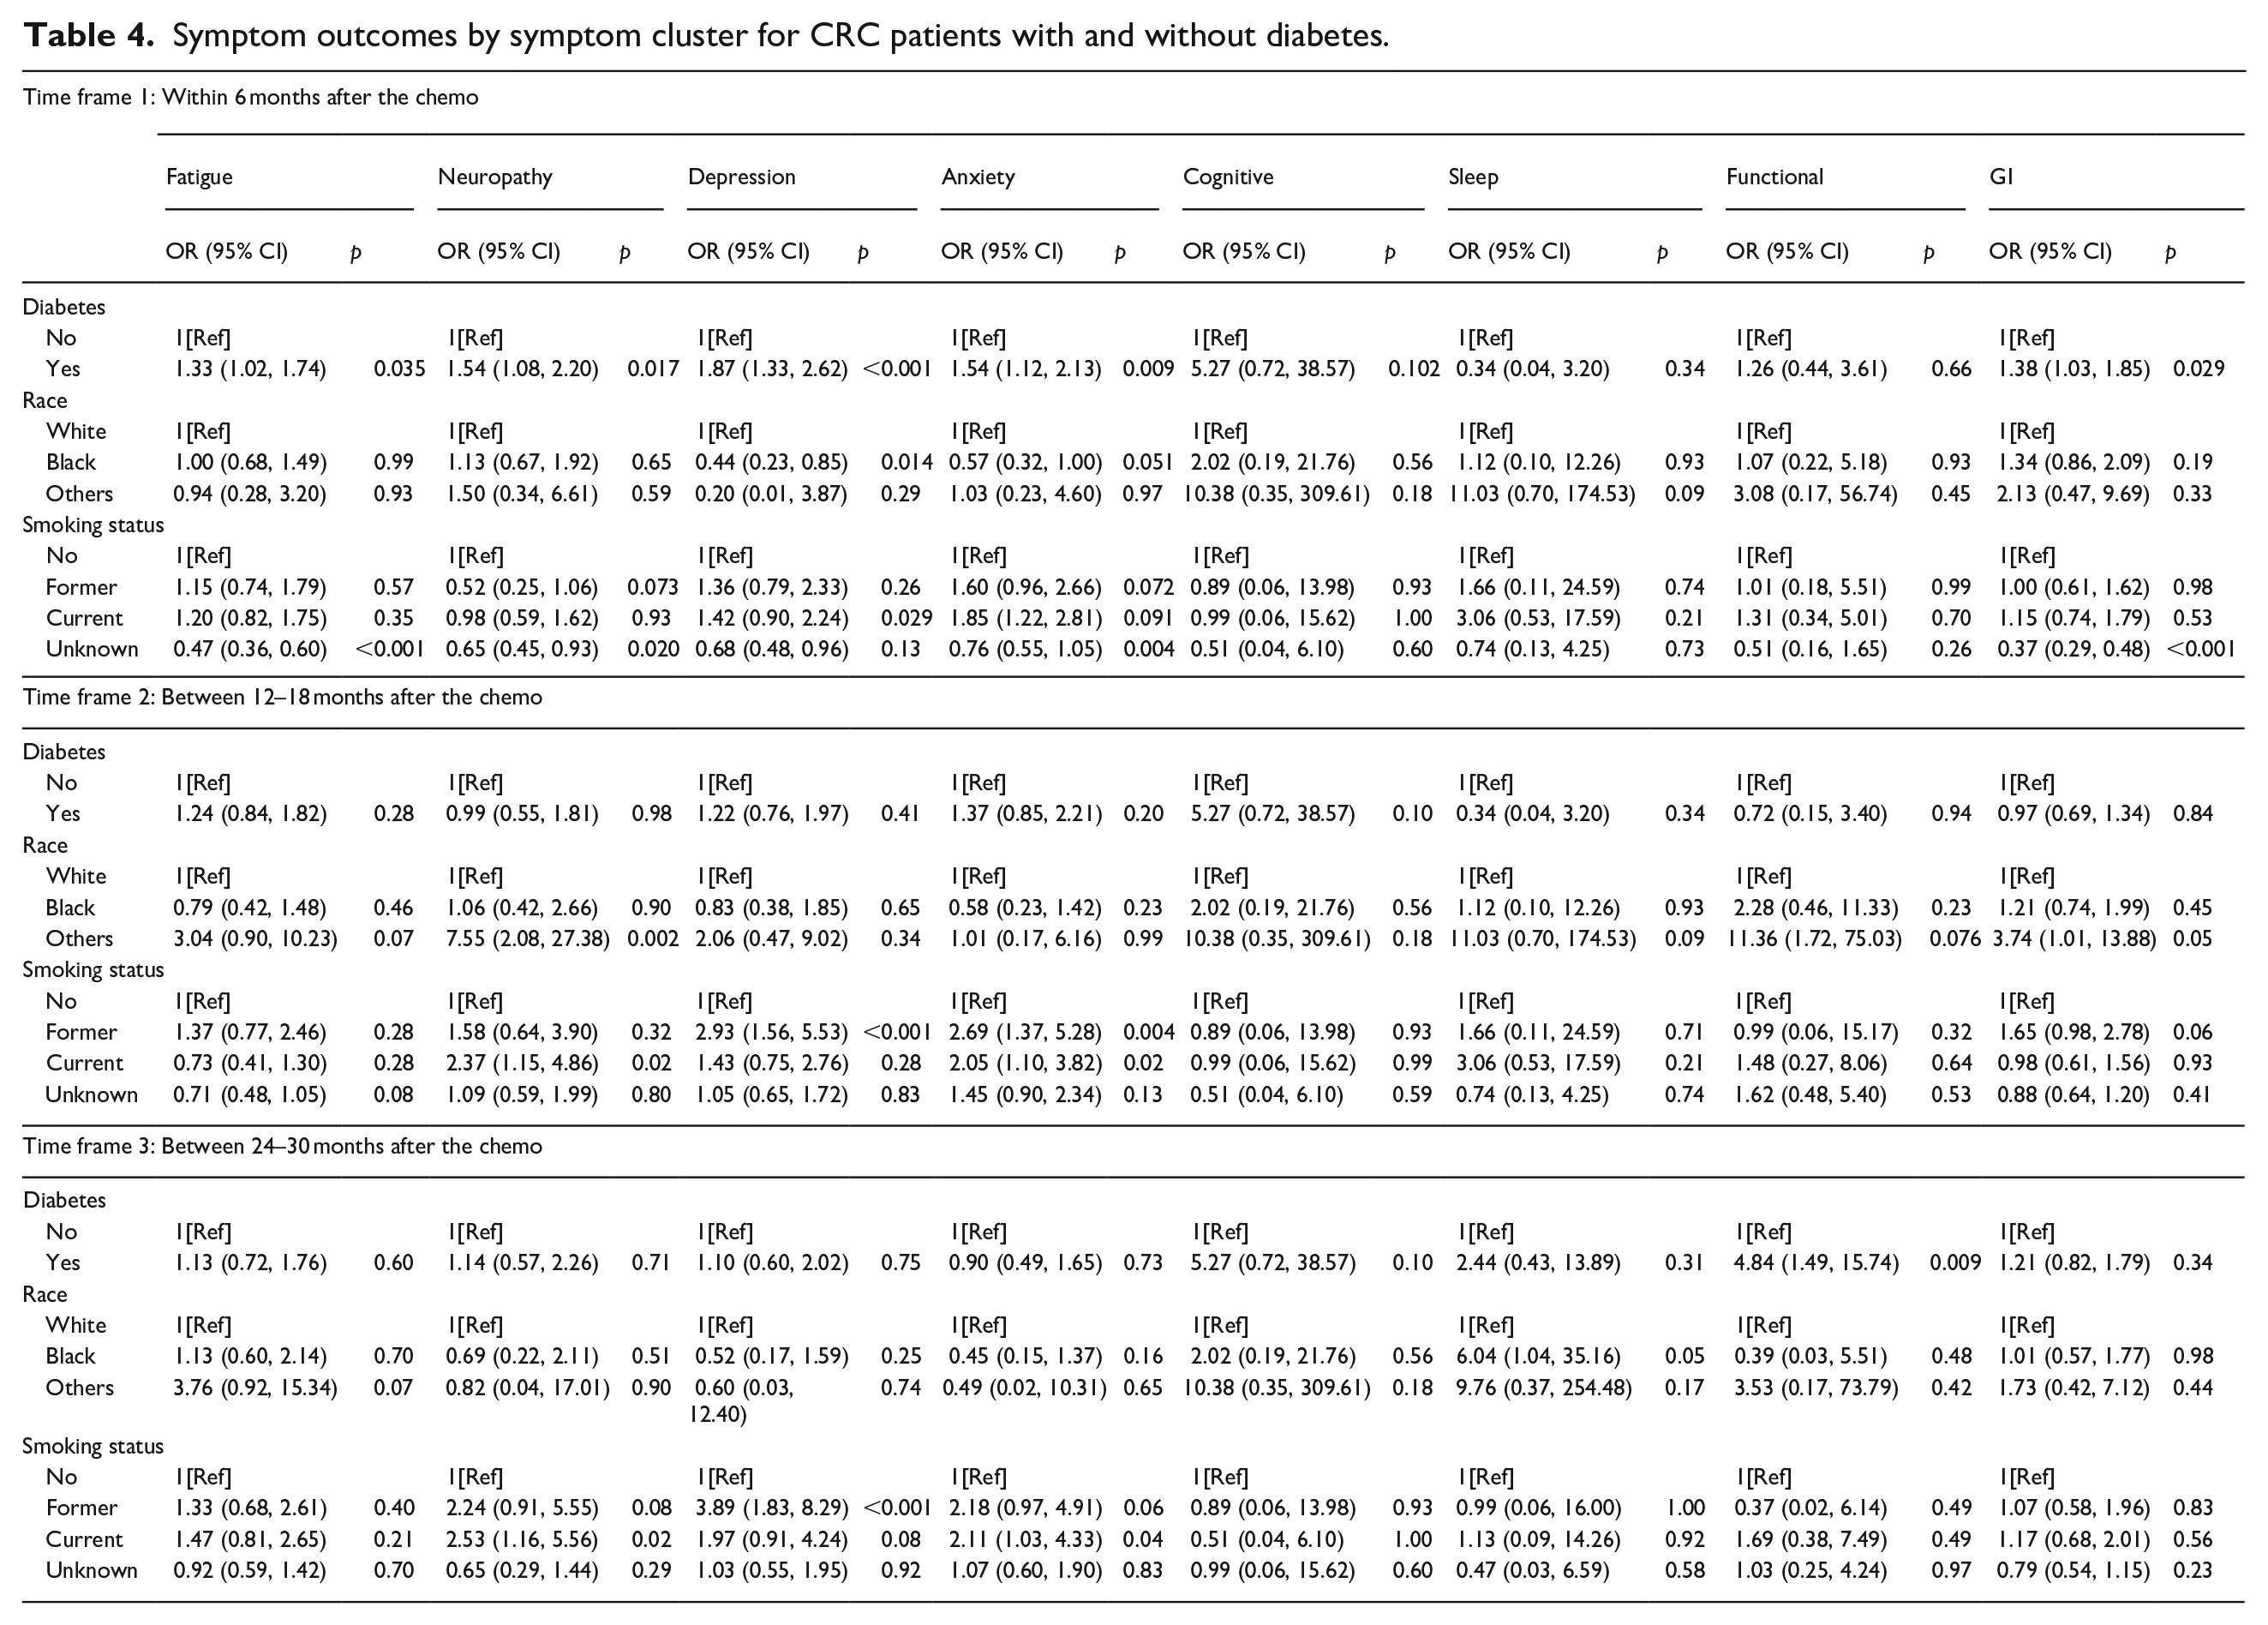
Table 4 presents the logistic analysis of outcomes of developing the symptom clusters of the CRC patients with and without T2D over the three-time frames post the first chemotherapy (within 6 months, between 12 to 18 months, and between 24 to 30 months). The results show that within the 6 months post chemotherapy, CRC patients with T2D had a higher risk for developing fatigue (OR, 1.33; p = 0.035), neuropathic symptoms (OR, 1.54; p = 0.017), depression (OR, 1.87; p < 0.001), anxiety (OR, 1.54; p = 0.009) and GI symptoms (OR, 1.38; p = 0.029). Patients who smoke (OR, 1.42; p = 0.029) are more likely to develop depression within 6 months after chemotherapy. It shows that black patients are less likely to develop depression (OR, 0.44; p = 0.014) compared to white patients within the 6 months after the chemotherapy. For the timeframe of 12 to 18 months post chemotherapy CRC with T2D did not show a high risk for developing any of these symptom clusters. However, patients who currently smoke have a higher risk to develop anxiety (OR, 2.05; p = 0.02) and peripheral neuropathy (OR, 2.37; p = 0.02), and patients who smoked formerly have higher risk to develop depression (OR, 2.93; p < 0.001) and anxiety (OR, 2.69; p = 0.004). For the timeframe of 24 to 30 months after chemotherapy, patients with T2D have a higher risk of developing functional related symptoms (OR, 4.84; p = 0.009), and patients who currently smoke have higher risk of anxiety (OR, 2.11; p = 0.04) and peripheral neuropathy (OR, 2.53; p = 0.02), and patients who smoked formerly have a higher risk to develop depression (OR, 3.89; p < 0.001).
Symptom outcomes by symptom cluster for CRC patients with and without diabetes.
Symptom factor analysis: BC patients with diabetes versus without diabetes
Table 5 presents the results of the logistic analysis of outcomes of developing the symptom clusters of the BC patients with and without T2D over the three timeframes post the first chemotherapy. The results show that within the 6 months after the chemotherapy, patient with T2D have a higher risk for developing fatigue (OR, 1.23; p = 0.05), depression (OR, 1.78; p < 0.001), anxiety (OR, 1.57; p < 0.001), functional issue (OR, 1.48; p = 0.004) and GI symptoms (OR, 1.50; p =0.05). Patients who currently smoke or smoke formerly were more likely to develop depression (OR, 2.69; p < 0.001; OR, 1.89; p = 0.006) and anxiety (OR, 1.81; p < 0.001; OR, 2.17; p < 0.001), and patients who smoke formerly have more risk to develop functional issues (OR, 2.83; p < 0.001) within the 6 months after chemotherapy. It shows that black patients are less likely to report depression (OR, 0.67; p = 0.01), anxiety (OR, 0.62; p < 0.001), and GI issues (OR, 0.66; p < 0.001) comparing to white patients within the 6 months after the chemotherapy.
Symptom outcomes of BC patients.
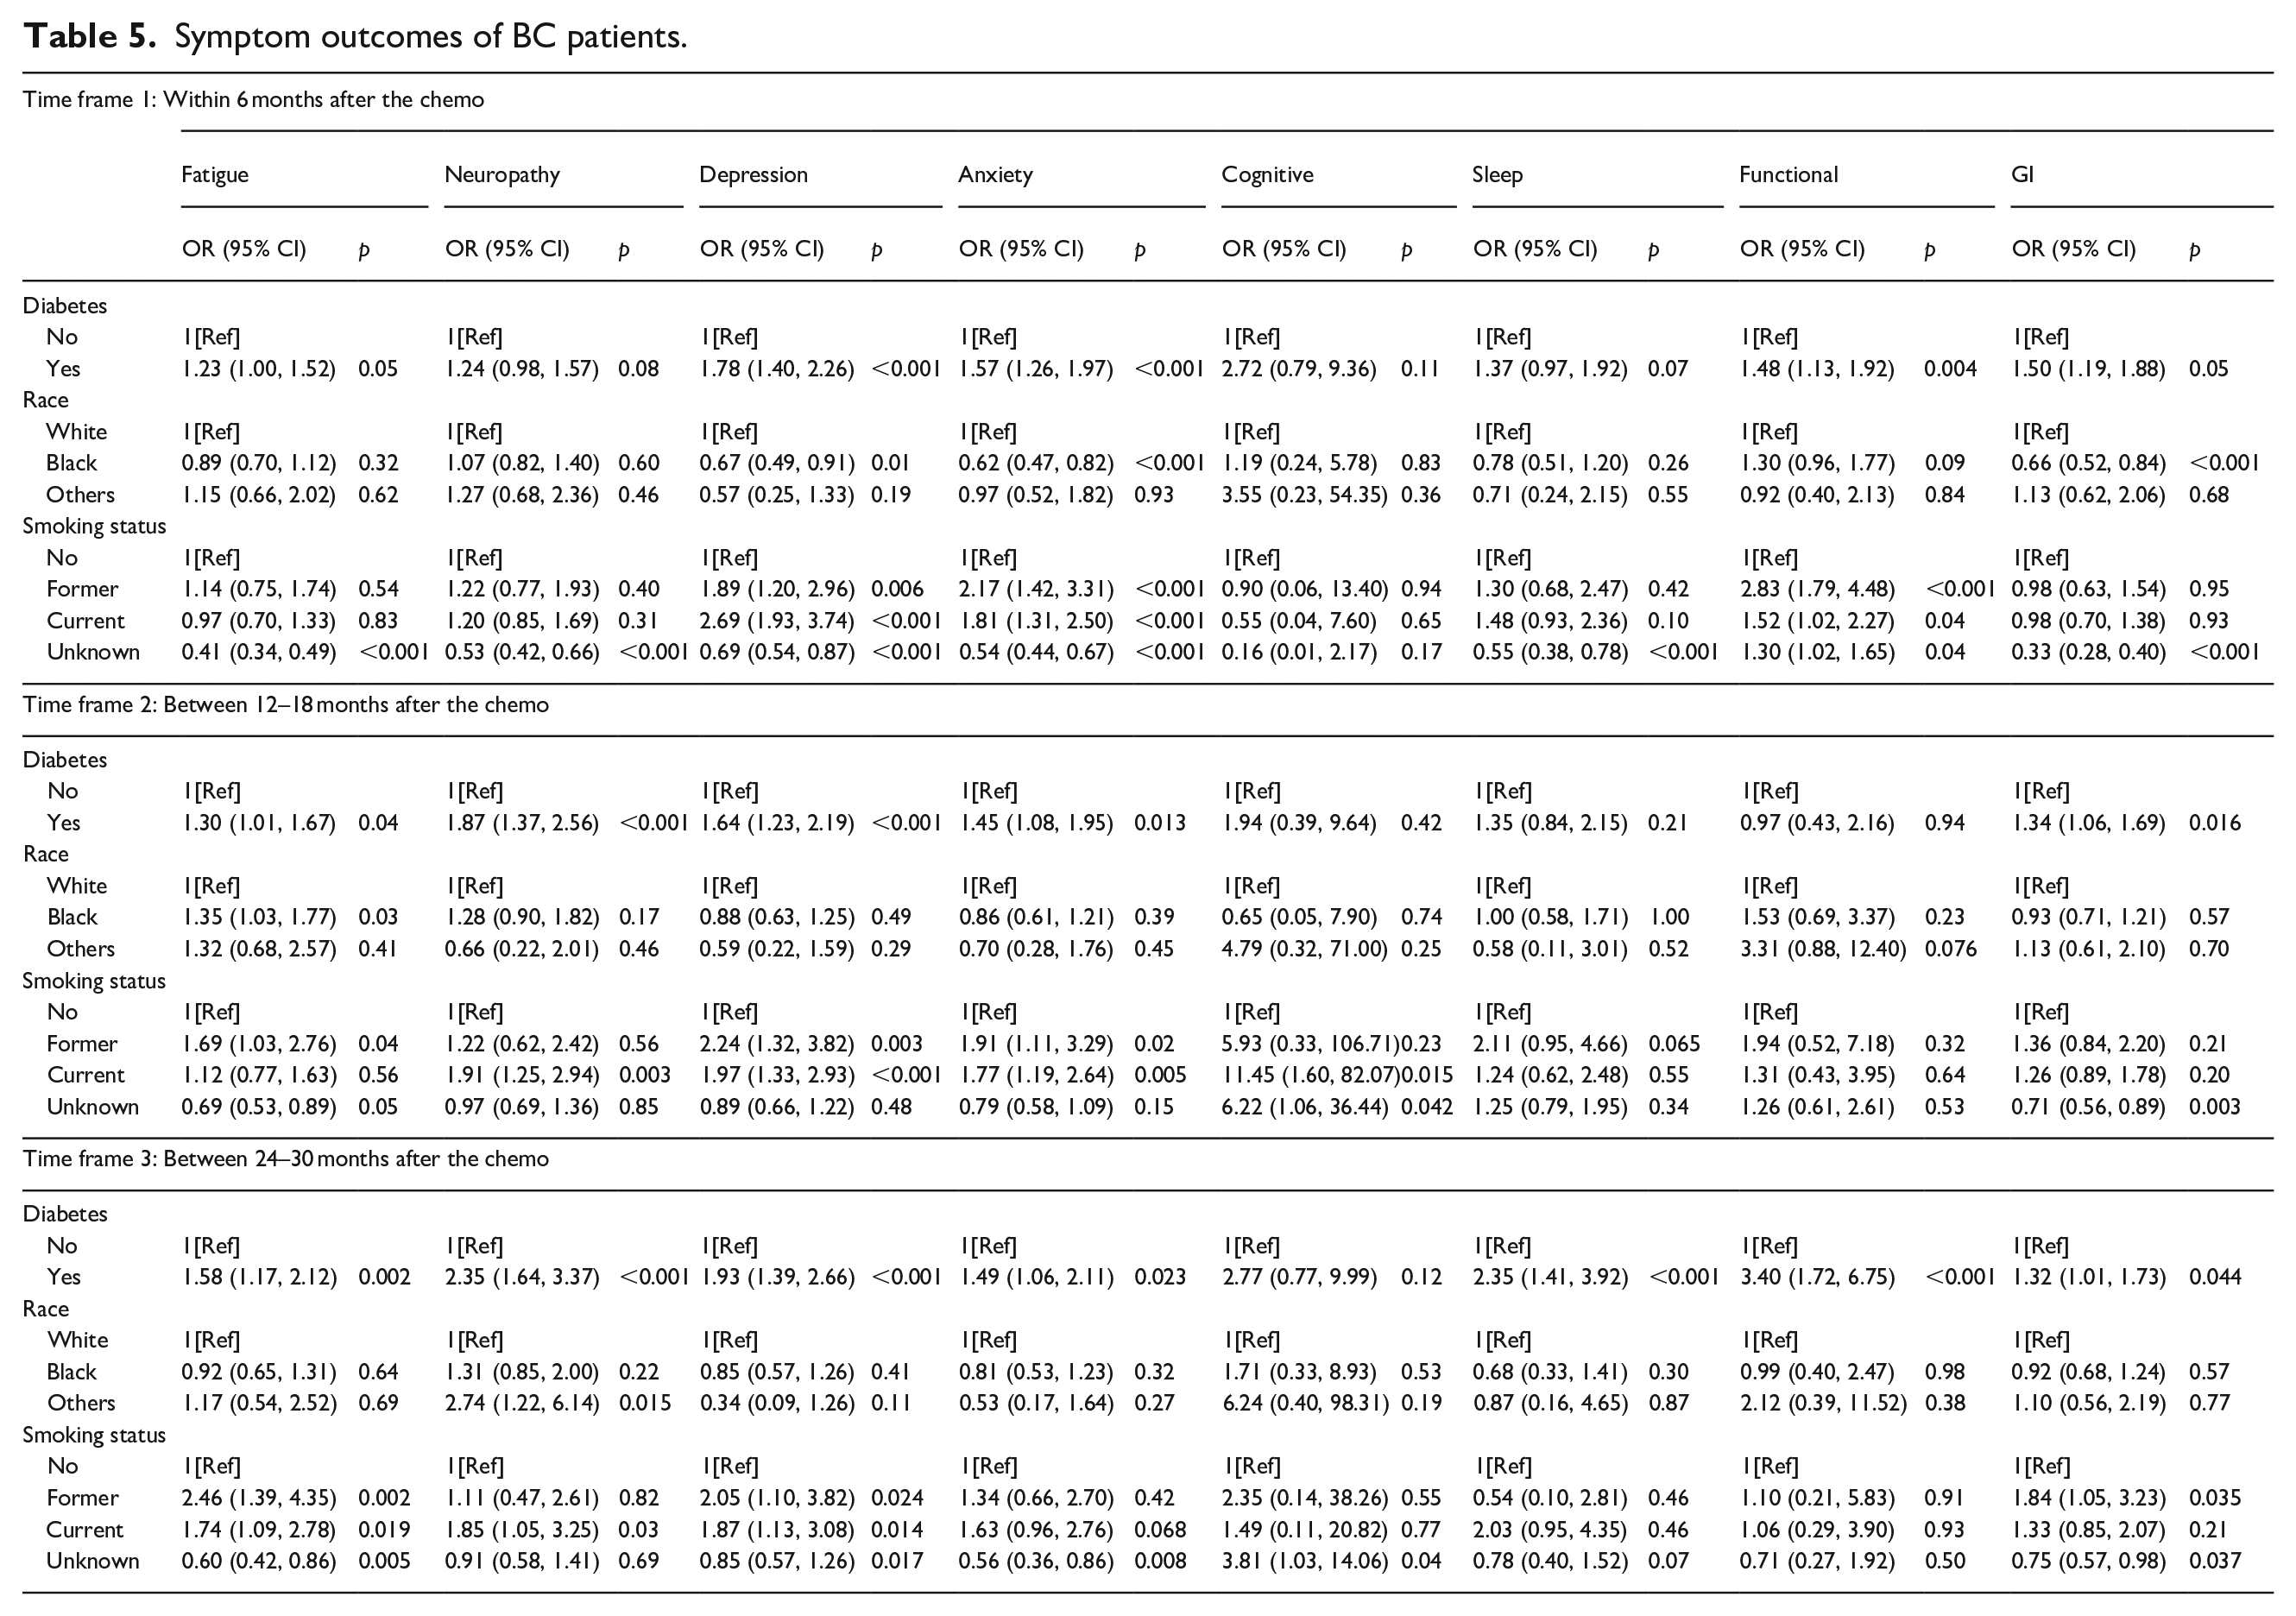
For the time frame of 12 to 18 months after chemotherapy, patients with T2D are more likely to report fatigue (OR, 1.30; p = 0.04), neuropathy (OR, 1.87; p < 0.001), depression (OR, 1.64; p < 0.001), anxiety (OR, 1.45; p = 0.013), and GI symptoms (OR, 1.34; p = 0.016). Comparing to white patients, black patients are more likely to develop fatigue (OR, 1.35; p = 0.03). Patients who smoked formerly have higher risk to develop fatigue (OR, 1.69; p = 0.04), depression (OR, 2.24; p = 0.003), and anxiety (OR, 1.91, p = 0.02), and patients who currently smoke have higher risk to develop neuropathy (OR, 1.91; p = 0.003), depression (OR, 1.97; p < 0.001), anxiety (OR, 1.77; p = 0.005), and cognitive issues (OR, 11.45; p = 0.015).
For the time frame of 24 to 30 months after chemotherapy, patients with T2D are at higher risks for develop fatigue (OR, 1.58; p = 0.002), neuropathy (OR, 2.35; p < 0.001), depression (OR, 1.93; p < 0.001), anxiety (OR, 1.49; p = 0.023), sleep issue (OR, 2.35; p < 0.001), functional issue (OR, 3.40; p < 0.001), and GI symptoms (OR, 1.32; p = 0.044). Patients who smoked formerly have higher risk of developing fatigue (OR, 2.46; p = 0.002), depression (OR, 2.05; p = 0.024), and GI issues (OR, 1.84; p = 0.035), and patients who currently smoke have higher risk to develop fatigue (OR, 1.74; p = 0.019), peripheral neuropathy (OR, 1.85; p = 0.03), depression (OR, 1.87; p = 0.014).
Discussion
Symptom science experts recommend evaluating EHR and its utility in symptom cluster research. 33 The primary focus to date in Big Data analysis of EHRs has been to establish prediction models for disease development, prognosis, and resource utilization13,34–37 with little emphasis on its use for exploration of symptoms. To our knowledge, this is one of the first studies to use NLP processing techniques in unstructured data from the EHR to identify symptoms of CRC and BC with and without T2D across three key timeframes in the cancer trajectory.
Links between T2D and the development of CRC and BC have been well documented.38–42 Patients with CRC and, BC, and people with T2D experience similar symptoms.25,43–45 However, understanding the effects of the combination of CRC or BC and T2D on symptoms is lacking. In this study, we found CRC and BC patients with T2D were more likely to report symptoms than CRC and BC without T2D over three timeframes in the cancer trajectory. These findings are consistent with the few studies found, which noted that CRC or BC patients with T2D reported more symptoms than their non-T2D counterparts.19–21,44 However, these studies utilized symptom measurement-scales and were primarily cross-sectional study designs.
Colorectal cancer
Among CRC patients, we found those with T2D reported more symptoms at two of the three timeframes than their counterparts without T2D. Within 6 months of cancer diagnosis, CRC with T2D reported more fatigue, depression, neuropathy, anxiety, and GI issues than those CRC without T2D. The initial 6 months around chemotherapy administration is a critical time period for patients, as treatment regimens are initiated many of which are known to cause and/or perpetuate the worsening of symptoms.5,46,47 In addition, treatment regimens often include drugs that challenge glucose self-management and regulation 47 and self-management of diabetes 48 which could exacerbate symptoms. We also found at the 24–30 month post chemotherapy timeframe, CRC patients with T2D reported only symptoms associated with functional status. The long-term effects of cancer treatment on the symptoms among CRC patients has been documented to include fatigue, insomnia, 49 and neuropathy,50,51 all of which have been associated with decreased function and quality of life. In our study, functional status was defined broadly and included both neuropathic and other physical functional symptoms, thus, precluding our ability to determine which symptoms specifically contributed to the long-term functional symptoms. More research is needed to examine the relationship of T2D on symptoms of CRC patients longitudinally. Interestingly, we did not find a significant difference in the symptoms reported by the CRC with and without T2D at the 12–18 month time-period. This time-period is associated with the cessation treatment, which may decrease the intensity of acute side effects associated with active treatment. This reprieve in acute symptoms may result in fewer symptoms reported, however, as time progresses and acute symptoms fade, long-term lingering effects may become more prominent.
Breast cancer
In our study, BC patients with T2D consistently reported four symptoms (fatigue, depression, anxiety and GI issues) across the three timeframes. Functional issues were reported along with the four symptoms at the 6- and 24–30-month intervals. Neuropathy was reported at the 12–18- and 24–30-month time-periods. BC with T2D, reported most symptoms at the latest timeframe which included all symptoms with the addition of sleep symptoms. Other researchers have also noted these symptoms and others to linger several years after receipt of treatment for cancer52–55 causing concern for BC patients and impacting quality of life. 16 The effect of T2D on the symptoms of BC patients has not been well described. Tang et al, 2016 noted among BC patients, those with T2D reported lower scores on physical, emotional and social function, and higher symptom scores (greater symptoms) such as fatigue, GI issues, and insomnia than BC patients without T2D. 16 However, this study included the self-report of a T2D diagnosis rather than use of ICD codes. Similarly, another researcher noted among BC patients, 3–8 years post cancer diagnosis, those with T2D reported poorer physical and attention function more sleep disturbance, and greater fatigue than women with breast cancer without T2D. 44 Both studies used standard symptom measures versus the symptoms described by the BC patient to the healthcare provider. More research is warranted to understand the symptoms experienced by BC with T2D to facilitate the identification of subsets of cancer patients that may be at risk for higher symptom profiles.
When comparing the symptom profiles of patients from both cancer diagnoses, we found CRC patients with T2D were more likely to report symptoms early in the treatment period, with no symptoms reported at 12–18 months (typically cessation of treatment) and symptoms being reported again at the later period (24–30 months post cancer diagnosis). Whereas BC patients reported symptoms over all three of the timeframes. A finding also noted in our previous study that examined T2D and three symptoms among CRC and BC patient over 12 months. 15 This finding may be a result of gender differences in the groups. Research examining the role of gender on symptoms is inconclusive. With some studies indicating men with cancer, experience some symptoms more than women, and others reporting women experience more symptoms.55–58 In our study, the sample of BC patients included only women, whereas the CRC sample included both men and women. It is possible that this finding may have been influenced by the mix of genders in our CRC sample and may have been similar to the BC findings if we had included only women with CRC in the analysis. Additionally, the different chemotherapy drugs used to treat the specific cancers may also contribute to the type and duration of symptoms. More studies that examine gender differences and symptoms among cancer survivors are warranted.
We found race was associated with higher reporting of symptoms. In our study, Caucasian CRC and BC patients, were more like to report depression (CRC and BC), anxiety, and GI issues (BC) than black CRC or BC patients. This finding may be a result of the lack of ethnic diversity in the sample as the majority of the subjects in our study were Caucasian. Additionally, black patients often have less access to healthcare and cancer resources,59,60 making the assessment and documentation of their symptoms more difficult to acquire. Understanding the role of ethnicity in the symptoms of cancer patients is important to explore and could facilitate the treatment of symptoms.
Current smoking status was associated with symptoms in CRC and BC patients. We found current smokers were more likely to report anxiety (CRC, BC), neuropathic symptoms (CRC, BC), anxiety (BC), and depression (BC) than non-smokers. Research suggests that people with higher anxiety are more likely to smoke61,62 and that smoking may in turn increase anxiety through biological pathways. 61 Similarly, smokers have been shown to have a higher risk for depression.62,63 The role of smoking as a risk factor for neuropathy is equivocal with some studies finding a link between smoking and neuropathy, 64 while others do not. 65
Our study has several strengths, the use of unstructured symptom data is novel. Capturing the description of the symptom experience from the CRC and BC patients in real time during interactions with healthcare providers is important and can help to develop tailored assessment and self-management strategies for those at high risk. To our knowledge this is one of the first studies to use EHR’s to study symptoms to study two common cancer types of which many patients have comorbid T2D. Analysis of unstructured EHR data provides a foundation upon which interventions for symptom management can be tailored to the unique needs of patients with CRC or BC and T2D. The findings of our study must be considered in light of its limitations. Although we were able to count the documented frequency of the self-reported symptoms from CRC and BC patients, we were unable to measure the severity and/or distress caused by these symptom(s) and its impact on daily activity or quality of life. While the patients in each cancer group were in earlier stages of their cancer diagnoses, we did not control for variations in chemotherapy regimens which may have influenced the symptoms. Lastly, we were unable to measure lifestyle habits (diet, exercise, medication adherence) between CRC and BC patients with and without T2D, which may have also contributed to symptoms.
Limitations of the study
The UMLS MetaMap was used to identify the possible symptoms concepts from the clinical notes. Although word sense disambiguation (WSD) was used and negation detection of the UMLS MetaMap was turned on to extract the symptom concepts, because of the limitation of the WSD and negation detection of UMLS MetaMap, there could be some relevant symptom concepts that might be left out. The overall approach relies on provided seed symptoms to capture all the possible relevant symptom representations within the clinical notes. The seed symptoms need to have a good semantic coverage of the symptom representations to capture the relevant symptom concepts within the clinical notes.
Conclusions
As cancer survivorship continues to increase due to advances in treatment, management of comorbid conditions in people with cancer is becoming increasingly important. Using EHR data to identify and examine symptoms in CRC and BC with T2D represents an initial step toward understanding their association of comorbid conditions. A comprehensive understanding of symptoms specific to CRC and BC patients with comorbid T2D is critical to guide clinical practice and strategies to mitigate symptoms.
Footnotes
Declaration of conflicting interests
The author declared no potential conflicts of interest with respect to the research, authorship, and/or publication of this article.
Funding
The author(s) disclosed receipt of the following financial support for the research, authorship, and/or publication of this article: This study was funded in part by a Research Investment Fund from the Indiana University School of Nursing (PI Storey), a Release Time for Research award from the Indiana University Purdue University Indianapolis Office of the Vice Chancellor for Research (Dr. Storey), and an RE01 from the Oncology Nursing Foundation (PI Storey).