
Abstract
Pharmacovigilance involves monitoring of drugs and their adverse drug reactions (ADRs) and is essential for their safety post-marketing. Because of the different types and structures of medical databases, several previous surveillance studies have analyzed only one database. In the present study, we extracted potential drug–ADR pairs from electronic health record (EHR) data using the MetaNurse algorithm and analyzed them using the Korean Adverse Event Reporting System (KAERS) database for systematic validation. The Medical Dictionary for Regulatory Activities (MedDRA) and World Health Organization (WHO) Adverse Reactions Terminology (WHO-ART) were mapped for signal detection. We used the Side Effect Resource (SIDER) database to select 2663 drug-ADR pairs to investigate unknown drug-induced ADRs. The reporting odds ratio (ROR) value was calculated for the drug-exposed and non-exposed groups of drug–ADR pairs, and 19 potential pairs showed significant signals. Appropriate terminology systems and criteria are needed to handle diverse medical databases.
Keywords
Introduction
Pharmacovigilance, described by the World Health Organization (WHO) 1 as the science and activities related to the detection, assessment, and prevention of adverse effects or any other drug-related problem, is a primary method of ensuring drug safety. 2 Post-marketing surveillance, a part of pharmacovigilance, is crucial for monitoring the safety of drugs post-marketing. However, as post-marketing surveillances of all marketed drugs are practically difficult, an appropriate pharmacovigilance model is needed to manage drug safety.3,4 Furthermore, it is important to document and analyze adverse drug reactions (ADRs), which can extend hospitalization, lead to physical or mental health damage, and cause death. 5
Recently, several studies have used electronic health record (EHR) data and spontaneous reporting data for active surveillances of drugs.6–8 EHR, a digital equivalent of paper records or charts, can provide information for post-marketing surveillances, such as treatment data and patient medical histories collected by individuals in clinical practice. The Food and Drug Administration (FDA) Adverse Event Reporting System (FAERS) 9 has become an important resource in post-marketing surveillance of ADR signals. Similarly, the Korea Ministry of Food and Drug Safety (MFDS) 10 has the Korea Adverse Event Reporting System (KAERS). Both systems involve spontaneous reporting of ADRs, and are commonly used methods to detect ADRs from spontaneous reports, including proportional reporting ratio (PRR), reporting odds ratio (ROR), information component (IC), and empirical Bayesian geometric mean (EBGM). 11
Extracting ADRs from laboratory data on specific medications has been the primary strategy of EHR-based pharmacovigilance studies. 12 The algorithms used in the present study, MetaLAB 12 and MetaNurse, 12 are two of the most representative. As the names suggest, MetaLAB analyzes data based on lab results and MetaNurse analyzes data based on the standard nursing statements used by Seoul National University Hospital (SNUH), for 101 specific drugs. These two algorithms improved the previous version of the electronic health record-based pharmacovigilance method, called CLEAR, 13 by overcoming the limited number of drugs and results.
In this study, we used the EHR data and the Korea Institute of Drug Safety KAERS Database (KIDS-KD) 14 to detect ADRs. As the EHR data and KIDS-KD have specific advantages, they can be used to generate a new, improved pharmacovigilance model. To verify each step of detection, we used several drug search engines to confirm the prescription uses and active ingredients of drugs, as well as Side Effect Resource (SIDER 4.1) 15 to validate the drug signals. We tried to validate drug–ADR pairs that showed a potential signal in the EHR data using the KIDS-KD. As two different databases are used, we processed by mapping different terminology systems and setting criteria for symptoms. Through statistical analysis, we identified the drug–ADR pairs that showed a significant signal in both databases.
Methods
MetaNurse algorithm
MetaNurse is a signal detection algorithm based on the EHR data of all inpatients obtained from January 1, 2005 to December 31, 2011 at SNUH. 12 The algorithm determines the frequency of standard nursing statements (SNSs) or ADR symptoms and quantifies symptoms that were found only through observation by nurses. There are four steps in the MetaNurse algorithm, subject sampling, variable adjustment, signal refinement, and ADR signal detection. The Cox proportional-hazards ratio method was applied with adjustments for age, sex, department recognition, and disease severity. In MetaNurse algorithm, 101 drugs and 758 ADRs were used to detect ADR signals.
Drug–ADR pair selection
The total number of drug–ADR pairs extracted through MetaNurse was 69,071 (drugs: 101; ADRs: 757). We used indications and adverse effect information provided by SIDER (version 4.1), to select potential drug–ADR pairs. In SIDER 4.1, we obtained information from the usage sections of the drug labels, which provide information about proteins, chemicals, indications, adverse effects, and frequency. 15 In SIDER, the preferred terms from the Medical Dictionary for Regulatory Activities (MedDRA), which was developed by the International Council for Harmonization (ICH) of Technical Requirements for Pharmaceuticals for Human Use for standard medical terms, were used for adverse effects. 16 MedDRA terms are grouped in the order of the lowest level, lower level terms (LLTs), preferred terms (PTs), high-level terms (HLTs), high-level group terms (HLGTs), and system organ class (SOC) levels. Drug–ADR pairs containing SOCs selected for each drug were excluded from the study. In addition, only pairs with a hazard ratio of 2 or more and a p-value of less than 0.05, obtained through the Cox proportional-hazards model, were filtered. Finally, 2663 drug–ADR pairs that were not recognized in SIDER were selected. The process of drug–ADR pair selection is shown in Figure 1.
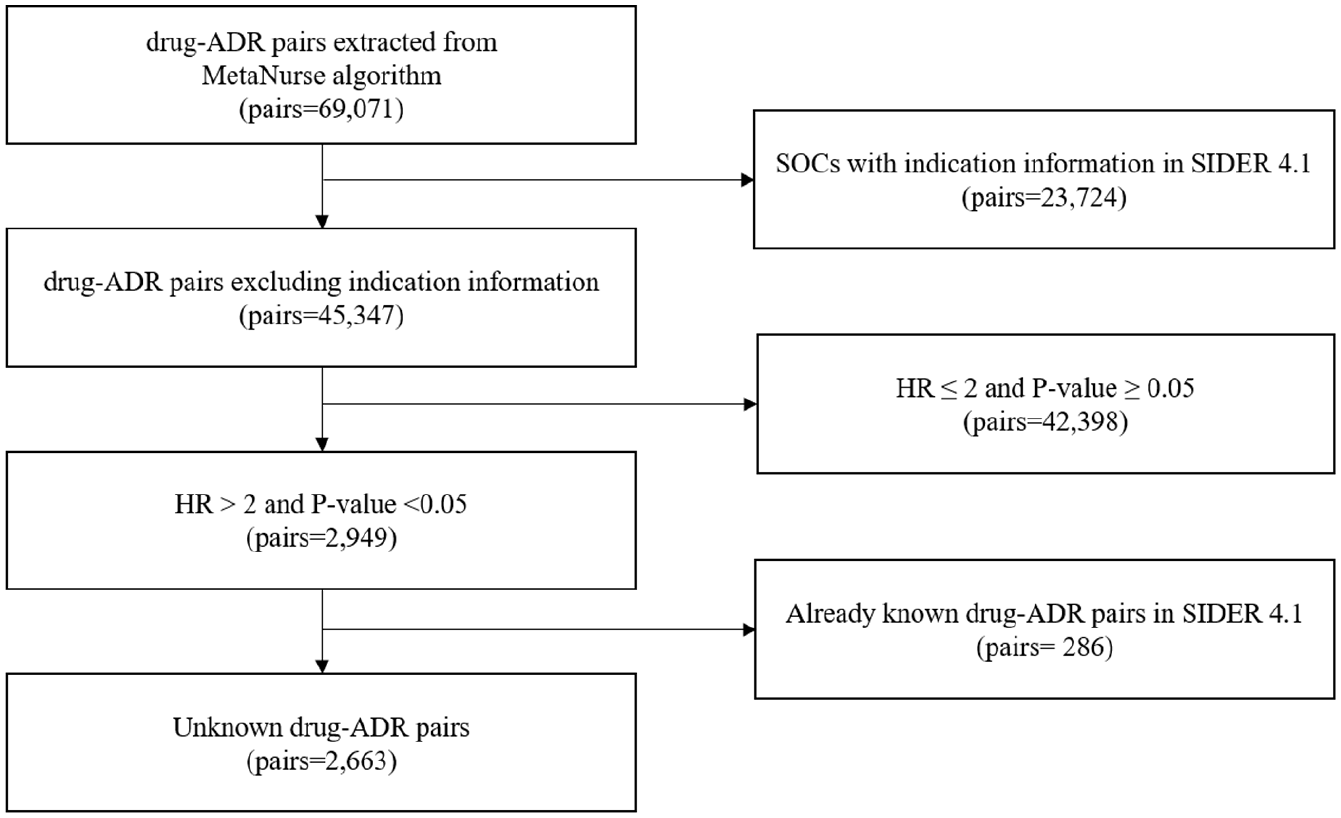
Process of drug–ADR pair selection.
Data sources
We used two different data sources, namely, EHR and KIDS-KD. We reviewed previous EHR-based pharmacovigilance studies using MetaNurse. 12 The KIDS-KD includes the date of reporting, name of the complainant, patient information, name of the suspected drug ingredient, and serious ADRs coded by PT of the WHO Adverse Reaction Terminology (WHO-ART). 14 The KIDS-KD reports events from January 1, 2013 to December 31, 2017. The protocol for the detection of ADRs is shown in Figure 2.
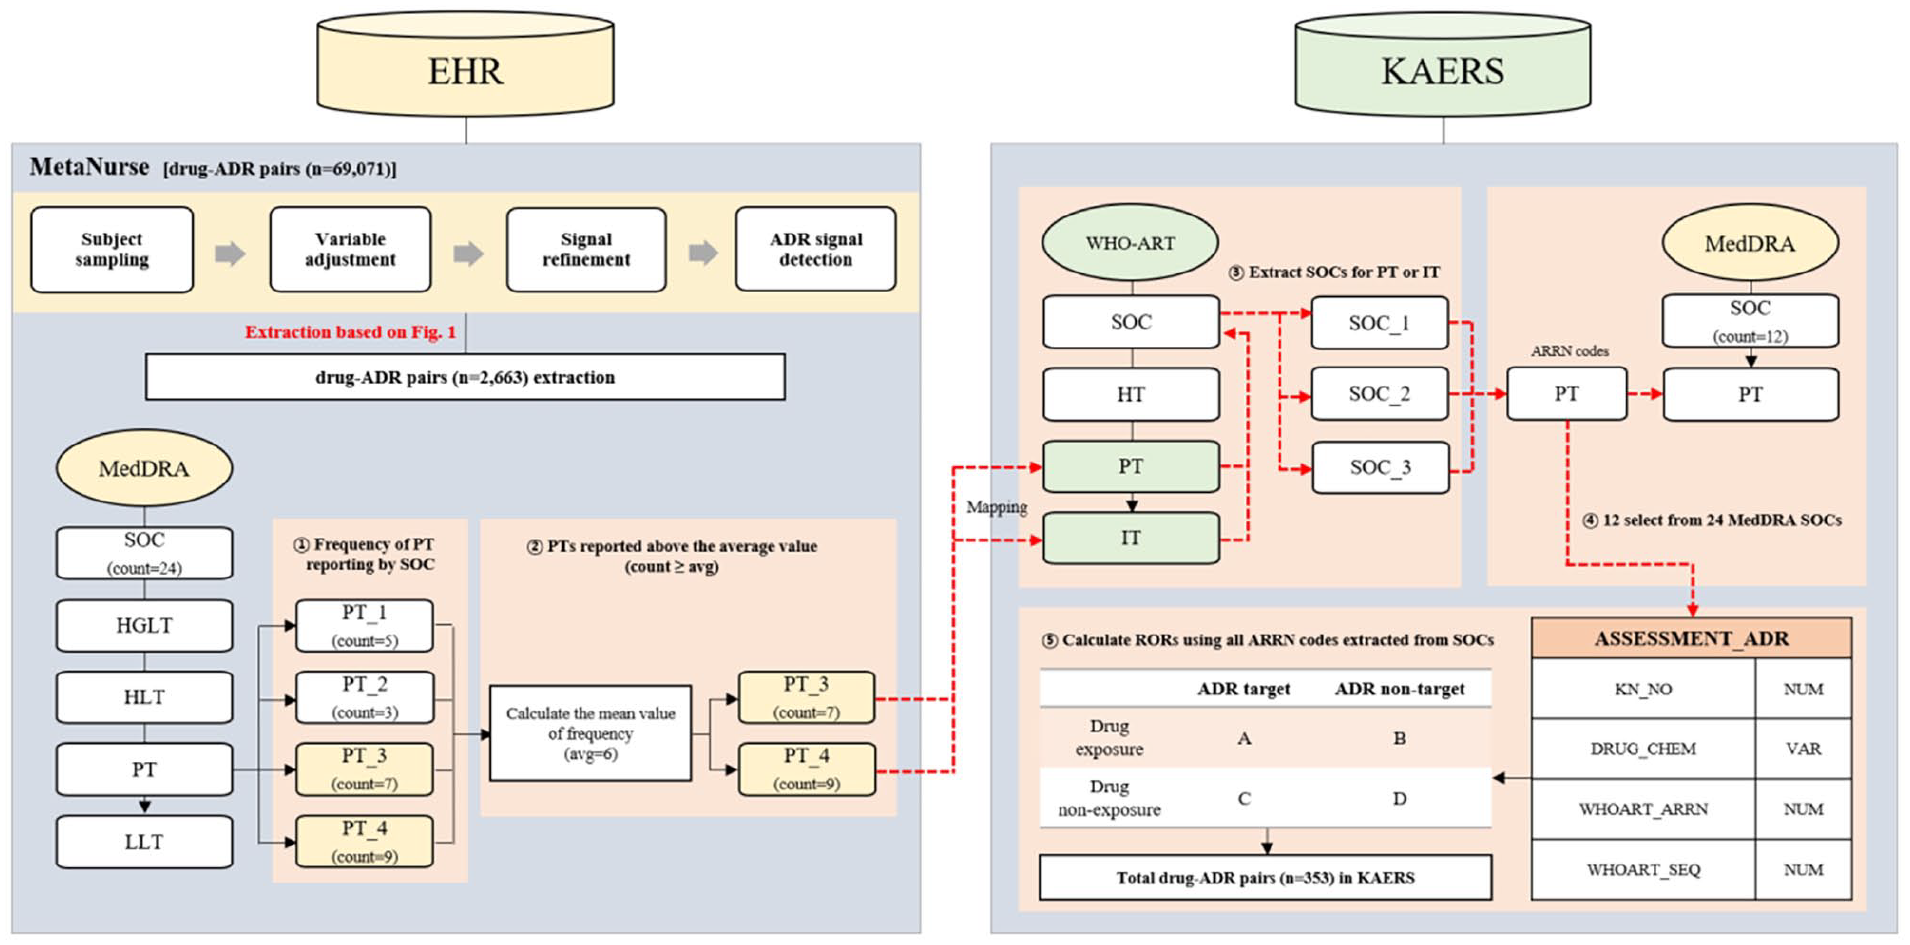
Overall workflow of the study.
MedDRA and WHO-ART ADR term mapping
Previous, a comprehensive controlled vocabulary-based ADR signal dictionary (CVAD) 17 dedicated to pharmacovigilance was developed for detecting and evaluating ADR signals using multi-center EHR data. Based on the previous study, we developed a new method of term mapping between MedDRA and WHO-ART. We used MedDRA terms for EHR data and WHO-ART terms for the KIDS-KD data. There were 24 MedDRA SOCs identified from 2663 drug–ADR pairs extracted from EHR, and the corresponding items are summarized in Supplemental Table S1. The frequency of MedDRA PTs reported for each MedDRA SOC was first identified, and then the average value of the identified frequencies was calculated. Only MedDRA PTs that were reported more frequently than the calculated average value was selected and mapped to WHO-ART PT or included terms (ITs). A list of MedDRA PTs selected for each MedDRA SOC is provided in Supplemental Table S2. After extracting WHO-ART SOCs corresponding to WHO-ART PTs or ITs, all WHO-ART adverse reaction record number (ARRN) codes corresponding to SOCs were used to search for adverse effects in the KIDS-KD. Cases where adverse effects were too comprehensive or multiple WHO-ART SOCs were duplicated for each MedDRA SOC were passively excluded. Eventually, 12 of the 24 MedDRA SOCs were mapped.
Statistical analysis
We created a 2 × 2 contingency table to combine drugs and ADRs. We compared the fraction of ADRs between the drugs, and then statistically measured the association of drugs with ADRs. 18 Based on the contingency table, non-potential and potential drugs were separated by rows, whereas ADRs were separated by columns. From the KIDS-KD data, the ROR values for each drug–ADR pair were calculated using all ARRN codes in the WHO-ART SOC. The signal criteria were an ROR of >2 and a lower 95% confidence interval (LCI) of >1. Data mining and statistical analyses were conducted using OracleSQL and R 3.6.1.
Results
Characteristics of reports
We divided all the reports from the KIDS-KD into two groups to describe their characteristics. Table 1 shows the sex ratios of reporters, and reporting types of the two groups. Data from the KIDS-KD were deduplicated based on randomized unique report number “KD_NO.” There were 3,121,787 reports, and they consisted of spontaneous reports, research, literature, unknown, and missing values. Furthermore, 56.3% of reporters were women and 43.7% were men. Spontaneous report types accounted for the greatest proportion (52.6%), followed by research (45.8%). The most reported drug in the KIDS-KD dataset was fentanyl (n = 66,535), followed by tramadol (n = 61,373), tramadol and paracetamol (n = 45,842), doxorubicin (n = 39,895), and cyclophosphamide (n = 39,328).
Characteristics of ADR reports from the KIDS-KD.
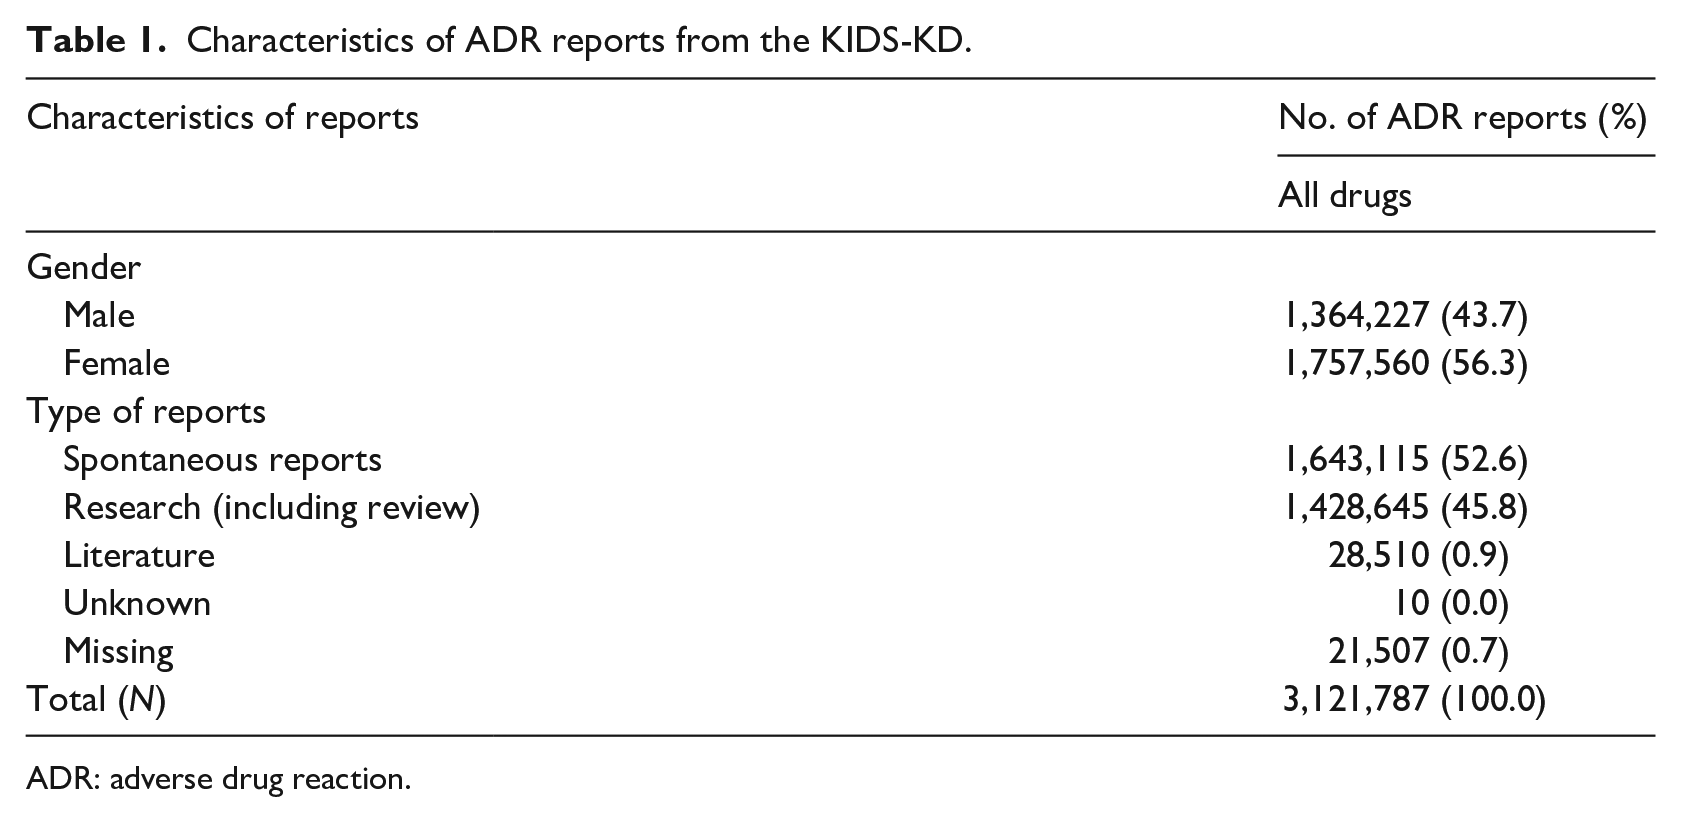
ADR: adverse drug reaction.
Selection of potential Drug–ADR pairs using MetaNurse
We subsequently identified the active ingredients, ATC code, and adverse-effect list by frequency. We determined the signal patterns of drugs derived from SNUH EHR data using MetaNurse. We obtained 353 drug–ADR pairs with a combination of 12 SOCs and 96 drugs through the MedDRA and WHO-ART mapping process (Figure 2). Among the 12 SOCs, the most reported drug was diclofenac (n = 7883), followed by bisoprolol (n = 7424), diltiazem (n = 4576), propranolol (n = 3883), and risperidone (n = 2533). Among the 353 drug–ADR pairs, the SOC proportions were as follows: eye disorders (61/353; 17.3%), gastrointestinal disorders (43/353; 12.2%), ear and labyrinth disorders (39/353; 11.0%), psychiatric disorders (38/353; 10.8%), blood and lymphatic system disorders (30/353; 8.5%), musculoskeletal and connective tissue disorders (26/353; 7.4%), nervous system disorders (26,353; 7.4%), cardiac disorders (25/353; 7.1%), renal and urinary disorders (24/353; 6.8%), reproductive system and breast disorders (23/353; 6.5%), neoplasms benign, malignant, and unspecified (13/353; 3.7%), and hepatobiliary disorders (5/353; 1.4%). The drugs with the highest reporting frequency were capsaicin, chlordiazepoxide, and triazolam, which were each reported nine times.
Validation of the detected signals
Figure 3 shows the 19 drug–ADR pairs that were defined as statistically significant pairs with RORs > 2 and LCIs > 1. Nineteen drug–ADR pairs, including eight SOCs and 16 drugs, were selected. Haloperidol was associated with cardiac disorders and eye disorders. In the case of benzatropine, associations were found with three SOCs: eye disorders, psychiatric disorders, reproductive system and breast disorders. The SOC that was associated with most drugs (n = 5) was cardiac disorder. Among the drug–ADR pairs, the highest ROR values were 8.18 (5.40–12.4; piroxicam—ear and labyrinth disorders), 5.39 (5.14–5.66; benzatropine—psychiatric disorders), 3.51 (1.58–7.80; mometasone—ear and labyrinth disorders), followed by 3.48 (2.91–4.16; haloperidol—cardiac disorders), 3.48 (2.91–4.16; haloperidol—cardiac disorders). In addition, to compare statistics in the drug exposure and non-exposure groups for the drug–ADR pairs, we summarized the percentage of sex, age, and reporting year for each group and attached as Supplemental Table S3.
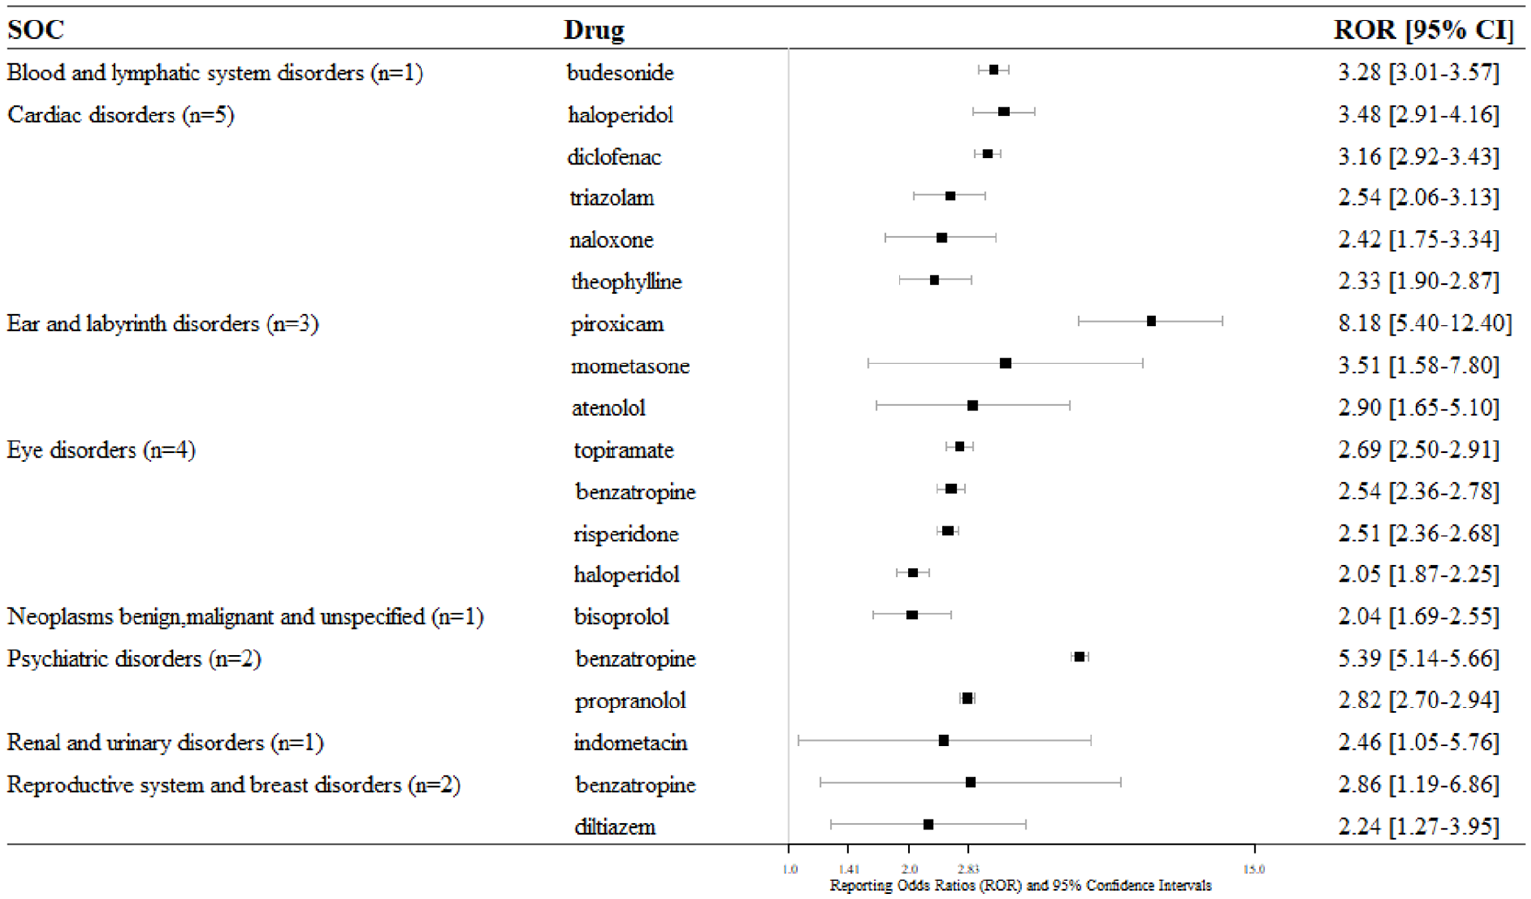
Nineteen reporting odds ratios for eight SOCs from KIDS-KD.
Discussion
For pharmacovigilance, numerous studies have implemented active surveillance using an established database.6–8 Pharmacovigilance plays a key role in evaluating, monitoring, and preventing ADRs. 19 The main purpose of the spontaneous reporting system is the early detection of new, rare, and serious adverse drug reactions, 20 and it has the advantage of covering the entire population in a cost-effective way. 21 Several studies have been conducted with only one database, as each database has different data types and contents. In this study, we used data from two medical databases, the EHR and KIDS-KD, for systematic drug analysis. Using two databases, we were able to compare the prescription patterns of drugs in each database and verify the ADRs.
Several studies to detect and predict ADRs risk using the KIDS-KD database have been actively conducted to date.22–25 Soukavong et al. 22 used a data mining approach to calculate the distribution of disproportionality between unknown drugs and ADRs. Yi et al. 23 detected ADR signals in the cardiovascular system after using dipeptidyl peptidase-4 (DPP4) inhibitors. Bae et al. 24 applied machine-learning algorithms in consideration of known ADR to detect signals and compared the prediction performance using the existing disproportionality analysis (DPA) method. Various methods have been developed to detect ADR signals using the KIDS-KD, but the possibility of applying the machine-learning method has not yet been fully evaluated.
In addition, there are representative databases for pharmacovigilance, such as, the FAERS 9 database containing ADRs information submitted to the FDA and the VigiBase®26 containing WHO individual case safety reports (ICSR) managed by the Uppsala Monitoring Center (UMC). In Europe, there is EudraVigilance 27 of the European Medicines Agency (EMA) for reporting and evaluating suspected ADRs. In pharmacovigilance, race and ethnicity variables can play an important role in studies observing the relationship between drugs and ADR pairs.28,29 And, as the KIDS-KD has limitations such as under-reporting, reporting bias, and inconsistent quality of individual reports, 30 we had to comprehensively analyze the data. Especially, there is no indication information in spontaneous reporting data like FAERS, VigiBase®, and KIDS-KD, we used the SIDER “side effect” and “indication” information for drug-ADR pairs extracted from EHR data to perform filtering in advance.
It is meaningful that two databases were used in combination; the signals extracted from the EHR, which contains all medical information from the hospital, were verified with the KIDS-KD, which contains reports of ADRs that actually occurred in patients. Rather than using the extensive pharmacovigilance database of other countries, we used the specialized data for Korean patients for more reliable and specific, which is strength in this study. Nevertheless, there were three limitations in this study: (1) our study depended on the number of reports, (2) there was a lack of background information regarding the drugs, and (3) we did not analyze the all drug-ADR pairs. Owing to the dependence on the number of reports, we were not able to analyze drugs that showed signals in the EHR data but showed little or no signal in the KIDS-KD. However, identifying the number of reports enabled to elucidate the prescription patterns of drugs in both databases. As there was a lack of background information in the clinical information, it was difficult to determine whether a drug was actually being used at present. Lastly, the overall relationship between drugs and ADRs is still unclear because the KIDS-KD was used only for pairs that showed meaningful signals in the EHR data, and not for the analysis of all drug–ADR pairs. We did not consider the demographic variables such as age and sex, but we are planning to focus on the specific populations by dividing age and sex groups for slightly more effective results in further study.
Conclusions
The use of multiple medical databases for pharmacovigilance is essential for the active surveillance of post-market drugs. In this case, it was better to use one standardized model, a common data model, because the data types and structure of each databases are different. As part of an effort to create a standardized model, in this study, we developed new criteria for mapping MedDRA PT from the EHR to WHO-ART SOC from the KIDS-KD, with frequency information and average values. In several previous studies, the most time-intensive part of the investigation has been pre-processing of the data to deal with the differences between databases. And, we still need appropriate term systems and criteria for dealing with diverse medical databases.
Supplemental Material
sj-docx-1-jhi-10.1177_14604582211033014 – Supplemental material for Real-world data-based adverse drug reactions detection from the Korea Adverse Event Reporting System databases with electronic health records-based detection algorithm
Supplemental material, sj-docx-1-jhi-10.1177_14604582211033014 for Real-world data-based adverse drug reactions detection from the Korea Adverse Event Reporting System databases with electronic health records-based detection algorithm by Hyunah Shin, Jaehun Cha, Youngho Lee, Jong-Yeup Kim and Suehyun Lee in Health Informatics Journal
Footnotes
Acknowledgements
We thank to the Korea Institute of Drug Safety & Risk Management the for providing the KIDS-KD data for this study.
Author contributions
Conceptualization: Kim JY, Lee SH. Data curation: Lee YH, Kim JY. Formal analysis: Shin HA, Cha JH. Writing—original draft: Shin HA, Cha JH. Writing—review & editing: Shin HA, Cha JH, Lee YH, Kim JY, Lee SH.
Declaration of conflicting interests
The author(s) declared no potential conflicts of interest with respect to the research, authorship, and/or publication of this article.
Funding
The author(s) disclosed receipt of the following financial support for the research, authorship, and/or publication of this article: This research was supported by the National Research Foundation of Korea (NRF) grant funded by the Ministry of Science ICT and Future Planning (MSIP) [grant number 2018R1D1A1B07049155] and and Ministry of Education [grant number 2021R1T1A3044287].
Ethical approval
Ethics approval and consent to participate Institutional Review Board (IRB) approval was obtained from the Konyang University Hospital prior to the beginning of this study (IRB Number: 2018-09-012). All participants provided written consent prior to the study.
Supplemental material
Supplemental material for this article is available online
References
Supplementary Material
Please find the following supplemental material available below.
For Open Access articles published under a Creative Commons License, all supplemental material carries the same license as the article it is associated with.
For non-Open Access articles published, all supplemental material carries a non-exclusive license, and permission requests for re-use of supplemental material or any part of supplemental material shall be sent directly to the copyright owner as specified in the copyright notice associated with the article.