
Abstract
The prevalence of type 2 diabetes mellitus is increasing worldwide. Current methods of treating diabetes remain inadequate, and therefore, prevention with screening methods is the most appropriate process to reduce the burden of diabetes and its complications. We propose a new prognostic approach for type 2 diabetes mellitus based on electronic health records without using the current invasive techniques that are related to the disease (e.g. glucose level or glycated hemoglobin (HbA1c)). Our methodology is based on machine learning frameworks with data enrichment using temporal features. As as result our predictive model achieved an area under the receiver operating characteristics curve with a random forest classifier of 84.22 percent when including data information from 2009 to 2011 to predict diabetic patients in 2012, 83.19 percent when including temporal features, and 83.72 percent after applying temporal features and feature selection. We conclude that he pathology prediction is possible and efficient using the patient’s progression information over the years and without using the invasive techniques that are currently used for type 2 diabetes mellitus classification.
Introduction
About 347 million people worldwide have diabetes. In 2012, diabetes was the direct cause of 1.5 million deaths. 1 The prevalence of diabetes is increasing in developed and developing countries and is predicted to achieve 7.7 percent worldwide by 2030. 2
Type 2 diabetes mellitus (T2DM) is the most common form of diabetes. In T2DM, the central problem seems to be insulin resistance in peripheral tissues. This resistance is favored by genetic susceptibility and is made worse by weight gain and lack of exercise. The pancreas compensates for the lack of insulin action on cell glucose uptake by producing more insulin. Eventually, not even this hyperinsulinemia is enough to avoid the rise in blood glucose levels. To make matters worse, pancreas exhaustion leads later to loss of secretory capacity and to full-blown diabetes symptoms (e.g. excess thirst, frequent urination, and constant hunger). T2DM emerges and progresses slowly, remaining undetected for years. 3
Chronic hyperglycemia of diabetes is associated with long-term dysfunction, damage, and failure of various organs, especially the eyes, kidneys, nerves, heart, and blood vessels. Individuals with undiagnosed T2DM are also at significantly higher risk of stroke, coronary heart disease, and peripheral vascular disease than the non-diabetic population. 4
Treatment of T2DM prevents some of its devastating complications5,6 but does not usually restore normoglycemia or eliminate all the adverse consequences. The diagnosis is often delayed until complications are present, and therefore, early screening for diabetes or prediabetes assumes a great importance. 7
Screening for blood glucose has been used as a tool to identify individuals at high risk of developing diabetes or already with asymptomatic diabetes. There is debate regarding whether screening for fasting glucose is sufficient or an oral glucose tolerance test is needed for detection of asymptomatic diabetes. 8 Measuring either fasting or postprandial blood glucose is an invasive procedure, as well as costly and time-consuming. Blood glucose has a large random variation and only gives information on a subject’s current glycemic status. Furthermore, the true primary prevention would be to identify high-risk subjects when they are still in a normoglycemic state and to treat them by interventions that prevent their transition from normoglycemia to impaired glucose tolerance and to overt diabetes. 9
Electronic health records (EHRs) are a systematic collection of electronic health information about an individual patient or population. It is a mechanism for integrating healthcare information on an electronic medical record with the purpose of improving quality of care. 10 One of its main potentials is enhancing decision support systems and facilitating reliable and reproducible outcomes of research and reporting.11,12 With machine learning techniques, the challenge is to extract meaningful information from data, to gain knowledge and patterns of discovery. 13
This article proposes a new prognostic approach for T2DM given an EHR and without using the current invasive techniques, such as glucose level and glycated hemoglobin (HbA1c). This approach, based on machine learning methods, supports the applicability of using the patient’s EHR to efficiently and non-invasively predict patients who are likely to develop T2DM. The result is a screening tool that allows the identification of high-risk subjects in the population, increases awareness of risk factors the pathology presents, and also emphasizes the importance of using EHR. The entire dataset captures 4 years (2009–2012) of “live” visits, and a T2DM prediction of diabetes diagnosis incidence by 2012 can be performed, with 84.22 percent of area under the receiver operating characteristics curve (AUC) using a random forest (RF) classifier. It has been shown that T2DM can be efficiently prevented by lifestyle modifications.14–16 Hence, our tool aims to help to identify individuals who would benefit from this intensive lifestyle counseling.
Material and methods
Diabetes dataset
The diabetes database is available on Kaggle, 17 a community of data scientists who compete to solve complex data science problems. This EHR dataset was provided by the Practice Fusion community, who released training and test sets of de-identified, Health Insurance Portability and Accountability Act (HIPAA)-compliant medical records to spur innovation into new uses of clinical data to improve public health and patient care. This dataset is one of the largest and richest sources of medical record data ever released and includes information on diagnoses, lab results, medications, allergies, immunizations, vital signs, and health behavior.
Practice Fusion sponsored the following challenge with this dataset: “Identify patients diagnosed with T2DM.” This article proposes a different approach: “Predict patients who will present T2DM in the following time period T + 1, based on previous data from T.” Our goal is to predict who will develop T2DM instead of identifying those who already have been diagnosed with T2DM, resulting in a prognostic prediction instead of diagnosis. A number of details from the dataset were removed, and cannot be accessed, in order to avoid the manipulation of diabetes prediction since they are direct measures related to the disease. Specifically, the diagnosis feature of T2DM patients as defined by International Classification of Diseases, 9th Revision (ICD-9) codes, diabetes medication, glucose levels, insulin, and HbA1c were removed. For this competition, an indicator column was added designating who has a diagnosis of T2DM. This diagnosis is assigned to each patient over the 4 years of acquired data. Since T2DM is a chronic disease, this label can be used to predict patients in 2012 given the information available from previous years. The disadvantage, since we cannot access the T2DM patient’s diagnosis and year of diagnosis, is that we are limited to provide a screening analysis over 1 year. However, we can still provide a temporal analysis of the available parameters for this time window.
Feature extraction
We proceeded to a feature extraction based on the state-of-the-art descriptions available on the Kaggle 17 diabetes community. The following steps were performed: (1) outliers were cleaned and height median calculated for each patient; (2) body mass index (BMI) was recalculated with this constant height for each patient, eliminating the noise of measured fluctuations; (3) for the features weight, height, BMI, systolic blood pressure, diastolic blood pressure, temperature, and respiratory rate, the median was calculated and truncated to maximum and minimum; (4) the diagnostic features were grouped at two levels based on clinical etiology or symptoms similarities according to the ICD-9 codes: 245 Level 2 and 22 Level 1 groups were created; (5) the medication features were treated at the active principle level. For each National Drug Code (NDC) active principle, administration route and dose were extracted. After that, active principles were grouped into families taking into account chemical similarities or common clinical indication. Features were created for maximum dose of an active principle/family, number of active principles in the family administered to the patient, number of prescriptions, and binary flags; (6) features such as “Smoking Status” and “Previous Smoking Status” were created; (7) other features like allergy or immunization were not considered due to low number of patients.
In the end, the data comprise information from 2009 to 2011 with the label representing the status in year 2012, to allow a screening analysis. The training set will be represented by 70 percent of the original data and the testing set with the remaining data (30%). There are 529 features for 9947 patients (43% are male and 57% are female) with ages between 21 and 93 years. Overall, 19 percent of the patients are diabetic, and stratification was ensured when splitting the training and testing sets, guaranteeing similar class distributions in both sets. The programming languages used for this processing were R and Python. Training was performed using the Amazon Elastic Compute Cloud (Amazon EC2) with an m3.2xlarge model (CPU 8 cores and 30 GB memory). 18
Classification
After preprocessing the data, we proceeded to the diabetes screening by assessing different classifiers. We used two machine learning packages for this analysis: Weka 19 and Theano. 20 With the Weka package, the standard classifiers were used, initially with the default parameters. These include Naïve Bayes (NB), 21 alternating decision tree (ADT), 22 RF, 23 random tree (RT), k-nearest neighbor (KNN), 24 and support vector machine (SVM) with a polynomial kernel implementation. 25 The predictive models were built using 5 × 10-fold cross-validation (CV) on the training data. 26 The classifier’s parameters were optimized using a meta-classifier that performs CV given a list of possible parameters. 27 Also, knowing that the classes are unbalanced (19% are diabetic), we used another technique available on Weka—Synthetic Minority Over-sampling Technique (SMOTE). This technique is applied in each CV train fold and will be responsible for over-sampling the minority class by creating synthetic examples, therefore allowing the analysis of a more balanced training data. 28 We chose to use a SMOTE of 0, 150, and 300 percent, where 300 percent means that for each minority class instance, the algorithm creates another three synthetic ones, resulting in a train set with an approximated 50-50 distribution.
Using Theano, it is possible to attain speeds rivaling hand-crafted C implementations for problems involving large amounts of data. The classifier Multilayer Perceptron was used with Theano due to its low learning speed on big data, and a different number of hidden neurons were tested (250, 500, and 1000).
Temporal features
It has been shown that T2DM is associated with weight gain29,30 and raised blood pressure. 31 Therefore, the weight, BMI, and systolic and diastolic blood pressure evolution analysis over time may improve our predictive model. We applied linear regression of the chosen features over the years (2009–2011), and we used the slope and interception as the new temporal features (TF), a data enrichment which is used to investigate possible improvements on classification. We have selected this type of regression for two reasons: (1) clinician feedback that supports that temporal trajectories would be probabilistically linear for a general population; (2) it is highlighted by Adler et al., 32 Hanson et al., 33 and Bays et al. 34 that the temporal trajectories of the selected features are linear. However, as future work, we intend to complement this study by analyzing other types of regressions (e.g. quadratic).
Feature selection
Given the high number of used features in this study (529), we performed a feature selection (FS) analysis in order to verify whether some of the original features would be discarded as being irrelevant to the classification. The InfoGainAttribute evaluator was tested among a variety of FS algorithms available on Weka and provided better AUC results. This algorithm evaluates the worth of an attribute by measuring the information gain with respect to the class attribute. Concisely, the information gain is a measure of the reduction in entropy of the class variable after the value for the feature is observed. The Ranker search method was used retaining the top 150 attributes ranked by their individual evaluations. Nevertheless, we consider that as future work a feature engineering analysis should be considered in order to improve our classification system.
Figure 1 summarizes the workflow used for the analysis. We tested different classifiers on the original data (OD), on the original data with the inclusion of temporal features (OD + TF), and later with feature selection (OD + TF + FS). Regarding the performance evaluation, several metrics were retrieved, such as the receiver operating characteristic (ROC) area (AUC), sensitivity, and specificity. Afterwards, the best classifier was chosen based on the best metrics obtained and applied on the test data. Our predictive model will then allow a prognostic prediction of T2DM when a new patient’s information is given. The programming languages used for this analysis were Java for the Weka packages and Python for Theano.
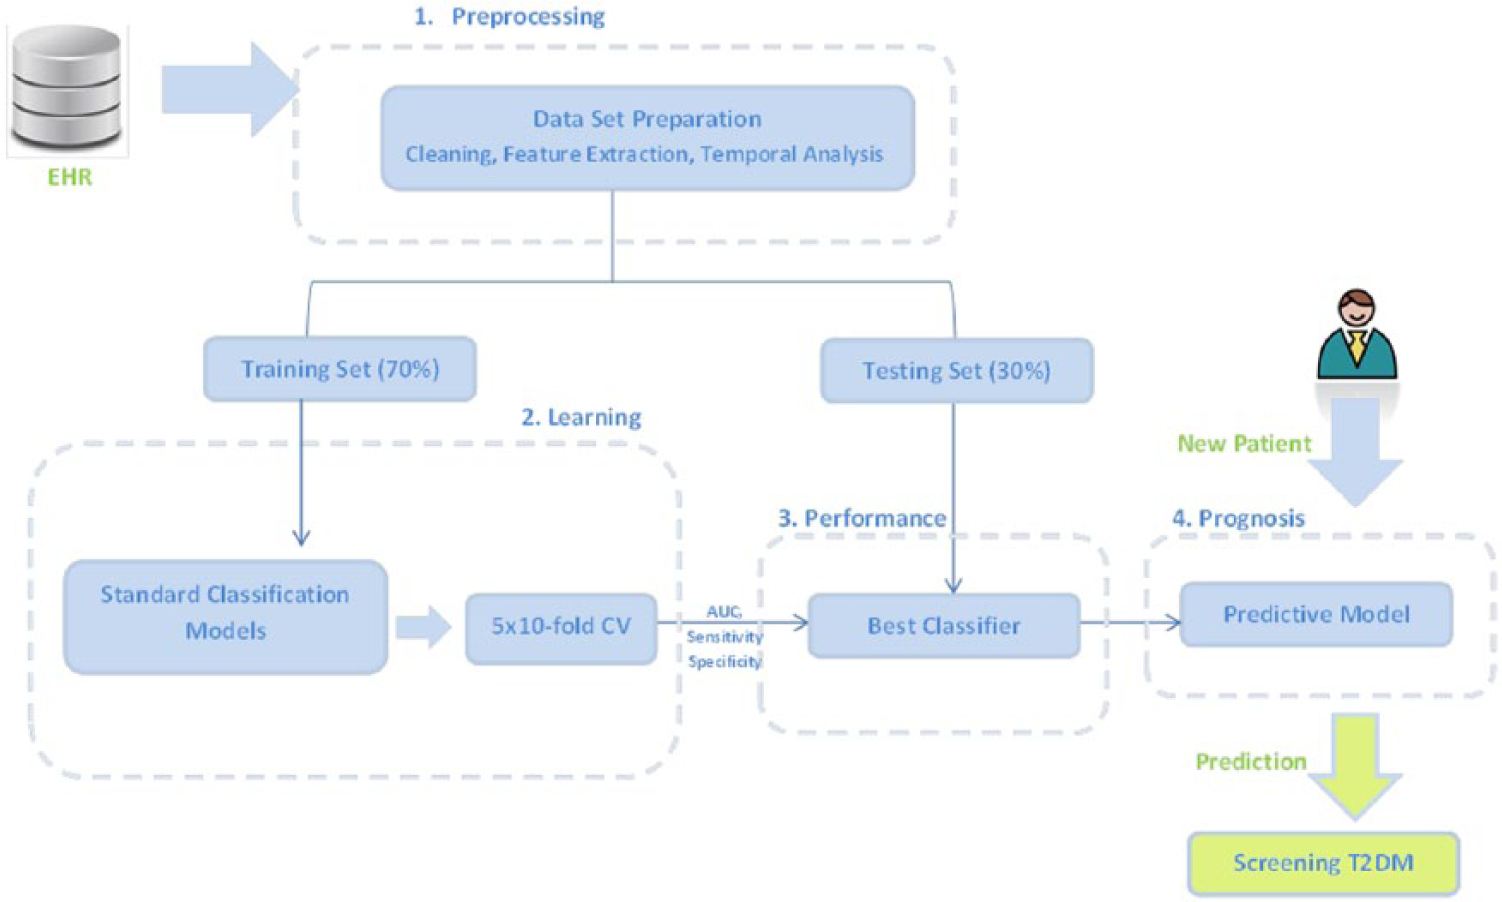
Summary of the followed workflow. Based on EHR, the data are prepared and divided in training and testing sets. Different classifiers are applied on the training set with a stratified 5 × 10-fold CV and the best model is chosen based on its metrics (AUC, sensitivity, and specificity). Later, its performance is evaluated using the testing set, and a final predictive model is built allowing a prognosis of T2DM given a new patient’s information.
Results and discussion
In this section, we present and discuss the results of the predictive models on the training set (70% of initial dataset). Afterwards, we show the performance evaluation of the best predictive model on the test set (remaining 30%).
Training set
The results are shown in Tables 1 and 2, for the AUC, specificity and sensitivity, respectively, after applying 5 × 10-fold CV on the training set for different classifiers.
AUC values obtained from the train set in percentage (stratified 5 × 10-fold CV).
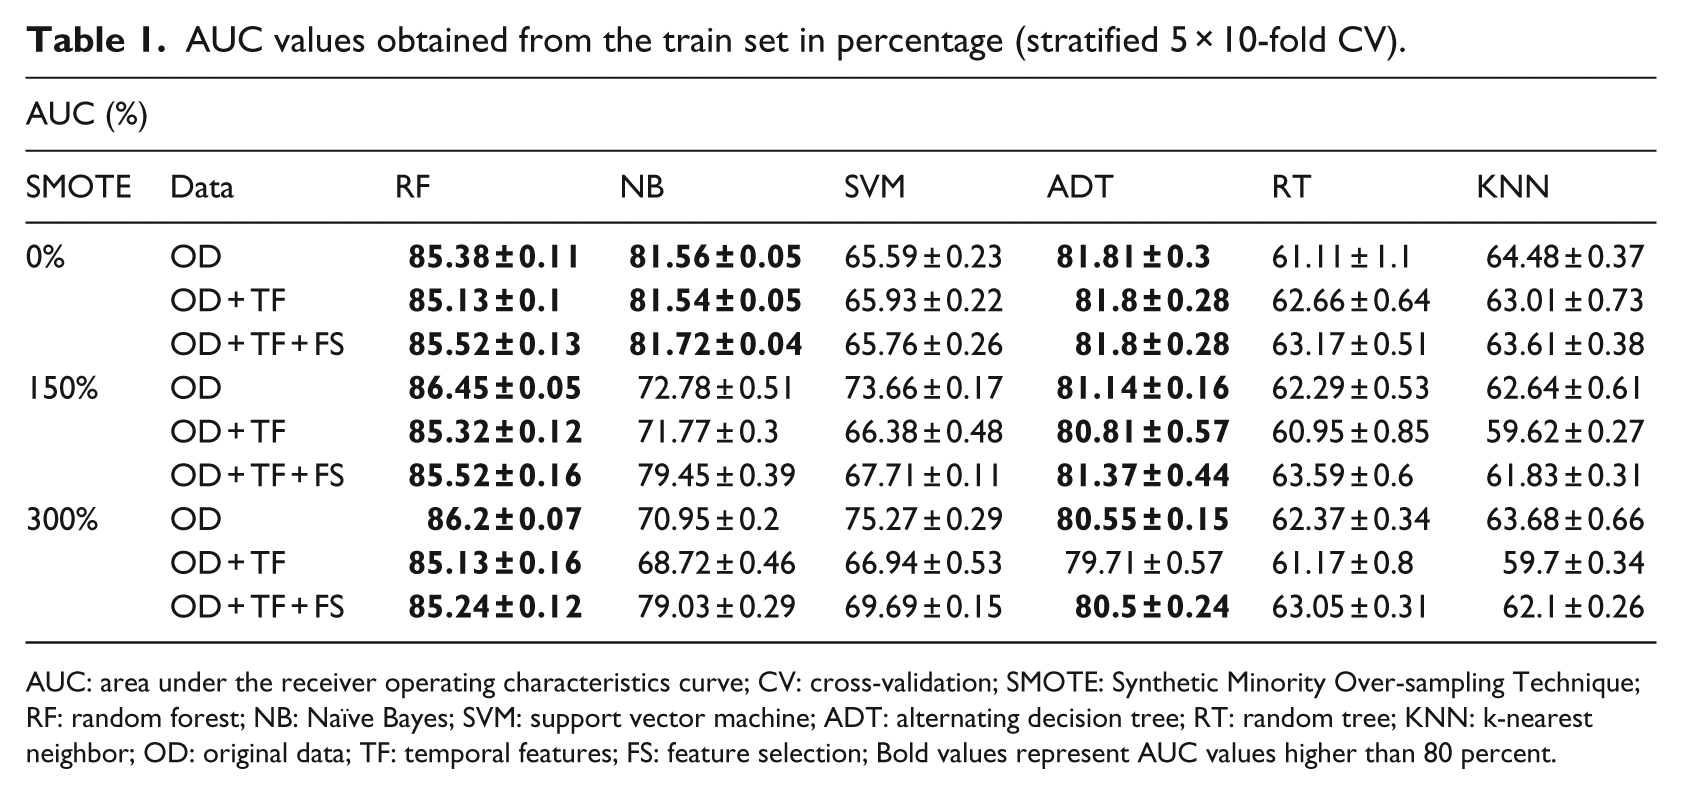
AUC: area under the receiver operating characteristics curve; CV: cross-validation; SMOTE: Synthetic Minority Over-sampling Technique; RF: random forest; NB: Naïve Bayes; SVM: support vector machine; ADT: alternating decision tree; RT: random tree; KNN: k-nearest neighbor; OD: original data; TF: temporal features; FS: feature selection; Bold values represent AUC values higher than 80 percent.
Specificity and sensitivity values obtained from the train set in percentage (stratified 5 × 10-fold CV).
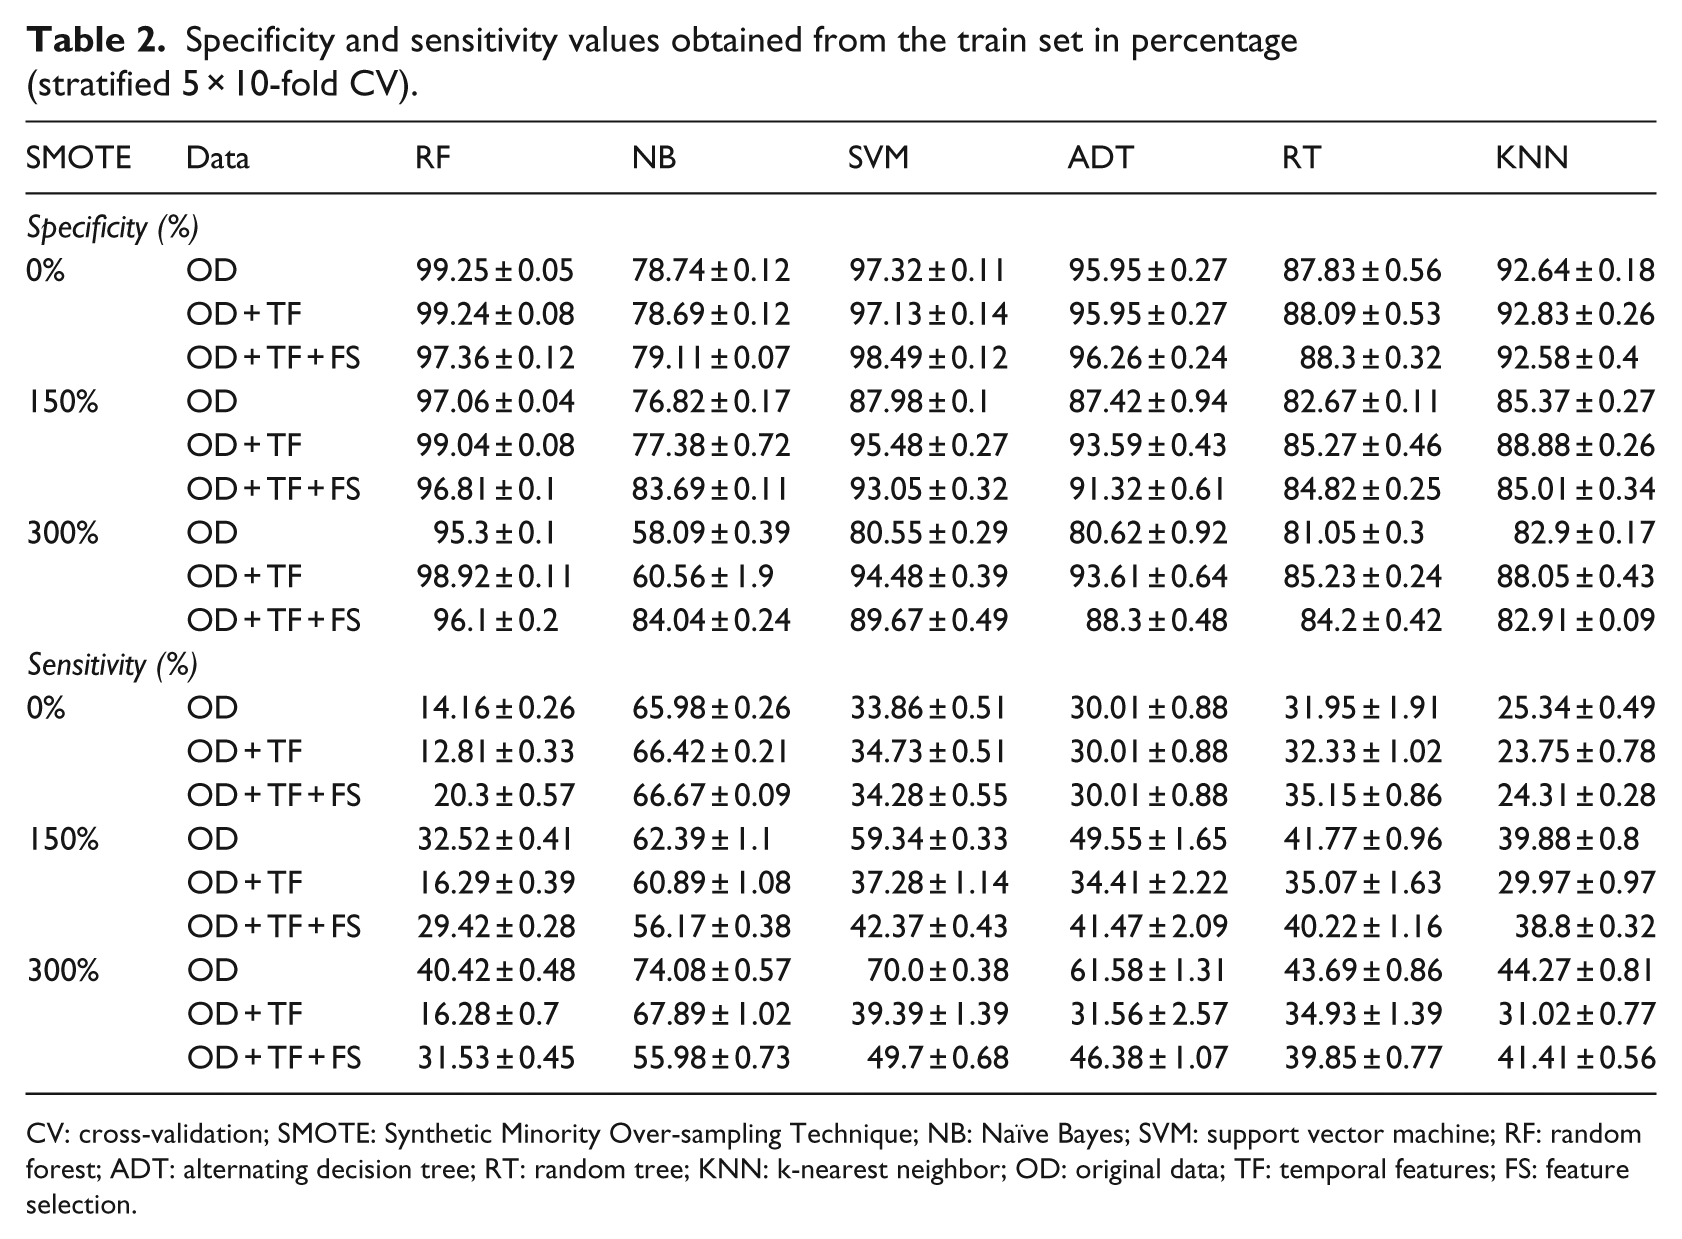
CV: cross-validation; SMOTE: Synthetic Minority Over-sampling Technique; NB: Naïve Bayes; SVM: support vector machine; RF: random forest; ADT: alternating decision tree; RT: random tree; KNN: k-nearest neighbor; OD: original data; TF: temporal features; FS: feature selection.
Using Theano, the accuracy is the only metric available for the Multilayer Perceptron (MP) classifier (with 500 hidden neurons), and 5 × 10-fold CV was not applied due to package specifications. The results for the accuracy were in the order of 81.08
The RF classifier provides good results for AUC and specificity values. However, the sensitivity outcomes are not as good as the previous metrics. This means that given a patient that is likely to be diabetic, the classifier may fail to assert this prediction. The best sensitivity outcomes are returned by the NB classifier. However, our best classifier will be chosen based on the best combination of all the three metrics. The low sensitivity values seen in Table 2 may also be justified by the unbalanced classes that represent the training set (19% are diabetic), which explains the use of the SMOTE filter in this analysis.
Our main research goal was to show that diabetes screening could be made accurately and that this screening would be efficient using the patient’s information over the years. We notice that, for the RF classifier, the AUC values are improved with the use of a SMOTE filter of 150 percent, although better results could be expected for a SMOTE of 300 percent where the classes are balanced. Later, the addition of TF and FS did not improve the AUC values in comparison with the OD. The best specificity values are found when no synthetic instances are created (SMOTE 0%), and addition of TF slightly improves the specificity values. Still for the RF classifier, the sensitivity results are improved with the increasing SMOTE percentage. And the OD individually outperforms the use of TF and FS on the sensitivity values.
Using FS, we notice that sensitivity values are improved with the RF classifier and that two temporal features (weight slope and interception) are included in these ranked features. We also see that the most important features for the classification are essential hypertension, year of birth, systolic and diastolic blood pressure, and mixed hyperlipidemia (Table 3). These features are in agreement with the known risk factors of the disease.35–37 Although the Kaggle competition uses a different proposal analysis, our most important features are also in agreement with the Kaggle competitors.
Feature ranking of the top 20 selected features.
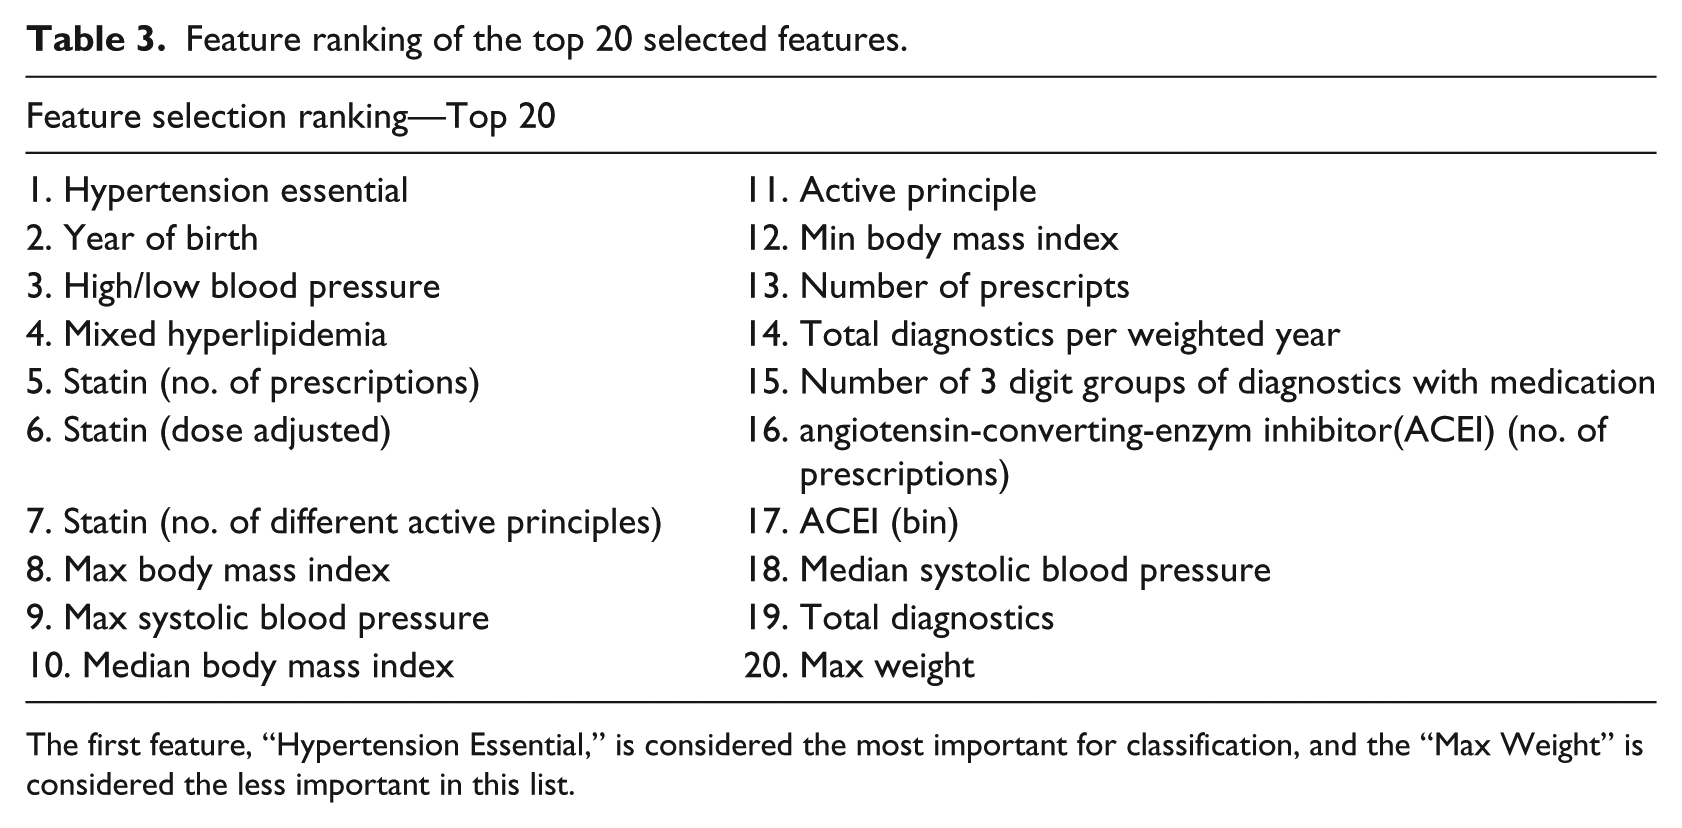
The first feature, “Hypertension Essential,” is considered the most important for classification, and the “Max Weight” is considered the less important in this list.
These ranked factors can also be used to alert the physician about the main parameters that should be considered when screening T2DM. The diagnostics on stress and rheumatic pain are found to be the less important features for the classification.
Following the RF, ADT also provides good results for AUC values. Given that decision trees implicitly perform feature selection and are easy to interpret, we consider that Figure 2 provides important insights for screening T2DM for this population. A new instance is scored by summing all of the prediction nodes through which it passes.
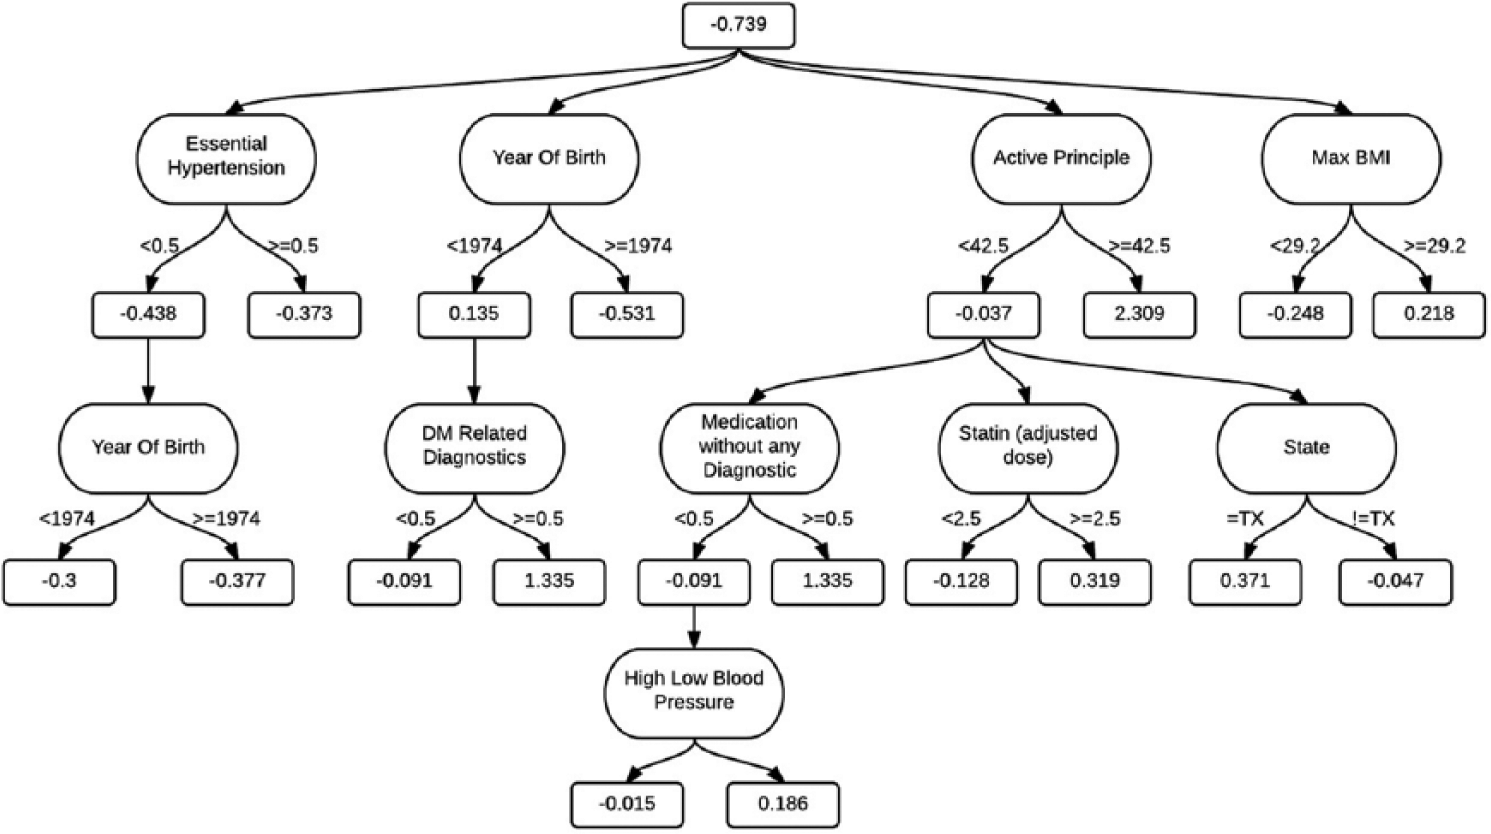
ADT visualization. A prognosis using this model only requires nine features. A new instance is scored by summing all of the prediction nodes through which it passes. If this final sum is positive, then it is classified as a T2DM prognostic.
Statistical comparisons were also made between each group with a Wilcoxon signed-rank test as suggested from Demsar. 38 The results show that there are no statistical significant differences when adding TF or applying FS for a SMOTE of 0 percent. However, for a SMOTE of 150 and 300 percent, there are statistical significant differences after using TF, decreasing the classifiers performance, especially for the SVM classifier. We also found that there are no statistical significant differences between each SMOTE group. This suggests that more advanced techniques for unbalanced datasets should be considered for future work as well as a deeper understanding of the temporal trajectories and feature selection analysis.
In order to compare the performance of the different classifiers, we applied the Friedman test, suggested by Demsar, 38 using the IBM SPSS Statistics Editor. The results show that there are statistically significant differences between the classifiers for the AUC values. We analyzed the pairs comparison, with significance values corrected for multiple testing, and found that the RF and ADT performed significantly better than RT, KNN, and SVM (p ⩽ 0.03). Also, NB significantly outperformed KNN and RT. Moreover, we verified that the top performing classifier, according to the mean test rank, was RF. Given that there were no statistical significant differences between each SMOTE group, and knowing that the best AUC outcomes with the RF classifier occur with a SMOTE filter of 150 percent, we conclude that the best option is to proceed with this filter. The average training time processing for these datasets using the RF classifier with a SMOTE of 150 percent, with parameter optimization, and using stratified 5 × 10-fold CV was approximately 2 h (with Amazon EC2).
We have chosen the RF due to its performing metrics outputs and statistical analysis. However, this classifier has other advantages: it runs efficiently on large datasets, minimizes overfitting, is fast, scalable, and does not require tuning many parameters (such as SVM). For these reasons, we proceeded to the test set with the RF classifier.
Test set
After choosing the best classifier based on the training set, we analyzed its performance on the test set. The entire training set was used on the RF to build our predictive model, and then the test set was used and the AUC, sensitivity, and specificity metrics were retrieved as seen in Table 4. These results will allow us to know what to expect with the RF prediction, when dealing with new and unknown patient’s information.
Results in percentage obtained from the test set using the RF classifier.
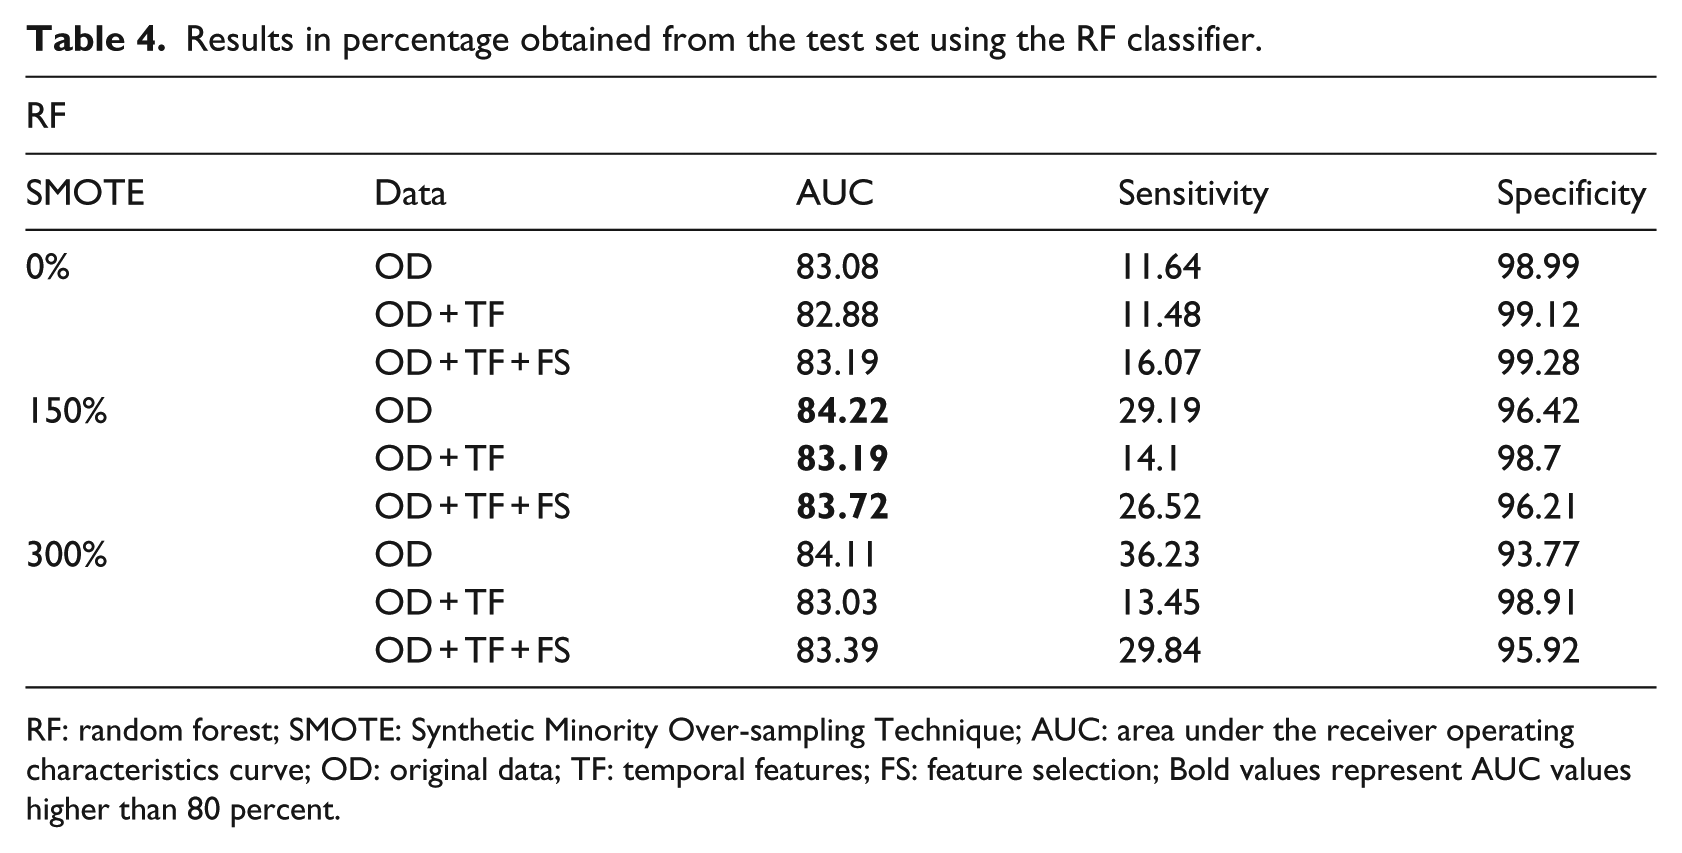
RF: random forest; SMOTE: Synthetic Minority Over-sampling Technique; AUC: area under the receiver operating characteristics curve; OD: original data; TF: temporal features; FS: feature selection; Bold values represent AUC values higher than 80 percent.
Comparing the results with the training set, we find that the test metrics are below the confidence interval (mean
Another interesting fact for the AUC outcomes is that the best performing values occur with a SMOTE filter of 150 percent, which is in agreement with our training conclusions.
Although the use of TF and FS did not improve the final performance, we still believe that these models are important and useful methods in prognostic analyses. Finally, the simple theory, fast speed, stability, and insensitivity to noise of the RF classifier make it suitable for screening T2DM using EHR.
Although FS did not select gender as one of the most important features, we also tested these classification models separately for male and female. We found out that the best performance metrics using a RF classifier with a SMOTE of 150 percent for male are below the expected (AUC = 78%), although female values are similar when compared using both genders (AUC = 84%). This is a topic that we wish to address as future work.
Conclusion
In this article, we propose a new approach of T2DM prognostic prediction, given a set of previous EHR. During the preprocessing, we have added TF based on the state-of-the-art knowledge of the disease risk factors. FS was also applied given the high number of available features. We applied 5 × 10-fold CV on the training set for different classifiers and selected the classifier that presented the best metrics: AUC, sensitivity, and specificity. Following this, the test set was applied on the best model—the RF classifier. We achieved an AUC performance of 84.22 percent using the data comprising the years 2009–2011 to predict diabetic patients in 2012, and 83.19 and 83.72 percent after the inclusion of TF and TF with FS, respectively.
The inclusion of both TF and FS did not improve model performance. This strengthens the importance of a prospective study for patient temporal progression trajectories and feature selection analysis. Nonetheless, we strongly believe that these approaches should be considered in a pathology prognosis—even more for T2DM, a chronic disease that will get progressively worse if left untreated. The major drawback of this study was the impossibility of accessing the T2DM diagnosis date. This limited us to only provide a prognosis of 1 year. Also, it is of our main interest to understand which patients do not have the disease from 2009 to 2011 and were diagnosed with T2DM on 2012. These patients are the ones who should have an increased attention so that we can understand which features are more affected with disease onset. Nevertheless, our predictive model presents promising results for screening T2DM using EHR, which could be used when the development of the disease is still at an early stage. As for future work, we intend to apply this methodology on different datasets; we wish to study the temporal trajectories for this population and also test other feature selection algorithms. We also wish to address the T2DM prognosis based on gender, which may enhance our understanding of T2DM progression. Finally, we wish to classify new patients with our predictive model and monitor their evolution over a year to confirm our preliminary screening.
Footnotes
Declaration of conflicting interests
The author(s) declared no potential conflicts of interest with respect to the research, authorship, and/or publication of this article.
Funding
The author(s) received no financial support for the research, authorship, and/or publication of this article.