
Abstract
We compare the performance of logistic regression with several alternative machine learning methods to estimate the risk of death for patients following an emergency admission to hospital based on the patients’ first blood test results and physiological measurements using an external validation approach. We trained and tested each model using data from one hospital (n = 24,696) and compared the performance of these models in data from another hospital (n = 13,477). We used two performance measures – the calibration slope and area under the receiver operating characteristic curve. The logistic model performed reasonably well – calibration slope: 0.90, area under the receiver operating characteristic curve: 0.847 compared to the other machine learning methods. Given the complexity of choosing tuning parameters of these methods, the performance of logistic regression with transformations for in-hospital mortality prediction was competitive with the best performing alternative machine learning methods with no evidence of overfitting.
Keywords
Introduction
Several predictive models are in widespread use to predict the risk of death for patients in hospital. Prominent examples include Acute Physiology and Chronic Health Evaluation (APACHE II), 1 Mortality Probability Model (MPM II) 2 and the Physiological and Operative Severity Score for the enUmeration of Mortality and morbidity (POSSUM). 3
The development of such risk prediction models is less than straightforward, involving a number of important modelling choices, 4 which require consideration of candidate covariates (e.g. the patients’ age, gender and comorbidities), the linearity of covariates, interaction effects and the choice of model (e.g. logistic regression). 5 Model development is usually guided by a number of model diagnostics and performance statistics such as model calibration and model discrimination. 6
Our motivation stems from attempting to predict the risk of dying for acutely ill patients who are admitted to hospital as unplanned or emergency medical admissions. 7 The response variable is whether the patient died in hospital (yes/no) and the covariate set is based on previous work 8 which identified the patients’ routine blood tests (seven blood tests, see later) and National Early Warning Score (NEWS; 9 see later) as appropriate predictor variables along with the patients’ age (years) and gender (male/female).
A fundamental issue is the choice of model. Here we consider the more traditional approach (which tends to produce models which are more understandable by humans) versus more modern machine learning approaches: (1) logistic regression without transformations of continuous covariates (LOGIT), (2) logistic regression with transformations of continuous covariates (LOGIT†), (3) logistic regression with multivariable fractional polynomials (MFP), 10 (4) logistic regression with restricted cubic splines (RCS) for continuous covariates, 5 (5) recursive partitioning and regression trees (RPART), 11 (6) random forest (RF), 12 (7) generalised boosted regression modelling (GBM), 13 (8) support vector machine (SVM) 14 and (9) neural network (NNET). 14
The rationale for investigating these alternative approaches is as follows. Logistic regression is widely used in medical applications and the model coefficients can be interpreted as odds ratios (and using a modified approach as risk ratios) which are clinically meaningful. 4 For the logistic model, covariates can be included in the untransformed scale, with transformation and with/without the aid of RCS (which are advocated for use with continuous covariates5,15) and MFP (which has also has been advocated for continuous covariates 16 ). Furthermore, modern statistical machine learning methods have been advocated by several authors,17–25 including decision trees, boosted models, SVM and NNET.
For this study, we consider logistic regression with/without transformation as being the more traditional approach and the use of RCS, MFP, RF, RPART, GBM and SVM as the more modern computationally intensive approaches.
Our aim is to compare the above modelling strategies and identify the model with the best performance statistics using external model validation to assess the performance of these models in terms of calibration and discrimination. The use of external validation to make these comparisons has become an important methodological development.6,26
As prediction models inform patients and carers about prognosis, it is essential that predictions should be well calibrated. 6 While the interest in the development and validation prediction models in clinical setting is growing, only a quarter of the studies reported prediction models with internal and external validation.27,28 Usually, internal validation is done by splitting the development data into training and testing sets; however, cross-validation and bootstrapping can also be used. 29 External validation aims to address the performance of a model in patients from a different but possibly related setting, and it is a key step before disseminating the prediction model in clinical setting.26,30
For discrimination, we use the area under the receiver operating characteristic (ROC) curve (AUC) or concordance (c)-statistic. The AUC is the probability that the model will predict a higher risk of death for a randomly selected patient who died, compared to a randomly selected patient who survived. Calibration is the relationship between the observed and predicted risk of death and can be usefully seen on a scatter plot (y-axis – observed risk, x-axis – predicted risk). Perfect predictions should be on the 45° line. The intercept (a) and slope (b) of this line give an assessment of ‘calibration-in-the-large’.
6
In model development,
Materials and methods
Data set
Our cohorts of emergency admissions are from two acute hospitals which are approximately 100 km apart in the Yorkshire & Humberside region of England – the Diana, Princess of Wales Hospital (managed by the Northern Lincolnshire and Goole NHS Foundation Trust (NLAG)), and York Hospital (managed by York Teaching Hospitals NHS Foundation Trust). All adult (age > 16 years) emergency admissions during the year 2014 (i.e. 1 January to 31 December 2014) were included. We obtained the following information for each admission: the patients’ age, gender and discharge status (alive/dead). We considered admissions, which had no missing data. We excluded 5137 (17%) admissions for NLAG Hospital and 4267 (24%) admissions for York Hospital, with incomplete data (albumin and creatinine test results were the most frequent missing data; Table 1). The covariates set were age (years), gender (male/female), albumin (g/L), creatinine (µmol/L), haemoglobin (g/dL), potassium (mmol/L), sodium (mmol/L), white cell count (109 cells/L), urea (mmol/L) and NEWS. The NEWS ranged from 0 (indicating the lowest severity of illness) to 19 (the maximum NEWS value possible is 20).
Characteristics of the emergency admissions in the two hospitals.

NLAG: Northern Lincolnshire and Goole NHS Foundation Trust; SD: standard deviation; NEWS: National Early Warning Score.
Statistical analysis
We started with an exploratory analysis of the NEWS and the blood test results.
We truncated extreme observations of blood test results (very high (>99.9%) or very low (<0.1%)) to moderate the noise of outliers in the modelling process. We have excluded the incomplete data as follows: 17 per cent (5138/29,834) for NLAG Hospital and 24 per cent (4267/17,744) for York Hospital. We produced scatter plots showing the relationship between mortality and continuous covariates (grouped into deciles). We modelled the risk of death using the same set of covariates: age, gender, albumin, creatinine, haemoglobin, potassium, sodium, white cell count, urea and NEWS.
We used the qladder function (Stata version 13), which displays the quantiles of transformed variable against the quantiles of a normal distribution according to the ladder powers
These analyses were undertaken in R. 32 We used default tuning parameters for MFP in R package mfp 33 but RCS with three knots in R package rms. 34 We used the caret R package 35 for machine learning algorithms (RPART, RF, GBM, SVM, NNET) and optimised their tuning parameters using AUC as a loss function for a (five times) repeated 10-fold cross-validation method (see Supplementary Material). We used a linear kernel with two parameters (i.e. cost and gamma) for the SVM method.
Ethical approval
Although this type of study does not require ethical approval because it meets the exemption criteria (‘Research limited to secondary use of information previously collected in the course of normal care (without an intention to use it for research at the time of collection), provided that the patients or service users are not identifiable to the research team in carrying out the research’. 36 ), we obtained ethical approval for the main research project of which this is a substudy from Yorkshire & The Humber–Leeds West Research Ethics Committee (reference no. 15/YH/0348).
Results
There were 24,696 emergency admissions for development data (NLAG Hospital) and 13,477 for validation data (York Hospital). We further divide the development data into training set (70%, n = 17,288) and testing set (30%, n = 7408). For both hospitals, we have 12-month data where patient discharges were from 1 January to 31 December 2014. Descriptive statistics for the covariates are shown in Table 1. The risk of death in NLAG was 4.7 per cent (1159/24,696) compared with 6.5 per cent (876/13,477) in York Hospital. Patients in NLAG Hospital has a mean age of 63.1 years compared with 68.3 years in York Hospital and a lower NEWS (1.9 (NLAG)) compared to York Hospital (2.6).
Figure 1 shows boxplots of each covariate with respect to patient discharge status (alive/dead) in NLAG Hospital. In general, patients who died were older, had higher NEWS, lower albumin, higher creatinine, lower haemoglobin, higher potassium, higher urea, higher white cell counts and lower sodium levels.
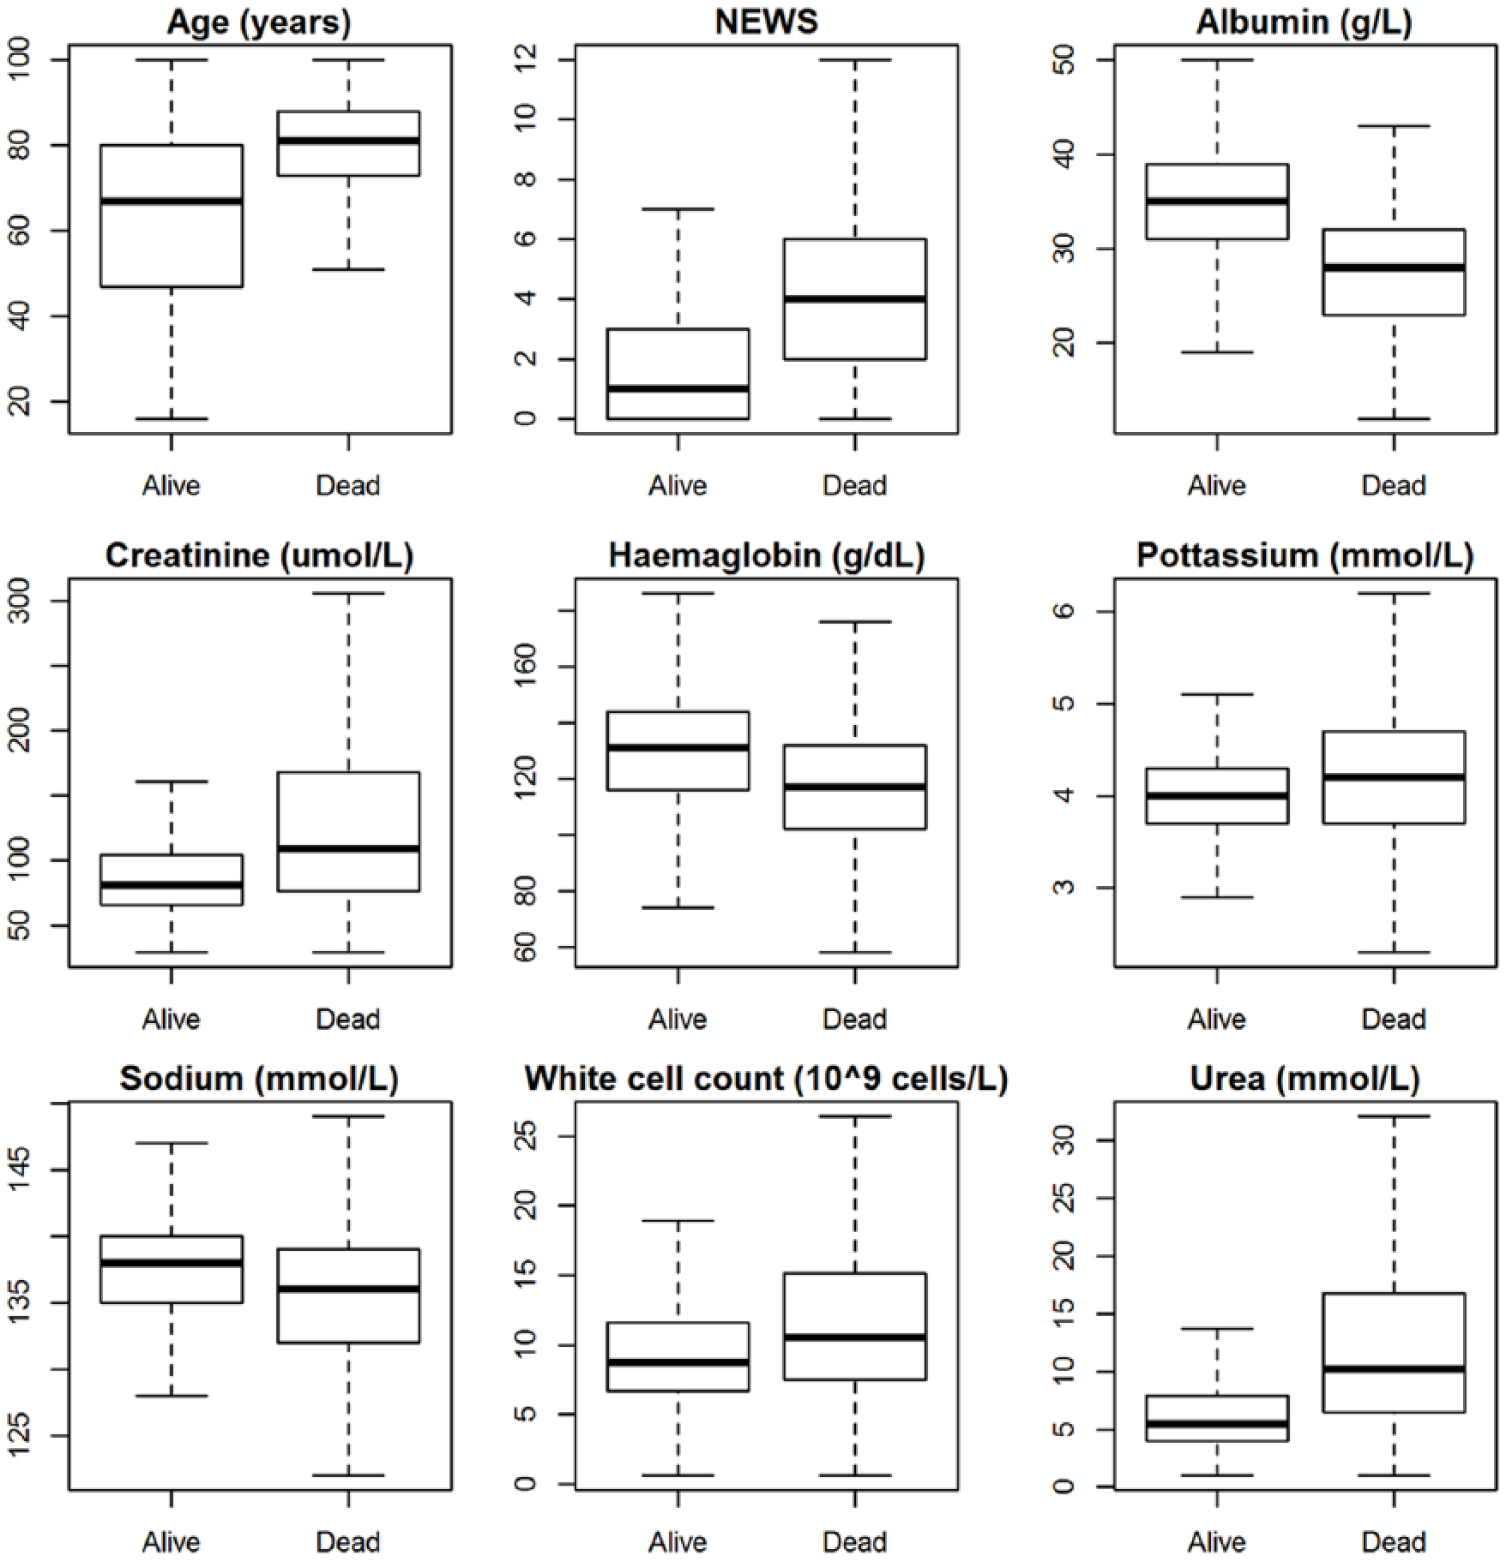
Boxplot without outliers for continuous covariates with respect to patient’s discharge status (alive/dead) in NLAG Hospital.
It can be seen from Figure 2 that the relationship between the continuous covariates and mortality in NLAG Hospital is generally non-linear. Using quantile–quantile (qq) plots, we arrived at the following transformations:
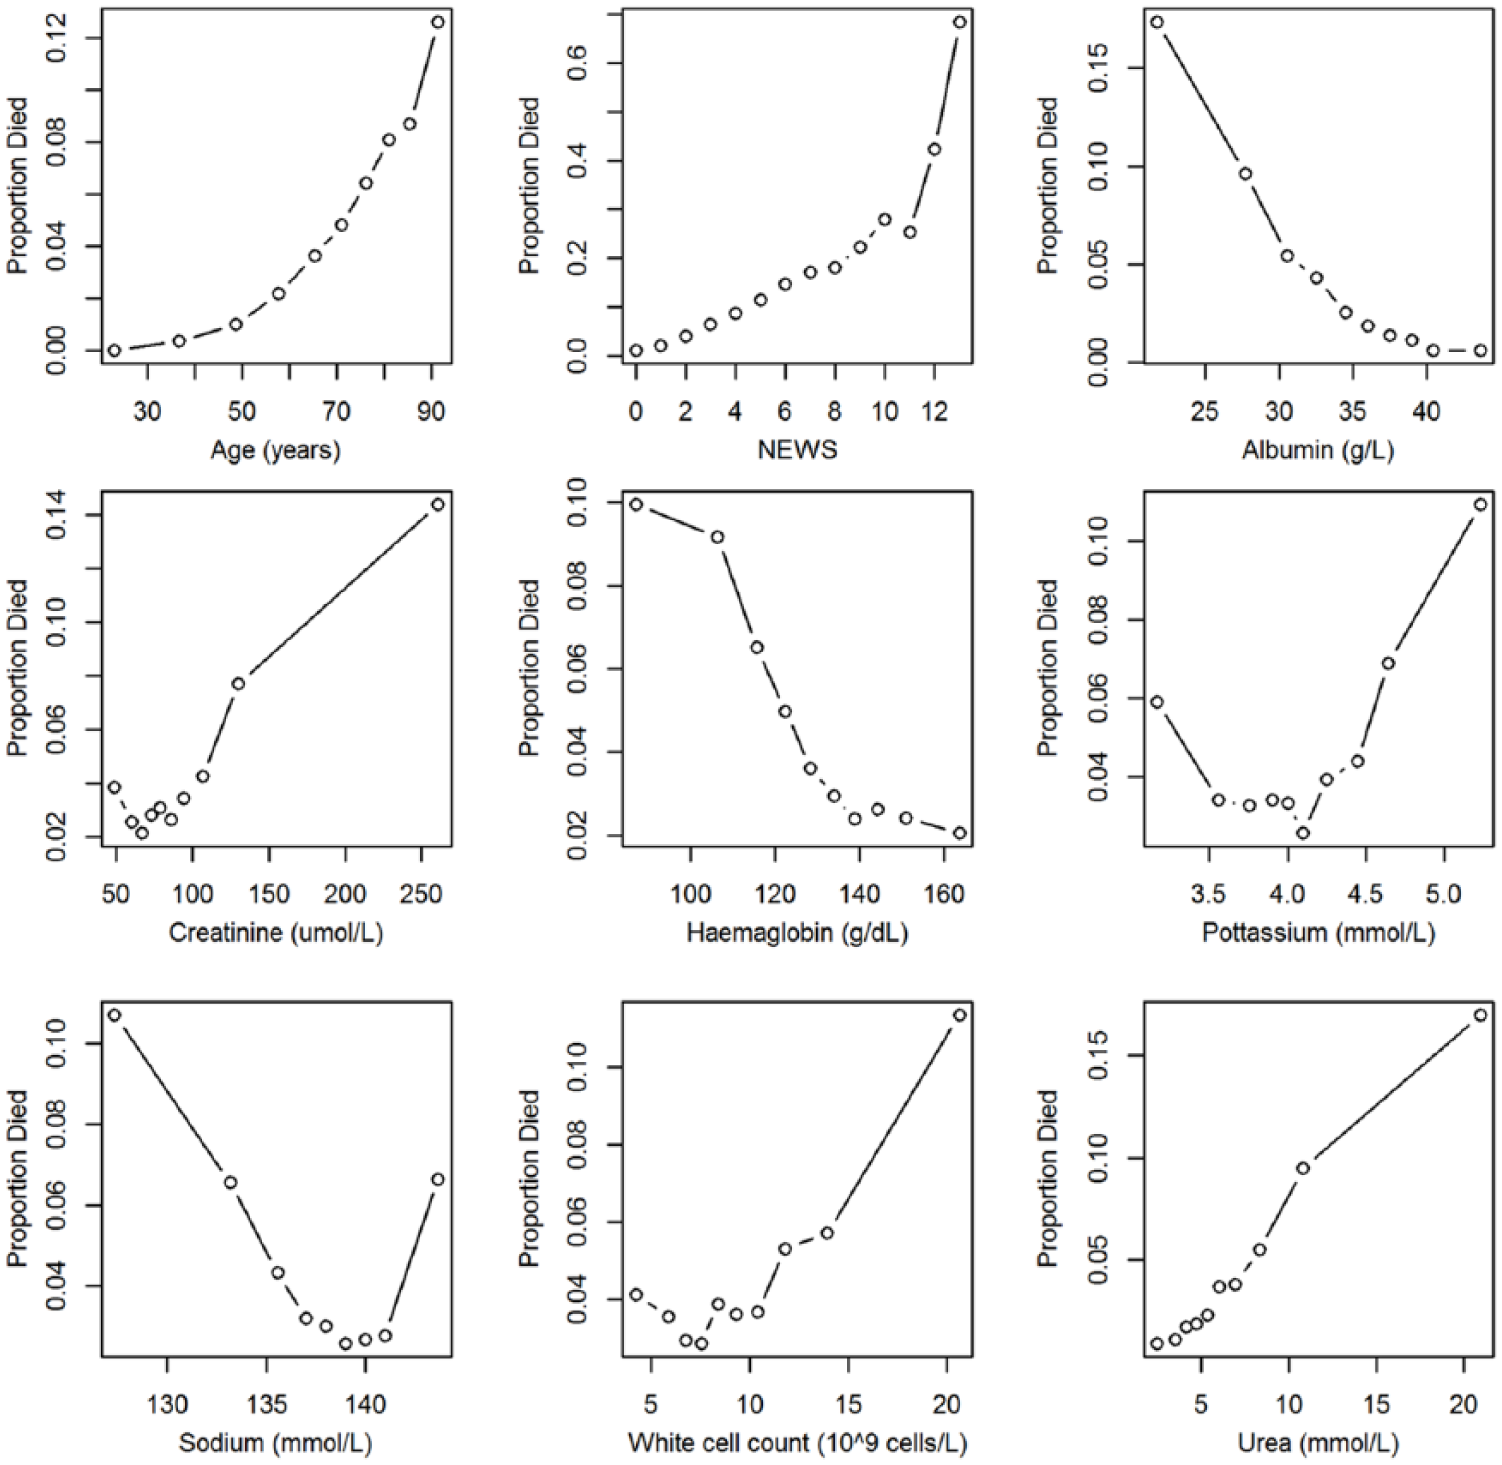
Scatter plots showing the observed risk of death with continuous covariates in NLAG Hospital.
Statistical modelling results
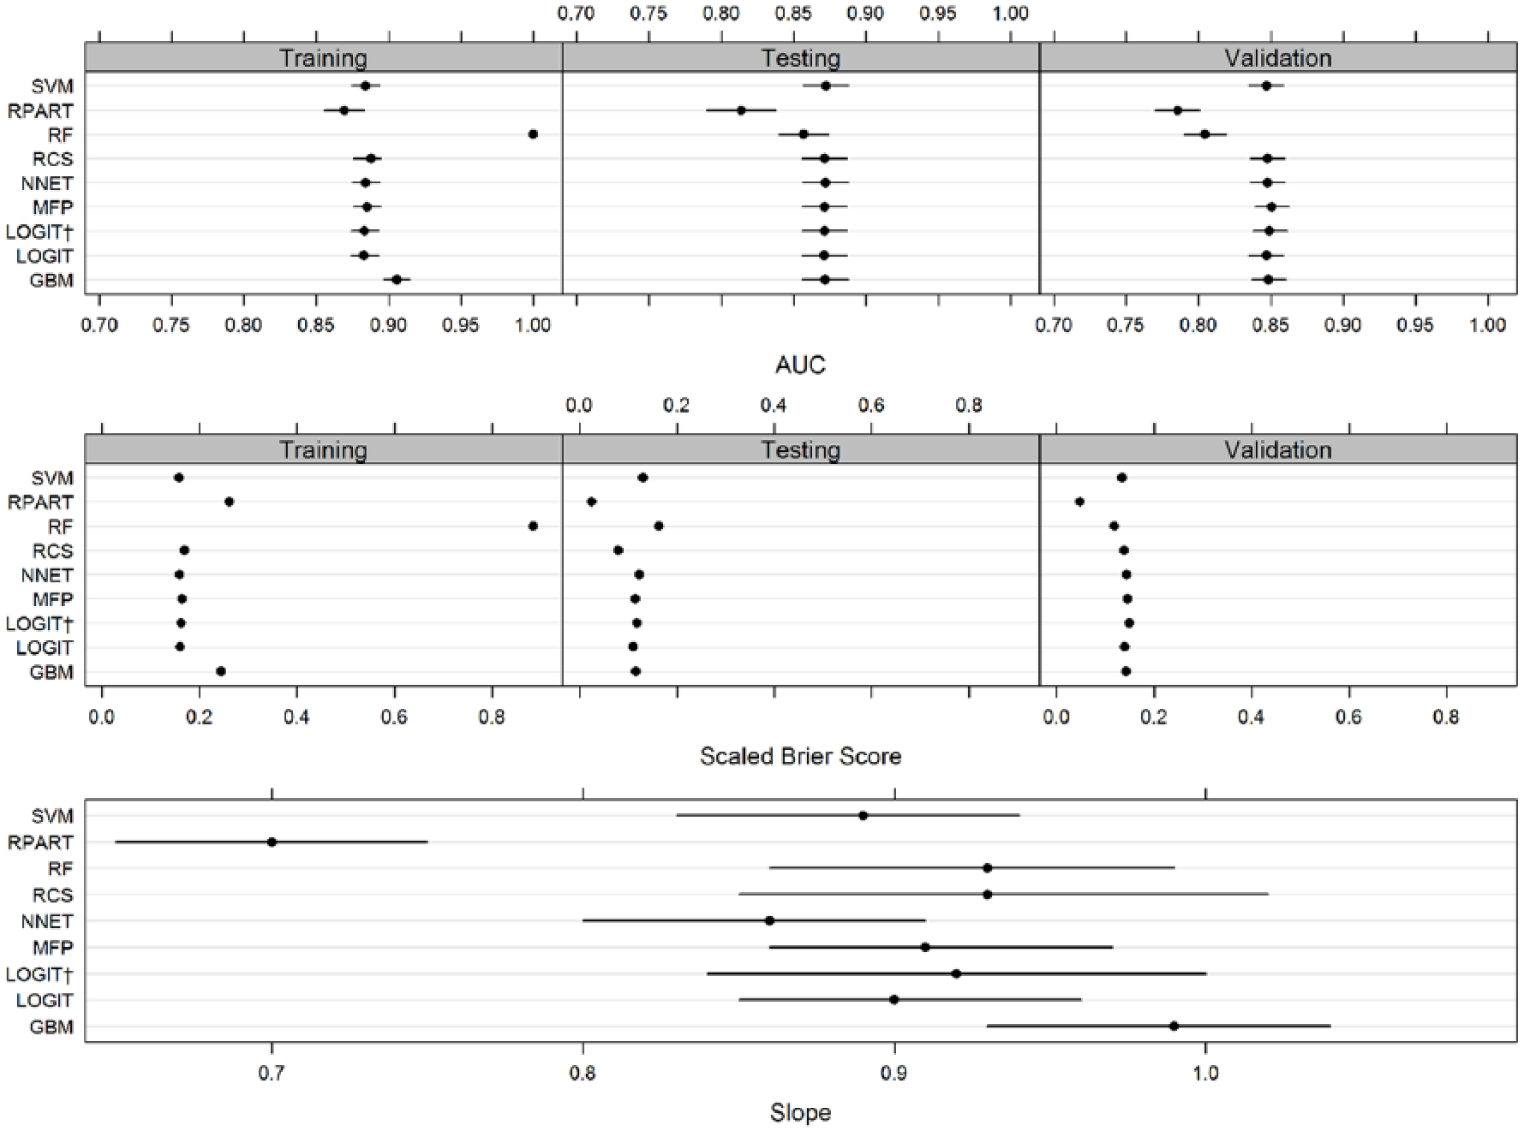
We predicted the risk of in-hospital mortality using the following modelling approaches – LOGIT (no transformations), LOGIT† (with transformations), MFP, RCS, RPART, RF, GBM, SVM and NNET. The model performance statistics are shown in Table 2 and plotted in Figure 3.
Model performance statistics using regression methods for all models (LOGIT, LOGIT†, MFP, RCS, RPART, RF, GBM, SVM and NNET).
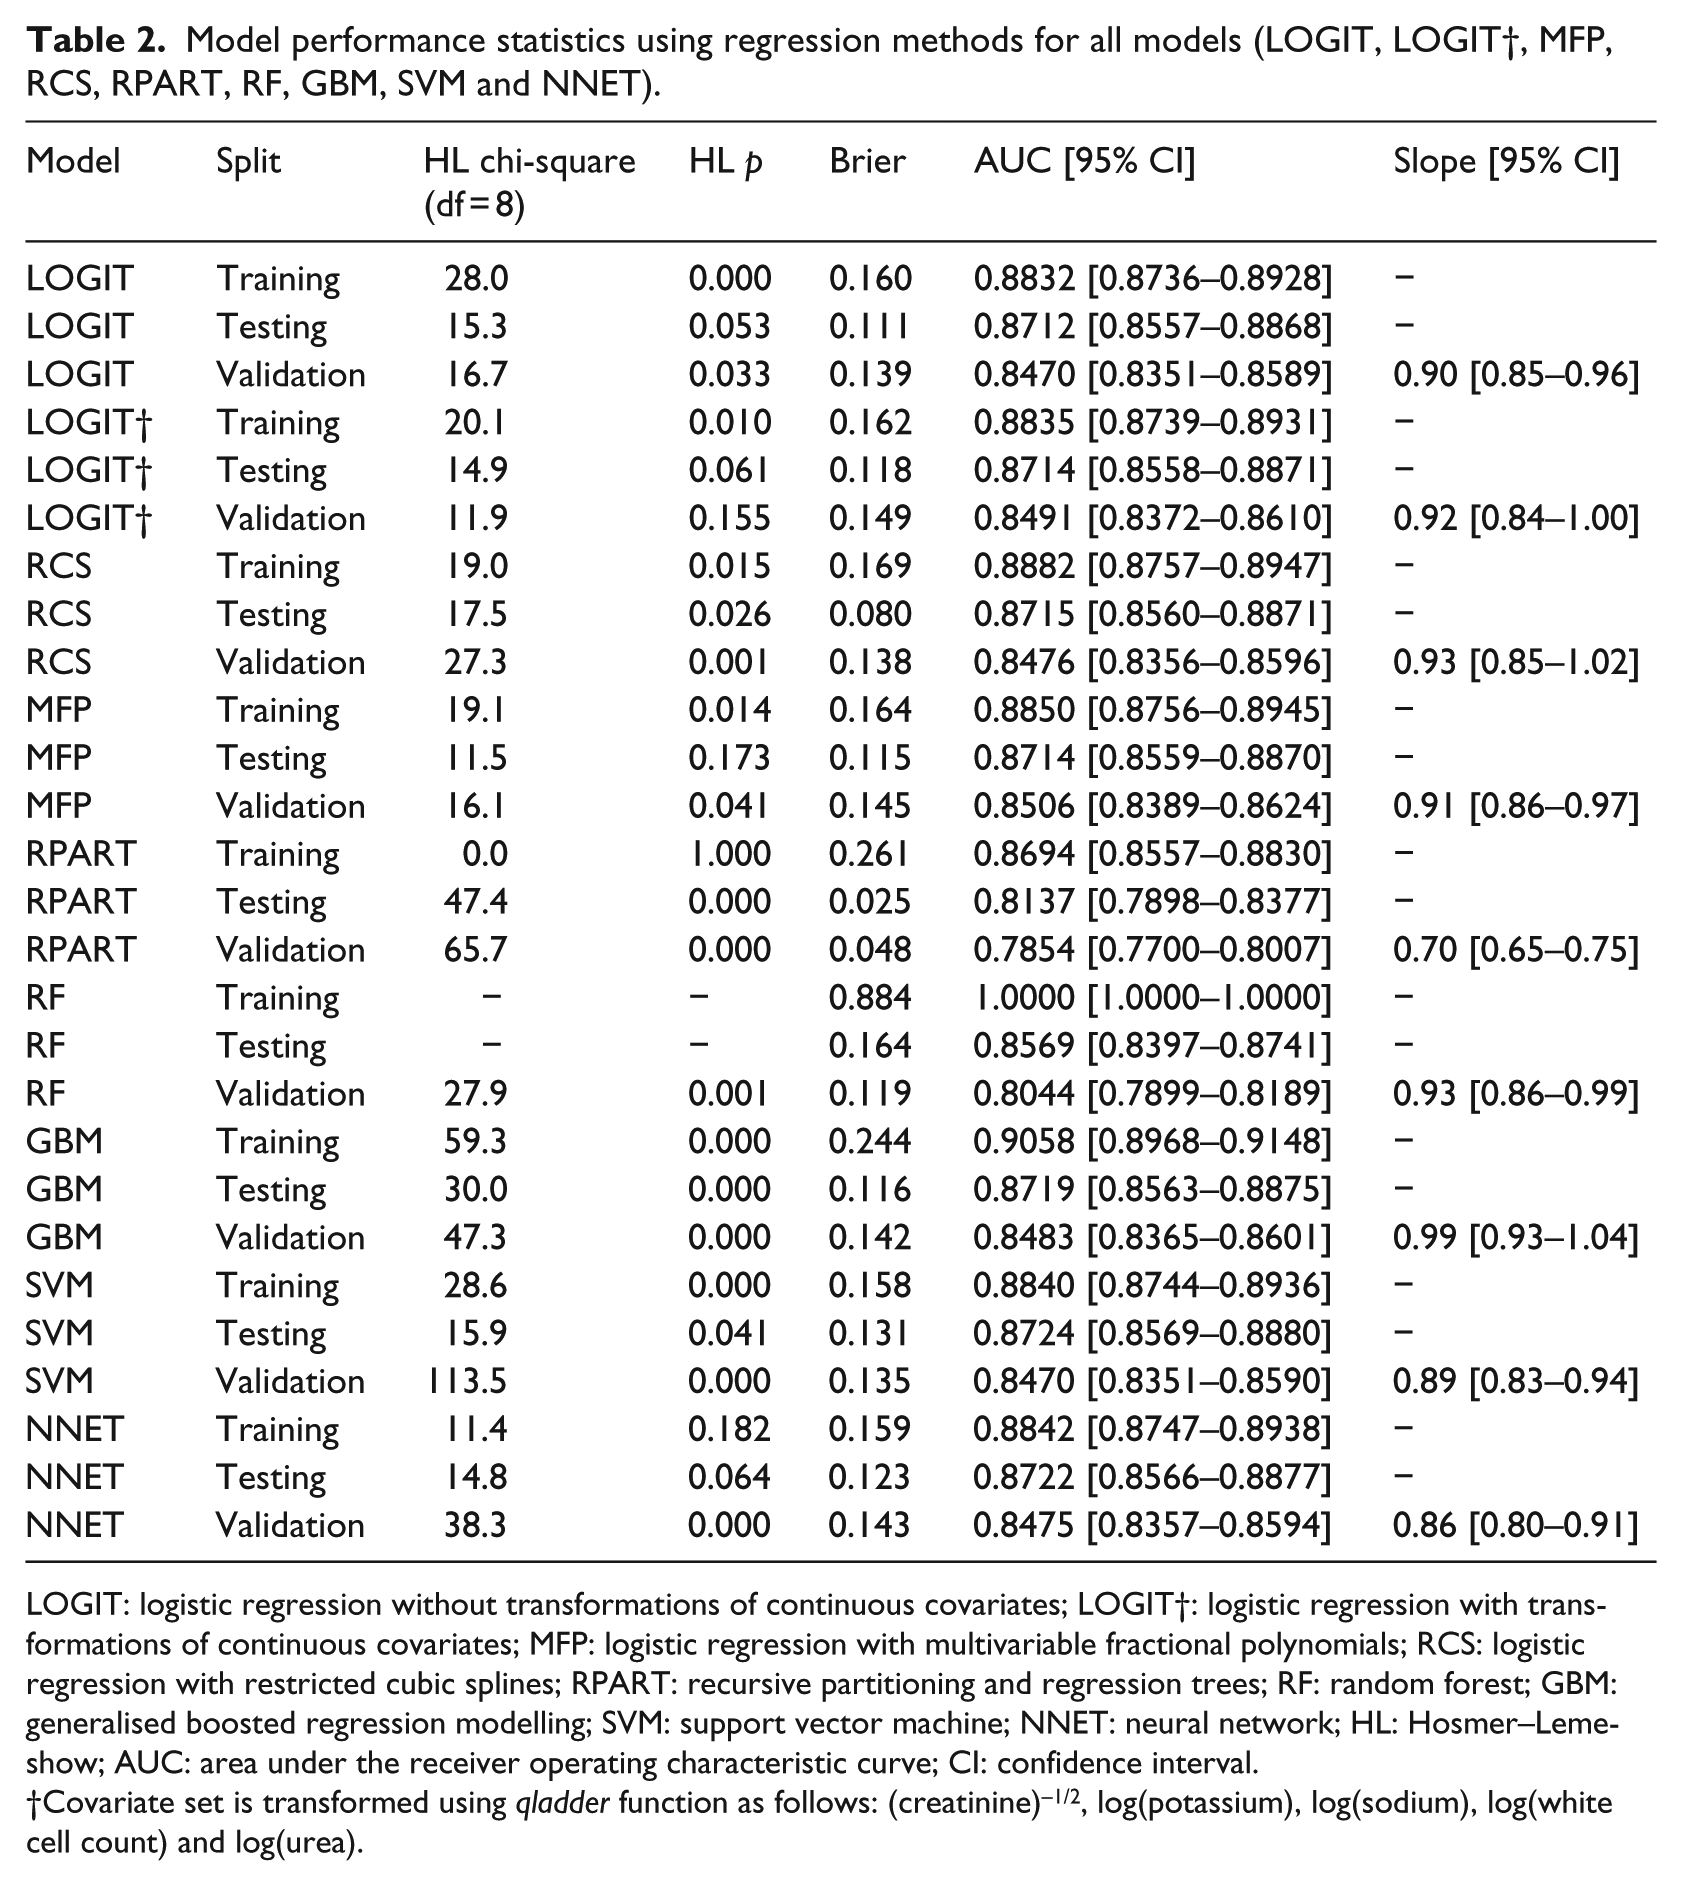
LOGIT: logistic regression without transformations of continuous covariates; LOGIT†: logistic regression with transformations of continuous covariates; MFP: logistic regression with multivariable fractional polynomials; RCS: logistic regression with restricted cubic splines; RPART: recursive partitioning and regression trees; RF: random forest; GBM: generalised boosted regression modelling; SVM: support vector machine; NNET: neural network; HL: Hosmer–Lemeshow; AUC: area under the receiver operating characteristic curve; CI: confidence interval.
Covariate set is transformed using qladder function as follows: (creatinine)–1/2, log(potassium), log(sodium), log(white cell count) and log(urea).
Model performance statistics using regression methods for all models (LOGIT, LOGIT†, MFP, RCS, RPART, RF, GBM, SVM and NNET).
In the training phase, the AUC ranged from 0.87 to 1. RF had a perfect AUC (1) which is a reflection of the overfitting that usually occurs when RF trees are grown to the maximum size in training datasets using the default (and recommended) settings. GBM had the highest AUC (0.905). RPART had the lowest AUC (0.869). The other five methods (LOGIT, LOGIT†, MFP, NNET and SVM) had AUCs that ranged from 0.883 to 0.884. In the training phase, RF had the highest Brier score (0.884 which is also due to overfitting) followed by GBM and RPART (0.244, 0.261). The remaining six methods (LOGIT, LOGIT†, RCS, MFP, SVM and NNET) had Brier scores that ranged from 0.158 to 0.164.
In the testing phase, all methods had a reduction in their AUC (range: 0.814–0.872) and Brier scores (range: 0.025–0.164). RPART now had the lowest AUC (0.814) followed by RF (0.857). The remaining seven methods (LOGIT, LOGIT†, RCS, MFP, RF, NNET, GBM and SVM) had very similar AUC that ranged from 0.871 to 0.872. In the testing phase, RPART had the lowest Brier score (0.025) followed by RCS (0.080). The highest Brier Score was seen in RF (0.164). The remaining six methods (LOGIT, LOGIT†, MFP, GBM, NNET and SVM) had Brier scores that ranged from 0.111 to 0.131.
In the external validation phase, all methods had a reduction in their AUC (range: 0.785–0.851) and Brier Scores (0.048–0.149). The highest AUC (0.851) and Brier score (0.149) were seen in the LOGIT† model. The lowest AUC was seen in RPART (0.785) followed by RF (0.804). The remaining models (LOGIT, RCS, MFP, GBM, SVM and NNET) had AUC that ranged from 0.847 to 0.851. The lowest Brier score was seen in RPART (0.048) followed by RF (0.119), while the remaining methods (LOGIT, LOGIT†, RCS, MFP, GBM, NNET and SVM) had Brier scores which ranged from 0.135 to 0.149.
The external validation calibration slope (Figure 3, lower panel) ranged from 0.70 to 0.99, with RPART having the lowest value which showed considerable overfitting (slope < 1). Three methods (RCS, LOGIT† and GBM) had a 95% CI which included one. GBM had an external validation slope nearest to 1, that is, 0.99.
The LOGIT model without transformations performed reasonably well in the external validation phase – AUC (0.847), Brier score (0.139) and slope (0.90). The LOGIT† also performed well – AUC (0.847), Brier score (0.149) and slope (0.92). The RCS and MFP models also had similar AUC (0.85) and Brier scores (0.138 and 0.148, respectively). The RCS slope was higher which is 0.93 with a wider 95% CI that included one, while MFP had a slope of 0.91 and a narrower 95% CI which did not include one. As the sample size is the same for all methods, the source of variability in the width of the CIs is linear predictors from each method and identifies RCS as having the widest CIs for their estimates of the external validation slope.
Discussion
Using a high-quality electronically collected data set with large sample sizes and non-linear relationships between covariates and mortality, we examined the performance of nine methods for predicting the risk of in-hospital mortality by developing the model in one hospital and externally validating it in another hospital. This approach to model testing is infrequent27,28 but methodologically more rigorous than simply considering internal validation. 26
We did not find any consistent evidence to suggest that modern machine learning approaches (RPART, RF, GBM, SVM and NNET) were superior to more conventional statistical modelling methods based on the logistic regression model. While there was no clear overall winner, GBM and LOGIT† exhibited the best overall performance. However, we did find that several methods (RPART and RF) exhibited sufficiently poor performance in the external validation phase to undermine their use. Furthermore, given the complexity of choosing tuning parameters of the alternative machine learning methods, the logistic regression with transformations has good performance characteristics and is relatively less complex.
Although a few studies have used external validation as a benchmark for machine learning and logistic regression methods in the following areas: detecting prostate cancer,37,38 on simulated data, 39 predicting mortality risk after acute ischemic stroke 40 and predicting mortality risk after brain injury,23,41 we predicted the risk of in-hospital mortality in acutely ill medical admissions. Our findings are consistent with the recently published study on predicting the risk of mortality after traumatic brain injury. 41 As they found, logistic regression performs just as good as modern machine learning methods. A key reason for this may be that non-linear and non-additive signals are not strong enough to make modern machine learning methods advantageous.
While the extent to which our findings are generalisable is not clear, we suggest that the candidate models should include a simple logistic model as a benchmark for comparison with other more sophisticated models and that external validation (not internal validation) be used to compare and contrast model performance. Furthermore, the use of the AUC alone as a summary performance measure is limited and not necessarily a good discriminator between models. The Brier score, which combines calibration and discrimination, and the external calibration slope are also useful performance characteristics which merit consideration when comparing models.
Conclusion
Given the complexity of choosing tuning parameters of the modern machine learning methods considered above, the performance of logistic regression with transformations for in-hospital mortality prediction was competitive with the best performing alternative machine learning methods with no evidence of overfitting. The use of RPART and RF in our data is not supported. Our models were developed (using training and testing datasets) in one hospital and validated in a second (different) hospital within the region which increases the likelihood of generalisability to other hospitals. Having established the validity of the logistic regression modelling approach, we plan to evaluate its use in routine clinical practice to see if it can support clinical decision making to enhance the quality of care.
Supplemental Material
revised_supplementary_material_(1) – Supplemental material for A comparison of logistic regression models with alternative machine learning methods to predict the risk of in-hospital mortality in emergency medical admissions via external validation
Supplemental material, revised_supplementary_material_(1) for A comparison of logistic regression models with alternative machine learning methods to predict the risk of in-hospital mortality in emergency medical admissions via external validation by Muhammad Faisal, Andy Scally, Robin Howes, Kevin Beatson, Donald Richardson and Mohammed A Mohammed in Health Informatics Journal
Footnotes
Acknowledgements
M.A.M. and M.F. had the original idea for this work and undertook the statistical analyses. R.H. and K.B. extracted the necessary data frames. D.R. gave a clinical perspective. A.S. contributed to study design and interpretation of results. M.A.M. and M.F. wrote the first draft of this paper and all authors subsequently assisted in redrafting and have approved the final version.
Declaration of conflicting interests
The author(s) declared no potential conflicts of interest with respect to the research, authorship and/or publication of this article.
Funding
The author(s) disclosed receipt of the following financial support for the research, authorship, and/or publication of this article: This research was supported by the Health Foundation. The Health Foundation is an independent charity working to improve the quality of healthcare in the United Kingdom. This research was supported by the National Institute for Health Research (NIHR) Yorkshire and Humberside Patient Safety Translational Research Centre (NIHR YHPSTRC). The views expressed in this article are those of the author(s) and not necessarily those of the NHS, the NIHR or the Department of Health and Social Care.
Supplemental material
Supplemental material for this article is available online.
References
Supplementary Material
Please find the following supplemental material available below.
For Open Access articles published under a Creative Commons License, all supplemental material carries the same license as the article it is associated with.
For non-Open Access articles published, all supplemental material carries a non-exclusive license, and permission requests for re-use of supplemental material or any part of supplemental material shall be sent directly to the copyright owner as specified in the copyright notice associated with the article.