
Abstract
Internationally, investment in the availability of routine health care data for improving health, health surveillance and health care is increasing. We assessed the validity of hospital episode data for identifying individuals with chronic kidney disease compared to biochemistry data in a large population-based cohort, the Grampian Laboratory Outcomes, Morbidity and Mortality Study-II (n = 70,435). Grampian Laboratory Outcomes, Morbidity and Mortality Study-II links hospital episode data to biochemistry data for all adults in a health region with impaired kidney function and random samples of individuals with normal and unmeasured kidney function in 2003. We compared identification of individuals with chronic kidney disease by hospital episode data (based on International Classification of Diseases-10 codes) to the reference standard of biochemistry data (at least two estimated glomerular filtration rates <60 mL/min/1.73 m2 at least 90 days apart). Hospital episode data, compared to biochemistry data, identified a lower prevalence of chronic kidney disease and had low sensitivity (<10%) but high specificity (>97%). Using routine health care data from multiple sources offers the best opportunity to identify individuals with chronic kidney disease.
Introduction
Chronic kidney disease (CKD) has been identified as a worldwide public health problem with a rising incidence and prevalence 1 and is associated with high morbidity (cardiovascular disease, need for renal replacement therapy (RRT)), mortality and health care costs (estimated for England 2009–2010 to be £1.45 billion 2 ). Risk factors for CKD include diabetes, vascular disease, hereditary renal diseases, smoking and hypertension. In 2002, the Kidney Disease Outcomes Quality Initiative (KDOQI) defined and classified CKD based on kidney damage (structural or functional abnormalities of the kidney) with glomerular filtration rate (GFR, a measure of kidney function) ≥60 mL/min/1.73 m2 (stages 1–2) or GFR <60 mL/min/1.73 m2 alone (stages 3–5), present for at least 3 months. 1 Estimates of prevalence, based on the first part of this definition, in the United States suggest the prevalence of CKD stages 1–4 increased from 10.0 per cent in 1988–1994 to 13.1 per cent in 1999–2004. 3 However, other studies have reported varied prevalence rates of CKD (0.6%–42.6%). 4 In United Kingdom general practices, only 2.9 per cent are registered as having CKD. 5 Part of the variation in prevalence estimates may be due to how CKD is defined and the data sources used to identify individuals with CKD.
For many conditions, information on disease prevalence is estimated from disease registries, general practitioner (GP) registers and/or coding of hospital episodes (HEs). The use of HE data (recorded in Scotland as the Scottish Morbidity Record (SMR01)), either as single episodes or longitudinally linked episodes to identify comorbidities has been used extensively in research. 6 For acute events that almost exclusively require hospital admission (e.g. hip fracture), this may be a valid source of information. 7 For chronic diseases such as CKD, HE data may require supplementation from other sources of data to fully elucidate disease load and facilitate early identification. The United Kingdom government and others internationally have invested in routine health care data (i.e. funding opportunities, investment in digital health systems) since it is thought to be important for health and health care through research, health surveillance and health care planning.8–12
For individuals with CKD, early detection and management is believed to be important to reduce morbidity and slow progression to RRT. 13 However, the forum of care may vary with all patients requiring GP care and more advanced patients potentially requiring assessment by nephrology care. In the United Kingdom, there is no standard surveillance system for the identification of people with CKD. Ideally, those with CKD would be identified clinically from a combination of sources including biochemistry testing for estimated glomerular filtration rate (eGFR) and albuminuria; however, this relies on clinicians identifying and noting abnormal results and that these are sustained abnormalities rather than an acute change. This is sometimes difficult to achieve in regions where biochemistry testing is done by multiple providers and where not all results are returned to a single clinician responsible for compiling results. An alternative means of identifying those with CKD would be to flag those who have routine HE data consistent with this CKD diagnosis and subsequently informing GPs for follow-up and confirmation.
Two recent systematic reviews,14,15 and recent studies,16–19 have evaluated the degree to which administrative coding accurately identified individuals with kidney diseases, reporting a large variation in sensitivity (3%–88%). Only a few studies have compared hospital administrative data to laboratory data employing the 2002 KDOQI definition of CKD stages 3–5, of at least two eGFR <60 mL/min/1.73 m2 at least 90 days apart.18,20,21 Of these, only Ronksley et al. 18 did so in a community cohort, in Canada. Using a community-based population increases the generalisability of results as opposed to relying on, for example, a selected in-patient population. We did not identify any studies from the United Kingdom that compared HE data to laboratory data.
With the growing emphasis on the use of routine administrative data, validation studies become increasingly important in order to provide information on the accuracy and validity of findings that are based exclusively on these data. As administrative data have the potential to be a rich source of data for population-based research in CKD, we aimed to assess the validity of diagnostic algorithms for CKD in HE data compared to biochemistry data in a large population-based cohort in Grampian, Scotland.
Methods
We carried out a validation study within an existing cohort developed by data linkage of biochemistry, HE and death registry data.
Study population – Grampian Laboratory Outcomes, Morbidity and Mortality Study-II cohort
All in-patient, out-patient and community serum creatinine (isotope dilution mass spectrometry (IDMS) aligned) and urinary protein measurements in the Grampian region, served by a single United Kingdom National External Quality Assessment Service monitored biochemistry service, are contained in the Grampian Laboratory Renal Database for 1999 to 2009. This database was queried to identify the Grampian Laboratory Outcomes, Morbidity and Mortality Study-II (GLOMMS-II) cohort, which comprised all adults (>15 years) with impaired kidney function in 2003; a random sample of individuals with normal or no measure of kidney function in 2003 (but prior and post 2003 sampling); all those with proteinuria but normal kidney function in 2003; and all individuals on RRT at 1 January 2003 (identified from Scottish Renal Registry and local renal system). Where present, the first ‘low’ eGFR <60 mL/min/1.73 m2 in 2003 was taken as the index value and date. Where all values in 2003 were normal, the last value and date were taken as the index. Where no samples were taken in 2003, the index date was taken as 31 December 2003 to allow the potential for the individual to be sampled.
Defining CKD from biochemistry data
eGFR was calculated using the four-variable IDMS aligned Modification of Diet in Renal Disease (MDRD) formula (serum creatinine, age, sex and race). CKD was defined and staged according to KDOQI. 1 CKD stages 3–5 (including 3a and 3b) were defined as an index eGFR (<60 mL/min/1.73 m2) in 2003 followed after 90 days by another low eGFR (<60 mL/min/1.73 m2), or if there were no further eGFR values after 90 days post-index, the last eGFR prior to 90 days pre-index also being low, that is, between the start of the database records in 1999 and the index value. CKD stages 1–2 were defined as an index eGFR (>60 mL/min/1.73 m2) with microalbuminuria or macroalbuminuria on urine albumin-creatinine ratio (ACR) or protein-creatinine ratio (PCR) testing. Individuals were categorised as not having CKD if their index eGFR was not measured, was normal or was impaired but not CKD (at least one eGFR <60 mL/min/1.73 m2 but with no evidence that this was sustained for at least 3 months).
Defining CKD from HE data
In the United Kingdom, information about an episode of hospital care is recorded following a patient’s discharge. In Scotland, this information is recorded in the SMR01, which is collated nationally by the Information Services Division (ISD), part of NHS National Services Scotland. SMR01 is an episode-based patient record relating to all in-patient and day case discharges. This information contributes to NHS Scotland’s Performance Assessment Framework, clinical governance and performance indicators, and for planning and research purposes. 22 Diagnoses are coded using International Classification of Diseases, 10th Revision (ICD-10) and procedures coded using the Office of Population Censuses and Surveys (OPCS) Classification of Interventions and Procedures. We defined CKD for each patient from HE data for two time periods: 2003 (including admission at index) and a 5-year ‘look-back’ period.
To identify potentially relevant codes to define CKD, an experienced nephrologist reviewed all ICD-10 and OPCS codes. Three groups of codes (algorithms) were developed (Table 1): first, a broad definition encompassing most diseases which might include renal complications (‘all codes’); second, an algorithm to define renal disease based on a Charlson comorbidity algorithm 23 (‘renal disease’); and third, an algorithm highly likely to identify CKD (‘chronic kidney disease’).
Renal disease-related ICD-10 and OPCS codes (algorithms).
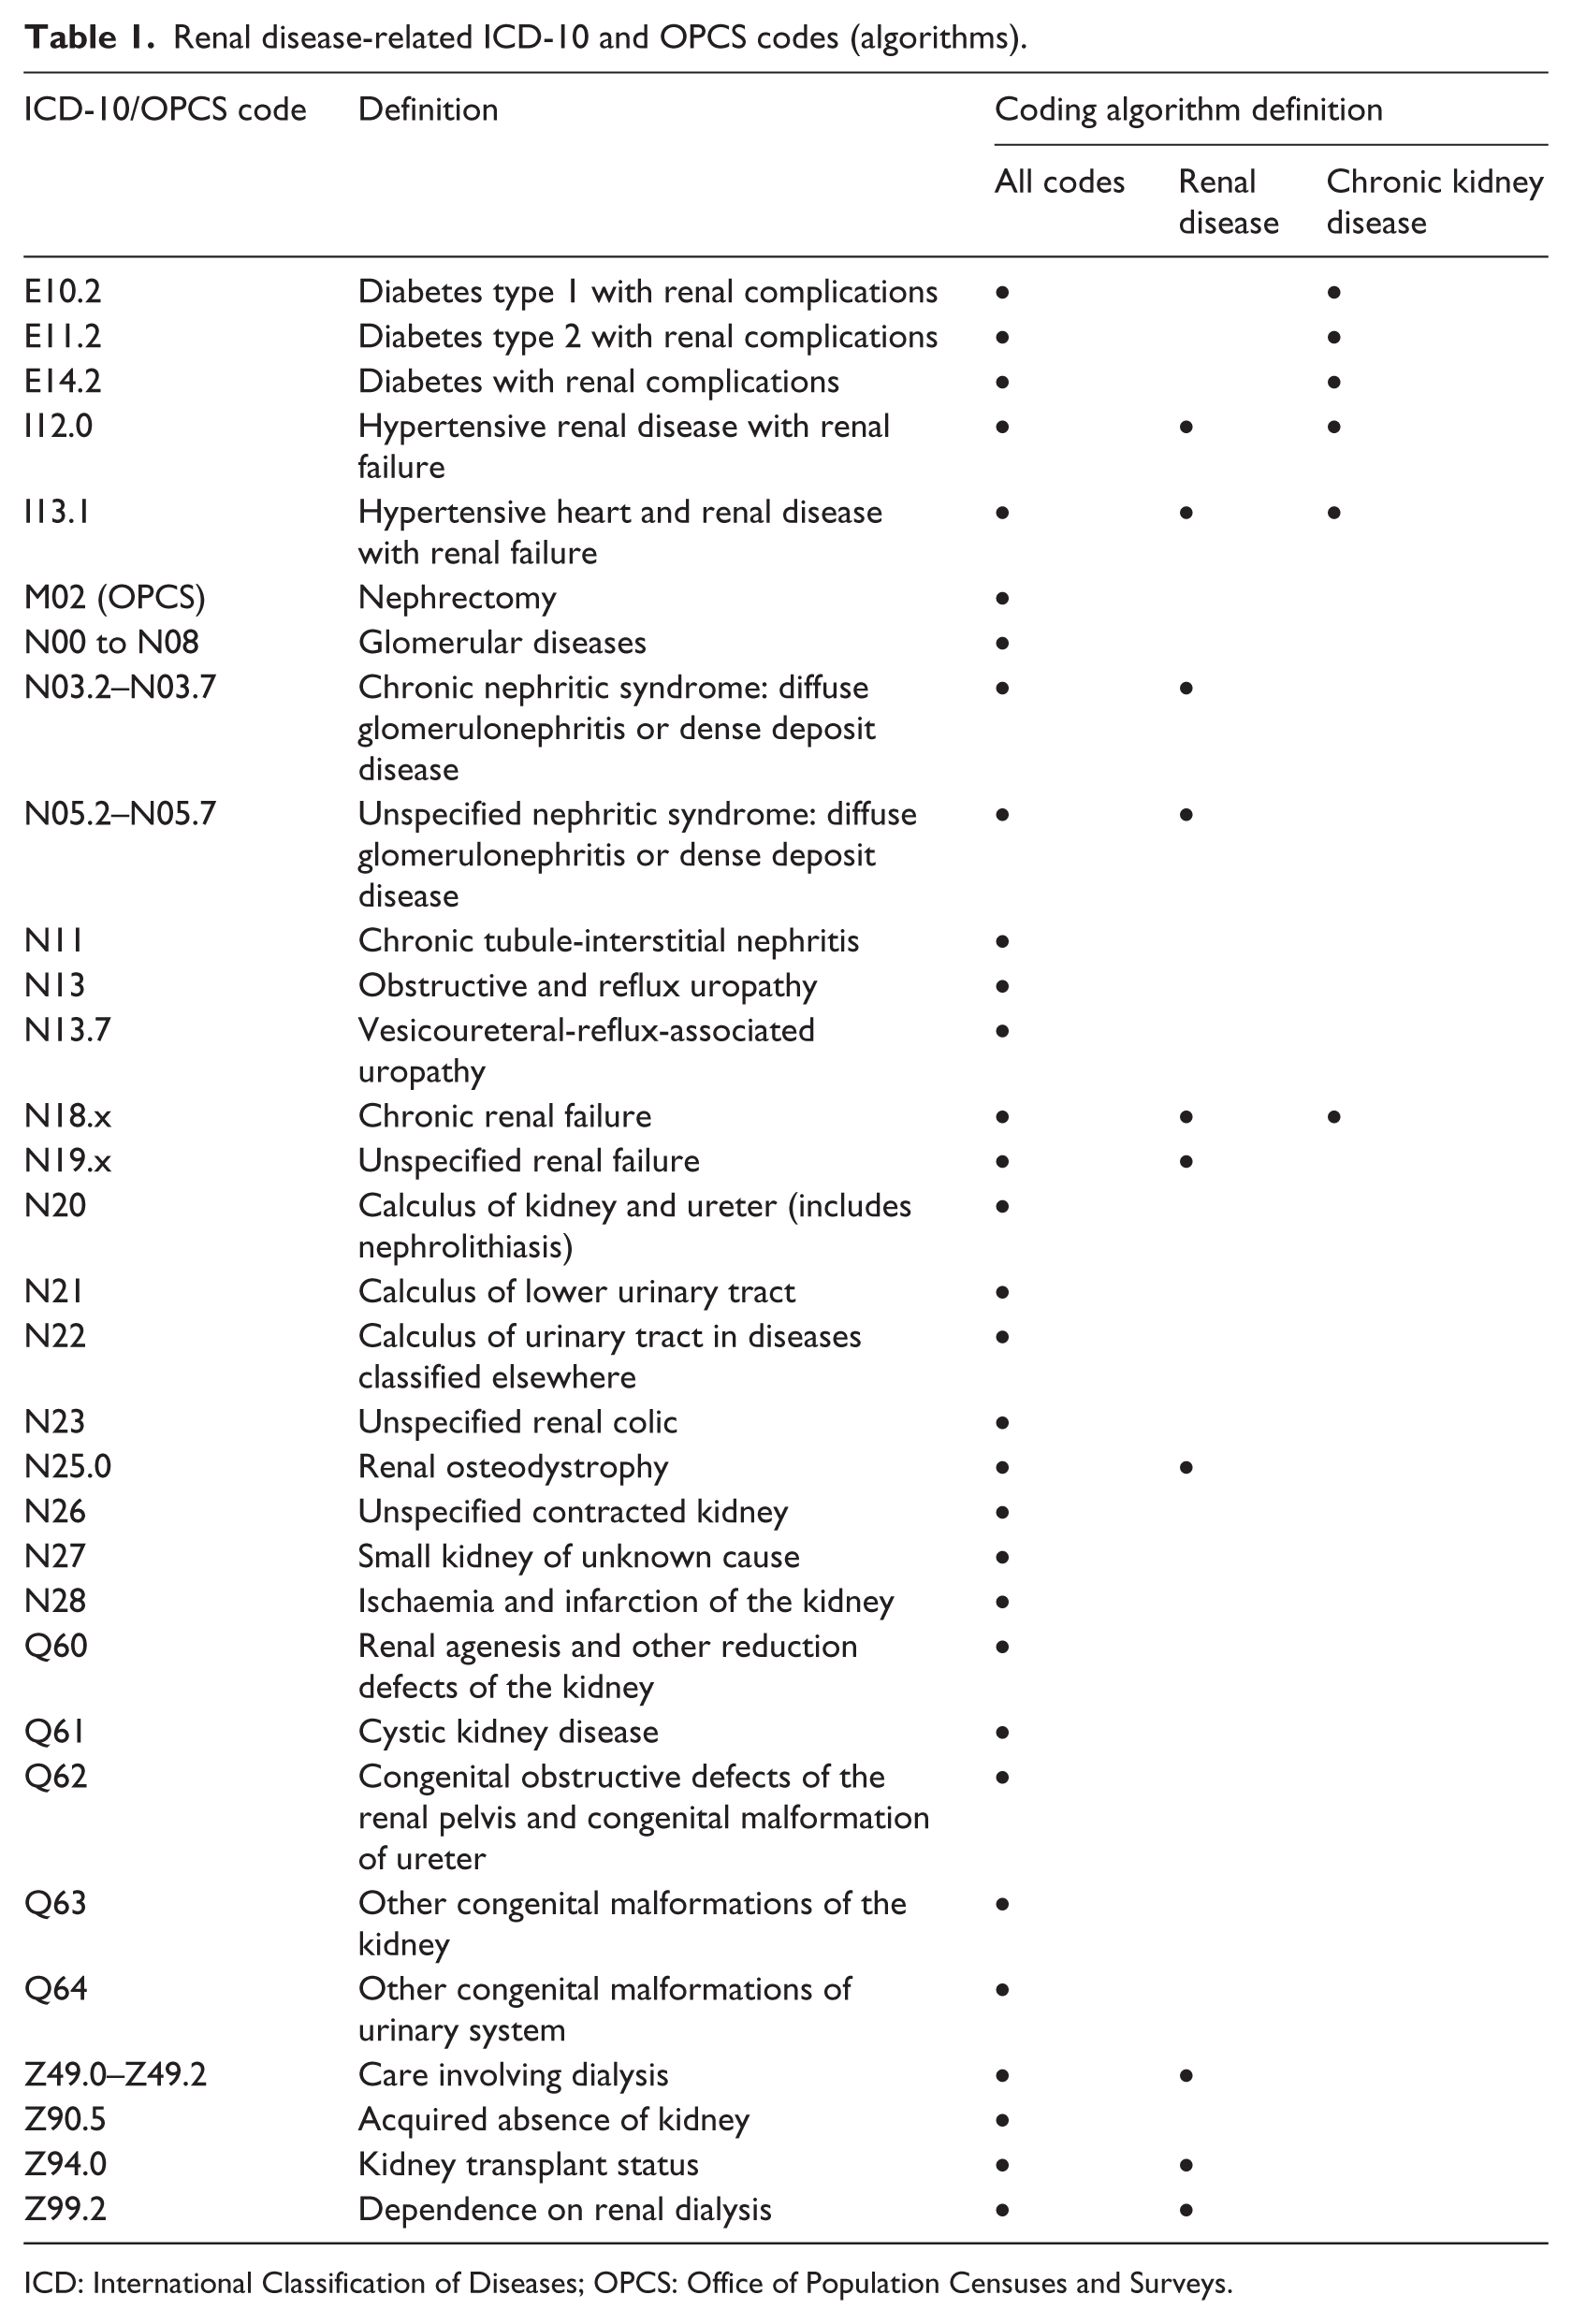
ICD: International Classification of Diseases; OPCS: Office of Population Censuses and Surveys.
Data linkage
The Community Health Index (CHI) number, a unique patient identifier used throughout the Scottish health care system, was used to link GLOMMS-II with HE data using deterministic matching. Patient identifiers were removed after data linkage. The dataset was stored in the Grampian Data Safe Haven allowing secure controlled access for researchers while ensuring data security. 24
The flow diagram for generating GLOMMS-II is shown in Figure 1. From the database query, 71,251 individuals were identified. There were 471 excluded from the analysis because of missing information on index date, duplication or death on index date. The 345 people already on RRT at index (thus end-stage renal disease, not just CKD) were excluded from the analysis (74.8% had a ‘CKD’ code from SMR01). Overall, 70,435 individuals were included in this study.
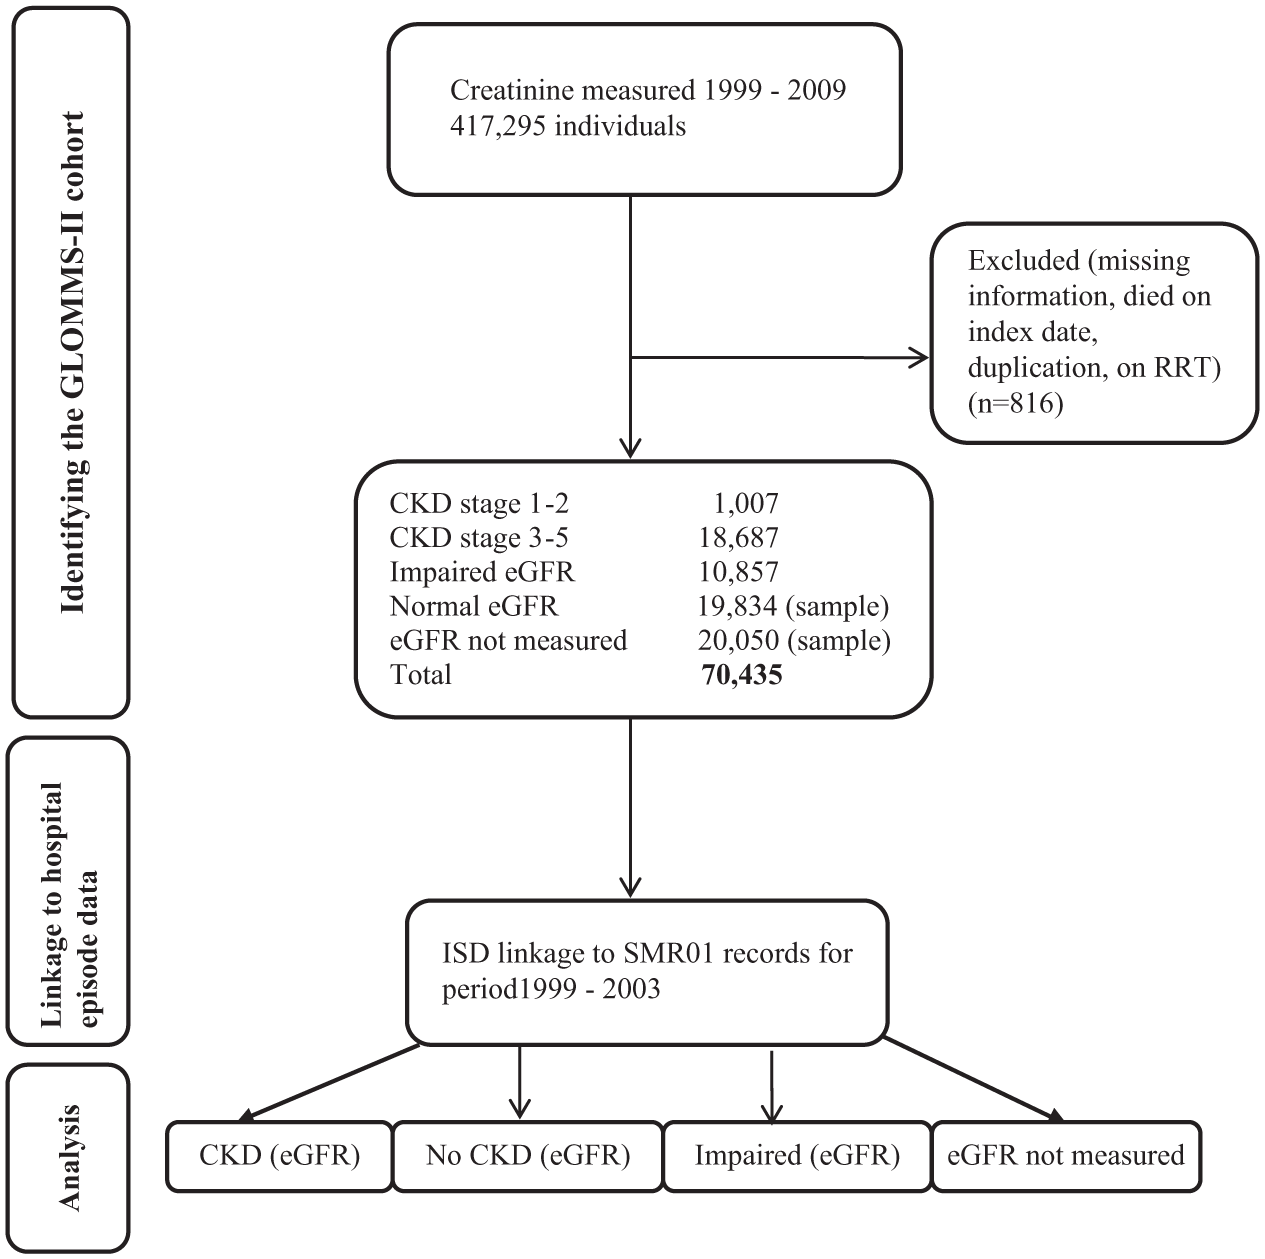
GLOMMS-II flow diagram.
Statistical analysis
Descriptive statistics were used to describe demographic, proteinuria/albuminuria status, creatinine, eGFR and comorbidity variables stratified by renal risk group (CKD stages 1–5/normal eGFR, impaired eGFR or eGFR not measured). Comorbidity was based on the Charlson comorbidity index, 25 which is a weighted index that takes into account the number and seriousness of comorbid disease. The proportion of the cohort with CKD identified by biochemistry data and the proportion of the cohort with CKD identified by HE data were calculated. The validity of HE data–identified CKD was assessed for the three coding algorithms and two time periods: 2003 (including admission at index) and a 5-year ‘look-back’ period.
Sensitivity, specificity, positive predictive value (PPV) and negative predictive value (NPV) were calculated against the reference standard of CKD (biochemistry data). Kappa values, κ (a measure of agreement between two sets of categorical measurements on the same individuals), 26 were calculated. We categorised agreement as poor if κ ≤ 0.20, fair if 0.21 ≤ κ ≤ 0.40, moderate if 0.41 ≤ κ ≤ 0.60, substantial if 0.61 ≤ κ≤ 0.80 and good if κ > 0.80. 27
The validity of HE data–defined CKD within specific subgroups was considered, including CKD stage (stages 1–2, 3a, 3b, 4 and 5) and age (<75 or ≥75 years). To explore sensitivity further, analyses were repeated comparing HE data to an alternative definition for biochemistry-defined CKD, which excluded those with impaired eGFR and those with eGFR not measured from the no-CKD definition. Analyses were performed using Stata version 13 28 and Microsoft Excel.
Results
A total of 70,435 individuals were included. The characteristics of the study population are shown in Table 2. Based on biochemistry data, 28 per cent (19,694) of the cohort had CKD stages 1–5 (which equates to 4.5% of the adult Grampian population in 2003 (433,109) 29 ). Overall, the median age of the cohort was 63.3 years and 58.4 per cent were female. As expected, those with CKD were older than those with normal eGFR or ‘not measured’. Charlson comorbidity categories for CKD stages 1–5 and impaired eGFR were similarly distributed with more than two-thirds of individuals with a score of zero. Those with normal eGFR or ‘not measured’ in 2003 had the lowest Charlson scores. Of note, there were 63 individuals with macroalbuminuria but no eGFR measured. Of those with CKD identified by biochemistry, 6767 individuals had no hospital admission in the 5 years prior to 2003.
Characteristics of study population.
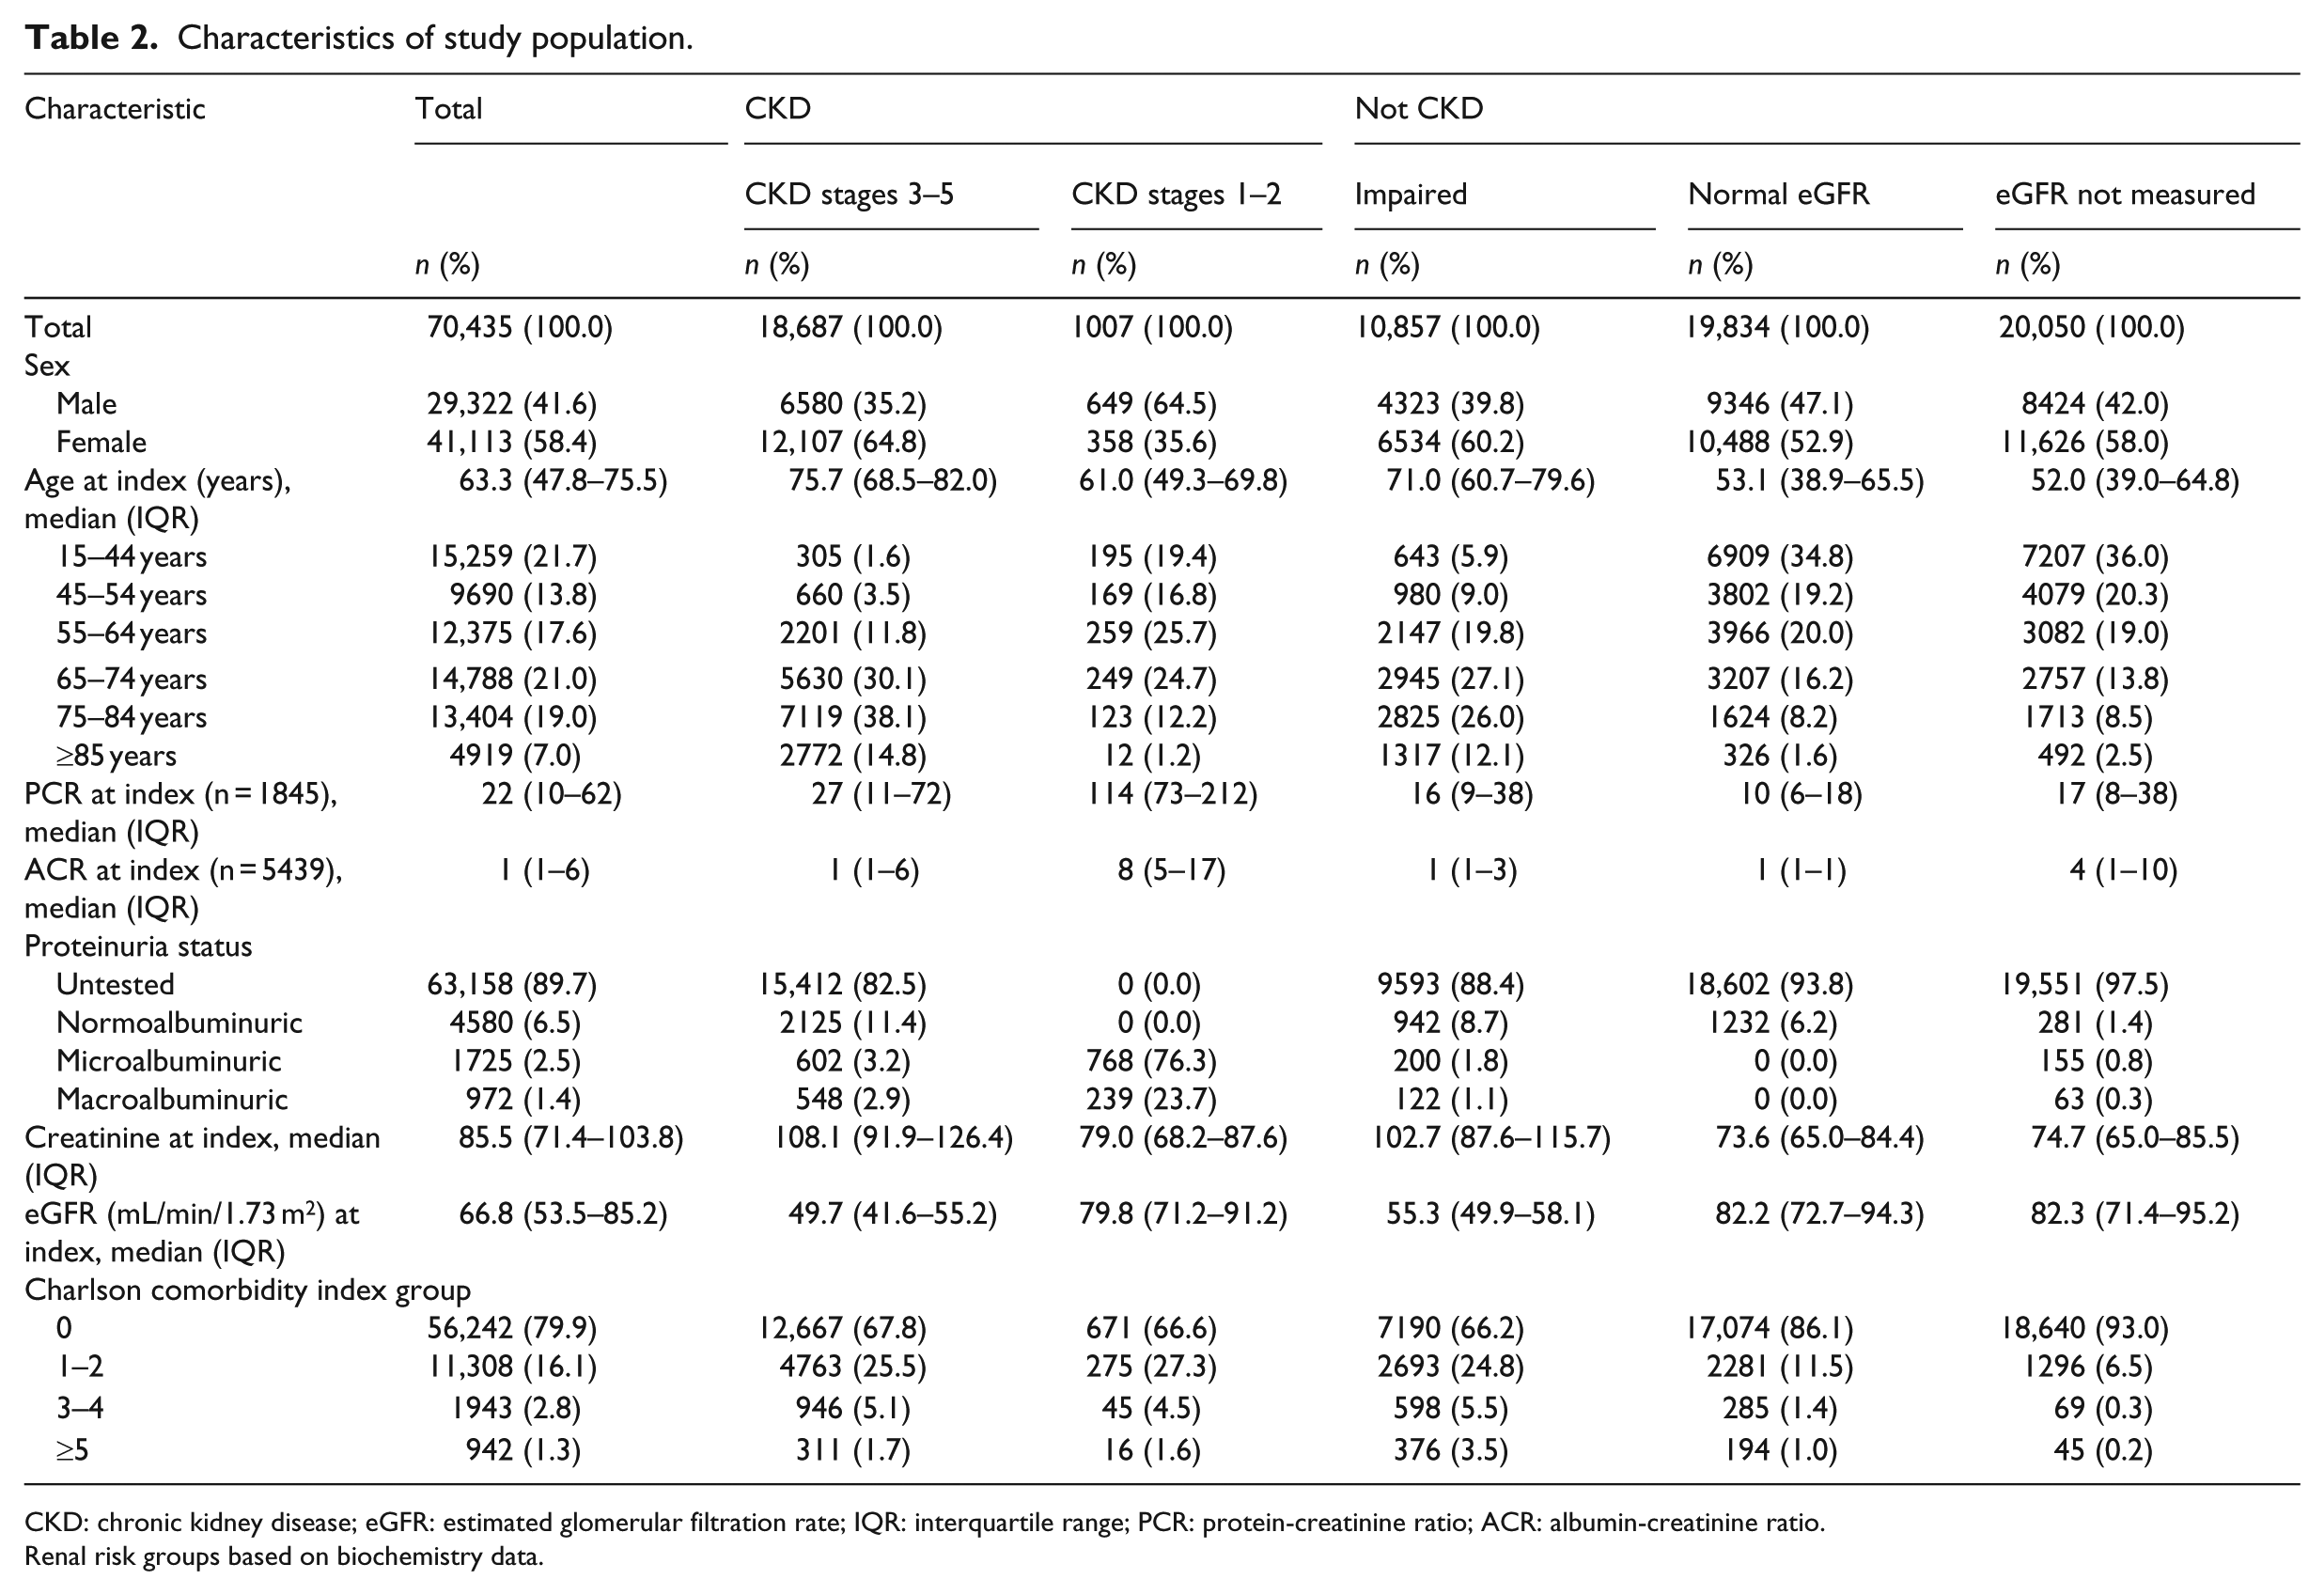
CKD: chronic kidney disease; eGFR: estimated glomerular filtration rate; IQR: interquartile range; PCR: protein-creatinine ratio; ACR: albumin-creatinine ratio.
Renal risk groups based on biochemistry data.
As shown in Table 3, based on the reference standard of biochemistry-defined CKD, 28 per cent (19,694) of the cohort had CKD stages 1–5. The proportion of the cohort identified with probable CKD by HE data was substantially lower, ranging from 0.8 per cent to 4.1 per cent over the three coding algorithms and two time periods.
Validity of HE data definition for CKD compared to the reference standard of biochemistry.
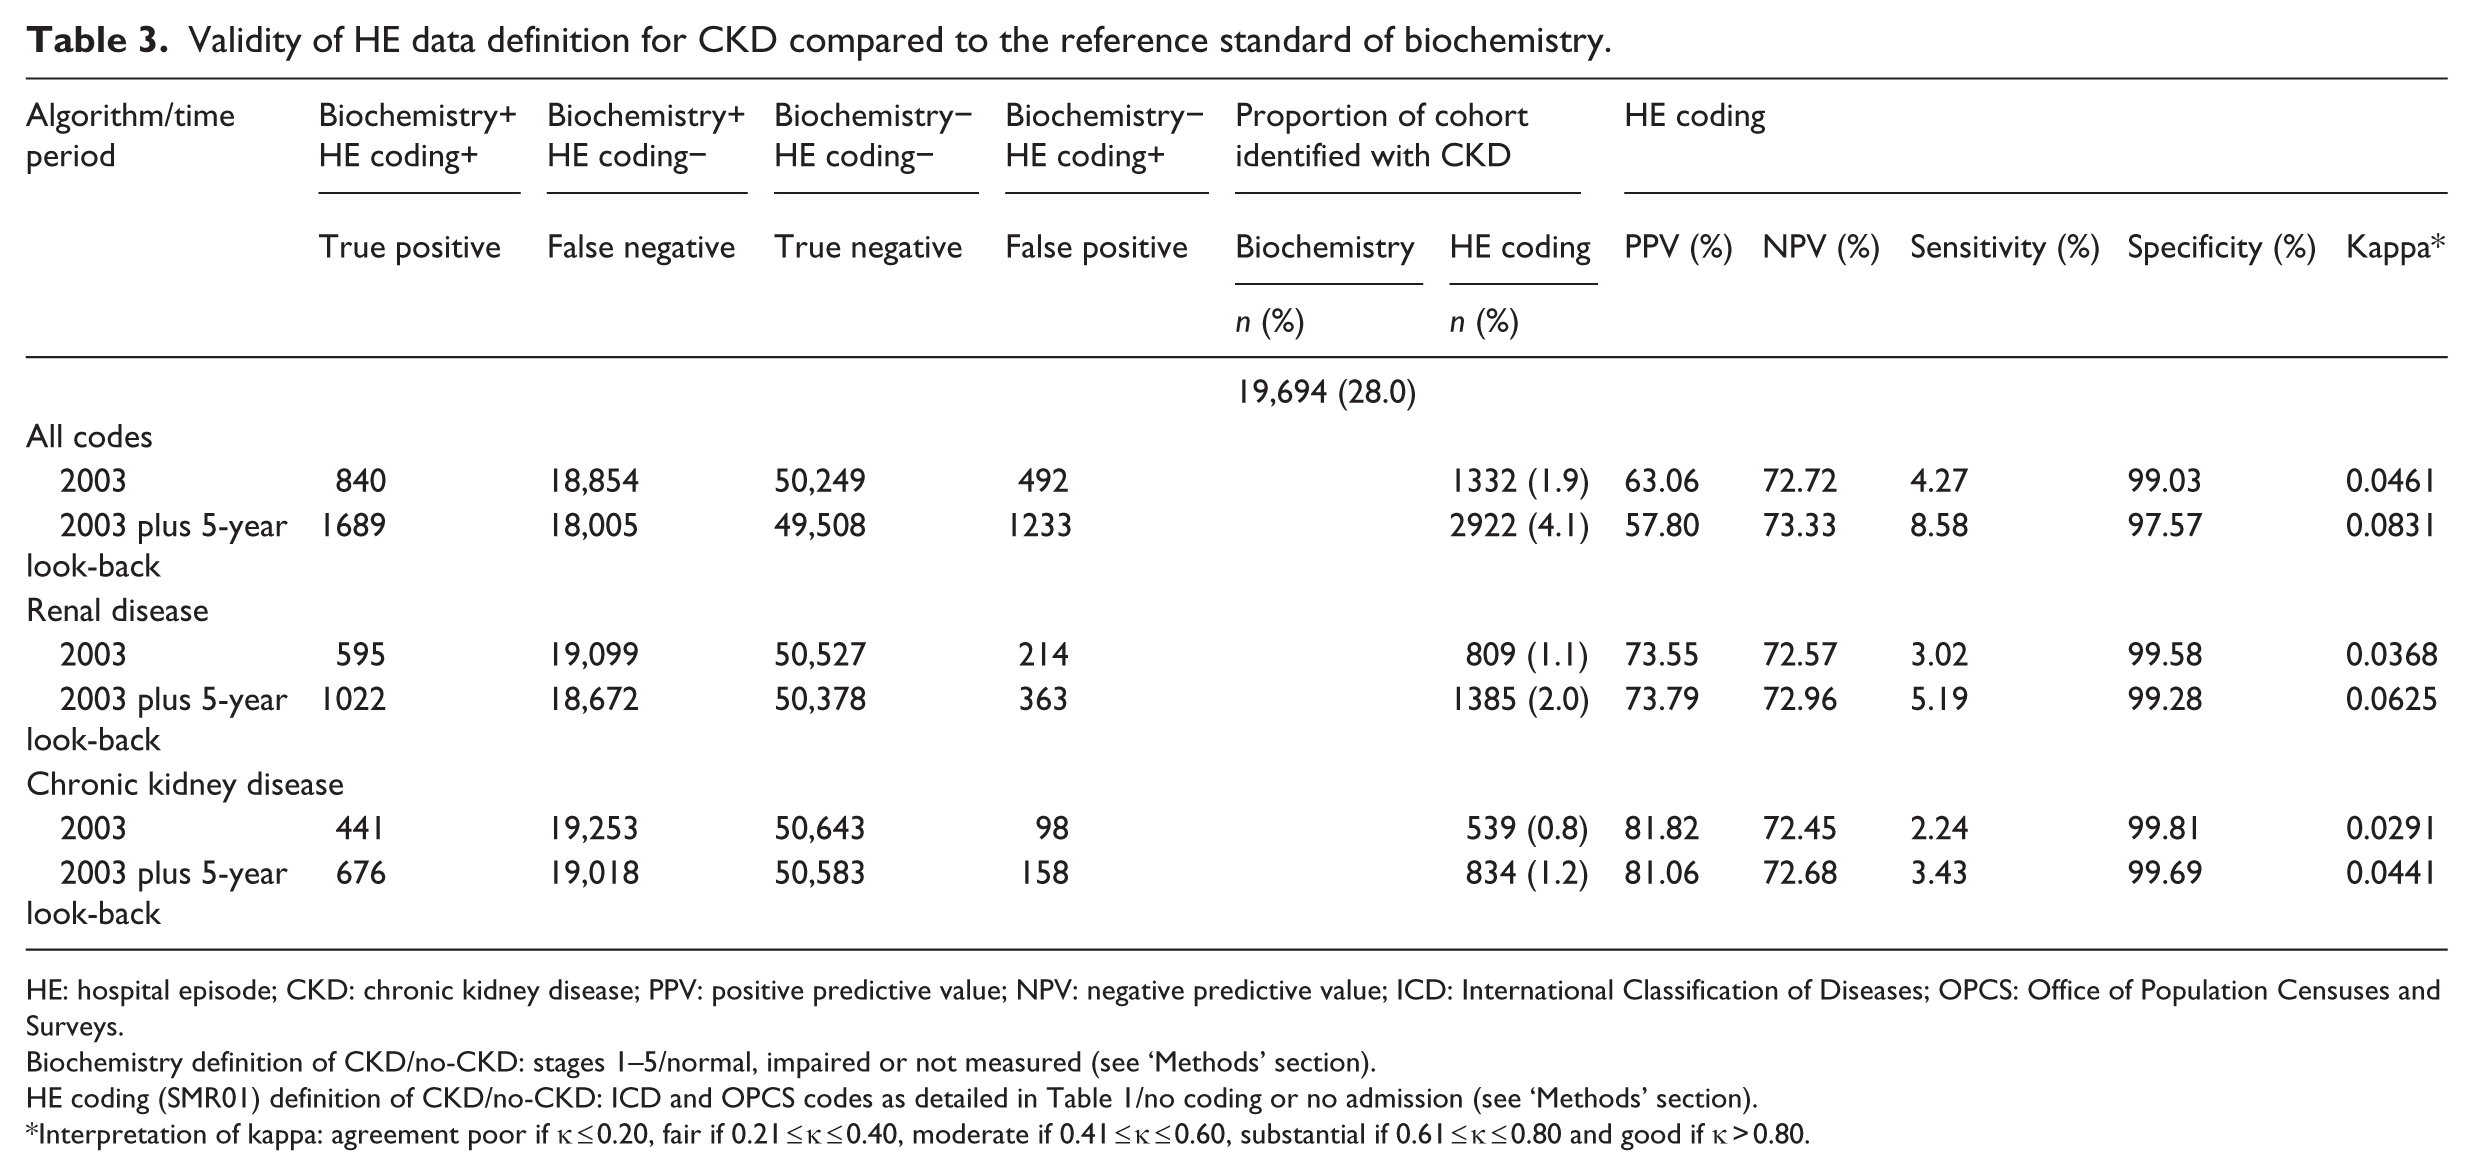
HE: hospital episode; CKD: chronic kidney disease; PPV: positive predictive value; NPV: negative predictive value; ICD: International Classification of Diseases; OPCS: Office of Population Censuses and Surveys.
Biochemistry definition of CKD/no-CKD: stages 1–5/normal, impaired or not measured (see ‘Methods’ section).
HE coding (SMR01) definition of CKD/no-CKD: ICD and OPCS codes as detailed in Table 1/no coding or no admission (see ‘Methods’ section).
Interpretation of kappa: agreement poor if κ ≤ 0.20, fair if 0.21 ≤ κ ≤ 0.40, moderate if 0.41 ≤ κ ≤ 0.60, substantial if 0.61 ≤ κ ≤ 0.80 and good if κ > 0.80.
HE data–identified CKD was generally less common compared to biochemistry-defined CKD and varied across coding algorithms and time periods (Table 3). The sensitivity of HE coding compared to biochemistry for identifying CKD was low, ranging from 2.2 per cent to 8.6 per cent. Specificity of coding was >97 per cent for all coding algorithms and time periods. All algorithms improved by adding a 5-year look-back period in addition to just SMR01 records from 2003, showing higher sensitivities. The very inclusive ‘all codes’ algorithm was most sensitive but least specific, followed by the ‘renal disease’ and ‘chronic kidney disease’ algorithms, which were most specific. Overall, the agreement between HE data- and biochemistry-defined CKD was very poor (kappa values <0.1) because of low numbers identified with HE data, despite excellent specificity.
Sensitivity analyses were carried out comparing HE data to an alternative definition for biochemistry-defined CKD, excluding those with impaired eGFR and those with eGFR not measured from the no-CKD definition. However, this, as expected, only improved the PPV further and reduced the NPV further for the HE data; for the “chronic kidney disease” algorithm defined CKD using 2003 plus 5-year look-back data, the PPV was 99.56 per cent (vs 81.06%) and the NPV was 51.05 per cent (vs 72.68%).
The validity of the ‘renal disease’ and ‘chronic kidney disease’ coding algorithms for 2003 plus 5-year look-back period were assessed within age and CKD stage subgroups (Table 4). Among those with biochemistry-identified CKD, the ‘renal disease’ algorithm identified similar but slightly more individuals than the ‘chronic kidney disease’ algorithm. Worse CKD stage was associated with better identification (sensitivity) using both HE-based algorithms (4.8% of stage 3b compared to 56.9% of stage 5 CKD, for the ‘chronic kidney disease’ algorithm). For biochemistry-identified CKD stages 3b to 5, younger age (<75 vs ≥75 years) was associated with a higher sensitivity using the HE recording algorithms.
Validity of HE coding definition (2003 plus 5-year look-back) for CKD compared to the reference standard of biochemistry by stage and age group.
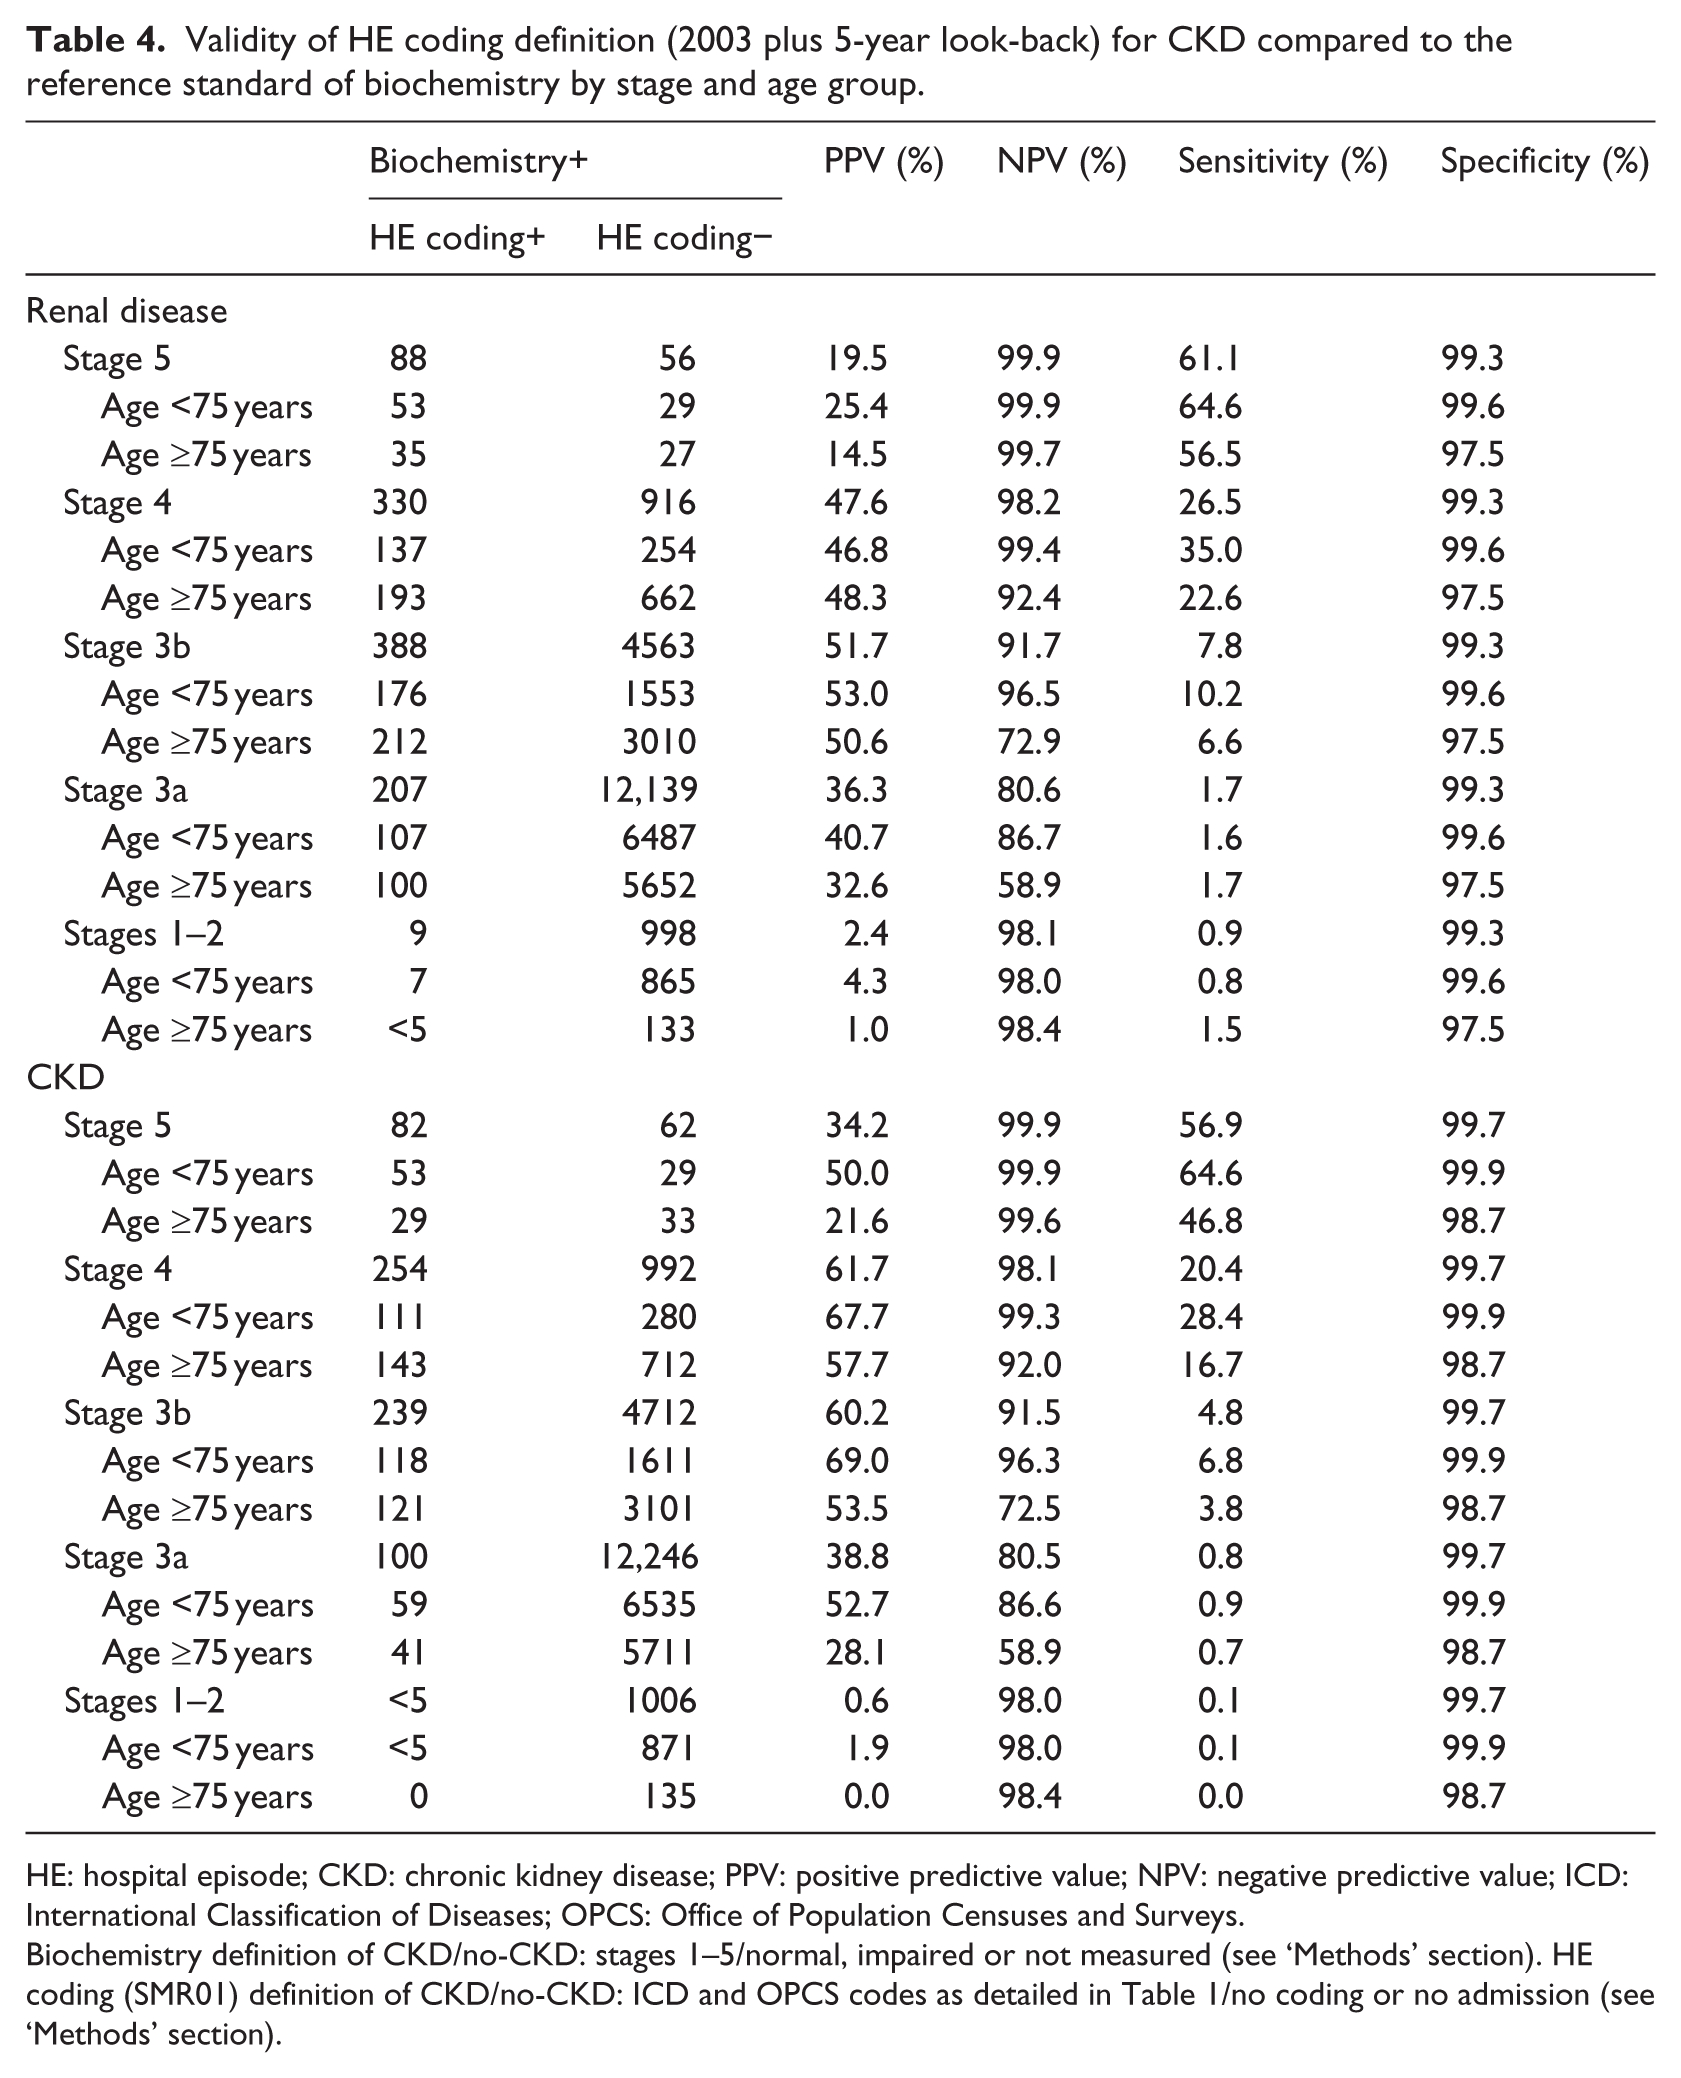
HE: hospital episode; CKD: chronic kidney disease; PPV: positive predictive value; NPV: negative predictive value; ICD: International Classification of Diseases; OPCS: Office of Population Censuses and Surveys.
Biochemistry definition of CKD/no-CKD: stages 1–5/normal, impaired or not measured (see ‘Methods’ section). HE coding (SMR01) definition of CKD/no-CKD: ICD and OPCS codes as detailed in Table 1/no coding or no admission (see ‘Methods’ section).
Discussion
We used a large United Kingdom community cohort to demonstrate whether the use of coding algorithms to identify renal disease, in particular CKD, from HE data was a useful alternative should biochemistry data be difficult to access. We found that HE data coding algorithms were very specific for CKD; however, sensitivities were very poor (at best only 8.6% identified), as was agreement. Of interest, the proportion of those with CKD identified through biochemistry data, who were also identified with HE coding, was higher at more advanced CKD stages and in those under 75 years of age.
CKD is recorded poorly in HE data. This may be because CKD is often not the main reason for admission. This is likely to be similar for other chronic diseases such as diabetes and hypertension, unlike acute events such as hip fracture. Also, the recognition of CKD in the time prior to eGFR reporting (2008) was poor and may have improved in the time since then. Those with more advanced renal disease are also more likely to be frequent in-patients as a result of the higher comorbidity load 30 and increased complications of their renal disease, thus the more likely that renal disease will be recognised during the admission episode coding.
Comparison with existing literature
Few studies18,20,21 have validated hospital administrative data compared with a reference standard of biochemistry data employing the KDOQI definition of CKD, of at least two eGFR <60 mL/min/1.73 m2 at least 90 days apart, and none included CKD stages 1–2 (those with proteinuria). In keeping with our findings, where reported, sensitivities are low and specificities are high for HE data compared to biochemistry-defined CKD.14,15,18,19 We also found high PPVs, which means that individuals who are identified as having CKD from HE coding do have CKD according to biochemistry data, thus any diagnosis based on coding should be accurate using the algorithms outlined, although very unsensitive. The range of PPV values reported in other CKD validation studies has been broad (29%–100%).15,18
Our study used a very large population-based cohort. Only one other study has used a community-based population. 18 However, Ronksley et al. looked for HE data after the biochemistry identification of CKD. Therefore, they were assessing whether those with CKD were being identified at their next hospital admission, not whether a prevalence cohort with CKD was identifiable equally from biochemistry or HE coding. 18 This use of a 3-year window after biochemistry-identified disease would perhaps identify patients too late for intervention, thus our method is perhaps more applicable for identifying those with disease.
We have demonstrated that those with more advanced CKD are more likely to be captured by HE data, also reported by others.18,21 This is in keeping with the fact that at the time of this study, eGFR reporting had not been instigated in the United Kingdom, and as such, the identification of CKD would be expected only in those with more advanced CKD, both by clinicians and SMR01 coders. Ronksley et al. 18 reported that estimates of sensitivity were higher when eGFR <30 mL/min/1.73 m2 was used as the reference standard compared with using <60 mL/min/1.73 m2. Ferris et al. 21 reported a similar pattern in in-patients.
It has been reported that older age was not significantly associated with a greater likelihood of being labelled with CKD. 21 However, this was a study of in-patients, therefore the risk profile identified with biochemistry might have been different. Our finding that younger individuals with CKD were identified better on HE data than older individuals has been previously reported. 18 For younger individuals, CKD is likely to be more of a significant problem than for those who are elderly with CKD with the same degree of renal impairment. It may also reflect that those with CKD at younger ages are likely to have fewer comorbidities when admitted to hospital and therefore have this recognised when discharge coding is carried out. 31
Denburg et al. 17 looked at the recording of biochemistry results at a general practice level compared to the recognition of CKD on general practice coding, which again found low sensitivity but excellent specificity and high PPV. It is unclear, however, how many of the biochemistry results had been entered into GP systems manually.
Strengths and limitations
This study has many strengths. It is one of only a few studies assessing agreement between biochemistry-defined CKD that was required to be present for greater than 3 months compared to HE data.18,20,21 It is a very large population-based cohort, not limited to a specific patient group, and since ICD-10 coding is used, we might expect these findings to be potentially generalisable to other chronic diseases, for example, diabetes, and across the world. The universal nature of the biochemistry service to the region ensures that those living within the region who have testing of renal function would have results available for consideration, and where repeated these would be available, assisting in the identification of those with truly chronic kidney disease.
There are, however, limitations to this study. Calculating eGFR using the MDRD equation is reflective of current United Kingdom practice and thus the individuals currently identified as having CKD; however, there are others outside the United Kingdom who support the use of the Chronic Kidney Disease Epidemiology Collaboration (CKD-EPI) equation. It would be expected that both eGFR equations would identify similar individuals with CKD, particularly at more advanced stages, and it is unlikely that the results would be significantly different. 32 The use of only HE data as a source of confirmatory CKD recording, although fulfilling the aim of this article to ascertain its validity, meant that other routine sources of such data such as GP coding were not assessed. Although this would be a useful additional source of data, it was not available to us, would require assessment in its own right and has been explored at least at a GP biochemistry recording level before. 17 Our biochemistry definition of no-CKD was all-inclusive, including impaired eGFR (at least one eGFR <60 mL/min/1.73 m2 but not sustained) and eGFR not measured. However, we performed sensitivity analyses, defining ‘no-CKD’ as those with normal eGFR only and found that this only improved PPV and worsened NPV. Sensitivity and specificity were similar. As noted previously, the recognition of CKD in the time prior to eGFR reporting (2008) was poor and may have improved in the time since then. However, this is unlikely to change the greater sensitivity of eGFR reporting over SMR01.
Implications for future research or clinical practice
As mentioned in the introduction, HE data may be sufficient for acute hospital care requiring events. However, for chronic conditions, as illustrated here with CKD, the use of corroborating additional data when admissions are due to another event or comorbidity may be necessary.
As demonstrated, HE coding data are very specific with high PPV for the identification of individuals with CKD. This has implications for both clinical practice and future research. With clinical practice, it is insufficient to use HE data alone to identify those with CKD, and access to current and historical biochemistry data is essential to identifying CKD appropriately. However, the use of HE data as an additional flag is potentially useful for identifying high-risk individuals. Another issue for clinical practice is patient safety, particularly with the prescribing of drugs that are either nephrotoxic or with significant renal clearance. The use of both systems of identification should improve patient safety issues related to this. This also applies to preparation for surgical, radiological and oncological procedures.
For research, we have demonstrated that biochemistry data are crucial for describing the prevalence of CKD, and therefore, the health care burden associated with it, not just the few identified through HE data. Historically, CKD identified through HE coding described high RRT initiation rates. However, in cohorts identified through biochemistry more recently, the rates reported have been lower. 33 Whether this is due to the severity of CKD identified being different, or due to the disease processes being different, is not clear and requires further research. There are also implications for clinical trials, in that the event rate that sample sizes are based on may differ depending on the source of CKD identification.
The ideal for the future would be a unifying electronic patient health care record containing information on previous hospital identified events, general practice and also biochemistry results, to ensure accurate and timely identification of those with CKD.
Conclusion
The findings of this study suggest that routine HE data have limited value in the routine identification of individuals with CKD. However, where those with CKD have been identified using HE data, this information is highly specific. Other sources of routine health care data such as routine biochemistry data, including historical data, and not just that pertaining to a given event, should be available to clinicians caring for patients and are an important source for further research into clinical outcomes, including hospitalisations. The most important uses of this data are for planning, surveillance, screening and for research.
Footnotes
Acknowledgements
We thank the Information Services Division, Scotland, who provided the SMR01 data, and NHS Grampian, who provided the biochemistry data. We also thank the University of Aberdeen’s Data Management Team.
Declaration of Conflicting Interests
The author(s) declared no potential conflicts of interest with respect to the research, authorship, and/or publication of this article.
Ethical approval
The study protocol was reviewed by the Privacy Advisory Committee for Information Services Division (ISD), NHS Grampian, Caldicott Guardian. The North of Scotland Research Ethics Service reviewed the project and felt it was audit rather than research. The College Ethics Review Board of the University of Aberdeen, College of Life Sciences and Medicine also reviewed the protocol. There were no concerns.
Funding
The author(s) disclosed receipt of the following financial support for the research, authorship, and/or publication of this article: This work was supported by the Chief Scientists Office for Scotland (grant no. CZH/4/656).