
Abstract
Background:
Healthcare utilization for patients with peripheral artery disease (PAD) is high, but stratifying patients’ risk of hospitalization at initial evaluation is challenging. We examined the association between health status at PAD presentation and risk of (1) combined all-cause hospital admissions and emergency department (ED) visits and (2) all-cause hospital admissions.
Methods:
Patients with claudication enrolled at US sites in the PORTRAIT registry were included. Health status was assessed using the Peripheral Artery Questionnaire (PAQ), a PAD-specific patient-reported outcome measure. Crude overall and cause-specific hospital admissions and ED visits were reported by PAQ overall summary score (PAQ-OS) ranges (0–24, 25–49, 50–74, and 75–100). Kaplan–Meier survival and unadjusted and adjusted Cox proportional hazards models examined the association between baseline PAQ scores and (1) combined all-cause hospital admissions or ED visits and (2) all-cause hospital admissions over 12 months.
Results:
Of 796 patients, 349 (44%) had a hospital admission or ED visit over 12 months. Patients in the lowest (PAQ-OS = 0–24) versus the highest range (PAQ-OS = 75–100) had higher rates of 12-month (53.3% vs 22.4%) hospital admission and ED visits. In the adjusted model, each 10-point decrease in PAQ-OS was associated with a higher risk of all-cause hospital admission and ED visits (HR = 1.1, 95% CI 1.1–1.2, p < 0.0010) and all-cause hospital admission (HR = 1.1, 95% CI 1.1–1.2, p < 0.0010) at 12 months.
Conclusion:
PAD-specific health status is associated with an increased risk of healthcare utilization. Baseline health status may help stratify risk in patients with PAD, although replication and further validation of results are necessary.
Keywords
Background
Lower-extremity peripheral artery disease (PAD) is a chronic atherosclerotic disease that may present with symptoms of intermittent claudication. PAD is an increasing public health concern, with estimated global prevalence in adults ranging from 5% to 18%.1,2 Patients with PAD often have comorbid cardiovascular disease, and 30% have at least one vascular-related hospitalization over a 2-year period. 3 The associated economic burden of hospitalization for patients with PAD, and specifically for claudication, is high, with annual hospitalization costs continuing to climb from $4463 to $7000 in 2004 3 to over $13,000 in 2017 in the United States. 4 Claudication also has a significant impact on patients’ health status, defined as patients’ self-reported mental and physical health.5,6 Measures of patients’ health status, called patient-reported outcome measures (PROMs), are therefore becoming an integral part of assessing patients with claudication. 7
Though the rate of hospital admissions for patients with chronic limb-threatening ischemia (CLTI), the most severe form of PAD, has increased by 50% since 2011, contemporary data on the burden of hospitalization for patients with claudication are more limited.8–11 Identifying the burden of healthcare utilization with PAD and stratifying their risk is a critical first step for developing strategies to reduce healthcare costs and improve patients’ health status. Prior efforts to stratify the risk for hospitalization have focused on traditional comorbidity profiles, such as age, renal disease, or physical functioning,12,13 but to our knowledge have not included multidimensional PAD-specific health status information (including symptoms, functioning, and quality of life). Health status measures have been shown to be independent predictors of clinical events in patients with claudication, such as mortality, 14 but to our knowledge their association with hospitalization in patients with claudication has not been described. To address this gap in knowledge, we examine the association between patient-reported health status, as measured by the Peripheral Artery Questionnaire (PAQ),15,16 with the risk of (1) the combined endpoint of all-cause hospital admission or emergency department (ED) visits and (2) all-cause hospital admissions at 12 months in the multicenter PORTRAIT registry. As an exploratory analysis, we examined the interaction effect between early revascularization (within 3 months of enrollment) and the association between the baseline PAQ summary score and the two primary endpoints for this study using a landmark analysis from 3 months after enrollment.
We hypothesized that the PAQ summary score was independently associated with the risk of the combined endpoint of all-cause hospital admission or ED visits at 12 months and independently associated with all-cause hospital admissions only at 12 months.
Methods
Study design and population
The PORTRAIT (Patient-centered Outcomes Related Treatment Practices in Peripheral Arterial Disease: Investigating Trajectories) registry is an international prospective registry including 16 different specialty clinics (including cardiology, vascular surgery, vascular medicine, and podiatry clinics) in the United States, the Netherlands, and Australia that enrolled 1275 patients from June 2, 2011 to December 3, 2015. In the current study, analysis was limited to patients from the United States due to limited availability of hospital encounter data from other countries and differences in healthcare systems that would make the findings less relevant to the United States. Study details have been reported previously. 17 In brief, the inclusion criteria were: (1) age ⩾ 18; (2) new onset or worsening claudication at time of evaluation determined by trained study coordinators; and (3) resting ankle–brachial index (ABI) ⩽ 0.90 or a drop in postexercise ankle pressure ⩾ 20 mmHg and those with noncompressible ABI, an ipsilateral lower-limb procedure in the last year, and CLTI were excluded. Patients were screened by trained study coordinators to identify patients with newly reported symptoms or worsening symptoms of PAD before the time of their specialty clinic visit.
The study was approved by the Institutional Review Boards of each participating center and all participants provided written consent. One patient with missing hospital encounter dates was excluded. Patients were followed for 12 months, with clinical and telephone interview follow ups occurring at 3, 6, and 12 months.
Baseline demographic, clinical, and treatment information was abstracted by study coordinators. Baseline characteristics included age, sex, race, marital status, living situation, working status, education, financial situation, health insurance status, depressive symptoms, anxiety, social support, perceived stress, distressed personality, smoking status, alcohol use, activity level, medical history, vascular history, and PAD-specific and generic health status. Information on race was abstracted from the medical record. Psychosocial and health status information was collected by standardized interviews.
The study protocol of the PORTRAIT study was approved by the institutional review boards of all sites. All study participants provided informed consent. All definitions for baseline characteristics as well as details on how information was collected have been previously reported in the PORTRAIT methods paper. 17
Health status assessment
Disease-specific health status was assessed by the PAQ, a 20-item patient-reported health status outcomes measure. 16 The PAQ assesses the following subdomains: Physical Limitation, Symptoms, Symptom Stability, Social Limitation, Treatment Satisfaction, and Quality of Life. The summary score is the average of the Physical Limitation, Symptoms, Social Limitation, and Quality of Life domains. Scores range from 0 to 100, with lower scores indicating worse health status. The PAQ is a well-validated tool, meeting accepted psychometric criteria for reliability and responsiveness,18,19 with the ability to detect meaningful clinical change, 20 as well as to predict future mortality risk. 14
Outcomes
The primary outcomes of interest were (1) time-to-first hospital presentation defined as the combined endpoint of all-cause hospital admissions or ED visit and (2) time-to-first all-cause hospital admission only, over 12 months. The 12-month timeframe was selected for this study as it was designated as clinically meaningful by relevant patient and clinician stakeholder input in PORTRAIT. 17 Subsequent hospital admissions or ED visits were identified during follow-up interviews. All hospital admission or ED visit data were abstracted from the site’s electronic medical record or requested from outside hospital systems as determined during follow-up interviews. Hospital admission and ED visit data were then stratified by ED visit only or ED visit and subsequent hospital admission. The abstraction process was completed by trained clinical research coordinators. For hospital visits for PAD-related procedures, all procedural information, including vascular access, devices used, procedural success, and complications related to that admission, was adjudicated by two physicians. In the event of discordant adjudication, the record was evaluated by a third physician.
Statistical analysis
Patient characteristics were described for the overall cohort and compared by patients with hospital admissions or ED visits and those without a hospital admission or ED visit using chi-squared or Fisher’s exact tests for categorical variables and Student’s t-test or Wilcoxon signed rank test for continuous variables. Standardized differences were calculated and used to quantify the size of the differences between group comparisons. Standardized differences equal to or less than 0.10, 0.20, 0.50, and 0.80 were considered negligible, small, moderate, and large effect sizes, respectively. 21 Missing data were identified and managed using multiple imputation by chained equations. Using multiple imputation, 20 imputed datasets 22 were generated and results were pooled using Rubin’s rule. 23 All analysis was performed on an imputed cohort.
Total (first and recurrent) hospital encounters and reason for visit were then described for the overall cohort and compared by hospital admission versus ED visit only using chi-squared or Fisher’s exact tests for categorical variables and Student’s t-test or Wilcoxon signed rank test for continuous variables. Standardized differences were calculated and used to quantify the size of the differences between group comparisons.
We constructed Kaplan–Meier failure curves for the risk of each outcome (hospital admission or ED visit as well as hospital admission only) over 12 months 24 by ranges of the PAQ summary and domain scores (0–24, 25–49, 50–74, 75–100) to simplify interpretation. Kaplan–Meier curves were compared using log-rank tests. 25
We used unadjusted hierarchical Cox proportional hazards models stratified by site to examine the association between baseline PAQ summary domain scores as continuous variables (per 10-point decrease) and by 25-point ranges with 12-month all-cause hospital admissions or ED visits and 12-month all-cause hospital admissions only. To account for confounding, we then examined the association between PAQ overall summary scores as a continuous linear variable and by ranges with each outcome (hospital admissions or ED visits and hospital admissions only) at 12 months in fully adjusted Cox proportional hazards models including traditional PAD risk factors. The following variables, selected based on clinical judgment as well as significance, were included in the adjusted Cox proportional hazards model: age, sex, race, education status, marital status, living status, employment status, end of month financial reserves, history of avoiding care due to cost, smoking status, alcohol abuse (assessed by the Alcohol Use Disorders Identification Test [AUDIT-C]), body mass index, history of dyslipidemia, history of hypertension, history of diabetes, history of cerebrovascular disease, history of coronary artery disease, congestive heart failure, sleep apnea, history of angina, history of atrial fibrillation, prior electrophysiology device implantation, history of chronic kidney disease, history of chronic lung disease, history of erectile dysfunction, history of osteoarthritis, history of chronic back pain, history of cancer, prior peripheral vascular intervention, prior amputation, bilateral symptoms, lesion location, resting ABI, new onset of claudication symptoms, duration of claudication pain, Rutherford category, and PAD exercise therapy. Nonlinear relationships between baseline PAQ overall summary domain scores with each outcome were examined using restricted cubic splines and compared with the linear model using the Akaike information criterion (AIC). The linear models demonstrated the best fit. The proportionality of hazards was tested using Schoenfeld residuals, and the assumption of proportionality of hazards was met for each outcome (p = 0.50 for hospital admissions or ED visits and p = 0.67 for hospital admissions only).
Finally, we described the crude hospital admission or ED events overall and by reason for visit.
Sensitivity analysis
Lastly, we conducted a sensitivity analysis to assess the interaction effect of early invasive therapy and baseline PAQ summary scores (and each of the PAQ subdomains) on hospital admission or ED visits and hospital admissions alone. Early invasive therapy was defined as any endovascular or surgical revascularization for PAD that occurred within the first 3 months of the initial PAD evaluation. The interaction term was assessed to determine whether the association between baseline health status and hospitalization at 12 months differed by early revascularization status. We chose to evaluate the interaction effect as early revascularization has been shown to be associated with significant and rapid improvement in health status and also associated with progression to CLTI and higher rates of amputation.26,27
To rule out an interaction effect between baseline PAQ summary score and early invasive therapy (within 3 months), we performed a landmark analysis in patients who survived 3 months after their enrollment. The interaction term was assessed to determine whether the association between baseline health status and hospitalization at 12 months was independent of the effect of early revascularization (i.e., was the association observed in the main analysis). The association between baseline PAQ summary score and each outcome (hospital admission or ED visit and hospital admission only at 9 months post 3-month follow up) were assessed using propensity score analysis. Propensity scores (individual probability of early invasive therapy vs no early invasive therapy) were calculated using logistic regression adjusted for 17 demographic and clinical history characteristics (Figure S1). Patients were then matched 1:1 on the propensity score by nearest neighbor within a caliper of 0.03 without replacement. The cohort flow is detailed in Figure S2. Cox proportional hazards models stratified on site and adjusted for interaction between baseline PAQ summary score and early invasive therapy were used to compare the baseline PAQ summary score per 10-point decrease and each outcome. The interaction effect was tested using the Likelihood-ratio test. This analysis was then repeated for each of the individual subdomains of the PAQ score.
All tests were two-tailed, and an alpha value lower than 0.05 was considered significant. All analyses were conducted using Stata 17 (StataCorp LLC, College Station, TX, USA).
Results
The final imputed cohort consisted of 796 patients. A STROBE (Strengthening the Reporting of Observational Studies in Epidemiology) diagram is presented in Figure 1. The mean age of the overall cohort was 68.6 ± 9.6 years and 41.8% were women. The overall baseline PAQ summary score was 46.80 ± 22.00. Overall, 34.5% of patients (34.7% for those patients with at least one hospitalization and 34.5% for those without a hospitalization, standardized difference of 0.005) had a prior peripheral vascular intervention, and 1.5% (1.7% vs 1.3%, standardized difference of 0.031) had a prior amputation. Baseline characteristics for the overall cohort and by patients with versus without at least one ED visit or hospital admission are presented in Table 1. Missing covariate data ranged from 0% to 7.8% (Supplemental Table S1, available online). Patients with an ED visit or hospital admission at 12 months were more likely to have chronic angina and a lower resting ABI (standardized differences of 0.23 and 0.23, respectively). An abbreviated table with baseline clinical characteristics by baseline PAQ summary point ranges (0–24, 25–49, 50–74, 75–100) is provided in Table 2 (complete table provided as Table S2).
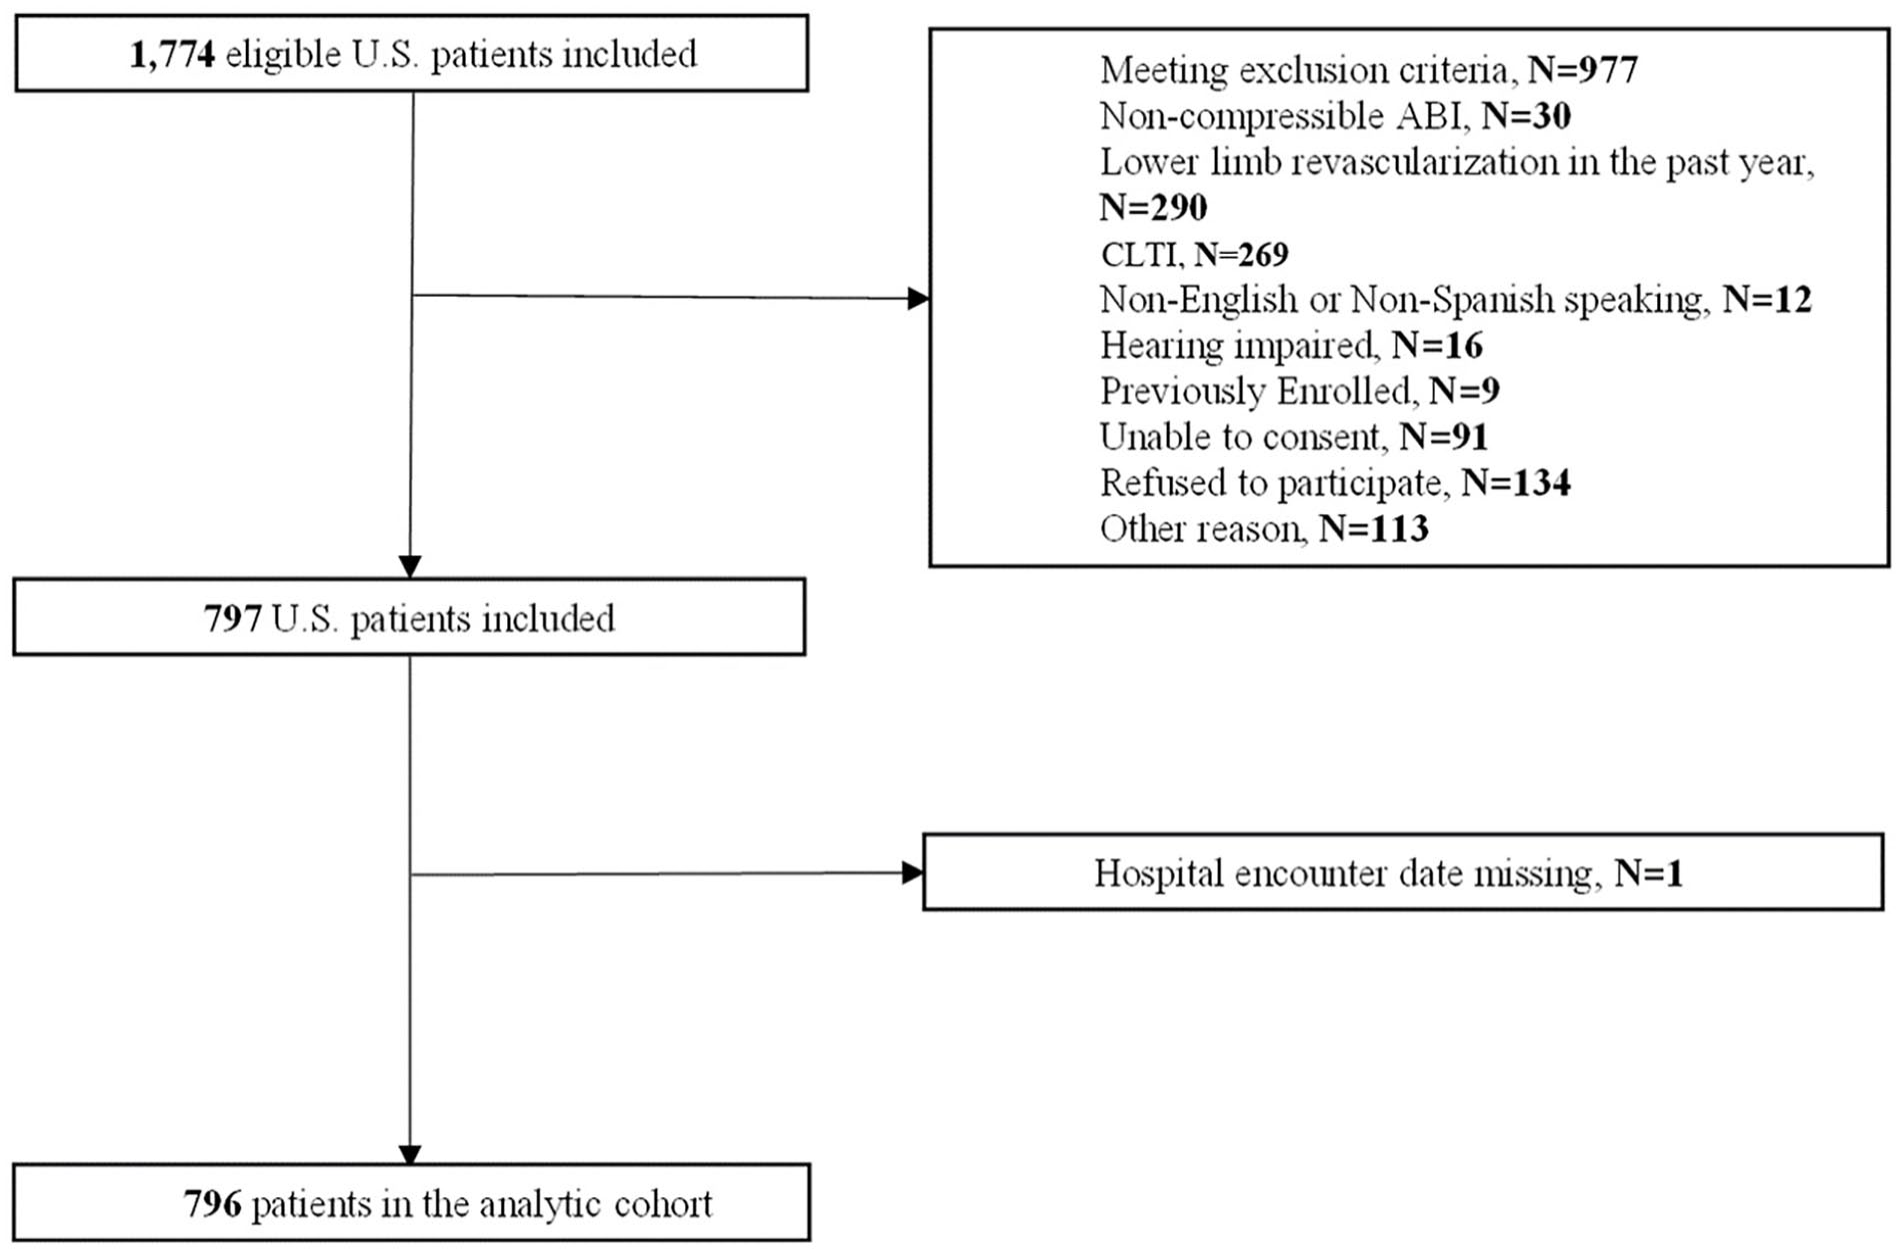
STROBE diagram for the analytic cohort.
Baseline characteristics of the overall cohort and by hospital admission or emergency department visit versus no hospital admission or emergency department visit.
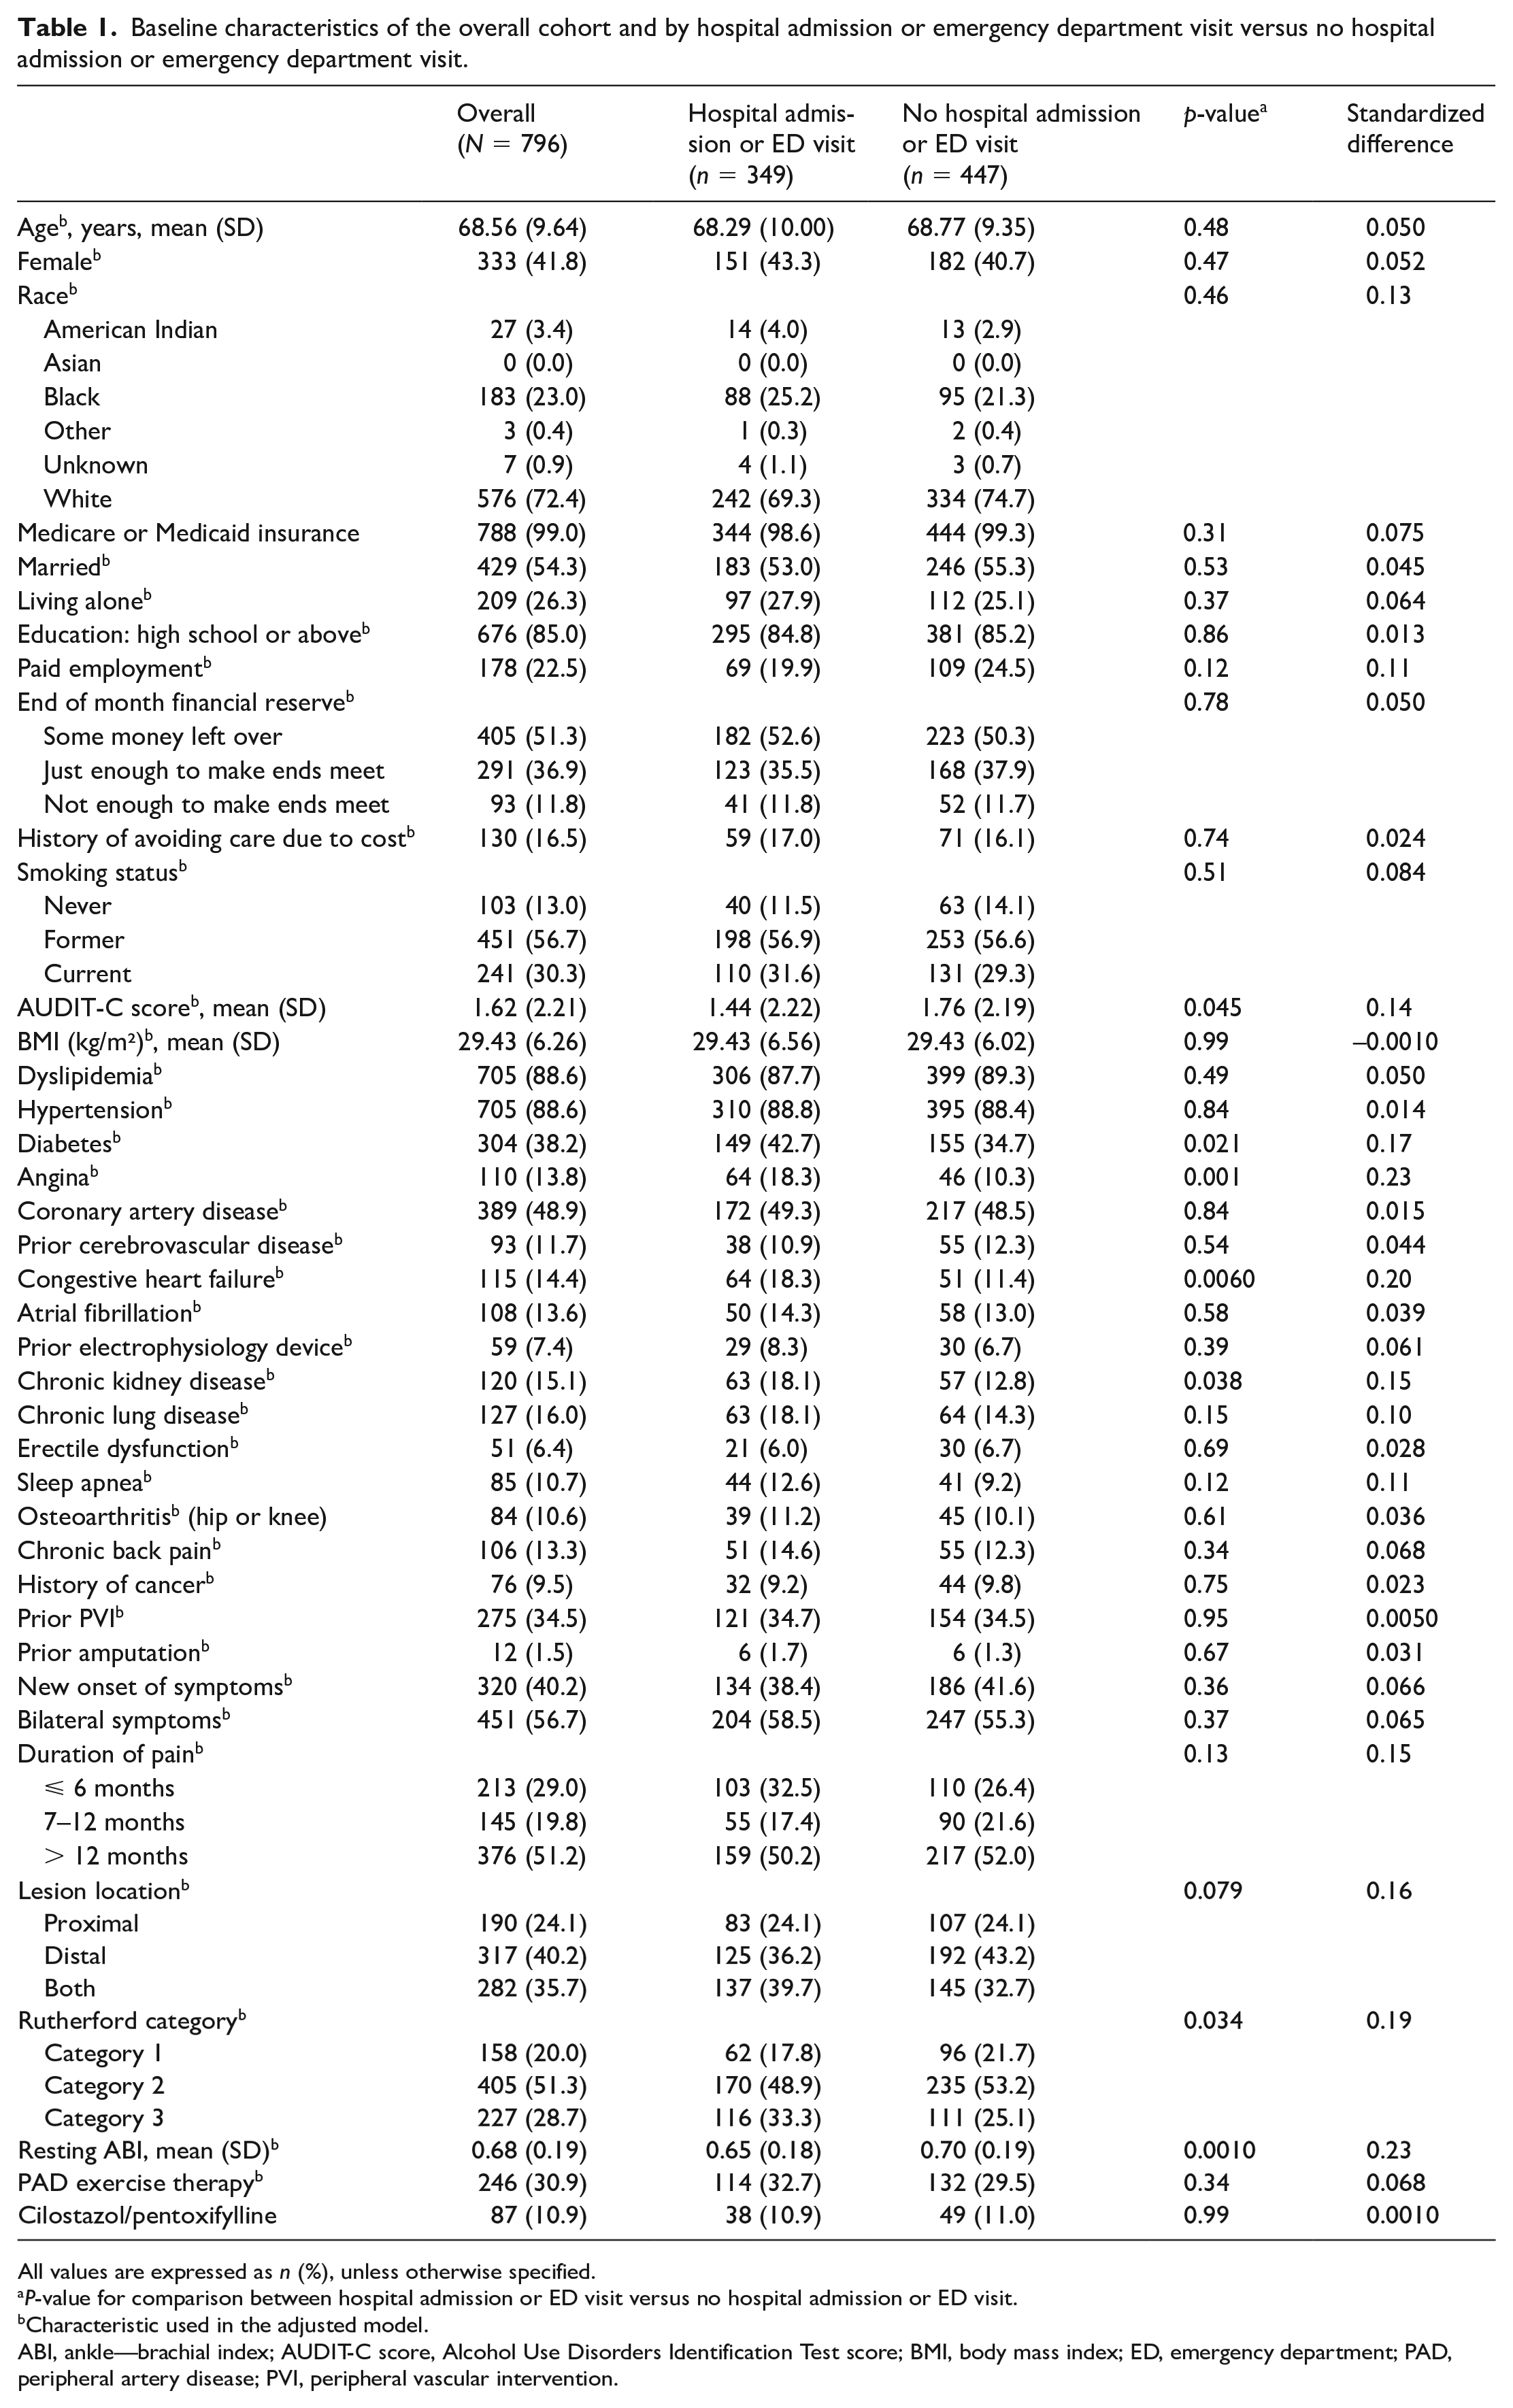
All values are expressed as n (%), unless otherwise specified.
P-value for comparison between hospital admission or ED visit versus no hospital admission or ED visit.
Characteristic used in the adjusted model.
ABI, ankle—brachial index; AUDIT-C score, Alcohol Use Disorders Identification Test score; BMI, body mass index; ED, emergency department; PAD, peripheral artery disease; PVI, peripheral vascular intervention.
Baseline Characteristics of the Overall Cohort and by PAQ Summary Score Ranges (abbreviated version a ).
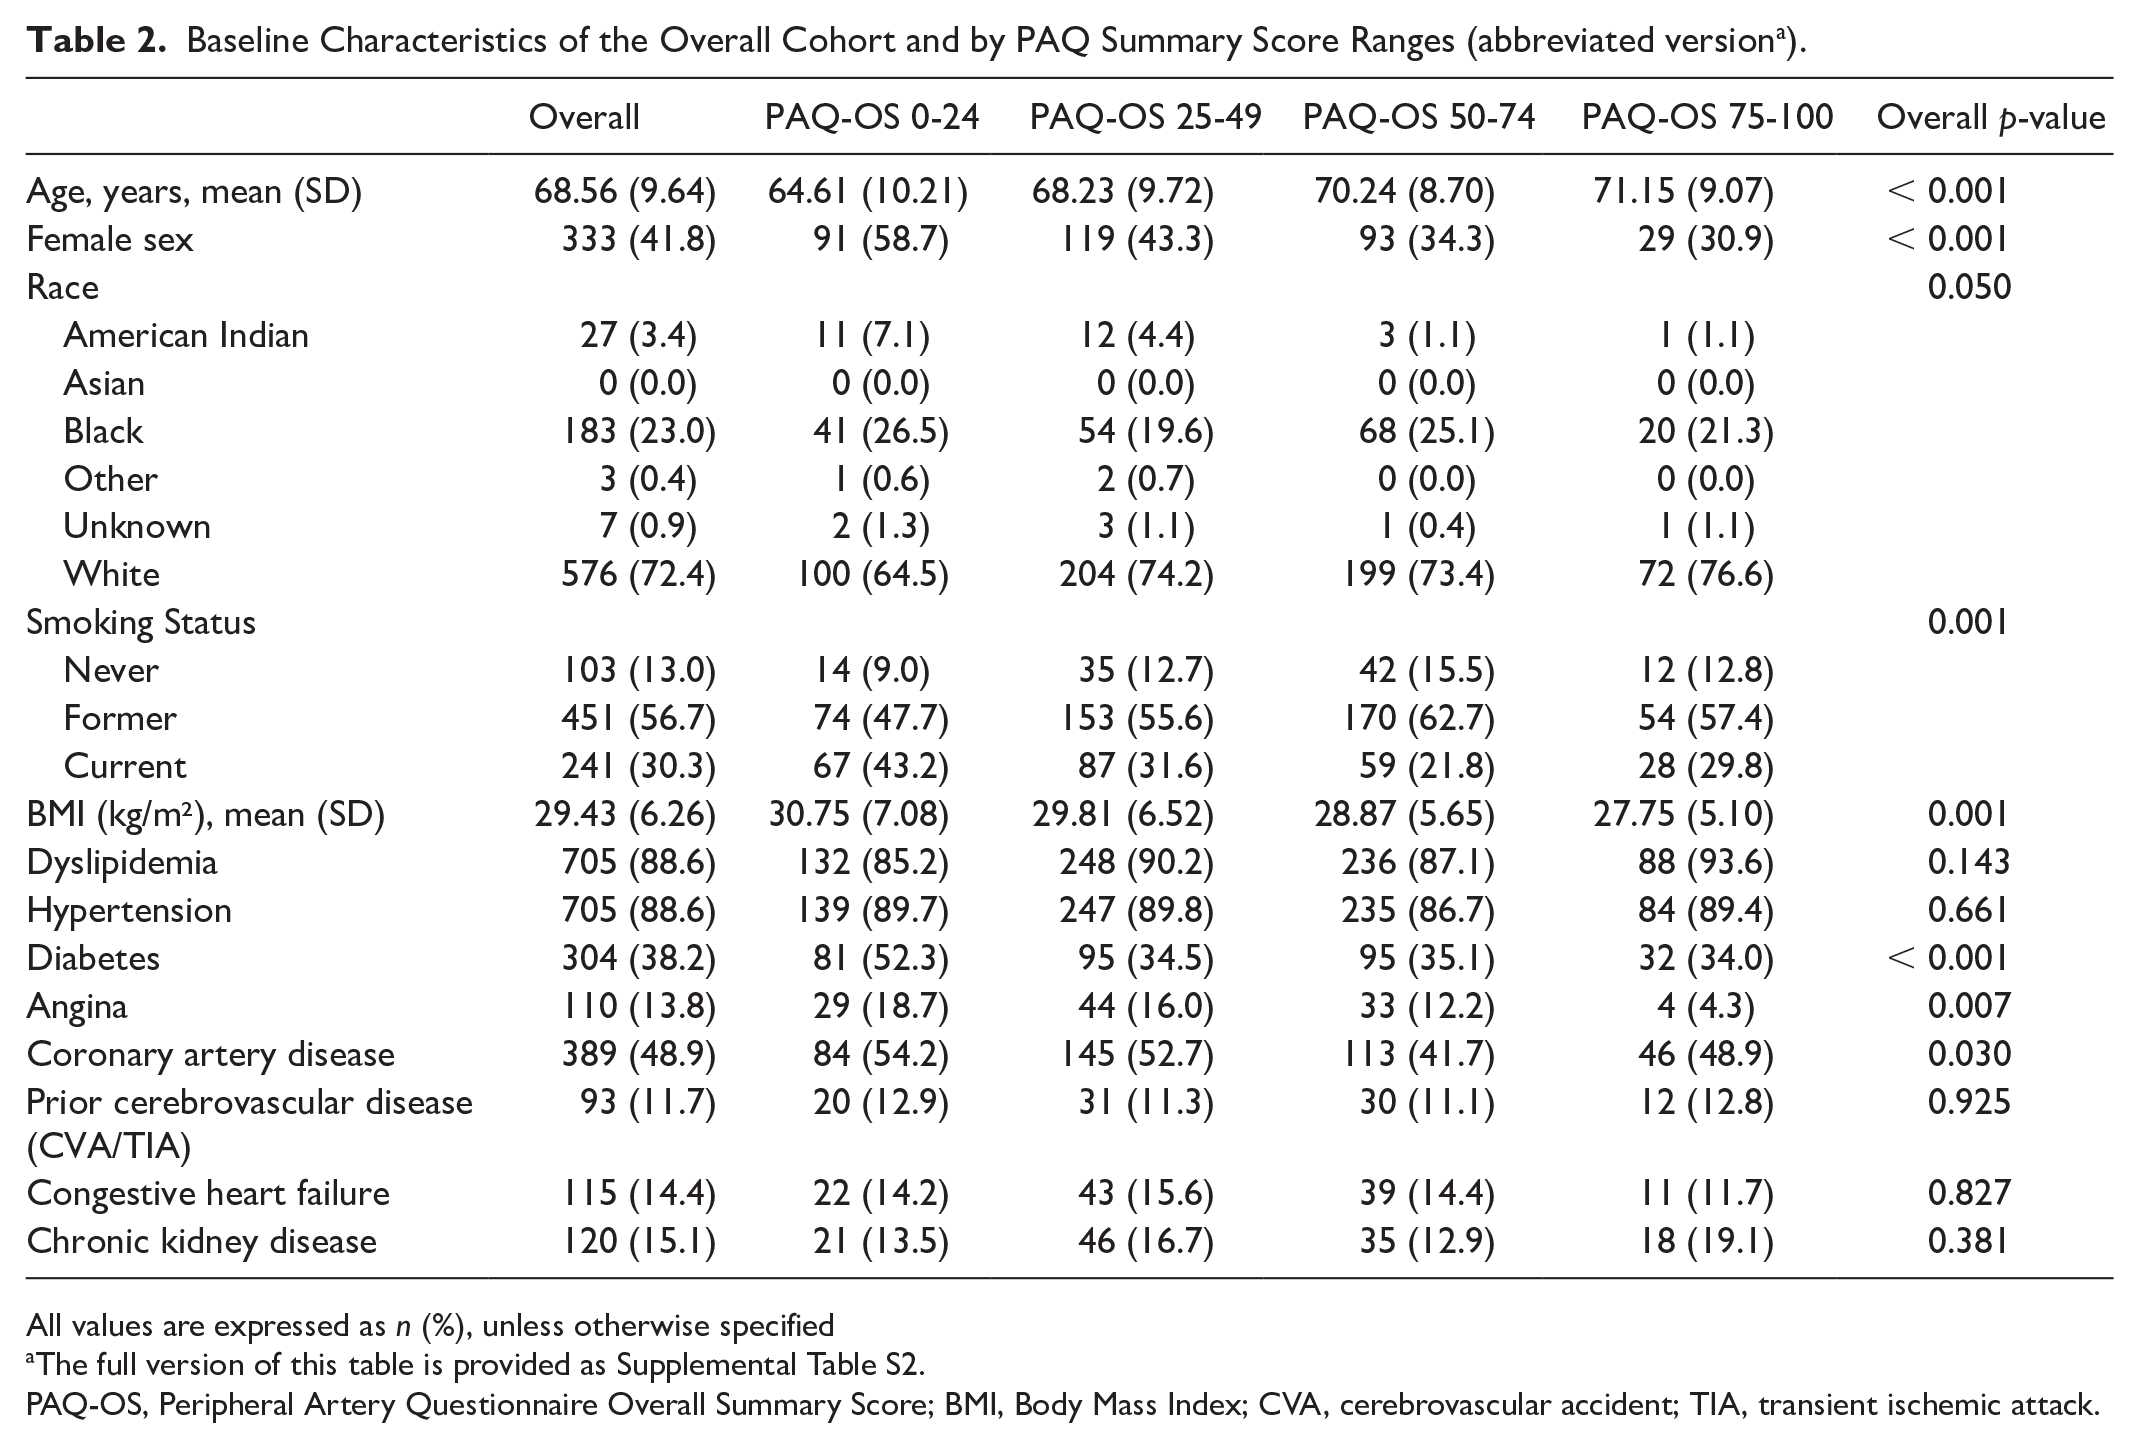
All values are expressed as n (%), unless otherwise specified
The full version of this table is provided as Supplemental Table S2.
PAQ-OS, Peripheral Artery Questionnaire Overall Summary Score; BMI, Body Mass Index; CVA, cerebrovascular accident; TIA, transient ischemic attack.
A total of 349 patients (44%) had at least one hospital admission or ED visit. There was a total (i.e., first and recurrent) of 92 hospital admissions or ED visits (of which 80 were hospital admissions) at 30 days; 218 hospital admissions or ED visits at 90 days (174 hospital admissions); and 663 total hospital admissions or ED visits (491 hospital admissions and 172 ED visits only) at 12 months (Table S3). There were 32 total deaths at 12 months, of which only nine deaths occurred without hospital admission or ED visit within 12 months.
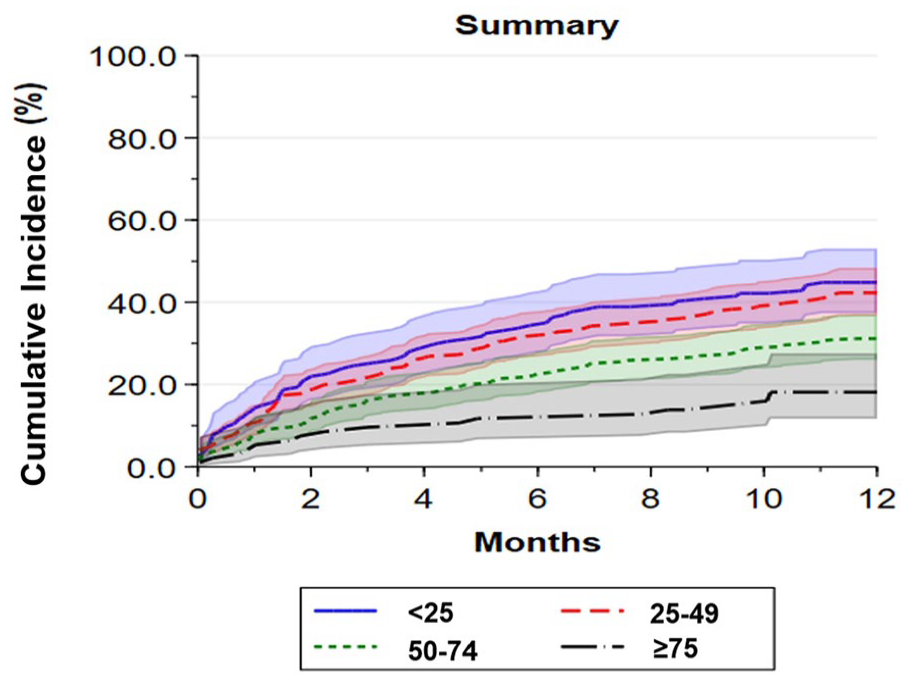
Kaplan–Meier failure curves for time-to-first hospital admission or ED visit by baseline PAQ summary score ranges are shown in Figure 2 (log-rank p < 0.0010). Among those with the worst disease-specific health status (PAQ summary scores of 0–24), 53% were admitted to the hospital or had one ED visit at 12 months compared with 49% of those with scores of 25–49, 42% of patients with scores of 50–74, and 22% of patients with baseline scores of 75–100 (reference group). When analyzed as continuous linear variables in unadjusted Cox proportional hazards models, every 10-point decrease in baseline PAQ summary score was associated with a 13% higher risk of hospital admission or ED visit at 12 months (HR 1.1, 95% CI 1.1–1.2, p < 0.0010) (Table 3). The adjusted Cox proportional hazards model was consistent with the unadjusted model (HR 1.1, 95% CI 1.1–1.2, p < 0.0010) (Table 3). The association between PAQ summary score by score range along with each of the covariates that the model adjusted for are provided in Table S4. Hazard ratios for the PAQ summary score ranges for the unadjusted and adjusted models are presented in Table S5. When analyzed by PAQ subdomain, lower scores for Physical Limitation, Symptoms, Quality of Life, and Social Limitation were each associated with increased risk of hospital admission or ED visit at 12 months (Table S5 and Figure S3A–F).
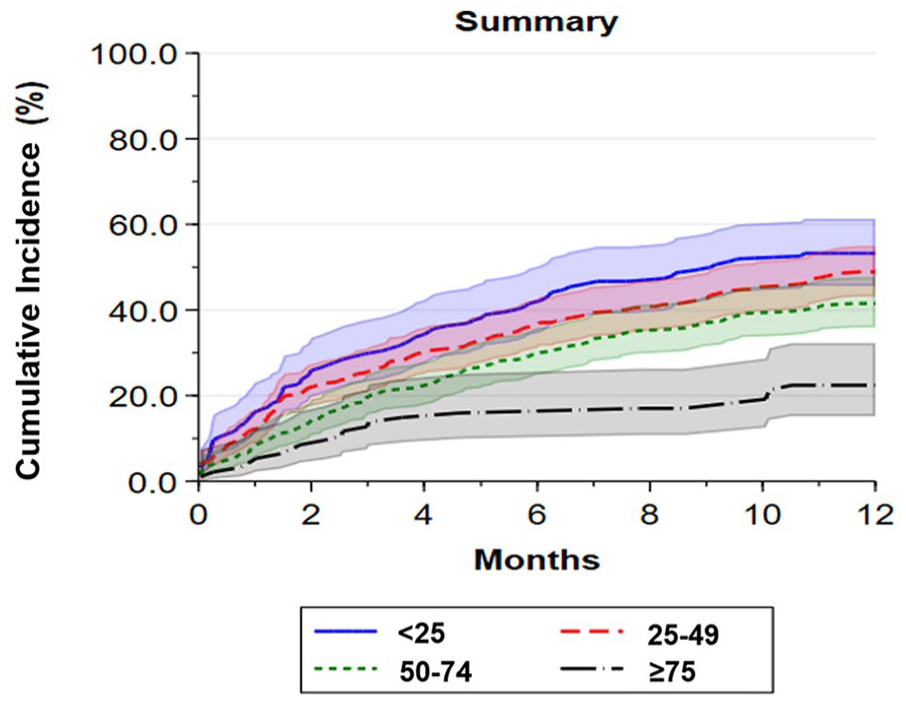
Kaplan–Meier curves by PAQ summary score ranges for first hospital admission or emergency department visit.
Risk of the composite endpoint of emergency department visits and hospital admissions and hospital admissions only by PAQ summary score range.
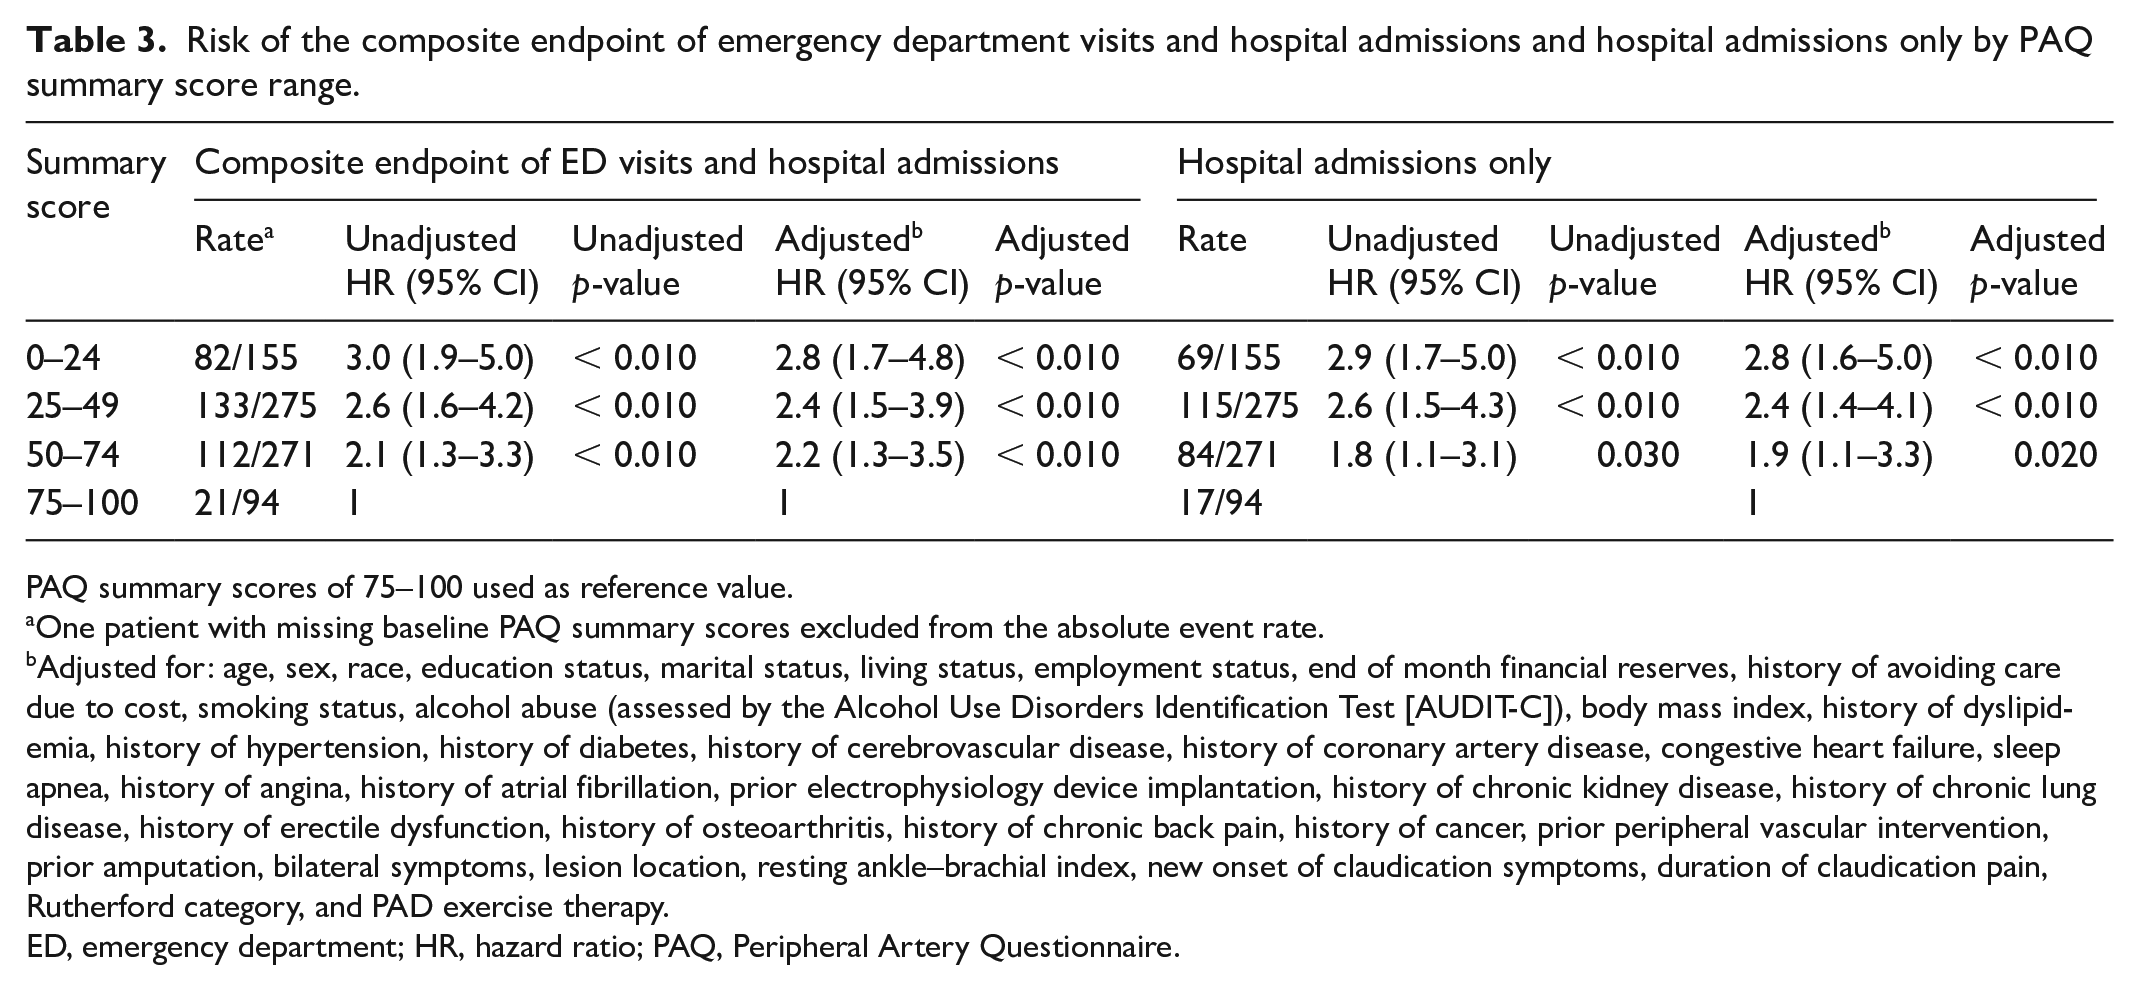
PAQ summary scores of 75–100 used as reference value.
One patient with missing baseline PAQ summary scores excluded from the absolute event rate.
Adjusted for: age, sex, race, education status, marital status, living status, employment status, end of month financial reserves, history of avoiding care due to cost, smoking status, alcohol abuse (assessed by the Alcohol Use Disorders Identification Test [AUDIT-C]), body mass index, history of dyslipidemia, history of hypertension, history of diabetes, history of cerebrovascular disease, history of coronary artery disease, congestive heart failure, sleep apnea, history of angina, history of atrial fibrillation, prior electrophysiology device implantation, history of chronic kidney disease, history of chronic lung disease, history of erectile dysfunction, history of osteoarthritis, history of chronic back pain, history of cancer, prior peripheral vascular intervention, prior amputation, bilateral symptoms, lesion location, resting ankle–brachial index, new onset of claudication symptoms, duration of claudication pain, Rutherford category, and PAD exercise therapy.
ED, emergency department; HR, hazard ratio; PAQ, Peripheral Artery Questionnaire.
For the endpoint of hospital admissions only at 12 months, 44.8% of patients with the lowest baseline PAQ score range (0–24), 42% of patients with scores of 25–49, 31% of patients with scores of 50–74, and 18% of patients with the highest baseline PAQ scores (75–100, reference group) had a hospital admission. Kaplan–Meier survival failure curves for patients by baseline PAQ score are shown in Figure 3 (log-rank p < 0.0010). When analyzed as a continuous linear variable, each 10-point decrease in PAQ score was associated with a 15% increase in hospital admission at 12 months (HR 1.2, CI 1.1–1.2, p < 0.0010) (Table 3). Results were consistent in the adjusted Cox proportional hazards model (HR 1.1, 95% CI 1.1–1.2, p < 0.0010) (Table 3). Hazard ratios for the PAQ summary score by PAQ score range for the unadjusted and adjusted models are presented in Table S6. When analyzed by PAQ subdomain, lower scores for Physical Limitation, Symptoms, Quality of Life, and Social Limitation were each associated with increased risk of hospital admission at 12 months (Table S6 and Figure S4A–F).
Kaplan–Meier curves by PAQ summary score ranges for first hospital admission.
In the landmark analysis (from 3 months) assessing the association between the interaction of early invasive therapy and baseline PAQ summary score for hospital admissions or ED visits, 228 patients (28.6%; 132 with hospital admission or ED visit at 12 months and 96 without hospital admission or ED visit at 12 months) underwent early invasive treatment. There was no significant interaction between baseline PAQ summary score and early invasive therapy with either hospital admissions and ED visits (p-value of interaction 0.081) or hospital admissions only (p-value of interaction 0.80). For the PAQ subdomains, interaction testing showed that the association effect between both Symptom Stability (HR 4.0, 95% CI 1.2–1.4, p = 0.028) and Quality of Life (HR 2.8, 95% CI 1.1–7.4, p = 0.040) were significantly stronger for patients who received early revascularization. There were no other significant interactions between the remaining PAQ subdomains and early invasive therapy for either primary outcome.
The number and reason for hospital admission and ED visit are shown by ranges in Figure 4. Overall, 58% of hospital admissions or ED visits and 68% of hospital admissions were due to PAD or other cardiovascular disease. The burden of hospital admissions or ED visits was highest (per patient) for patients in the lowest range (scores 0–24), with 168 total admissions or ED visits for 155 patients (1.1 admissions or ED visits per patient; 58% due to PAD or other cardiovascular disease). Patients with scores of 25–49 had 250 admissions or ED visits for 275 patients (0.91 per patient; 62% due to PAD or other cardiovascular disease), and patients with scores of 50–74 had 188 admissions or ED visits for 271 patients (0.69 per patient; 57% due to PAD or other cardiovascular disease). Patients with the highest range score (75–100) had 33 admissions or ED visits for 94 patients (0.35 per patient; 30% due to PAD or other cardiovascular disease).
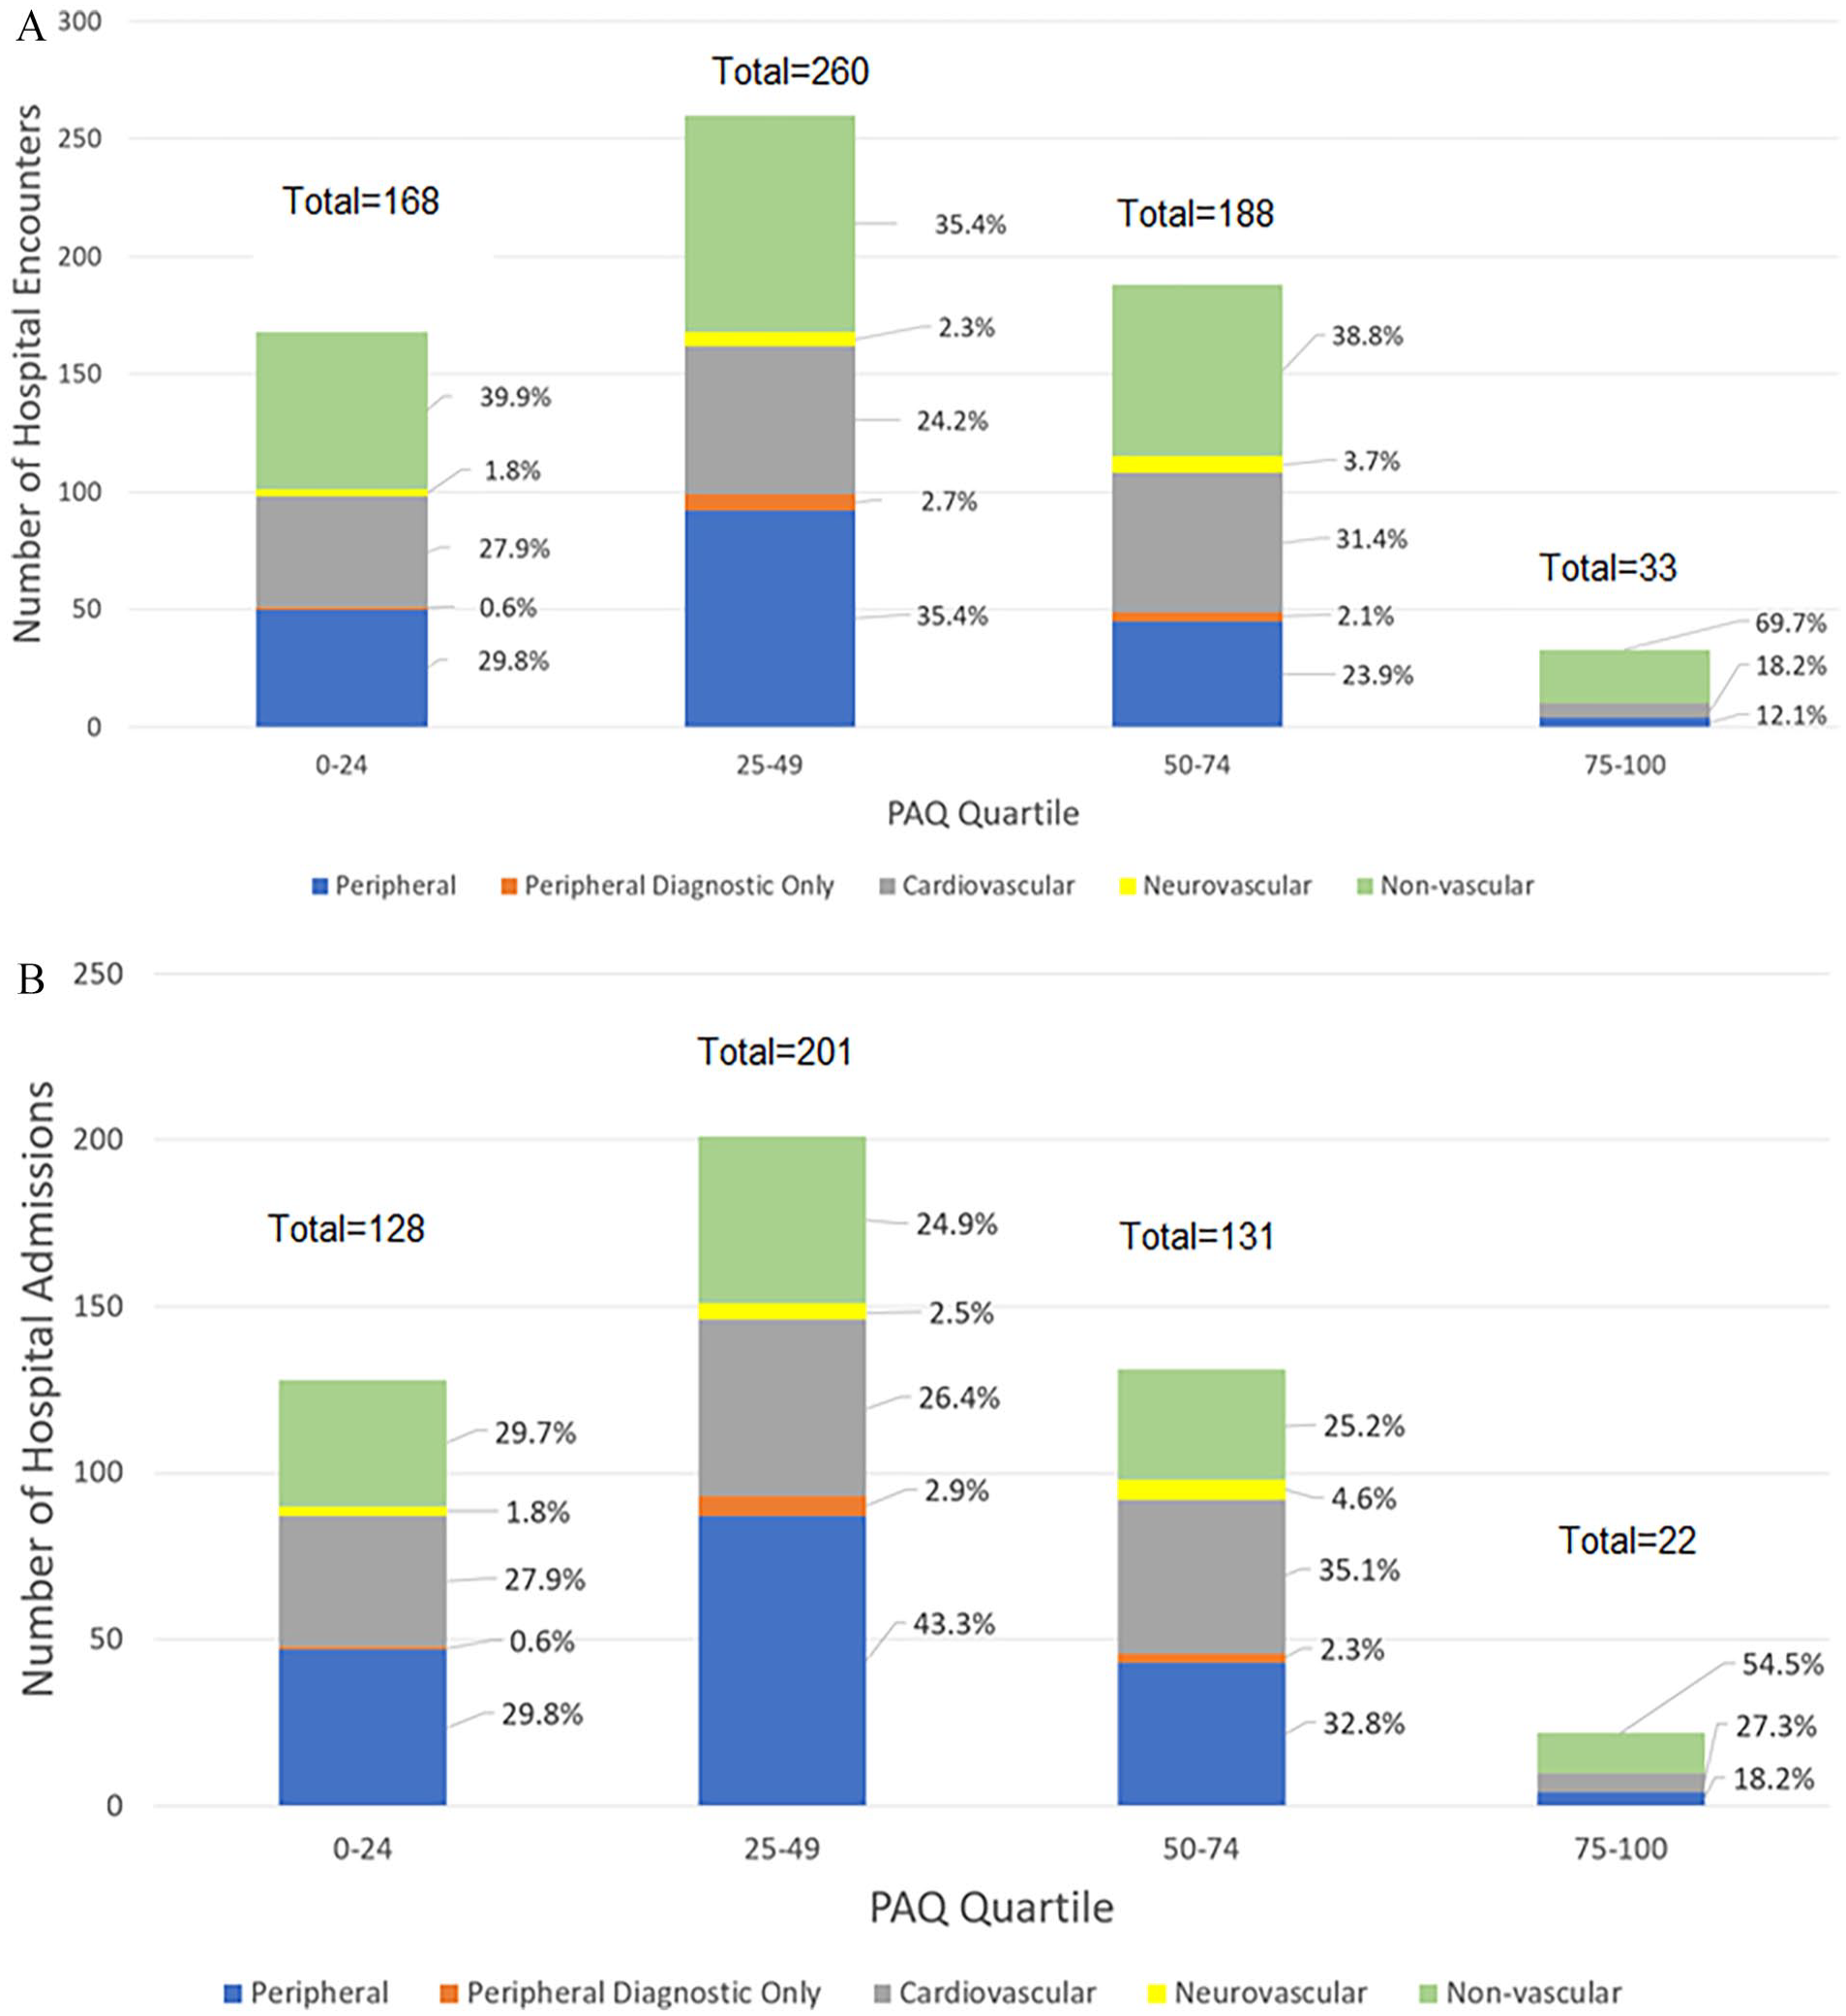
Burden of A) hospital admissions and ED visits and B) hospital admissions only and reason for hospital visit stratified by PAQ summary score ranges.
Discussion
In this multicenter, prospective cohort of patients in the PORTRAIT registry, lower health status assessments at the time of initial work-up were associated with an increased risk of a subsequent hospital admission and ED visit as well as all-cause hospital admissions. Patients with a new or worsening diagnosis of PAD demonstrated high healthcare utilization, with nearly half having either an ED visit or hospital admission within 12 months in this cohort. PAD and other cardiovascular diseases accounted for nearly 50% of ED visits for patients with baseline PAQ scores lower than 75 points in this cohort. Each 10-point decrease in baseline PAQ summary score was associated with a 13% increase in the risk of hospital admission or ED visit and a 15% increase in hospital admission only at 12 months, driven by increased risk with lower scores in the Physical Limitation, Social Limitation, Symptoms, and Quality of Life subdomains.
We documented an association between a PAD-specific health status measure and the risk of hospitalization at the time of evaluation for new or worsening symptoms of claudication. Prior work evaluating risk of healthcare utilization in patients with PAD has concentrated on risk stratification for short-term readmission after revascularization. 12 Our study provides a novel short-term and intermediate-term risk stratification tool for patients who have not yet undergone or been triaged to revascularization, specific to patients with claudication. Additionally, we provide an overview of the burden of healthcare utilization starting from the point of initiation of treatment for claudication.28,29 Further, adjudication of healthcare utilization information provides contemporary data on the multimorbid disease burden associated with PAD presenting as claudication. Lastly, there have been publications on independent associations between objective lower-extremity performance measures such as the 6-minute walk test as well as patient-reported outcome measures such as the Walking Impairment Questionnaire (WIQ) and clinical outcomes in PAD.13,30–33 These measures are specific to lower-extremity performance, and this study adds to existing literature by establishing an independent association between the multidimensional PAQ and clinical outcomes in PAD. The PAQ addresses a broad range of health status specific to PAD, expanding on more focused measures such as the WIQ, and allows for the potential to target interventions to address specific health status deficits, although the association between these interventions and change in health status as well as clinical outcomes would need to be further researched.
The healthcare utilization burden seen in the PORTRAIT registry is high, especially for patients with lower overall PAQ summary scores. Though PAD and other cardiovascular diseases were the predominant reason for admission or ED visit, nearly one in three patients with PAQ scores below the reference range (75–100) were evaluated for nonvascular reasons, indicative of the nature of chronic disease with multiple comorbidities typical for patients with PAD and claudication. This argues for a more integrated approach to patients with PAD that incorporates care models for evaluation and management of complex, comorbid, chronic disease states such as case management systems or multidisciplinary care models. These integrative interventions have been shown to be effective at preventing readmission in other chronic cardiovascular diseases like heart failure. 34
There is a need for flexible and accessible risk stratification tools, such as the PAQ, to help in early identification and triage of patients at the highest risk. The PAQ is easily administered at the time of evaluation, allows for identification of potentially modifiable factors, and offers complementary information on the multidimensional burden of PAD, which traditional risk factors frequently fail to capture. The use of baseline PAQ scores may help clinicians triage patients at the highest risk (i.e., with the lowest PAQ scores) to early enrollment in integrative care programs designed to address the multidimensional nature of PAD, such as care management programs. Furthermore, most of the PAQ subdomain scores were independently associated with increased risk of healthcare utilization and provide more granular risk data, and some of these associations differed based on the presence or absence of early revascularization, which may guide clinicians and patients to evaluate and activate extra support resources that can mitigate the root causes and experiences of their lower health status.
Limitations
This study has the following limitations. First, this study was restricted to patients from the United States and our findings will need to be reproduced for other countries. Additionally, US centers involved in PORTRAIT may not be representative of other clinics not included in the study. Second, there is the potential for misclassification of outcomes during data collection. Third, though all efforts were taken to capture hospital admissions and ED visits at hospitals not included in the PORTRAIT registry, we acknowledge that we may not have complete hospital encounter data due to the fractionated nature of the US healthcare system. Fourth, this study captures admissions between 2011 and 2015 and may not be reflective of current admission patterns in 2024, especially given the impact of the COVID-19 pandemic on US healthcare systems. Fifth, there may be residual confounding or unmeasured confounding. Lastly, this cohort only includes patients who can afford specialty care and is predominantly White and men. Results, therefore, may not be generalizable to different demographics or individuals of different socioeconomic status.
Conclusion
In a multicenter cohort of patients with new or worsening claudication, worse baseline PAD-specific health status was found to be associated with an increased risk in the composite of ED visits and hospital admission as well as hospital admission only. These results support the use of baseline health status for patient risk stratification, although replication and further validation are required prior to consideration of implementation in clinical care. Given the chronic nature of PAD, further work needs to establish the predictive role of change in PAQ score after intervention, and to quantify the change in health status necessary to prevent hospital admission or ED visit.
Supplemental Material
sj-pdf-1-vmj-10.1177_1358863X241274758 – Supplemental material for Association of health status and hospitalization risk for peripheral artery disease in the PORTRAIT registry
Supplemental material, sj-pdf-1-vmj-10.1177_1358863X241274758 for Association of health status and hospitalization risk for peripheral artery disease in the PORTRAIT registry by Jacob Cleman, Gaëlle Romain, Lindsey E Scierka, Clementine Labrosciano, Brooklyn Bradley, Robert Fitridge, John Beltrame, Mehdi H Shishehbor, John A Spertus, Carlos Mena-Hurtado and Kim G Smolderen in Vascular Medicine
Supplemental Material
sj-pdf-2-vmj-10.1177_1358863X241274758 – Supplemental material for Association of health status and hospitalization risk for peripheral artery disease in the PORTRAIT registry
Supplemental material, sj-pdf-2-vmj-10.1177_1358863X241274758 for Association of health status and hospitalization risk for peripheral artery disease in the PORTRAIT registry by Jacob Cleman, Gaëlle Romain, Lindsey E Scierka, Clementine Labrosciano, Brooklyn Bradley, Robert Fitridge, John Beltrame, Mehdi H Shishehbor, John A Spertus, Carlos Mena-Hurtado and Kim G Smolderen in Vascular Medicine
Footnotes
Data availability statement
Deidentified data that support the findings of this study are available from the corresponding author upon reasonable request.
Declaration of conflicting interests
The authors declared the following potential conflicts of interest with respect to the research, authorship, and/or publication of this article: Dr Mena-Hurtado reports unrestricted research grants from Philips and Shockwave and is a consultant for Abbott Vascular, Cook, Medtronic, and Optum Labs. Dr Smolderen reports unrestricted research grants from Philips, Merck, Shockwave, and Johnson & Johnson; she is a consultant for Optum Labs, Cook, Tegus, Twill, Inc., and Abbott Vascular. Dr Sp
Funding
Research reported in this publication was supported by the National Heart, Lung, and Blood Institute of the National Institutes of Health under Award Number T32HL155000. The content is solely the responsibility of the authors and does not necessarily represent the official views of the National Institutes of Health.
Research for the PORTRAIT study was partially funded through two Patient-Centered Outcomes Research Institute (PCORI) Awards (IP2 PI000753-01; CE-1304–6677), The Netherlands Organization for Scientific Research (VENI Grant No. 916.11.179), and an unrestricted grant from W. L. Gore & Associates, Inc. (Flagstaff, AZ).
ORCID iDs
Supplemental material
Supplemental material for this article is available online.
References
Supplementary Material
Please find the following supplemental material available below.
For Open Access articles published under a Creative Commons License, all supplemental material carries the same license as the article it is associated with.
For non-Open Access articles published, all supplemental material carries a non-exclusive license, and permission requests for re-use of supplemental material or any part of supplemental material shall be sent directly to the copyright owner as specified in the copyright notice associated with the article.