
Abstract
Introduction:
The aims were (a) to compare the maximal calf conductance and 6-minute walk distance of participants with and without peripheral artery disease (PAD) and claudication, (b) to determine whether maximal calf conductance was more strongly associated with 6-minute walk distance in participants with PAD than in the controls, and (c) to determine whether this association was significant in participants with PAD after adjusting for ABI, as well as for demographic, anthropometric, and comorbid variables.
Methods:
Participants with PAD (n = 633) and without PAD (n = 327) were assessed on maximal calf conductance using venous occlusion plethysmography, and on 6-minute walk distance. Participants were further characterized on ABI, and on demographic, anthropometric, and comorbid variables.
Results:
The PAD group had lower maximal calf conductance than the control group (0.136 ± 0.071 vs 0.201 ± 0.113 mL/100 mL/min/mmHg, p < 0.001). Additionally, the PAD group had a lower 6-minute walk distance (375 ± 98 m vs 480 ± 107 m, p < 0.001). Maximal calf conductance was positively associated with 6-minute walk distance in both groups (p < 0.001) and was more strongly associated in the PAD group (p < 0.001). In adjusted analyses, maximal calf conductance remained positively associated with 6-minute walk distance in the PAD group (p < 0.001) and in the control group (p < 0.001).
Conclusions:
Participants with PAD and claudication had impaired maximal calf conductance and a lower 6-minute walk distance than those without PAD, and maximal calf conductance was positively and independently associated with 6-minute walk distance within each group before and after adjusting for ABI, and for demographic, anthropometric, and comorbid variables.
Introduction
Peripheral artery disease (PAD) is a significant medical concern as it is highly prevalent worldwide, affecting over 237 million people. 1 Additionally, PAD is costly, 2 and is associated with a high rate of all-cause and cardiovascular mortality. 3 The most common symptom of PAD is claudication, 4 defined as lower-extremity pain that is reproducibly induced by walking and relieved with rest, and which is secondary to inadequate blood flow to the exercising leg musculature. Consequently, claudication impairs ambulation, 5 physical function, 6 daily physical activity, 7 and health-related quality of life. 8
The hallmark noninvasive clinical test to determine the presence and severity of PAD is the ankle/brachial index (ABI). In addition to defining PAD, the ABI is clinically relevant because it predicts cardiovascular risk associated with mortality and major coronary events beyond that explained by the Framingham Risk Score. 9 Although ABI is a clinically relevant outcome for patients with PAD, it is a measure of large vessel disease obtained at rest which is weakly correlated with the ambulatory function of patients with PAD and claudication both at baseline10–17 and following exercise intervention. 18 We have recently found that patients with PAD demonstrated reduced calf muscle oxygen saturation during a standard treadmill test (a surrogate measure of microvascular perfusion), which was more associated with claudication measurements than ABI. 19 This finding suggests that peripheral vascular function plays a role in walking performance in patients with PAD.
Peripheral microvascular dilator function measured by reactive hyperemia 20 is a clinically important measure because it is an established predictor of all-cause and cardiovascular mortality 21 and morbidity,22,23 and it declines with age. 24 When maximal reactive hyperemia blood flow is normalized to mean arterial blood pressure, defined as maximal conductance, it is associated with maximal aerobic exercise tolerance in older adults. 25 Furthermore, microvascularization, as measured by capillary density of the gastrocnemius muscle, is related to treadmill peak walking time in patients with PAD but not in control subjects. 26 Thus, microvascular function may be more of a key factor in exercise performance in patients with PAD than in older controls. Given that submaximal exercise, measured with a 6-minute walk test, may be more related to daily physical activities than maximal treadmill exercise performance, 27 the clinical relevance of microvascular function in patients with PAD may be most evident during submaximal exercise. However, it is not clear whether microvascular function is associated with submaximal exercise performance in participants with and without PAD, whether this association is stronger in participants with PAD, and whether this association is evident after adjustment for ABI. The current study is focused to address these knowledge gaps.
The aims of this investigation were (a) to compare the maximal calf conductance and 6-minute walk distance of participants with and without PAD and claudication, (b) to determine whether maximal calf conductance was more strongly associated with 6-minute walk distance in participants with PAD than in the controls, and (c) to determine whether this association was significant in participants with PAD after adjusting for ABI, as well as for demographic, anthropometric, and comorbid variables. We hypothesized that (a) participants with PAD and claudication would have lower maximal calf conductance and a lower 6-minute walk distance than controls, (b) the association between maximal calf conductance and 6-minute walk distance would be stronger in the PAD group, and (c) maximal calf conductance would be positively and independently associated with 6-minute walk distance in participants with and without PAD after adjusting for ABI, as well as demographic, anthropometric, and comorbid variables.
Methods
Participants
Approval and informed consent
The procedures of this study were approved by the institutional review board from the University of Oklahoma Health Sciences Center. This protocol was a research clinic to compare demographic, clinical, functional, and vascular characteristics of participants with and without PAD from 2002 to 2017. Assessments from this study also provided an initial prescreen evaluation to identify potential candidates for enrollment into subsequent randomized and nonrandomized exercise clinical trials. Written informed consent was obtained from each participant prior to beginning the investigation.
Recruitment
Individuals who had claudication (Fontaine Stage II) 4 were recruited from vascular clinics and posted research flyers for possible enrollment into the study. Individuals who did not have PAD were recruited via local newspaper advertisements and posted research flyers. Participants were evaluated in the morning at the Clinical Research Center and were screened on the inclusion and exclusion criteria listed below to begin the study visit. 28
Inclusion and exclusion criteria
Participants with symptomatic PAD without previous lower-extremity revascularization were included in this study if they met the following criteria: (a) history of ambulatory leg pain, and (b) presence of PAD defined by an ABI ⩽ 0.90. 29 Participants without PAD were included in this study if they met the following criteria: (a) ambulatory without the need of an assistive device, and (b) ABI was in the normal range between 1.00 and 1.40. Participants from both groups were excluded for the following conditions: (a) history of dementia or cognitive impairment (Mini-Mental State Examination score < 24), 30 (b) neurological diseases or other conditions that limited exercise, (c) active cancer, (d) end-stage renal disease, and (e) noncompressible vessels indicated by an ABI > 1.40.
Measurements
The sequence and approximate time required for the following test procedures are provided in Figure 1. The medical screening evaluations were performed by study physicians, and the peripheral vascular tests and the objective and subjective assessments of walking were done by research staff trained by the principal investigator (AWG) according to standard procedures.
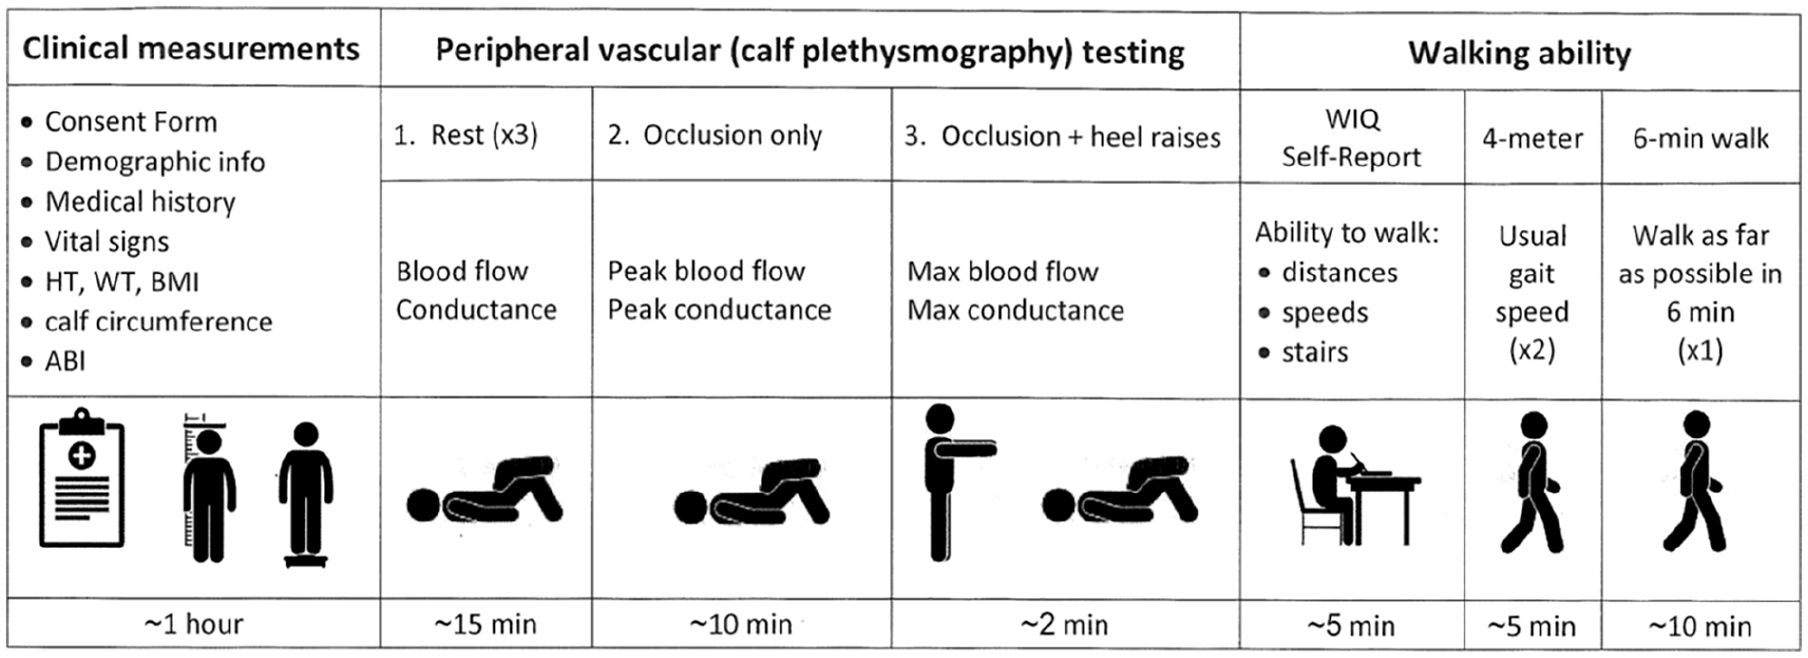
Schematic illustration of study timeline.
Medical screening
Participants arrived at the Clinical Research Center in the morning fasted, but were permitted to take their usual medications. Vital signs, demographic information, height, weight, body mass index, and calf circumference were recorded, and ABI was obtained according to standard guidelines. 31 As previously described, 28 a medical screening consisted of a typical workup for assessment of participants with PAD, and included the documentation of claudication history, comorbid conditions, cardiovascular risk factors, and current medications. Based on this battery of baseline assessments, participants were coded on cardiovascular risk factors according to standard definitions for hypertension, dyslipidemia, diabetes mellitus, obesity, and metabolic syndrome. 32 Additionally, coronary artery disease, cerebrovascular disease, and chronic kidney disease 33 were coded according to standard definitions, as previously described. 34 Participants were further characterized on history of previous myocardial infarction and cerebrovascular accidents. The medical screening was similar for the control participants.
Peripheral vascular test procedures
The circulation of the lower extremities was assessed under the following three conditions: (1) rest, (2) reactive hyperemia, and (3) maximal hyperemia. The rest period consisted of the participants lying supine for 10 minutes. The reactive hyperemic test was then performed while participants were in the supine position by inflating a thigh blood pressure cuff to either 200 mmHg or to 50 mmHg above systolic blood pressure, whichever was higher, to induce arterial occlusion for 3 minutes, followed by deflation of the thigh cuff. Postocclusive reactive hyperemic calf blood flow was then repeatedly measured every 10 seconds within the first minute following the 3-minute occlusion, and the highest value was recorded. Within 1 minute of completing the postocclusive reactive hyperemia test, participants stood up to perform the maximal hyperemic (occlusion + heel raises) test in which a deflated thigh cuff, a strain-gauge wrapped around the calf muscle, and a deflated ankle cuff remained attached to the study leg. This test was initiated by inflating the thigh cuff to 300 mmHg after the patients stood and then they immediately performed heel raises for as long as they could tolerate, which was less than 60 seconds for all participants. 35 Within 1 minute after cessation of the heel raise exercise (and with the thigh cuff still inflated), participants returned with assistance to the supine position. Once the lower limbs were positioned properly, the strain-gauge was checked and readjusted if necessary, and the thigh cuff was deflated. Maximal hyperemic calf blood flow was then measured repeatedly four times every 10 seconds. The highest value was recorded as the maximal hyperemic calf blood flow.
Vascular measurements
Brachial blood pressure and heart rate were measured from both arms at rest using a Critikon Dinamap Vital Signs Monitor (Model 1846-SX; Tampa, Florida), using either a standard adult size blood pressure cuff (14 cm width) or a large adult size cuff (17 cm width). Brachial systolic pressure and diastolic pressure at rest were recorded from the arm yielding the higher systolic pressure, and this arm was then used for all subsequent brachial blood pressure and heart rate measurements. From these measures, mean arterial pressure was calculated as [brachial systolic pressure + (2 × brachial diastolic pressure) / 3]. Calf blood flow was obtained by venous occlusion strain-gauge plethysmography in the more severely diseased leg in the PAD group, and in the right leg in the non-PAD group. A mercury strain gauge was placed around the calf at the maximal circumference, and the leg was elevated by having the ankle and foot rest on foam pads 12 cm high. Arterial blood flow to the foot was then temporarily occluded by an ankle cuff inflated to 300 mmHg throughout all calf blood flow measurements, which was immediately deflated between the rest, reactive hyperemia, and maximal hyperemia measurements. Calf blood flow was obtained during each of the three measurement conditions by inflating the thigh cuff to a venous occlusion pressure of 50 mmHg for 10 seconds, and then deflating the thigh cuff after each measurement of calf blood flow. Calf blood flow was calculated by drawing the slope line of the top of the first three pulse waveform peaks displayed on the plethysmograph recording. If there was cuff artifact present at the point of cuff inflation, the top of the first three pulse waveform peaks after the cuff artifact were utilized. 36 Calf conductance was calculated as calf blood flow / mean arterial pressure, and calf peripheral resistance was calculated as mean arterial pressure / calf blood flow.
Walking Impairment Questionnaire (WIQ)
After the peripheral vascular test, self-reported ambulatory ability was obtained using a validated questionnaire that assesses ability to walk at various distances and speeds, and to climb stairs. 37
Gait speed from a 4-meter walk test
After administering the WIQ, gait speed was measured from a 4-meter walk test in a hallway. 38 This test was performed twice at usual walking pace. Walking times were converted to speed in m/sec, and the test with the faster speed was used in the analyses.
6-Minute walk test
During the final test, participants performed a 6-minute walk test in which two cones were placed 100 feet (30.5 m) apart in a marked corridor, and the 6-minute walk distance was recorded. 39 Participants were instructed to cover as much distance as possible during the test. The technician stood at the center of the course and provided encouragement every 2 minutes. The test-retest intraclass reliability coefficient is R = 0.94 for the total 6-minute walk distance. 39
Statistical analyses
Summary statistics including means with SDs presented for continuous variables and frequencies with percentage (%) for categorical variables (Tables 1–3). The Shapiro–Wilk tests were used to check the normality assumption for continuous variables, and if violated, log-transformation was applied. Two-group comparisons between PAD and control (non-PAD) relied on two-sample t-tests or Wilcoxon rank-sum tests for continuous variables, and Pearson chi-squared tests or Fisher’s exact tests for categorical variables, as appropriate. These univariate analyses were able to identify potential confounding variables for subsequent multiple regressions. To further evaluate the association between maximal calf conductance and 6-minute walk distance, multivariable linear regressions stratified by group were conducted, adjusting for ABI and demographic, anthropometric, and comorbid variables detected from aforementioned univariate screening (Tables 4 and 5). Specifically, the issue of multicollinearity among explanatory variables and the assumptions (e.g., linearity, the residual normality, homoscedasticity) for regression analysis were assessed. In addition, we performed regression analysis on all participants without any stratification to compare this association between the PAD group and the control group. The parameter estimates and 95% CI, partial R2, as well as adjusted p-values based on Wald tests were provided. All hypothesis tests were two-sided with the significance level of 0.05. Data were analyzed using SAS 9.4 software (SAS Institute Inc., Cary, NC, USA).
Clinical characteristics of participants with peripheral artery disease (PAD) and controls.
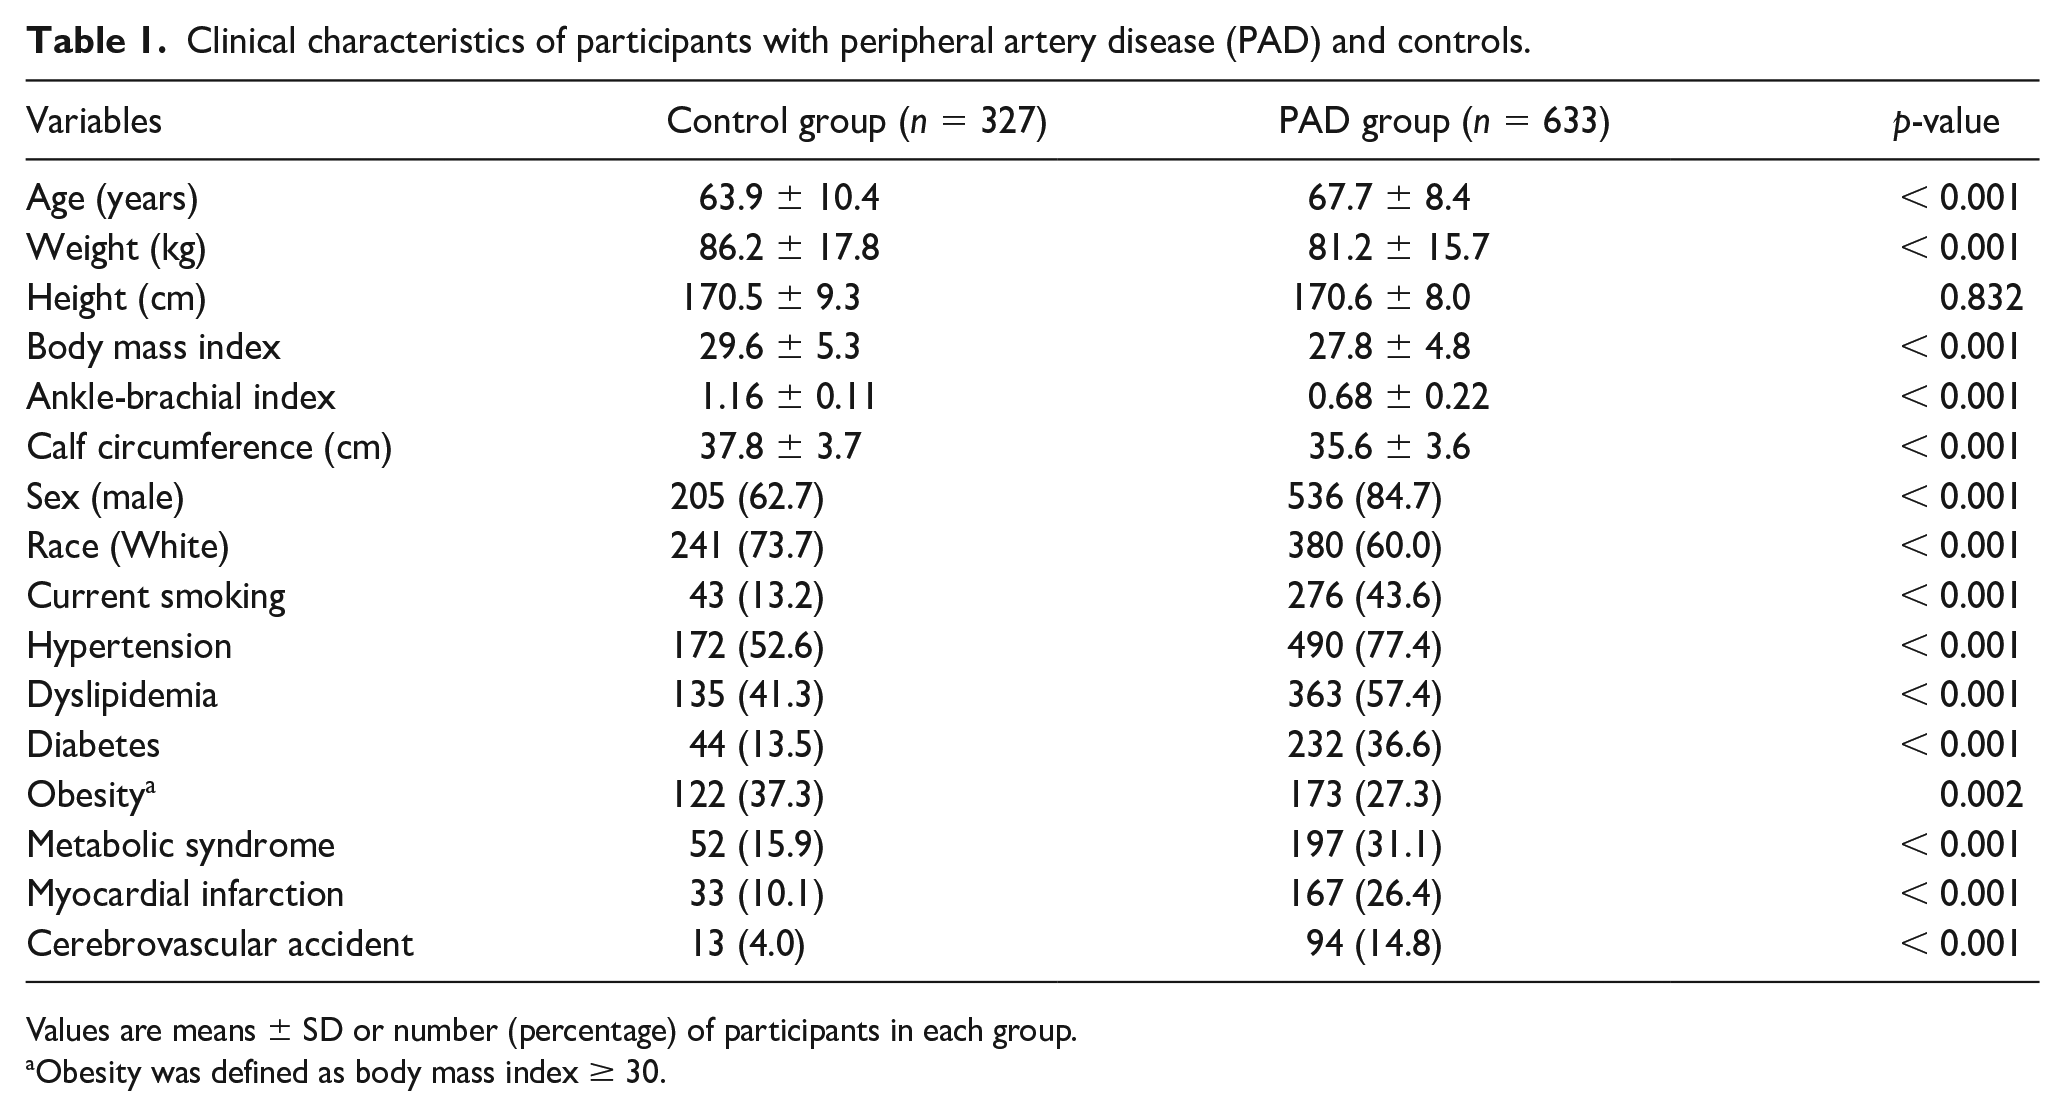
Values are means ± SD or number (percentage) of participants in each group.
Obesity was defined as body mass index ≥ 30.
Vascular measurements in participants with peripheral artery disease (PAD) and controls.
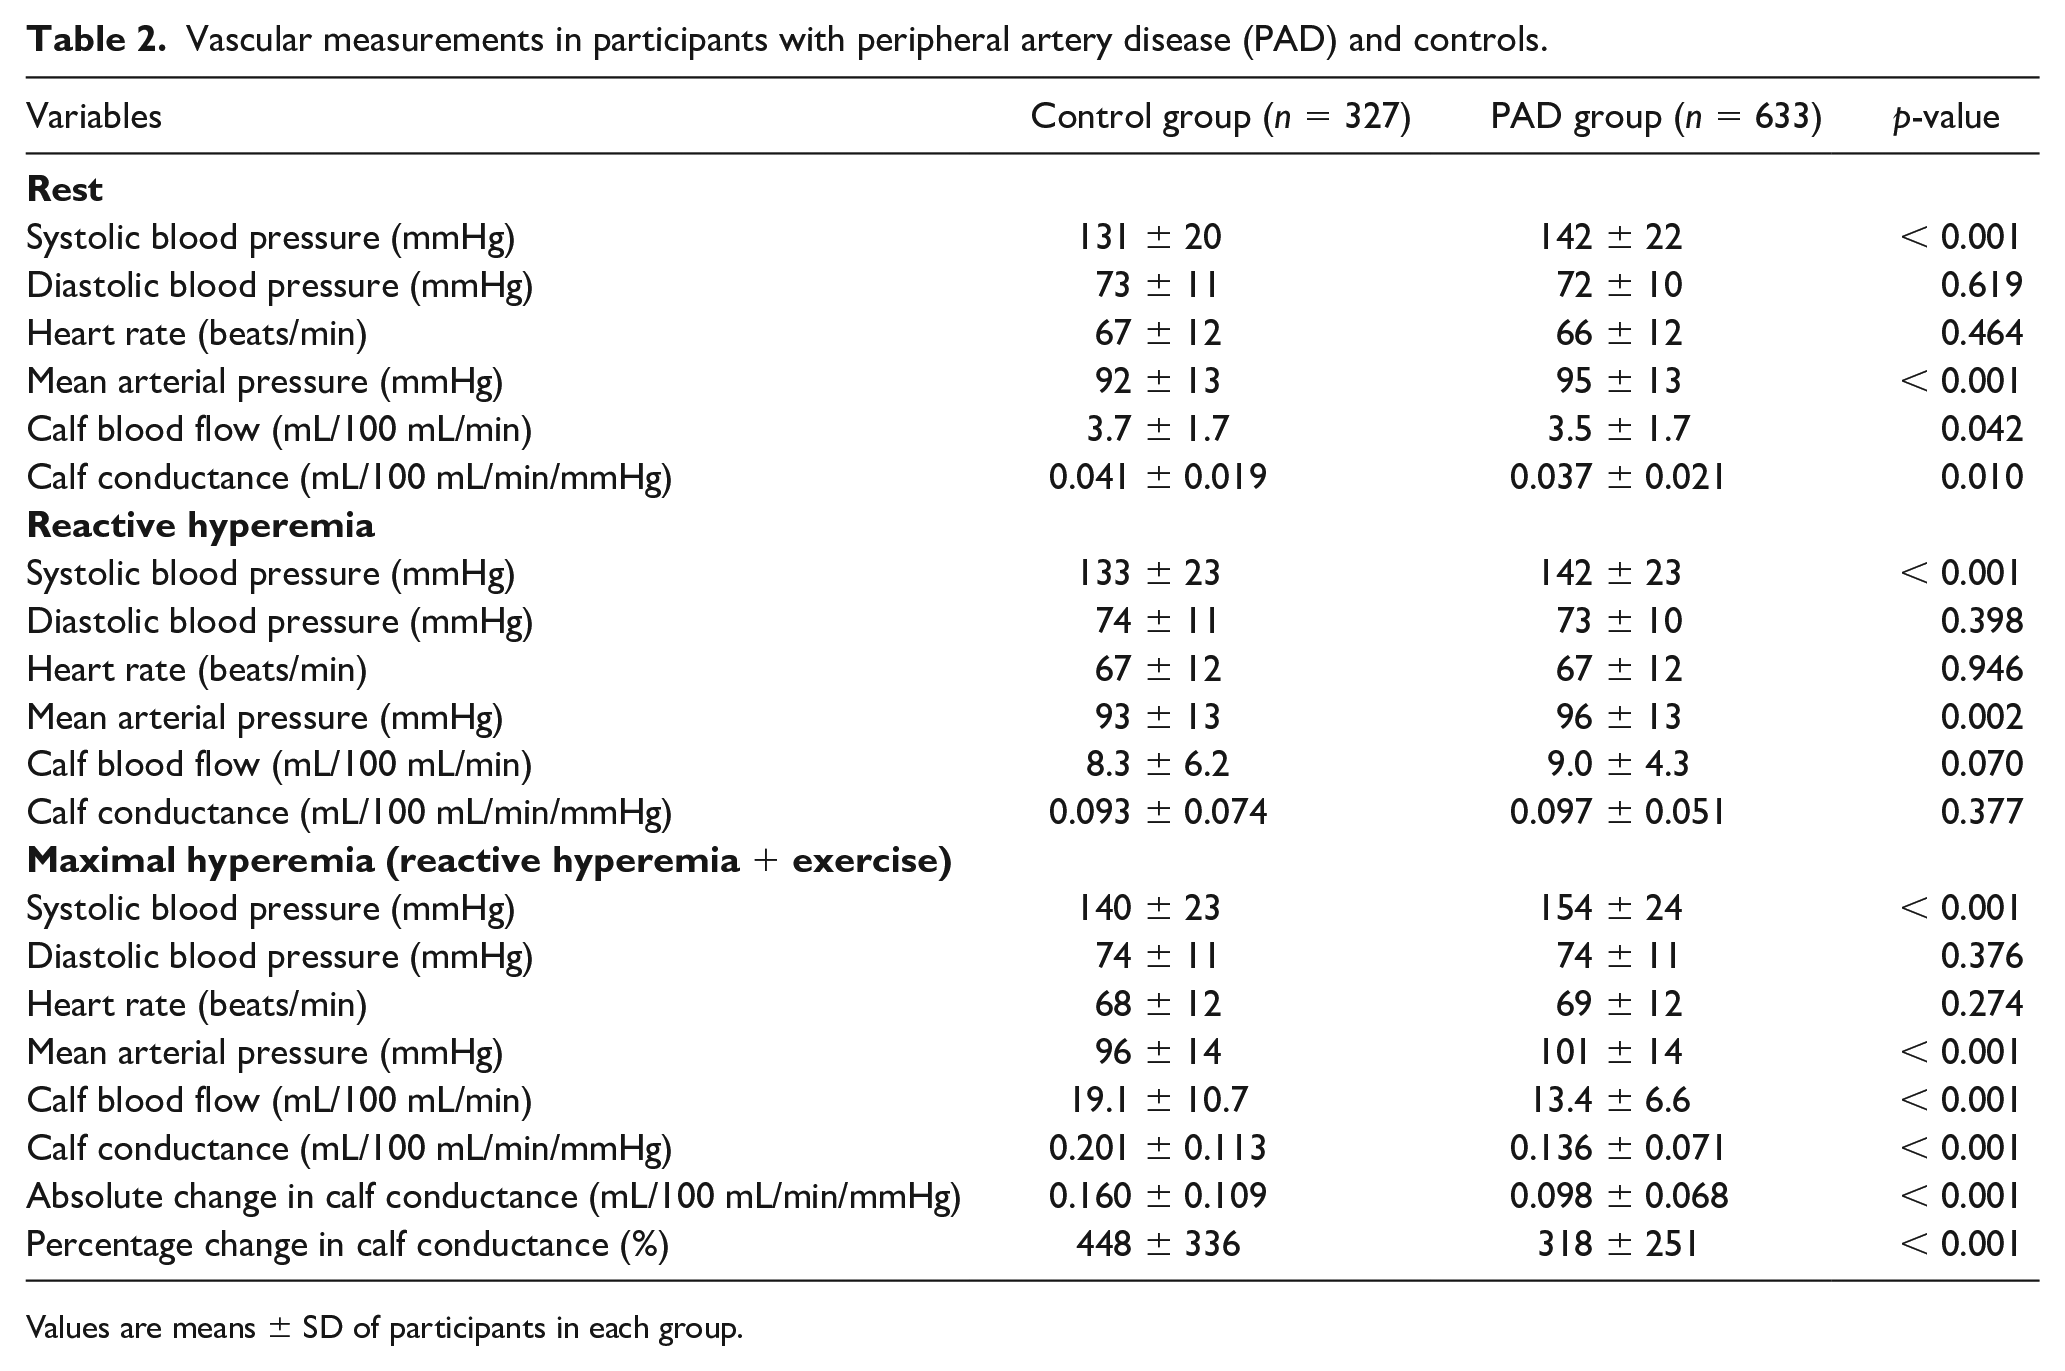
Values are means ± SD of participants in each group.
Ambulatory measurements in participants with peripheral artery disease (PAD) and controls.
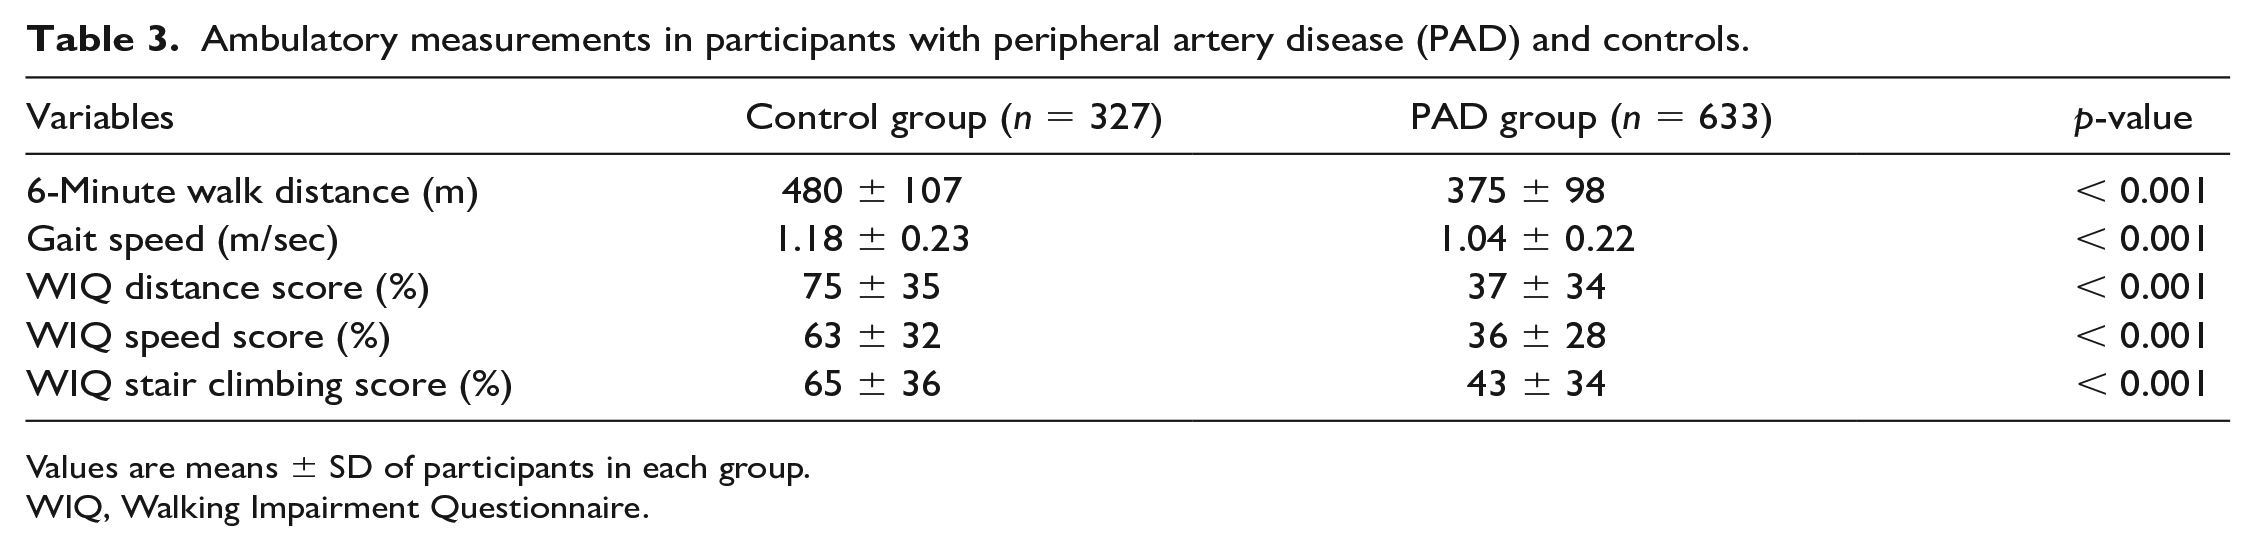
Values are means ± SD of participants in each group.
WIQ, Walking Impairment Questionnaire.
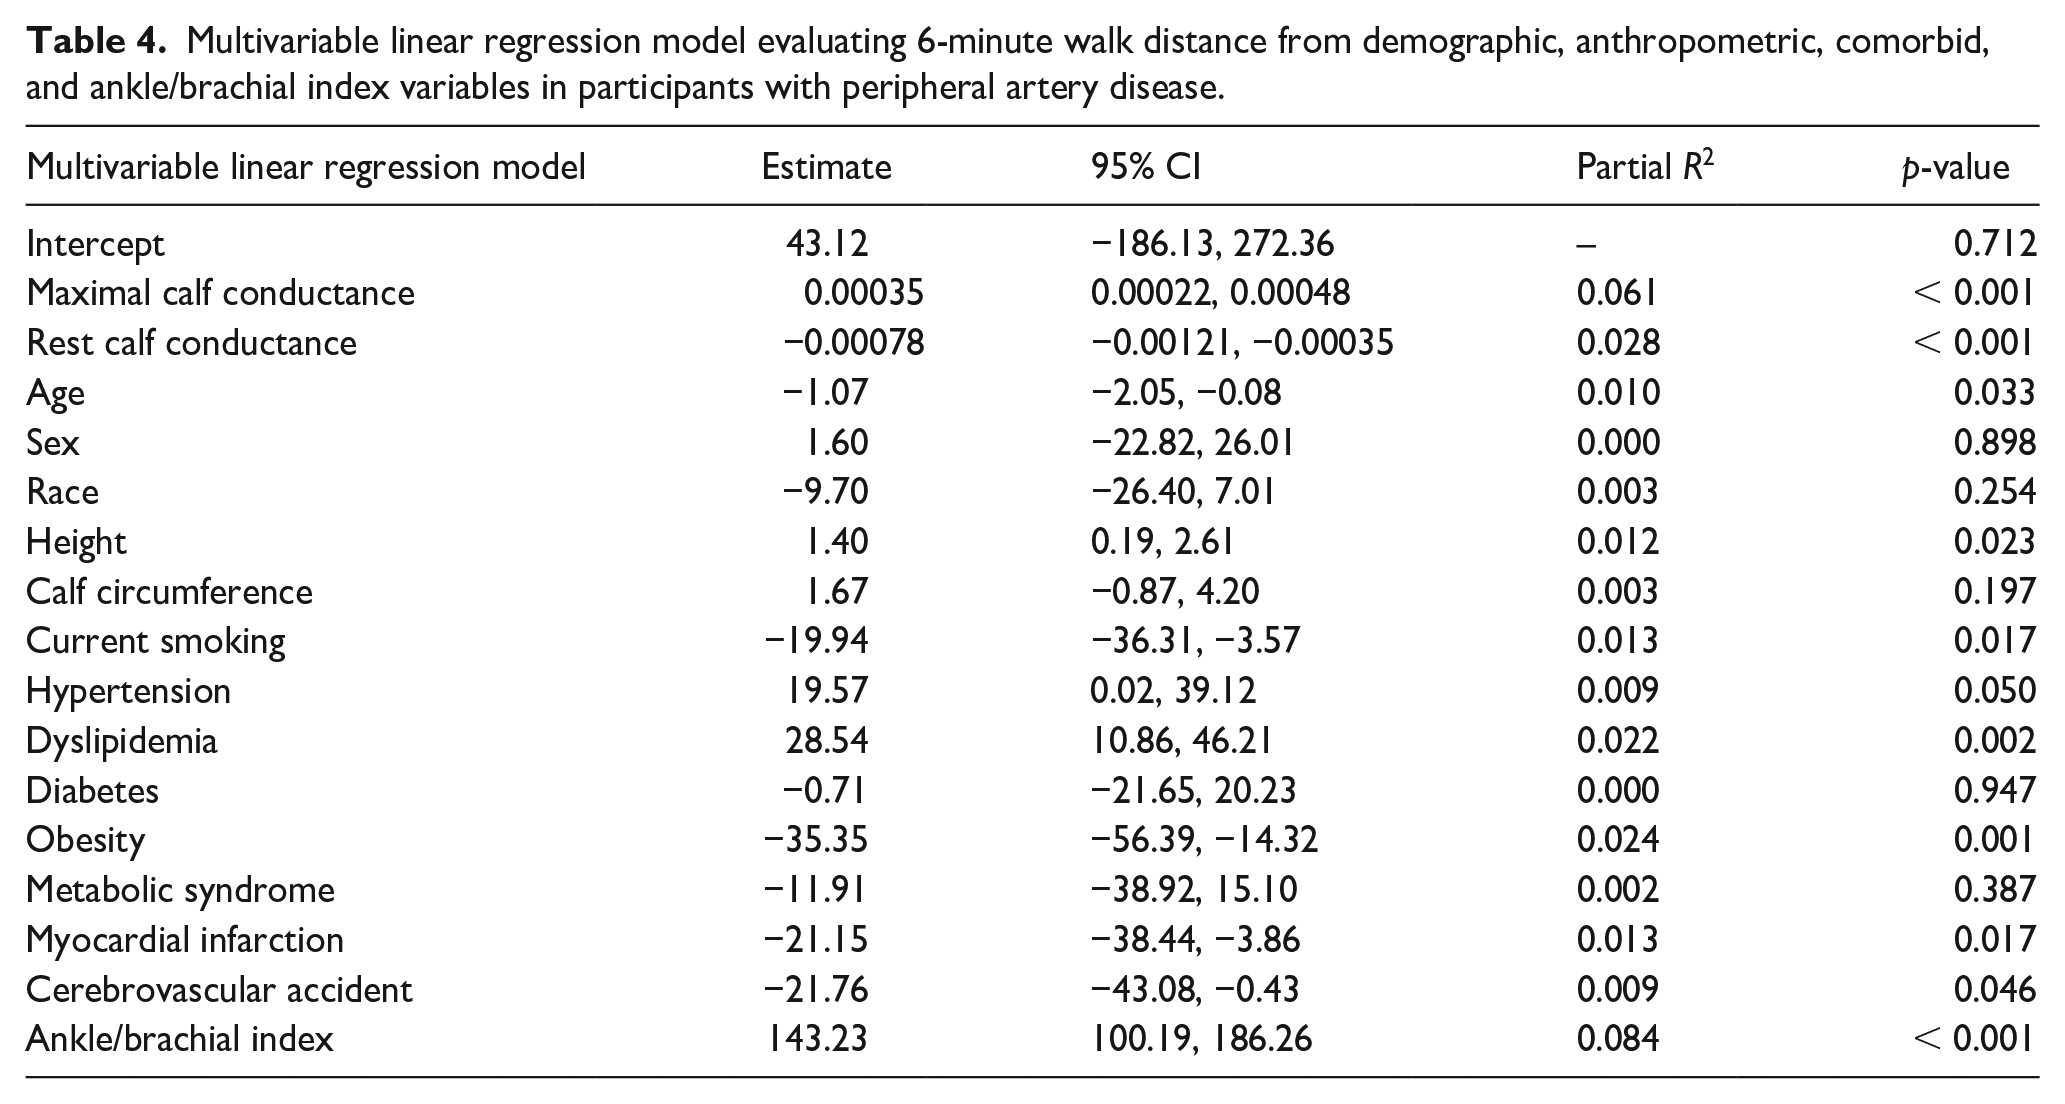
Multivariable linear regression model evaluating 6-minute walk distance from demographic, anthropometric, comorbid, and ankle/brachial index variables in participants with peripheral artery disease.
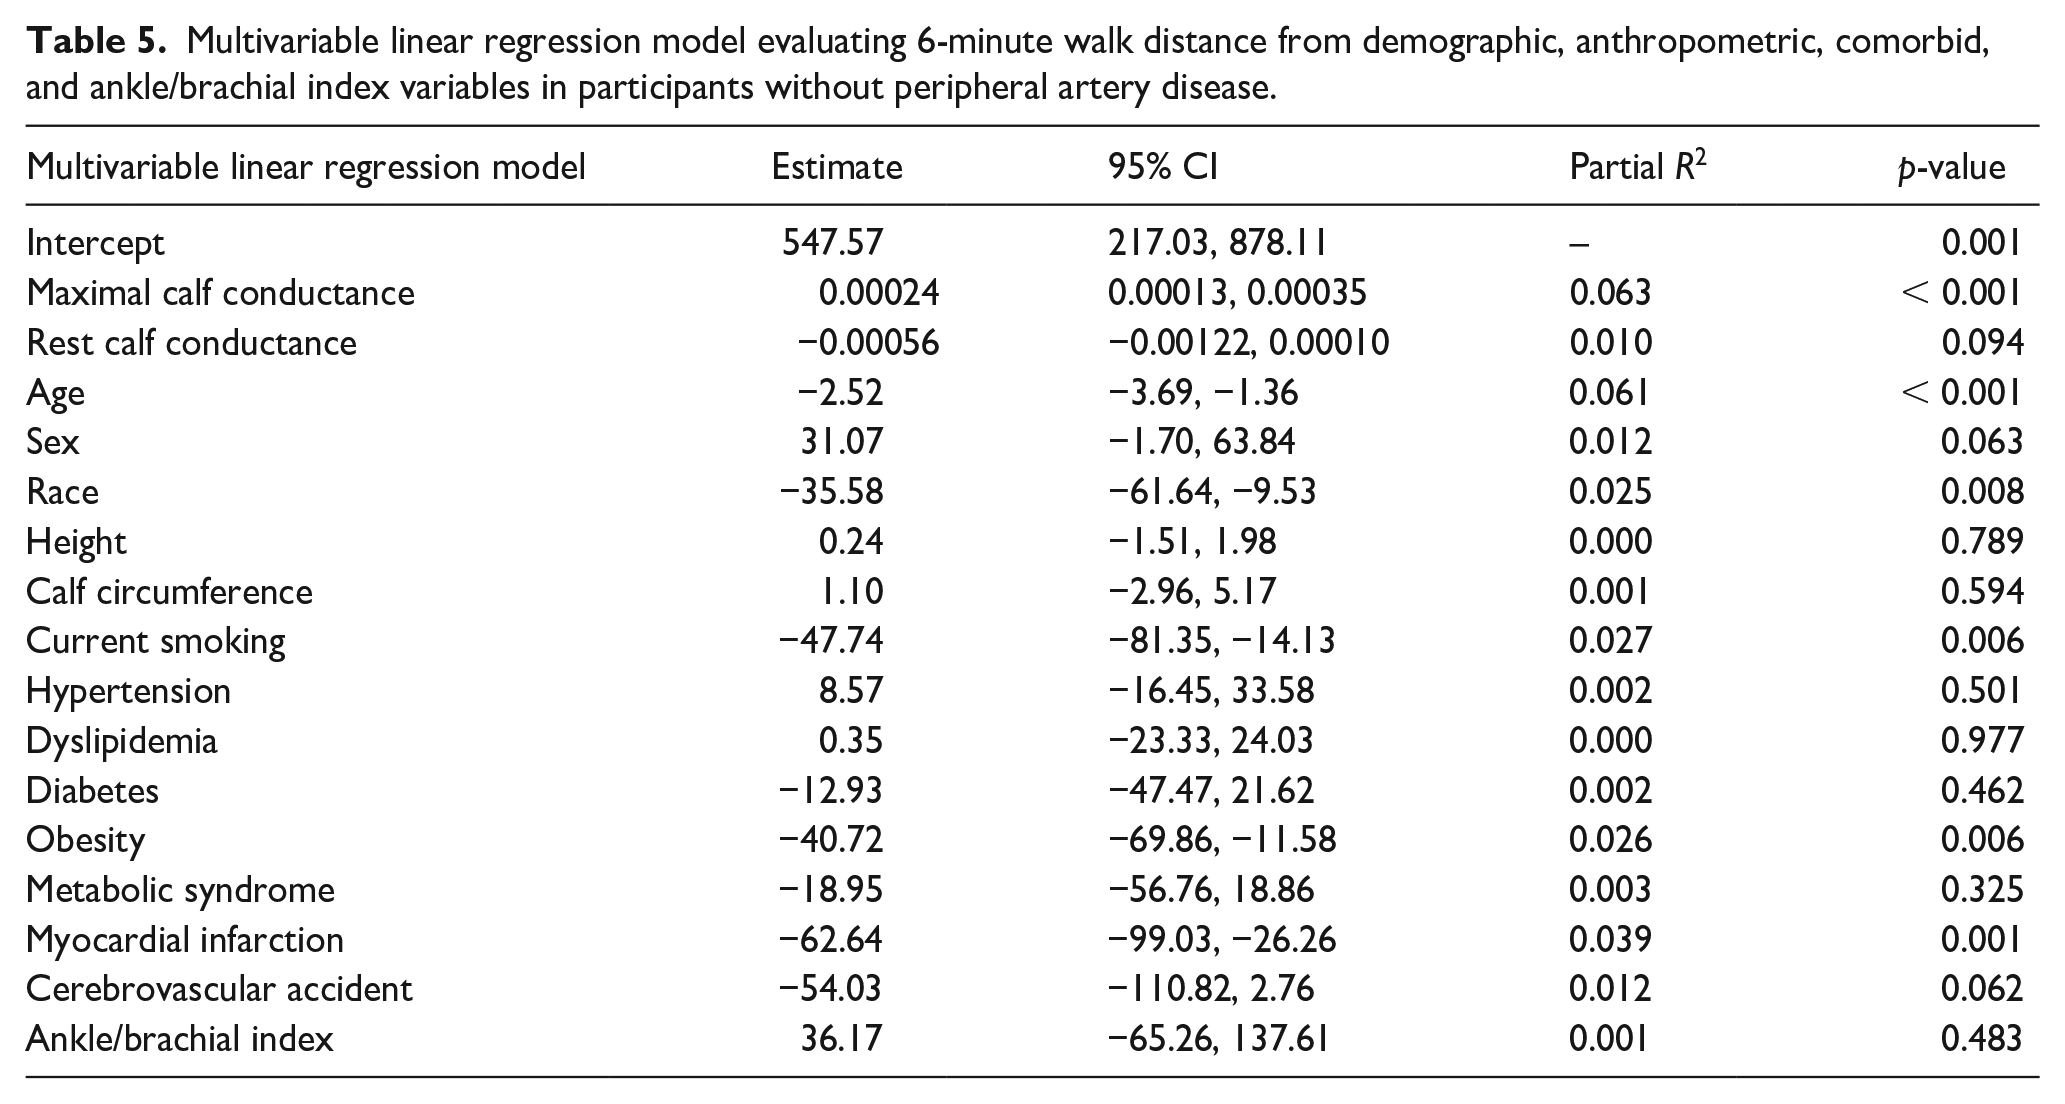
Multivariable linear regression model evaluating 6-minute walk distance from demographic, anthropometric, comorbid, and ankle/brachial index variables in participants without peripheral artery disease.
Results
The clinical characteristics of the PAD and control groups are shown in Table 1. The groups were significantly different on all variables at p < 0.001, except for height (p = 0.832) and obesity (p = 0.002).
The vascular measurements of the PAD and control groups are displayed in Table 2. The PAD group had lower calf conductance than the control group under rest (0.037 ± 0.021 vs 0.041 ± 0.019 mL/100 mL/min/mmHg, p = 0.010) and maximal (0.136 ± 0.071 vs 0.201 ± 0.113 mL/100 mL/min/mmHg, p < 0.001) conditions, and had lower absolute (0.098 ± 0.068 vs 0.160 ± 0.109 mL/100 mL/min/mmHg, p < 0.001) and percentage (318 ± 251 vs 448 ± 336%, p < 0.001) changes in calf conductance from rest to maximal conditions. Additionally, the PAD group had higher systolic blood pressure (142 ± 22 vs 131 ± 20 mmHg, p < 0.001) and mean arterial pressure (95 ± 13 vs 92 ± 13 mmHg, p < 0.001) than the control group at rest (p < 0.001), and higher systolic blood pressure (154 ± 24 vs 140 ± 23 mmHg, p < 0.001) and mean arterial pressure (101 ± 14 vs 96 ± 14 mmHg, p < 0.001) at maximal conditions.
Ambulatory measurements of the PAD and control groups are shown in Table 3. The PAD group had a lower 6-minute walk distance (375 ± 98 vs 480 ± 107 m, p < 0.001), gait speed (1.04 ± 0.22 vs 1.18 ± 0.23 m/sec, p < 0.001), and WIQ distance (37 ± 34 vs 75 ± 35%, p < 0.001), speed (36 ± 28 vs 63 ± 32%, p < 0.001), and stair climbing (43 ± 34 vs 65 ± 36%, p < 0.001) scores than the control group.
Maximal calf conductance was positively associated with 6-minute walk distance in the PAD group (R = 0.399, p < 0.001) and in the control group (R = 0.307, p < 0.001) (Figure 2). This association was stronger in the PAD group than the control group (p < 0.001). After confirming that the assumptions for regression analysis were met, we performed adjusted analyses in which maximal calf conductance remained positively associated with 6-minute walk distance in the PAD group (p < 0.001) (Table 4), and in the control group (p < 0.001) (Table 5). In a secondary analysis evaluating the association between reactive hyperemia calf conductance and 6-minute walk distance, we found that this association was not significant in the PAD group (R = 0.064, p = 0.142) and was relatively low but significant in the control group (R = 0.182, p = 0.001).
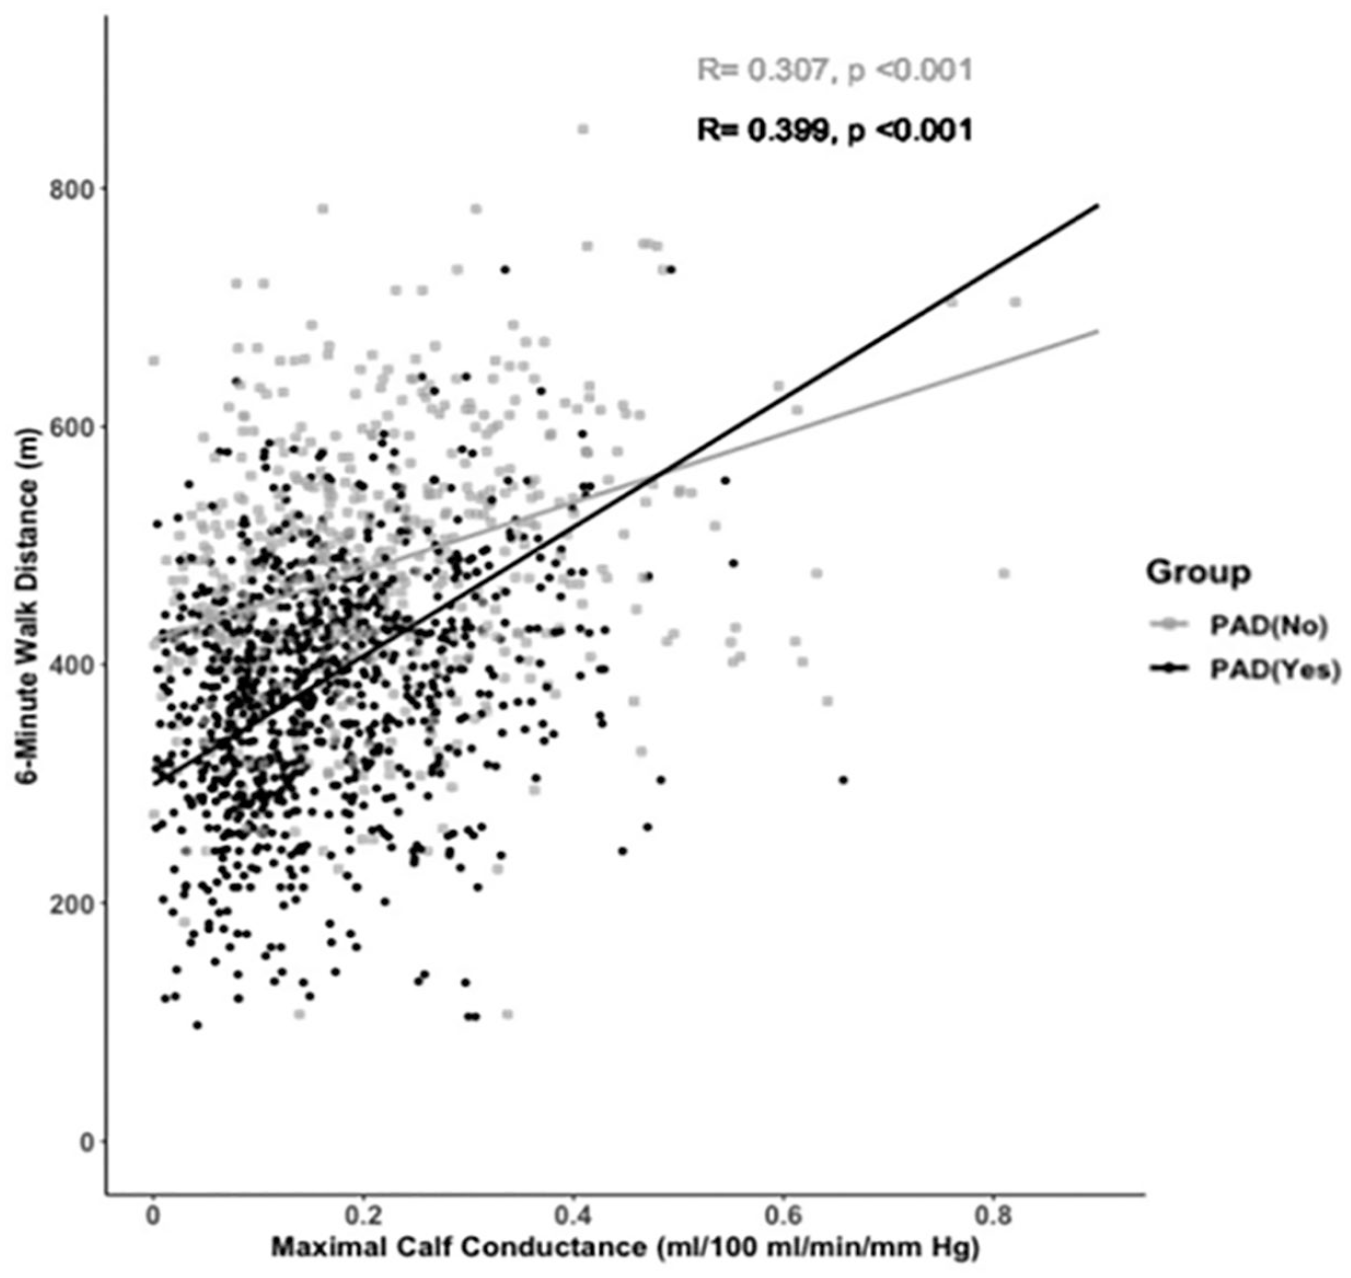
Scatter plot between maximal calf conductance and 6-minute walk distance in the peripheral artery disease (PAD) group and in the control group.
Discussion
Participants with PAD and claudication had a 32% lower maximal calf conductance and a 22% lower 6-minute walk distance than participants without PAD. The primary finding was that maximal calf conductance was associated with 6-minute walk distance in both groups, and this positive association was independent of ABI, and demographic, anthropometric, and comorbid variables.
Maximal calf conductance and 6-minute walk distance in participants with PAD
The 32% lower maximal calf conductance observed in the PAD group compared to the control group supports two small studies that compared these groups using contrast-enhanced ultrasound.40,41 In a group of patients with claudication ranging between mild to severe symptoms (Rutherford Category 1–3), maximal perfusion was more than 40% lower in the patients than in controls following a graded treadmill test. 41 Even greater impairment in calf blood flow was found in patients with PAD (Rutherford Categories 3–6) after modest plantar flexion exercise, 40 suggesting that maximal vasodilator capacity, a measure of both large and small vessel disease, is impaired in patients with PAD. This finding is also supported by studies that have used the technique of hemoglobin oxygen saturation to evaluate the microcirculation of the calf muscle in patients with PAD during treadmill exercise.12,42,43 These studies found that the impairment in calf muscle hemoglobin oxygen saturation was strongly correlated with the treadmill peak walking time, indicating that the microcirculation of the calf muscle is highly associated with the development of ischemic pain.12,42,43 A potential mechanism for the impaired peripheral vascular response to maximal exercise in patients with claudication is their decreased gastrocnemius capillary density compared to controls. 26 The current study extends these observations by showing that maximal calf conductance was associated with 6-minute walk distance in patients with PAD, suggesting that impaired maximal calf conductance limits walking performance at lower exercise intensity representative of daily activities encountered in the community setting.
The association between vascular insufficiency and exercise performance in patients with PAD has primarily been evaluated using ABI, which is a macrovascular measure reflecting the severity of PAD. The association between ABI and treadmill exercise performance in patients with claudication has yielded inconsistent results, as we10,11 and others14,44 have found ABI to be positively related to peak walking time and peak oxygen uptake, 45 whereas a few other studies have found no association.26,43 Regardless of this discrepancy, the association between ABI and exercise performance in patients with claudication ranges from a low to a moderate association; this suggests that the macrovasculature only explains a relatively small amount of variance in treadmill exercise performance. It has been argued that the 6-minute walk test is more representative of daily activities in patients with PAD, 27 but fewer studies have examined the association between ABI and 6-minute walk distance. We previously found that ABI was significantly and positively associated with 6-minute walk distance in patients with PAD and claudication. 39 The multivariable results of the current study extend this observation by showing that ABI is independently associated with 6-minute walk distance in the PAD group after adjusting for demographic, anthropometric, comorbid, and maximal calf conductance variables.
Maximal calf conductance and 6-minute walk distance in older controls
The current study found that maximal calf conductance was positively associated with 6-minute walk distance in control participants without PAD, as those who had higher conductance values attained greater walking distances. As expected, we observed no association between ABI and 6-mintue walk distance because all control participants had ABI values within the normal range. Thus, values ranging from the lower to higher ends of the normal ABI range do not translate to either impaired or enhanced walking in controls. Collectively, our results suggest that in older participants without PAD who have normal macrocirculation through the major conduit leg arteries, the 6-minute walk distance is explained by maximal vasodilator capacity, which also reflects microcirculatory function of the small vessels of the calf musculature, even after adjustment for other significant clinical characteristics such as age, sex, race, weight, calf circumference, current smoking, and history of myocardial infarction. The association between maximal calf conductance and 6-minute walk distance was lower in the control group than in the PAD group (Figure 2), most likely because exercise is not limited by peripheral circulation in controls like it is in symptomatic patients with PAD.
The association between peripheral vascular function in the lower extremities and submaximal exercise performance in controls without PAD is not well described. We have previously found that in a group of older men and women, superficial femoral artery conductance measured during plantar flexion exercise normalized for calf lean mass was positively associated with the change in walking speed from the first to last 100 meters during a 400-meter walk test. 46 This indicated that participants who slowed their walking pace during the 400-meter test due to fatigue also had lower perfusion relative to muscle mass during calf exercise. These findings were supported in a follow-up investigation, as we observed that greater stiffness of the superficial femoral artery was associated with higher perceived fatigability scores in older participants who completed a 400-meter walk test, and this association was independent of age, sex, body mass index, fasting blood glucose, systolic blood pressure, and daily number of steps and stepping cadence. 47 Our current study extends these findings by showing that differences in perfusion in the calf microvasculature rather than the proximal macrovasculature are most clinically relevant for submaximal walking performance.
Study limitations
There are several limitations to this study. As with many clinical studies, there may have been a self-selection bias regarding study participation. Furthermore, the results of this study are only generalizable to patients with PAD, with claudication, and to older adults without PAD who have similar clinical characteristics to our control group. There are limitations associated with the cross-sectional design of the study. Significant differences found in the variables between the two groups does not provide evidence of causality, even with statistical adjustment of covariates in multivariable models. Additionally, although our analyses were adjusted for covariates, it is possible that statistically significant findings are due to confounding variables that were not measured or to residual confounding. For example, calf muscle mitochondrial activity, determined by phosphocreatine recovery time using magnetic resonance imaging, was associated with treadmill exercise time in patients with claudication. 48 We did not measure calf muscle mitochondrial activity, and therefore cannot rule out its influence on 6-minute walk distance in the current study. Despite these limitations, statistical adjustment was deemed necessary for our study design because of the difficulty in comparing subjects in the PAD group, who have a high burden of comorbidities and cardiovascular risk factors, with subjects in the control group who have a much lower burden. There is also a limitation associated with the indirect technique of venous occlusion strain-gauge plethysmography to measure calf blood flow. The hyperemia induced during the reactive hyperemia and maximal hyperemia conditions is a function of both the endothelium and vascular smooth muscle which cannot be separated from one another.
Conclusion and clinical significance
Participants with PAD and claudication had impaired maximal calf conductance and a lower 6-minute walk distance than those without PAD, and maximal calf conductance was positively and independently associated with the 6-minute walk distance within each group before and after adjusting for ABI, and for demographic, anthropometric, and comorbid variables. The clinical significance is that maximal vasodilator capacity, a measure of both large and small vessel disease, partially explains differences in ambulatory function in participants with and without PAD.
Footnotes
Declaration of conflicting interests
The authors declared no potential conflicts of interest with respect to the research, authorship, and/or publication of this article.
Funding
This research was supported by grants from the National Institute on Aging (R01-AG-24296 and R01-AG-16685) and General Clinical Research Center (M01-RR-14467) sponsored by the National Center for Research Resources.