
Abstract
Patients with diabetes mellitus (DM) are more likely to have densely calcified lesions in the below-the-knee tibial arteries. However, the relationship between peripheral arterial calcification and local skeletal muscle perfusion has not been explored. Thirty subjects were prospectively recruited into three groups in this pilot study: (1) Non-DM: 10 people without DM; (2) DM, ABI < 1.3: 10 people with DM and normal ankle–brachial index (ABI) (0.9–1.3); and (3) DM, ABI ⩾ 1.3: 10 people with DM and ABI ⩾ 1.3. All subjects underwent calf perfusion measurements at rest and during an isometric plantarflexion contraction exercise within the magnetic resonance imaging (MRI) system. The noncontrast MRI techniques were applied to quantitatively assess skeletal muscle blood flow (SMBF) and oxygen extraction fraction (SMOEF) in medial gastrocnemius and soleus muscles. Both SMBF and SMOEF reserves were calculated as the ratio of the exercise value to the resting value. Exercise SMBF and SMOEF values in the medial gastrocnemius muscle were lower in the two DM groups than in the non-DM group (p < 0.05). The SMBF reserve in medial gastrocnemius was significantly lower in the DM, ABI ⩾ 1.3 group compared to the DM, ABI < 1.3 group (p < 0.05). This study demonstrates that people with DM and calcified arteries had lower perfusion in gastrocnemius muscle compared to those without DM and those with DM and a normal ABI.
Keywords
Introduction
Patients with diabetes mellitus (DM) develop peripheral artery diseases (PAD) that may be different both in location and in severity of associated complications compared to patients without DM.1,2 Whereas patients with risk factors such as smoking more often present with more proximal PAD affecting the aorto-iliac-femoral arterial system, 3 patients with DM are more likely to have below-the-knee (BTK) tibial PAD. In addition, DM is more likely to be associated with densely calcified recalcitrant atherosclerotic lesions that make conventional methods of revascularization more technically challenging with lower success rates.4,5 Compared to patients with no or mild peripheral calcification, patients with severe peripheral artery calcification had significantly higher rates of amputation, cardiac mortality, and significant morbidity and disability.6–9
Calcification develops in arterial intima and media via crystallization of calcium and phosphate in the tissue. While the intimal calcification leads to luminal stenosis, media calcification increases arterial stiffness and frequently occurs with aging and chronic DM. Decreased arterial compliance reduces surrounding tissue perfusion – with tissue perfusion acting as a surrogate marker of the severity of calcific disease. 10 It is widely recognized that in individuals with DM and a high burden of calcification in BTK tibial arteries, there is a higher risk of peripheral wound development, digit and foot tissue loss, and a significantly higher risk of major lower extremity amputation. 11 It is unclear whether tibial artery calcification leads to local skeletal muscle perfusion deficits that increase the risk of disease morbidity.12,13
The common clinical screening tool for the detection of PAD is noninvasive measurements with the ankle–brachial index (ABI). The normal ABI range is considered to be 0.9–1.3. 14 Extremities with calcified tibial arteries can have abnormally elevated ABI values that are ⩾ 1.3 due to ineffective arterial compression during ankle arterial pressure assessments. While ABI measurements are sensitive and cost-effective for screening for disease in the macrocirculation, it cannot be used for the direct assessment of the microcirculation, nor estimate the burden of calcific disease in the tibial arteries. Similarly, cross-sectional angiography techniques with computerized tomographic angiography (CTA) can provide blooming artifact when there is severe artery calcification that results in overestimation of luminal arterial stenosis. 15
We recently demonstrated the feasibility of noncontrast magnetic resonance (MR) perfusion techniques to quantitatively evaluate skeletal muscle microcirculation – specifically skeletal muscle blood flow (SMBF) and oxygen extraction fraction (SMOEF) in vivo.16,17 The purpose of this study was to investigate whether individuals with DM and abnormally high ABI values will have lower skeletal muscle microcirculation during a moderate isometric exercise compared to individuals with DM and normal ABI values, as well as individuals without DM.
Materials and methods
Subjects
This study protocol was approved by the Human Research Protection Office of the Washington University School of Medicine and all subjects provided written informed consent prior to participation. An ABI between 0.91 and 1.3 was considered as the normal range, 14 and an ABI ⩾ 1.3 indicated noncompressible arteries due to artery calcification. To determine the effects of noncompressible peripheral arteries on calf SMBF and SMOEF in DM, three groups of subjects were recruited: (1) 10 subjects with DM and ABI ⩾ 1.3 (DM, ABI ⩾ 1.3); (2) 10 subjects with DM and an ABI between 0.91 and 1.3 (DM, ABI < 1.3); and (3) 10 subjects without DM and an ABI between 0.91 and 1.3 (non-DM), for a total of 30 subjects. All three groups were matched by age, sex, and body mass index (BMI). We chose an ABI cutoff value of 1.3 to indicate presence of noncompressible arteries for subjects with diabetes based on the guidelines established by the global vascular guidelines on the management of chronic limb-threatening ischemia. 18
The inclusion criteria were: all subjects were at least 18 years old; the non-DM group had no symptomatology or documented evidence of any cardiovascular and/or musculoskeletal diseases; both DM groups had Type 2 DM, with no history of, or clinically documented PAD. Some of the subjects in both DM groups had one plantar ulcer within the last 6 months prior to magnetic resonance imaging (MRI) scans. Exclusion criteria were: incidence of rest pain; contraindication to MR scanning (intracranial vascular clips, pacemaker or intraocular metal); pregnancy; and comorbidities that severely limited the patient’s ability to perform a modest calf-contraction test.
MRI perfusion and oxygenation measurements
Calf SMBF was measured using a noncontrast arterial spin labeling (ASL) sequence without injecting any contrast agent.19,20 The sequence parameters were: two-dimensional single-shot, gradient-echo acquisition, TR/TE = 5.3 ms/2.5 ms; fat saturation; flip angle = 5°; field of view (FOV) = 200 × 150 mm2; matrix = 128 × 96; single-slice acquisition, slice thickness = 8 mm; average number = 8; total acquisition time = 2 min 30 sec.
Calf SMOEF was measured with another noncontrast MR technique derived from a model to measure tissue OEF with the magnetic susceptibility effect of deoxyhemoglobin.21–23 A single-slice, two-dimensional, triple-echo, asymmetric spin-echo sequence was employed to acquire images with TE1/TE2/TE3 = 44/79.6/114.8 ms. Other imaging parameters included: TR = 4 sec; fat saturation; FOV = 200 × 150 mm2; matrix size = 64 × 48 and interpolated to 128 × 96; slice thickness = 8 mm; average number = 1; total acquisition time = 3 min 48 sec. Previous results of SMOEF in healthy volunteers agreed well with findings in published studies that used positron emission tomography (PET) techniques. 24
All imaging sessions were performed on a 3T TRIO or PRISMA Siemens whole-body MR system (Siemens Healthcare, Malvern, PA, USA). A commercial flexible surface coil (receive-only) was used for calf imaging. The subjects were instructed not to consume alcohol or perform any moderate to heavy exercise within 24 hours prior to their imaging sessions. A custom-made ergometer was used for the isometric plantarflexion contraction, as previously described.16,17
All data were obtained from one slice centered on the widest part of the calf. The subjects were instructed to push against the foot pedal, plantarflexing the ankle to the preset 30° stop. The subjects held the position for 5 minutes. The resistance of the pedal was set to 10 psi to allow all participants to hold the contraction for the duration of the scan and to perform the exercise without complaints of pain. Subjects were given a 5-minute rest between two consecutive exercises for separate measurements of exercise SMOEF and SMBF. Both SMBF and SMOEF were also measured at rest.
ABI/TBI tests and clinical peripheral neuropathy
All subjects completed ABI and toe–brachial index (TBI) tests with ankle and digit systolic pressure measurements. Peripheral neuropathy (PN) was assessed using a 5.07 Semmes-Weinstein monofilament and a biothesiometer to quantify the vibration perception threshold using previously validated methods.25–27 The Michigan Neuropathy Screening Instrument was also completed to characterize the severity of PN.28,29 This is a lower extremity physical exam that assesses foot deformity, sensation, and ankle reflexes. A composite score ⩾ 2 indicates the presence of distal symmetrical peripheral neuropathy.23,24
Image analysis
The source images from both SMBF and SMOEF measurements were processed using custom software written in Matlab (R2018b release; The MathWorks, Natick, MA, USA) to create SMBF and SMOEF maps, respectively. An analyst with 2 years of MRI experience first drew two regions-of-interest (ROIs) around the soleus (SOL) and medial gastrocnemius (MG) muscle on one source image. The ROIs were then copied to both SMBF and SMOEF maps with manual adjustment of ROI locations if there were apparent shifts between rest and exercise maps. The mean values of the ROIs were used for SMBF and SMOEF data. The SMBF and SMOEF reserves were calculated as the ratio of exercise/rest from the ROI data.
Statistical analysis
Analyses were first performed to assess differences in all MRI variables among the three groups of subjects (Non-DM, DM, ABI < 1.3, and DM, ABI ⩾ 1.3) in two major muscles (MG and SOL) at rest and during exercise. Data were expressed as mean ± SD. Differences among groups for non-MRI continuous variables (age, BMI, ABI, TBI, HbA1c) were assessed with a one-way analysis of variance (ANOVA) with the Tukey method adjusting p-values for multiple comparisons. To compare MRI variables among three groups, comparisons were performed using multiple linear regression models, again with the Tukey method, adjusting p-values for multiple comparisons. Additional assessments were performed with pre-specified tests for differences in MRI variables between two DM groups. Contingency table analysis was used to compare categorical variables – gender, smoking, PN, and ulcer – among three groups.
We used regression/correlation analysis to assess associations between MRI values and values for clinical variables using combined data of the three groups. We reported only those correlations that passed our significance threshold or were clinically important.
All statistical analyses were performed with SAS software (version 14.2, SAS Institute, Inc., Cary, NC, USA), and MedCalc Statistics for Biomedical Research (MedCalc Software, Mariakerke, Belgium). A p-value less than 0.05 was considered statistically significant.
Results
The subject demographic information is given in Table 1. The majority of subjects in the two DM groups had PN and a history of foot ulcers. There was no significant difference in TBI, HbA1c, smoking history, PN, and foot ulcers between the two DM groups (Table 1).
Subject characteristics.
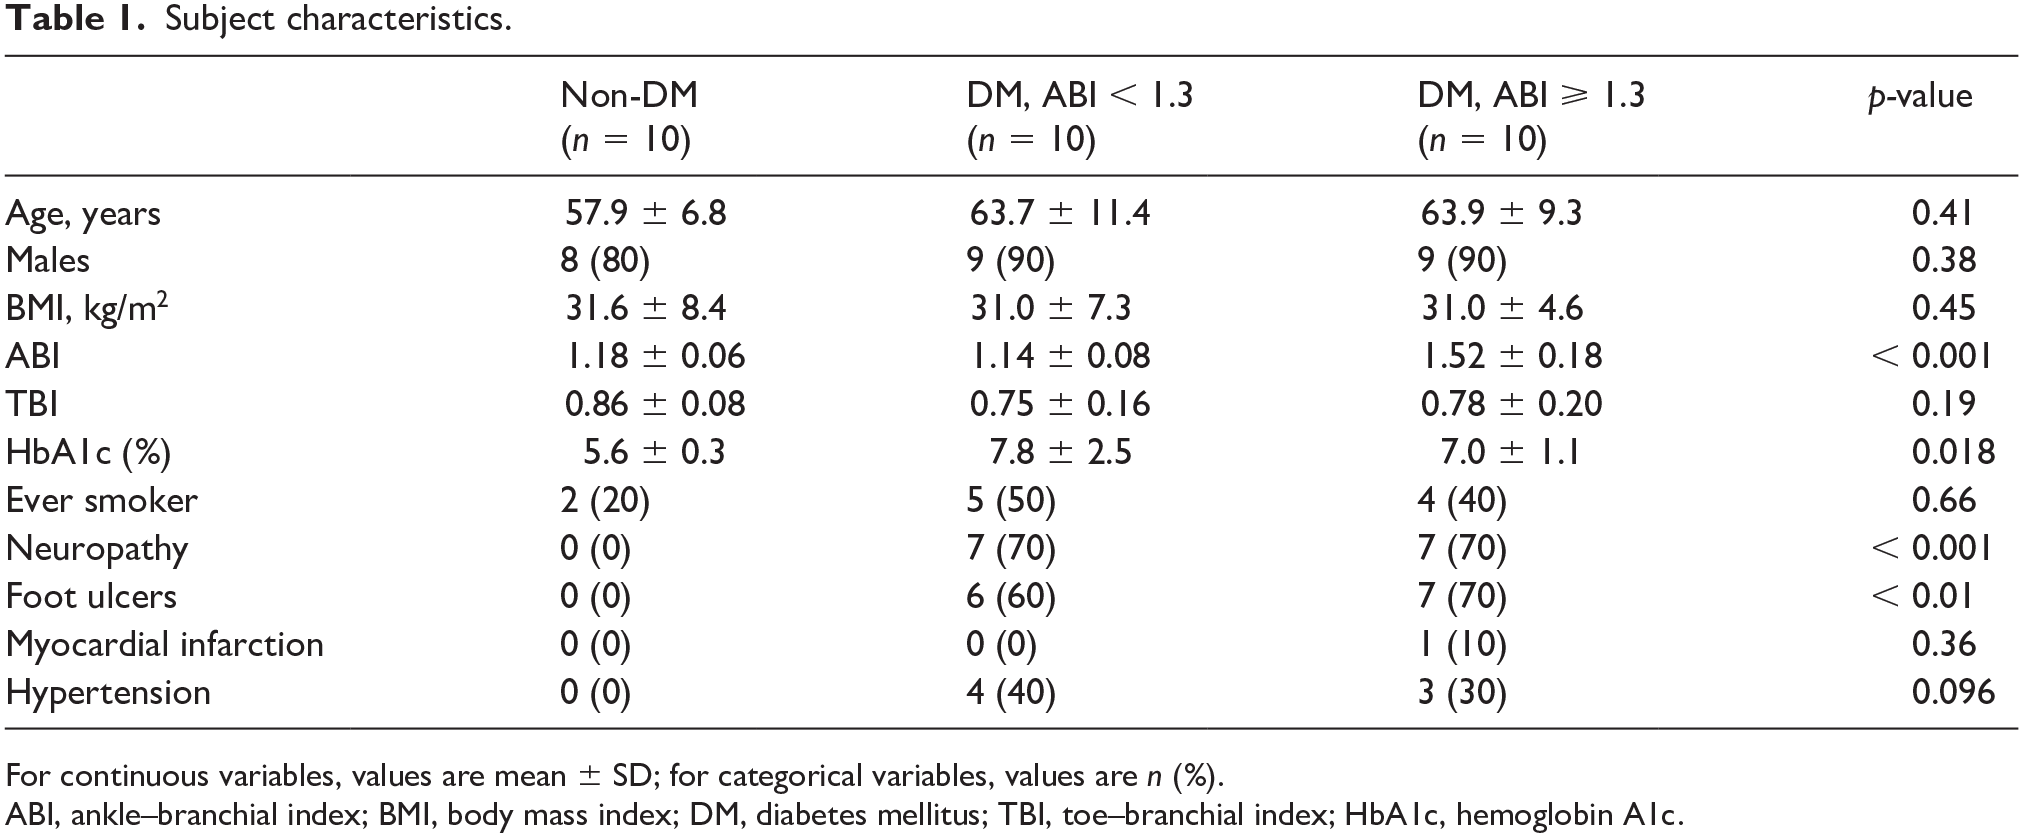
For continuous variables, values are mean ± SD; for categorical variables, values are n (%).
ABI, ankle–branchial index; BMI, body mass index; DM, diabetes mellitus; TBI, toe–branchial index; HbA1c, hemoglobin A1c.
Comparison of skeletal muscle blood flow (SMBF) and oxygen extraction fraction (SMOEF) among the three subject groups
There were significant differences in exercise SMBF in MG, SMBF reserve in MG, and SMOEF reserves in both MG and SOL among three groups (Table 2). All exercise SMBF, SMOEF, and their reserve values were lower in both DM groups than those in the non-DM group. Figure 1 shows the examples of SMBF and SMOEF maps in subjects from all three groups. For the comparison between two DM groups, exercise SMBF and SMBF reserve were all lower in the DM, ABI ⩾ 1.3 group. In particular, the SMBF reserve in MG was significantly lower in the DM, ABI ⩾ 1.3 group than in the DM, ABI < 1.3 group (p = 0.02). This difference remained significant after the adjustment for smoking, PN, and foot ulcers (p = 0.03). No differences were observed for all SMOEF indexes between the two DM groups.
Assessments of differences in MRI measurements (SMBF, SMOEF) among Non-DM and DM groups for calf muscles (MG, SOL).
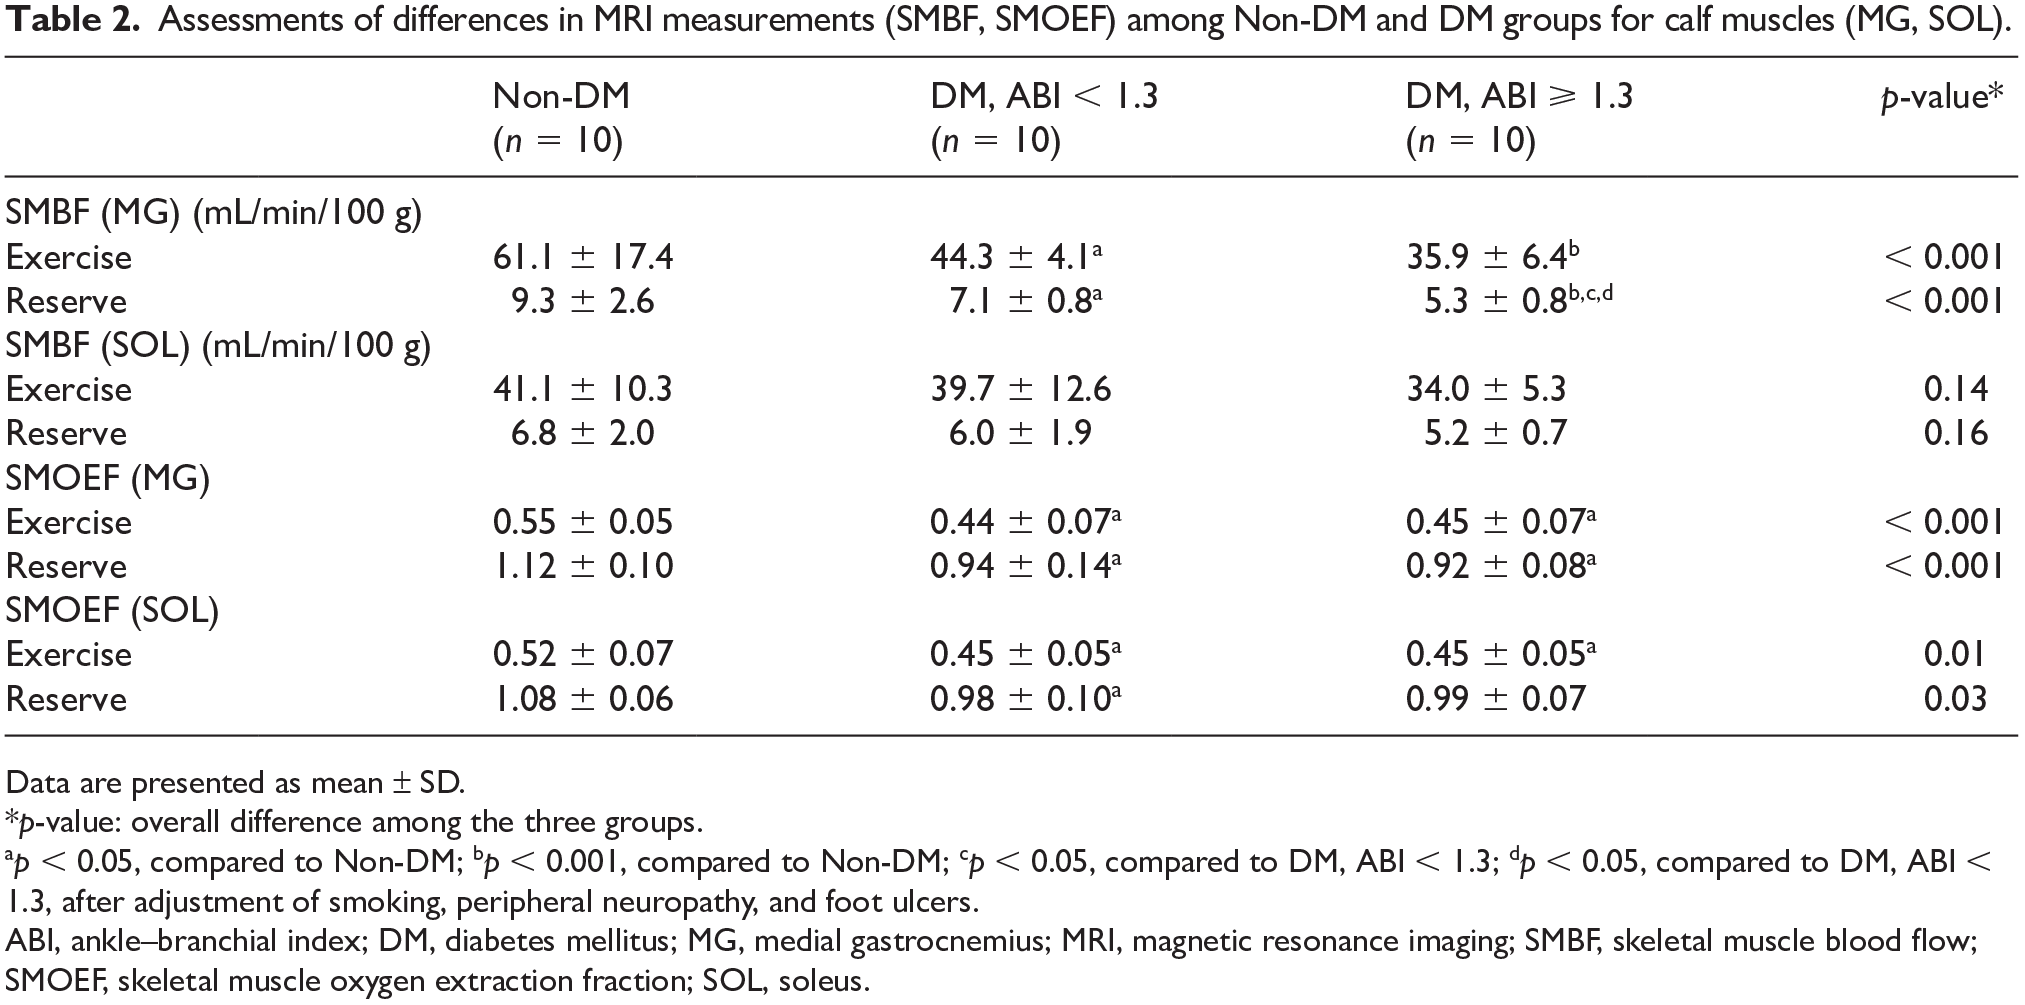
Data are presented as mean ± SD.
p-value: overall difference among the three groups.
p < 0.05, compared to Non-DM; bp < 0.001, compared to Non-DM; cp < 0.05, compared to DM, ABI < 1.3; dp < 0.05, compared to DM, ABI < 1.3, after adjustment of smoking, peripheral neuropathy, and foot ulcers.
ABI, ankle–branchial index; DM, diabetes mellitus; MG, medial gastrocnemius; MRI, magnetic resonance imaging; SMBF, skeletal muscle blood flow; SMOEF, skeletal muscle oxygen extraction fraction; SOL, soleus.
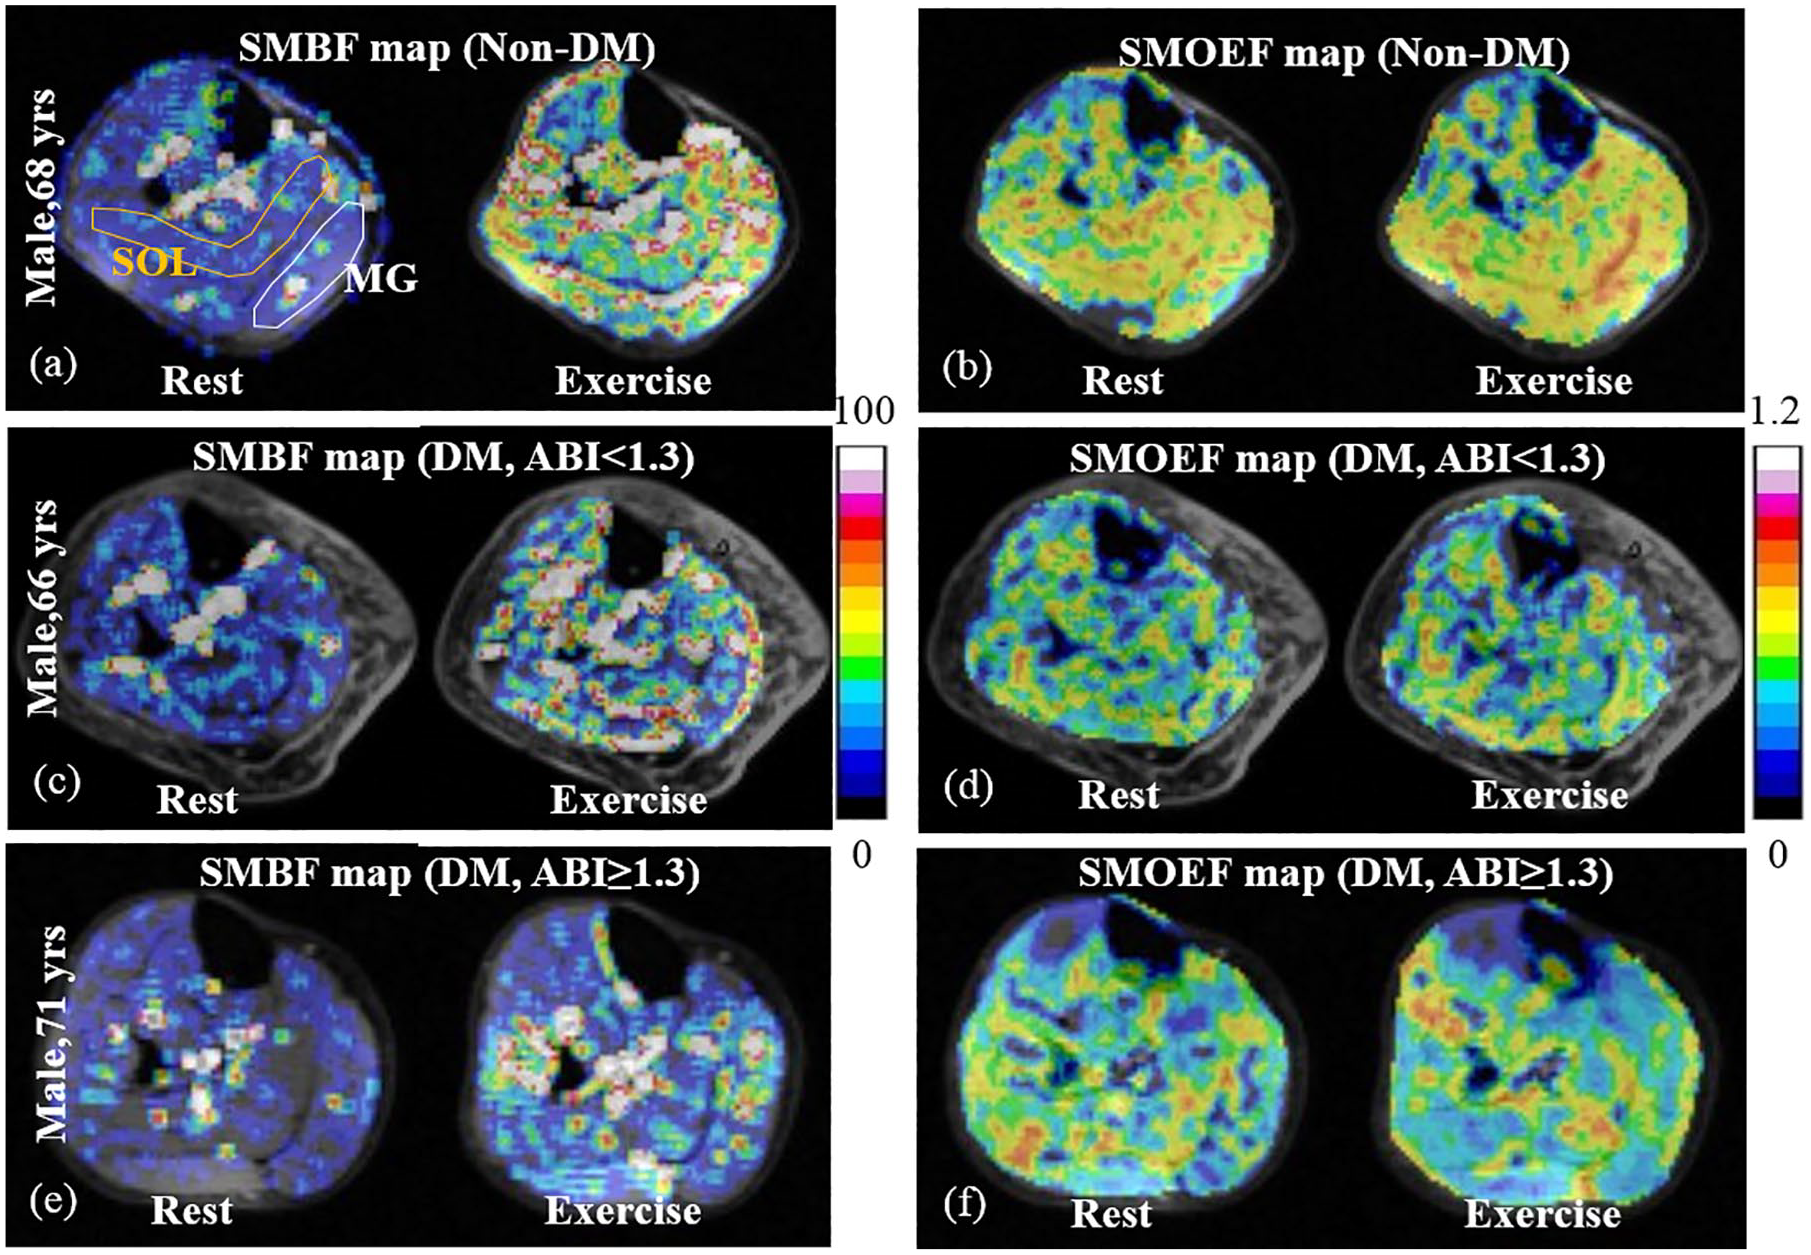
Typical examples of SMBF and SMOEF maps in the calf of individuals from three groups: Non-DM (a, b); DM, ABI < 1.3 (c, d); DM, ABI ⩾ 1.3 (e, f). The maps show the absolute values of SMBF (mL/min/100 g) and SMOEF (no unit) at rest and during the isometric exercise. The region-of-interest in MG and SOL muscles is shown in (a).
Correlations between MRI measurement values and ABI
Table 3 shows correlations between various MRI measurement data and ABI. The exercise SMBF in both MG and SOL was moderately and negatively correlated with ABI (ρ = −0.53 for MG and –0.4 for SOL). This correlation was even stronger for the SMBF reserve in the MG (ρ = −0.62), but not in SOL. There were no significant correlations with TBI.
Spearman’s rank correlation coefficients (ρ) of MRI measurements (SMBF) in different calf muscles (MG, SOL) with ABI for all 30 subjects.
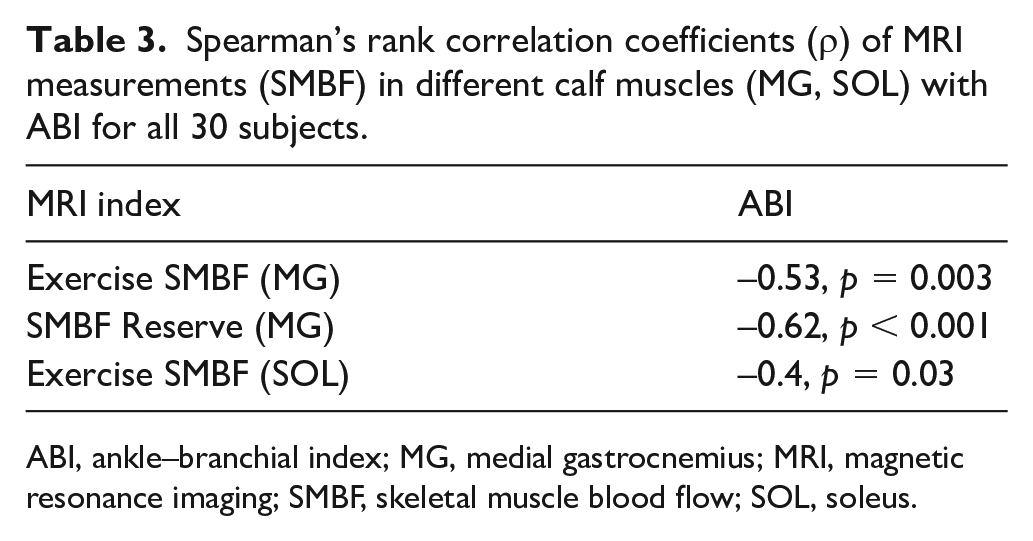
ABI, ankle–branchial index; MG, medial gastrocnemius; MRI, magnetic resonance imaging; SMBF, skeletal muscle blood flow; SOL, soleus.
Discussion
This study provides the first evidence demonstrating the potential impact of noncompressible calcified tibial arteries (as demonstrated on conventional ABI measurements) on the severity of local skeletal muscle microcirculation in the setting of DM. Subjects with DM and noncompressible peripheral arteries (ABI ⩾ 1.3) had a significantly lower SMBF reserve in MG muscle than subjects with DM and normal ABI (ABI between 0.91 and 1.3), even after adjustment for smoking history, peripheral neuropathy, and incidence of foot ulcers. Microcirculation was also lower in those with DM with normal ABI compared to non-DM subjects. Together these findings support the need for more accurate diagnostic tests, risk stratification, and therapeutic interventions to identify individuals with DM who are at higher risk for limb amputation and disease morbidity.
Several reports indicate that patients with lower extremity artery calcification typically have increased cardiovascular morbidity and mortality.30–32 However, there is a paucity of literature addressing the changes in microcirculation in lower extremity skeletal muscle tissue in the setting of tibial artery calcification. A prior study observed increased arterial stiffness and reduced blood flow volume in the lower extremities of individuals with chronic DM. 33 In a recent retrospective review of patients with symptomatic PAD, Rutherford ischemia category strongly correlated with peripheral artery calcification score and DM severity. 34 We build on these prior observations and demonstrate a direct link between poor tissue perfusion (SMBF) in calf skeletal muscles of individuals with DM and abnormally elevated ABI. Ongoing studies are evaluating whether MR microperfusion measurements in skeletal muscle correlate with other perfusion techniques, such as with the use of contrast-enhanced ultrasound or PET.
There are a few studies that previously evaluated the correlation of peripheral limb tissue perfusion and ABI in patients with PAD. Contrast-enhanced ultrasound and MRI ASL technique demonstrated that hyperemic calf blood flow tended to correlate with the ABI level when the ABI in patients is less than 0.9.35,36 Our study took a different approach, and evaluated lower leg perfusion in individuals without outflow obstruction (near normal TBI), yet had evidence of tibial artery calcification (ABI ⩾ 1.3). In this unique patient population, we deduced that tibial artery calcification was the main culprit for ABI ⩾ 1.3 since BMI was relatively normal in this cohort, and by itself could not account for the abnormally elevated ABI. Additionally, we used ABI ⩾ 1.3 as an inclusion cutoff since prior studies have also suggested that patients with ABIs in this range have evidence of tibial artery calcification on angiography.37,38 By evaluating exercise SMBF in MG and soleus muscle groups, we are the first to report that patients with ABI ⩾ 1.3 demonstrate a notable decrease in lower skeletal muscle perfusion than patients with ABI < 1.3. The mechanism for this observation is yet to be elucidated, but one potential explanation is that patients with tibial artery calcification may also have subclinical underlying microvascular disease that in turn leads to altered calf skeletal muscle perfusion. 39 Another potential explanation is that medium and small arterioles may have reduced capacitance (exercise-induced vasodilation) in the setting of rigid microvascular structures from calcification deposition in the tunica media.40,41 Histomorphic studies of medium or small size arterioles from amputated digits or lower limb segments in patients with non-healing wounds may in the future provide additional information on this topic.
In this pilot study, there were a few individuals with foot ulcers in both DM groups. We excluded PAD in these individuals based on the individual’s ABI, TBI, and history or clinical documents. We did not assume the presence of a foot ulcer indicates vascular impairments. The etiology of the foot ulcers in people with DM and insensate feet can be the result of minor trauma in the presence of sensory neuropathy.42,43
Study limitations
There are a few limitations in this study. The number of prospectively recruited individuals was limited to 10 for each group, which may have introduced unintended confounding variables. To alleviate this problem, we performed our analyses by using matched patients according to age, sex, and BMI. However, in this way, the majority of patients were male, which underscores the need for assessing sex differences in future larger sample-size studies. It is also noted that the non-DM group tended to be younger, although there was no statistical difference in age between the non-DM group and either groups with individuals with diabetes. Another limitation is that the isometric exercise strength was not standardized based on the maximal voluntary contraction (MVC) of individuals. Given the same exercise torque for all groups, a higher %MVC in the DM groups may be achieved compared with the non-DM group.44,45 Physiologically, working at a higher %MVC should result in larger exercise SMBF and SMOEF; however, the disease groups had lower exercise SMBF and SMOEF. Therefore, the difference between groups may be underestimated. Data in this study highlights a potentially more adverse impact of DM and abnormally elevated ABI in local tissue microcirculation once exercise strength is adjusted to a fixed %MVC in future studies. Finally, patients with rest pain may have difficulty performing the submaximal isometric contraction exercise. This is a limitation for this approach that needs to be explored. Other strategies, such as thigh-cuff occlusion, should be examined for the perfusion provocative test in this patient population. 46
In conclusion, the microcirculation measurements demonstrated feasibility for comprehensive assessment of individuals with DM and/or tibial arterial disease. Increased arterial stiffness appears to reduce downstream skeletal muscle microcirculation, even without evidence of arterial stenosis. These results may have therapeutic implications for novel targeted treatments on calcified arteries to reduce the risk of lower extremity amputations.
Footnotes
Acknowledgements
The authors would like to thank Ashley Burgess, Darrah Snozek, and Katherine Love (Washington University School of Medicine, St. Louis, MO) for coordinating the recruitment of participants.
Declaration of conflicting interests
The authors declared no potential conflicts of interest with respect to the research, authorship, and/or publication of this article.
Funding
This study was supported in part by research grants from the National Institutes of Health (R21AR065672, R01DK105322, K08HL132060, and R03EB028415).