
Abstract
The object of this study was to compare the prognostic value of different methods of ankle–brachial index (ABI) calculation. From April 1998 to September 2008, we calculated the ABI in 1223 patients before coronary artery bypass grafting. The ABI was calculated according to five different calculation modes of the numerator. The patients were classified into three groups: clinical peripheral artery disease (PAD), subclinical PAD if no clinical history but abnormal ABI (< 0.90 or > 1.40), and no PAD. The primary outcome was total mortality. During a follow-up of 7.6 years (0.1–15.9), 406 patients (33%) died. The prevalence of the subclinical PAD varied from 22% to 29% according to the different modes of ABI calculation. Areas under the ROC curve to predict mortality according to different calculation modes varied from 0.608 ± 0.020 to 0.625 ± 0.020 without significant differences. The optimal ABI threshold to predict mortality varied for every method, ranging from 0.87 to 0.95. In multivariate models, ABI was significantly and independently associated with total mortality (hazard ratio (HR) = 1.46, 95% CI: 1.15–1.85, p = 0.002); however, this association was not significantly different between the various methods (HRs varying from 1.46 to 1.67). The use of the optimal ABI threshold for each calculation mode (rather than standard 0.90) allowed a slight improvement of the model. In conclusion, the ABI prognostic value to predict mortality is independent from its method of calculation. The use of different optimal thresholds for each method enables a comparable prognosis value.
Introduction
The burden of peripheral artery disease (PAD) is related to its high prevalence, as well as its functional consequences affecting quality of life, and an increased risk of cardiovascular events. Its prevalence is high in Western countries, reaching 15–20% in elderly patients > 70 years old.1,2 PAD is a well-known marker of risk of increased mortality and cardiovascular-related events, 3 both in asymptomatic patients and in those with symptoms. 4 Moreover, when associated to coronary artery disease (CAD), PAD is a marker of poorer prognosis in these patients. 5
The ankle–brachial index (ABI) is an easy, validated, 6 reproducible, 7 and low-cost method to assess the presence of PAD, and is in parallel considered as one of the most accessible vascular markers to stratify patients’ risk, both in primary and in secondary prevention. According to the 2012 American Heart Association (AHA) statement, 8 the ABI of each leg should be calculated by dividing the highest systolic blood pressure (BP) between posterior tibial (PT) artery and dorsalis pedis (DP) artery, by the highest brachial systolic BP between the two arms.
More recently, this standard mode of calculation has been challenged by two studies suggesting that this method underestimates the prevalence of PAD and may conceal high-risk patients who could only have a single ankle artery affected. By opposition, the use of the lowest ankle systolic BP in calculating ABI could be more sensitive in unmasking such patients and identifying them also as high risk for future cardiovascular events.9,10 However, these studies used the same threshold of 0.90 to define PAD, even with the alternate method, whereas different thresholds for different modes of calculation could also vary the sensitivity and specificity of the test (i.e. increasing the cut-off above 0.90 for the standard ABI method would lead to also detecting a higher number of borderline cases who would have been picked up by the 0.90 cut-off using the alternate method). Whether a specific cut-off for each calculation method would lead to similar prognostic values has not yet been addressed.
Hence, the objective of this study was to assess and compare the prognostic value of various methods of ABI calculation. Because we have previously demonstrated that the ABI (with standard calculation) was prognostic in patients undergoing coronary artery bypass grafting (CABG), 11 we focused the ability of the ABI to predict events with alternate modes of calculation in the same setting. We hypothesized that (1) the intrinsic prognostic value of the ABI is independent of its mode of calculation and (2) different optimal thresholds are necessary for different modes of calculation in order to have similar prognostic values.
Methods
From April 1998 to September 2008, 1262 consecutive patients who were admitted to our institution to receive CABG were enrolled. Patients with concomitant valvular heart surgery or urgent surgery precluding ABI measurement were not included. For the remaining patients, ABI was measured in the vascular exploratory laboratory the day before operation.
Baseline data
The baseline risk factors, comorbidities, and treatments were collected at time of surgery. Patients were considered to be tobacco smokers if they were active smokers at baseline, or had stopped within the previous 2 years. Diabetes was defined by a fasting blood glucose > 7.8 mmol/L at admission or the use of any oral antidiabetic agent and/or insulin. Hyperlipidemia was defined according to the documented patient’s history and/or a fasting blood cholesterol > 240 mg/dL at admission. Patients were considered hypertensive if they took any antihypertensive drug for this purpose and/or if their average systolic or diastolic BP exceeded, respectively, 140 or 90 mmHg during the first two blood pressure measurements after admission. The following comorbidities were also noted: heart failure defined according to the documented medical history and/or the presence of New York Heart Association functional class III or IV; atrial fibrillation and flutter were identified from ECG; chronic obstructive pulmonary disease (COPD) was noted according to medical history; chronic kidney disease (CKD) was defined in cases of end-stage renal disease with dialysis or a glomerular filtration rate > 60 mL/min/1.73 m2 calculated according to the Modification of Diet in Renal Disease formula; finally, clinical PAD was defined as the presence of intermittent claudication and/or previous lower limb revascularization.
Among baseline therapies, the use of beta-blockers, statins, angiotensin-converting enzyme (ACE) inhibitors or angiotensin II receptor blockers (ARBs) were considered at discharge.
Operative data included the status of revascularization (i.e. complete or not), the use of on- or off-pump CABG and, in the case of on-pump CABG, the cardiopulmonary bypass time and aortic cross-clamp time.
ABI measurement
At the time of the study the ABI measurement was part of the work up of patients undergoing CABG. The systolic BP was obtained using a pneumatic cuff and Doppler measurement at the brachial, dorsalis pedis and posterior tibial arteries (left and right). The ABI was then derived from these measured BPs and calculated for each leg using various methods (Figure 1) resulting from a combination of five numerators (ankle pressure). Only the lowest ABI between the left and right legs was considered.
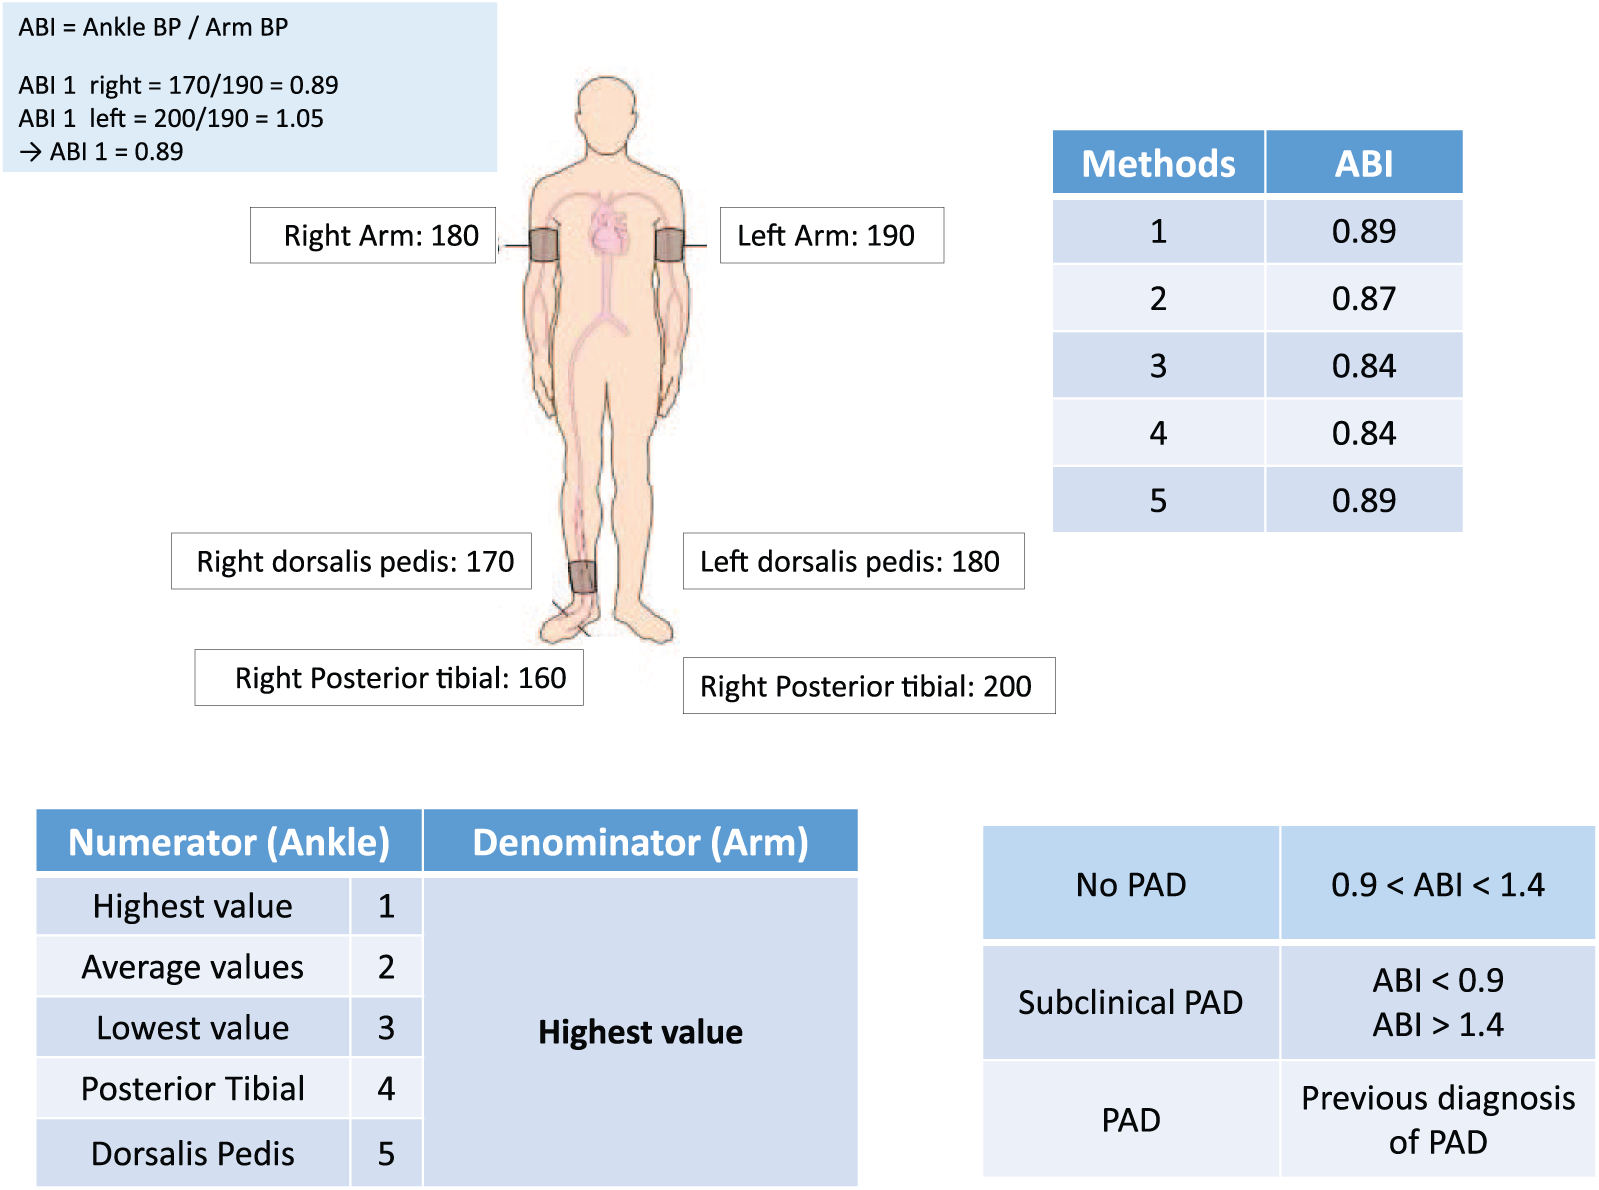
Different modes of ABI calculation with one example.
Numerator (ankle)
The following five methods (from 1 to 5) were used to derive systolic ankle BP:
Highest value between PT and DP arteries
Average of PT and DP
Lowest pressure between PT and DP
PT artery only
DP artery only.
Regarding the denominator, the highest systolic BP between the two arms was used as the denominator. As a result, five ABI calculations were used and named according to methods 1, 2, 3, 4 and 5.
The population was classified into three groups:
Clinical PAD, when previous PAD was diagnosed
Subclinical PAD, when the ABI was < 0.90 or > 1.40
No PAD.
In order to simplify data presentation, the referent ABI used to assess the presence of subclinical PAD was method 1 (standard method).
Follow-up and outcome
The follow-up was available in 1223 patients (97%). Patients’ medical charts were systematically reviewed up to October 2014, extending the initial follow-up previously reported, 11 and the follow-up was completed by telephone contact with family physicians when necessary.
The reported events were all-cause death, acute coronary syndrome, stroke or transient ischemic attack, percutaneous coronary intervention or redo of CABG or peripheral surgery.
The primary outcome was all-cause death. The secondary outcome was the combination of the end points reported above.
Statistical analysis
Data are reported as mean (± SD) and number (percentage) for continuous and categorical variables, respectively. Quantitative data were compared between groups using chi-squared test and qualitative data were compared using one-way ANOVA. The prognostic value of each ABI was tested using receiver operating characteristic (ROC) curves analysis and the area under the curve (AUC) was reported. In addition, the optimal cut-off of ABI was derived from ROC curves analysis and then tested to assess the presence of subclinical PAD.
Overall survival was calculated from baseline (i.e. surgery) to the date of last follow-up available or until the date of death. The cumulative probability of death or event-free survival was estimated by the Kaplan–Meier method. The survival between groups was compared for statistical significance using the log-rank test. The multivariate Cox proportional hazard model was used to assess the prediction of death or cardiac event occurrence. Clinical variables with a univariate p-value < 0.25 were considered for subsequent multivariate models and a referent clinical multivariate model was built. Subclinical PAD, as assessed using ABI derived from each method of calculation, was then added to the referent clinical multivariate model in order to test the incremental prognostic value of ABI over clinical variables. In these models, subclinical PAD was defined according to each method of ABI calculation and using the standard cut-off of ABI (i.e. < 0.90) but also using the optimal cut-off derived from ROC curves analysis. The predictive values of the clinical multivariate models, and of models including the variables ‘subclinical PAD’, obtained by each method of ABI calculation and using standard and optimal cut-off, were tested using ROC curves analysis, and the C-statistic and chi-squared values of the models were reported. Hazard ratios (HR) with corresponding 95% CIs were also reported. A p-value < 0.05 was considered as significant. All statistical analyses were performed with a commercially available software package SPSS Version 18.0 (SPSS Inc., Chicago, IL, USA).
Results
Among the 1223 patients included (66.5 ± 9.6 years old, 83% male), 194 (16%) presented clinical PAD and 271 (22%) subclinical PAD (i.e. according to ABI obtained from method 1). The comparisons between the three groups in terms of demographic and clinical data, risk factors, comorbidities, and medication are provided in Table 1. As compared to patients without PAD, those with clinical PAD were significantly older, with lower left ventricular ejection fraction, and higher rates of smoking, diabetes, COPD, stroke, and left main artery disease. They also received beta-blockers most frequently and had significant longer aortic cross-clamp time. Patients with subclinical PAD were significantly older with a higher frequency of diabetes compared to the no-PAD group.
Demographic data, risk factors, comorbidities, and medication.
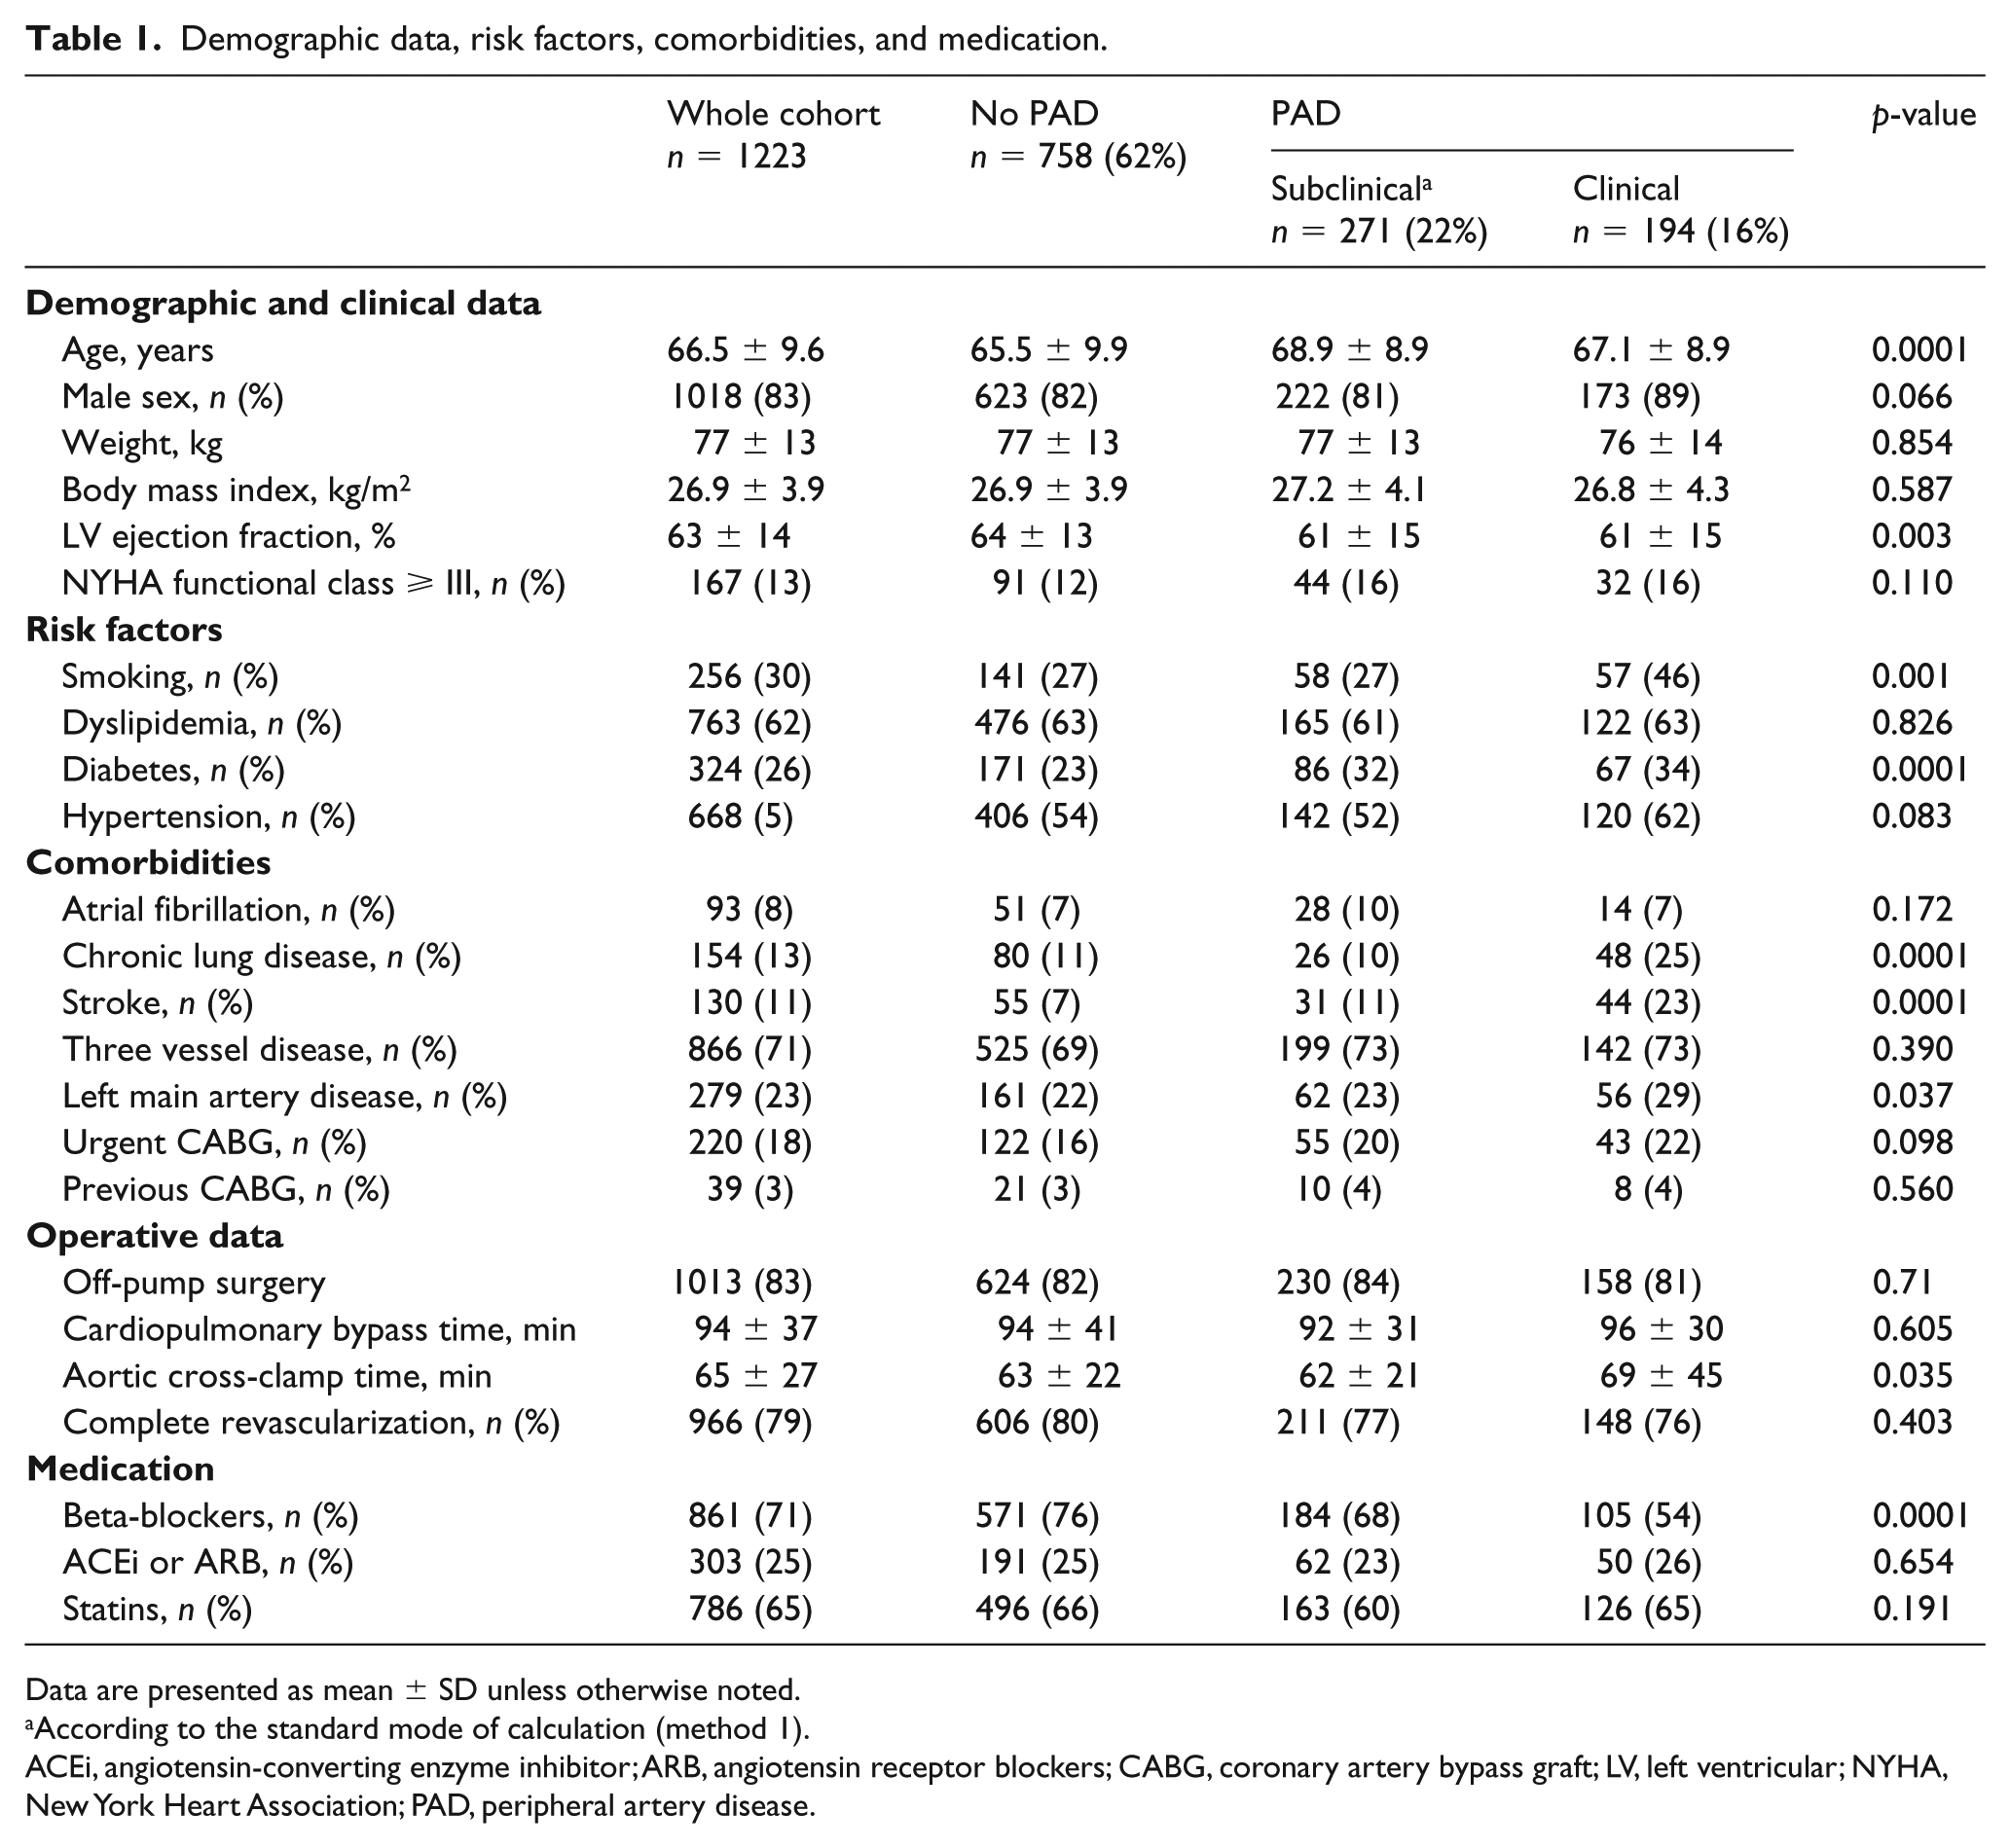
Data are presented as mean ± SD unless otherwise noted.
According to the standard mode of calculation (method 1).
ACEi, angiotensin-converting enzyme inhibitor; ARB, angiotensin receptor blockers; CABG, coronary artery bypass graft; LV, left ventricular; NYHA, New York Heart Association; PAD, peripheral artery disease.
The distributions of ankle pressure and of the ABIs according to the various modes of calculation are shown in Figure 2. Using a cut-off value of 0.90, the frequency of subclinical PAD varied from 22% (methods 1 and 4) to 29% (method 3). Of note, method 3 was the method with the highest rate of subclinical PAD and identified an additional 7% of patients with subclinical PAD compared to method 1.
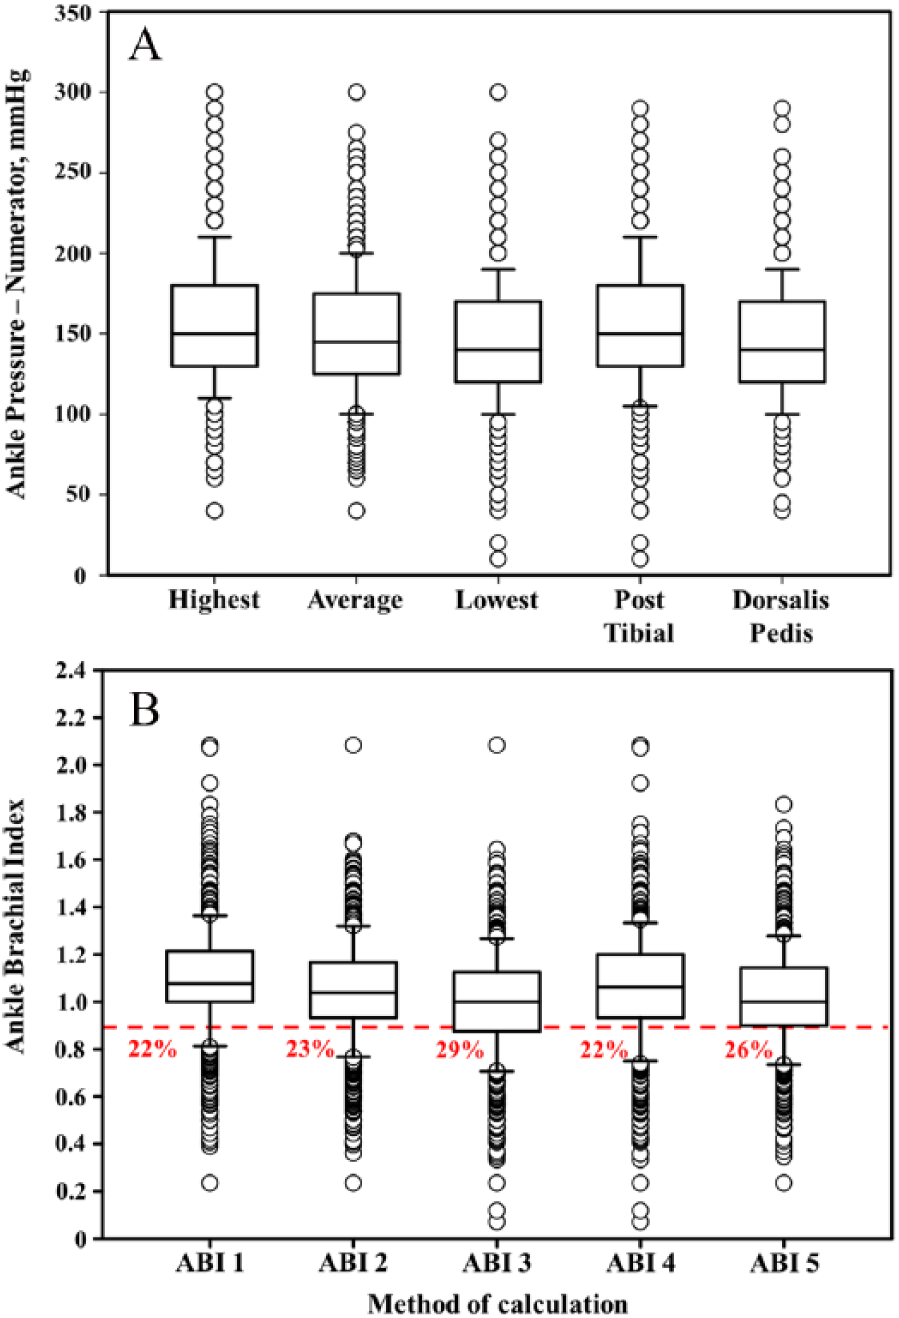
Box-plot showing the distribution of ankle pressure (A) and ABI (B) in the whole cohort according to various methods of calculation. Red line marks ABI < 0.90; percentages are the proportion of patients with ABI < 0.90.
Outcome
During a median follow-up of 7.6 years (interquartile range 5.4–13 years), 406 (33%) patients died, out of whom 172 (14%) died from cardiovascular causes. Combined cardiovascular events happened in 594 (49%) patients, with 130 (11%) acute coronary syndromes and 125 (10%) strokes or transient ischemic attacks. Also, 122 (10%) cases had myocardial revascularization and 134 (11%) underwent peripheral vascular surgery.
The crude rates of death and the combined end point were 25%, 45%, and 50% (p < 0.0001) and 41%, 59%, and 63% (p < 0.0001), respectively, in the no-PAD, subclinical PAD, and clinical PAD groups. Consistently, survival and event-free survival were significantly lower (Figure 3, A and B) in clinical PAD and in subclinical PAD groups than in the no-PAD group (survival: 10-year: 84 ± 2% vs 62.5 ± 3% vs 39 ± 4%, p < 0.0001; event-free survival: 10-year: 61.5 ± 2% vs 48 ± 3% vs 35.5 ± 4%, p < 0.0001).
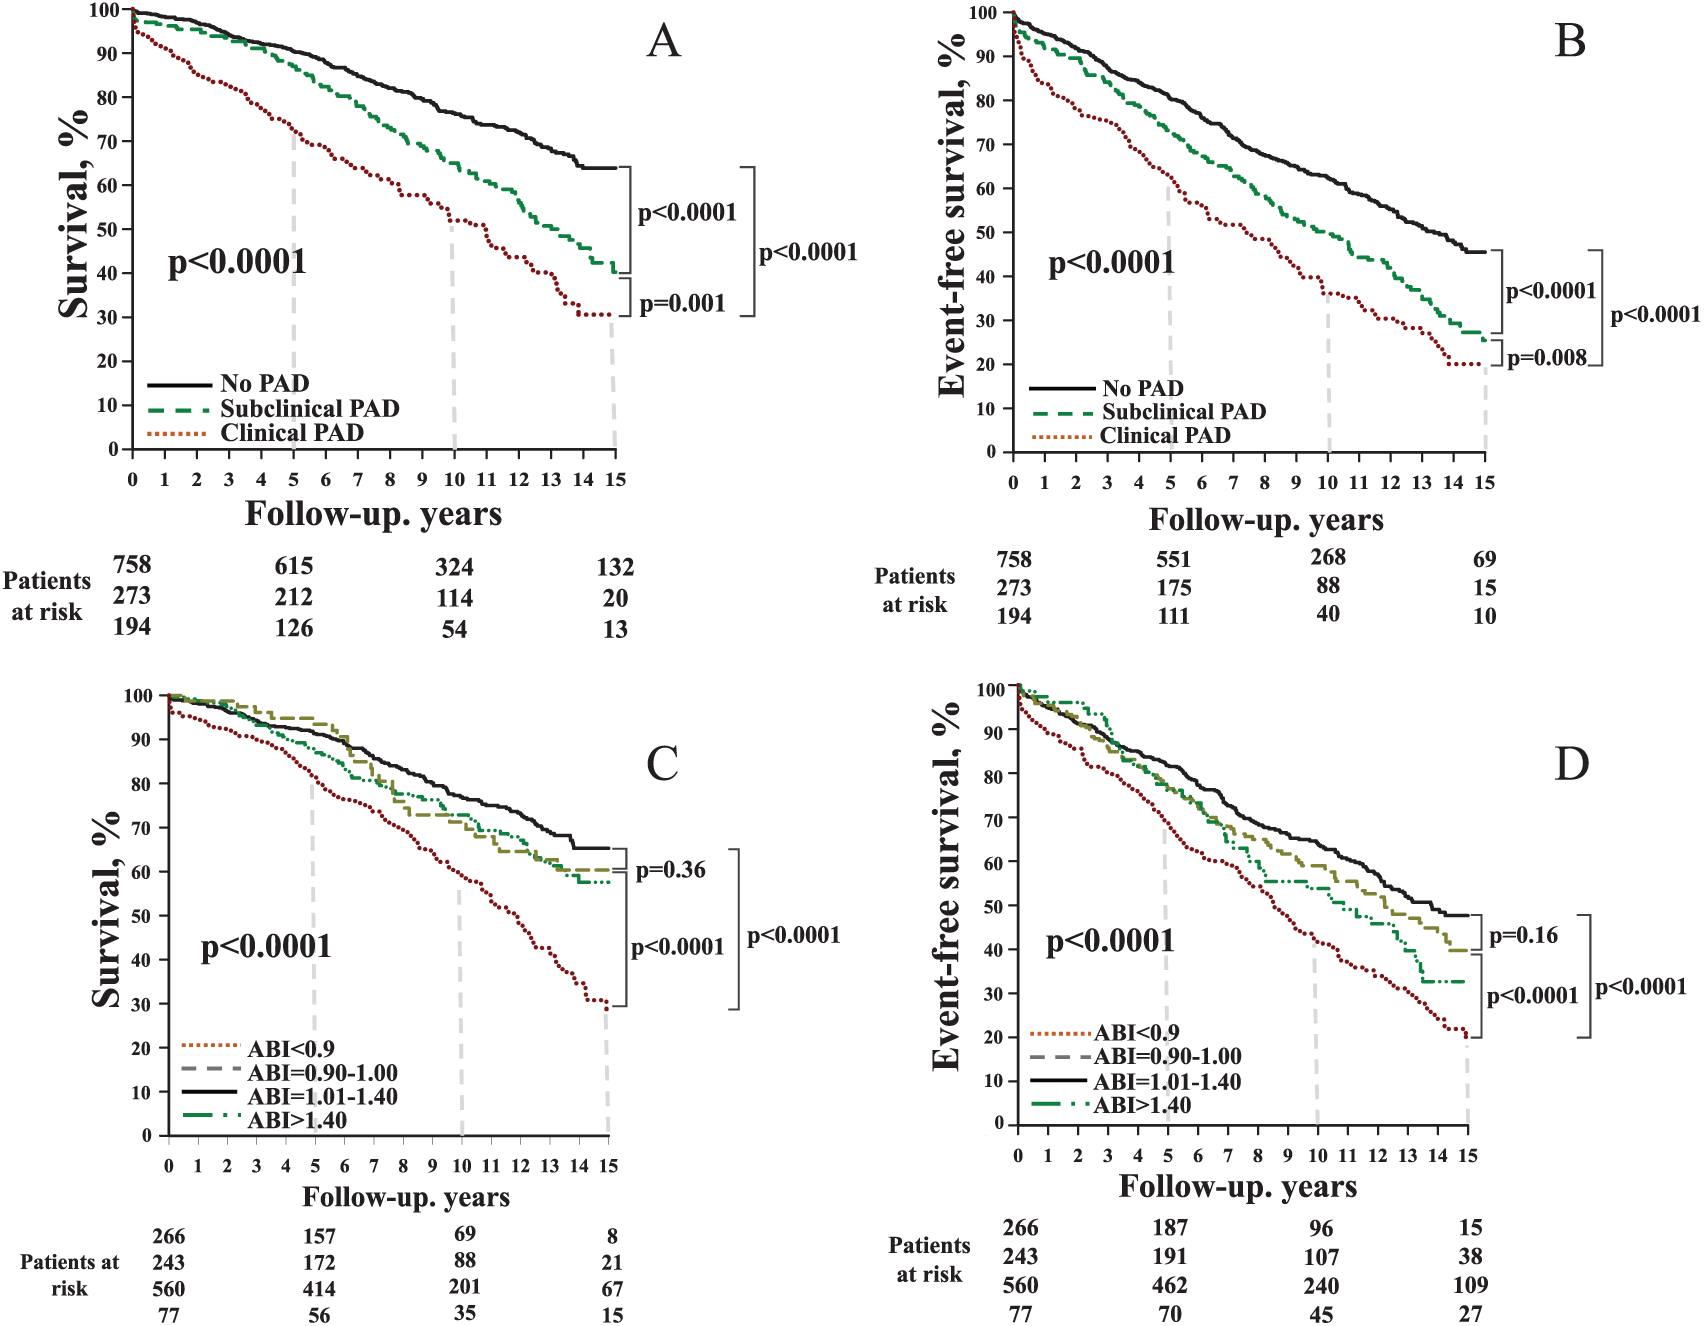
Survival and event-free survival according to different groups (A and B) or according to the ABI (C and D). ABI is derived from method 1.
Prognostic value of ABI and multivariate analysis
The associations between the ABI and survival or event-free survival, according to pre-specified cut-off values, are reported in Figure 3 (C and D). The poorest prognosis was found among patients with an ABI < 0.90 and the best prognosis was in those with an ABI between 1.01 and 1.40. An ABI between 0.91 and 1.00 did not produce statistically increased mortality (p = 0.36) or occurrence of cardiovascular events (p = 0.16) compared to a normal ABI.
Patients classified as the subclinical PAD group using method 3, but not method 1, had significantly reduced survival and event-free survival (p < 0.0001 and p = 0.008) compared to patients without PAD (Figure 4, A and B) and had no significantly different outcomes than those with subclinical PAD identified by method 1 (survival: p = 0.183; event-free survival: p = 0.085).
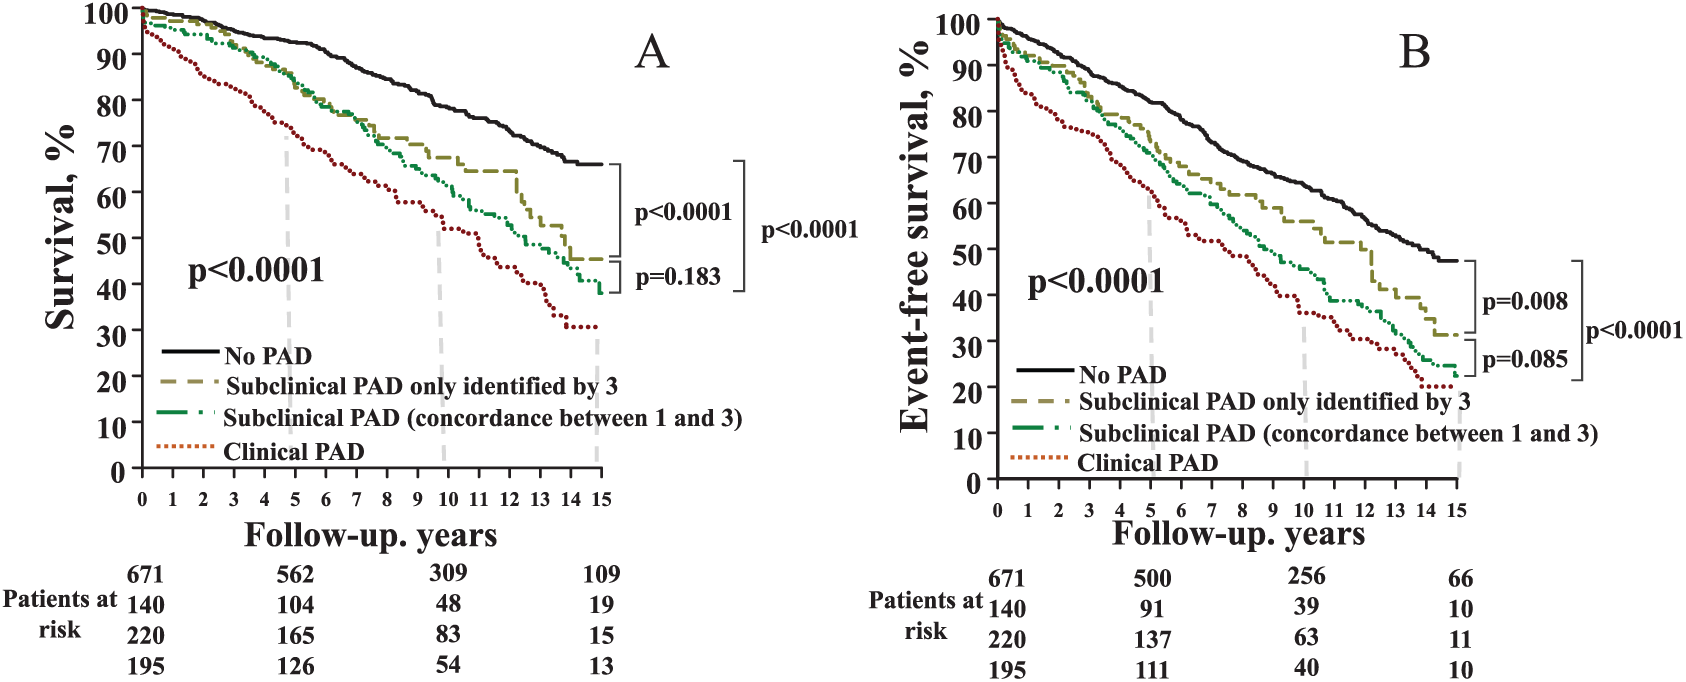
Survival (A) and event-free survival (B) according to method 3, and according to classification in the subclinical PAD group using methods 1 and 3.
The prognostic values of various modes of ABI are shown in Figure 5 (A and B). The AUC were statistically similar (all p > 0.15) between methods regarding both the prediction of death (from 0.608 ± 0.020 with method 5 to 0.625 ± 0.020 with method 4) and cardiovascular events (from 0.569 ± 0.018 with method 5 to 0.591 ± 0.018 for method 4).
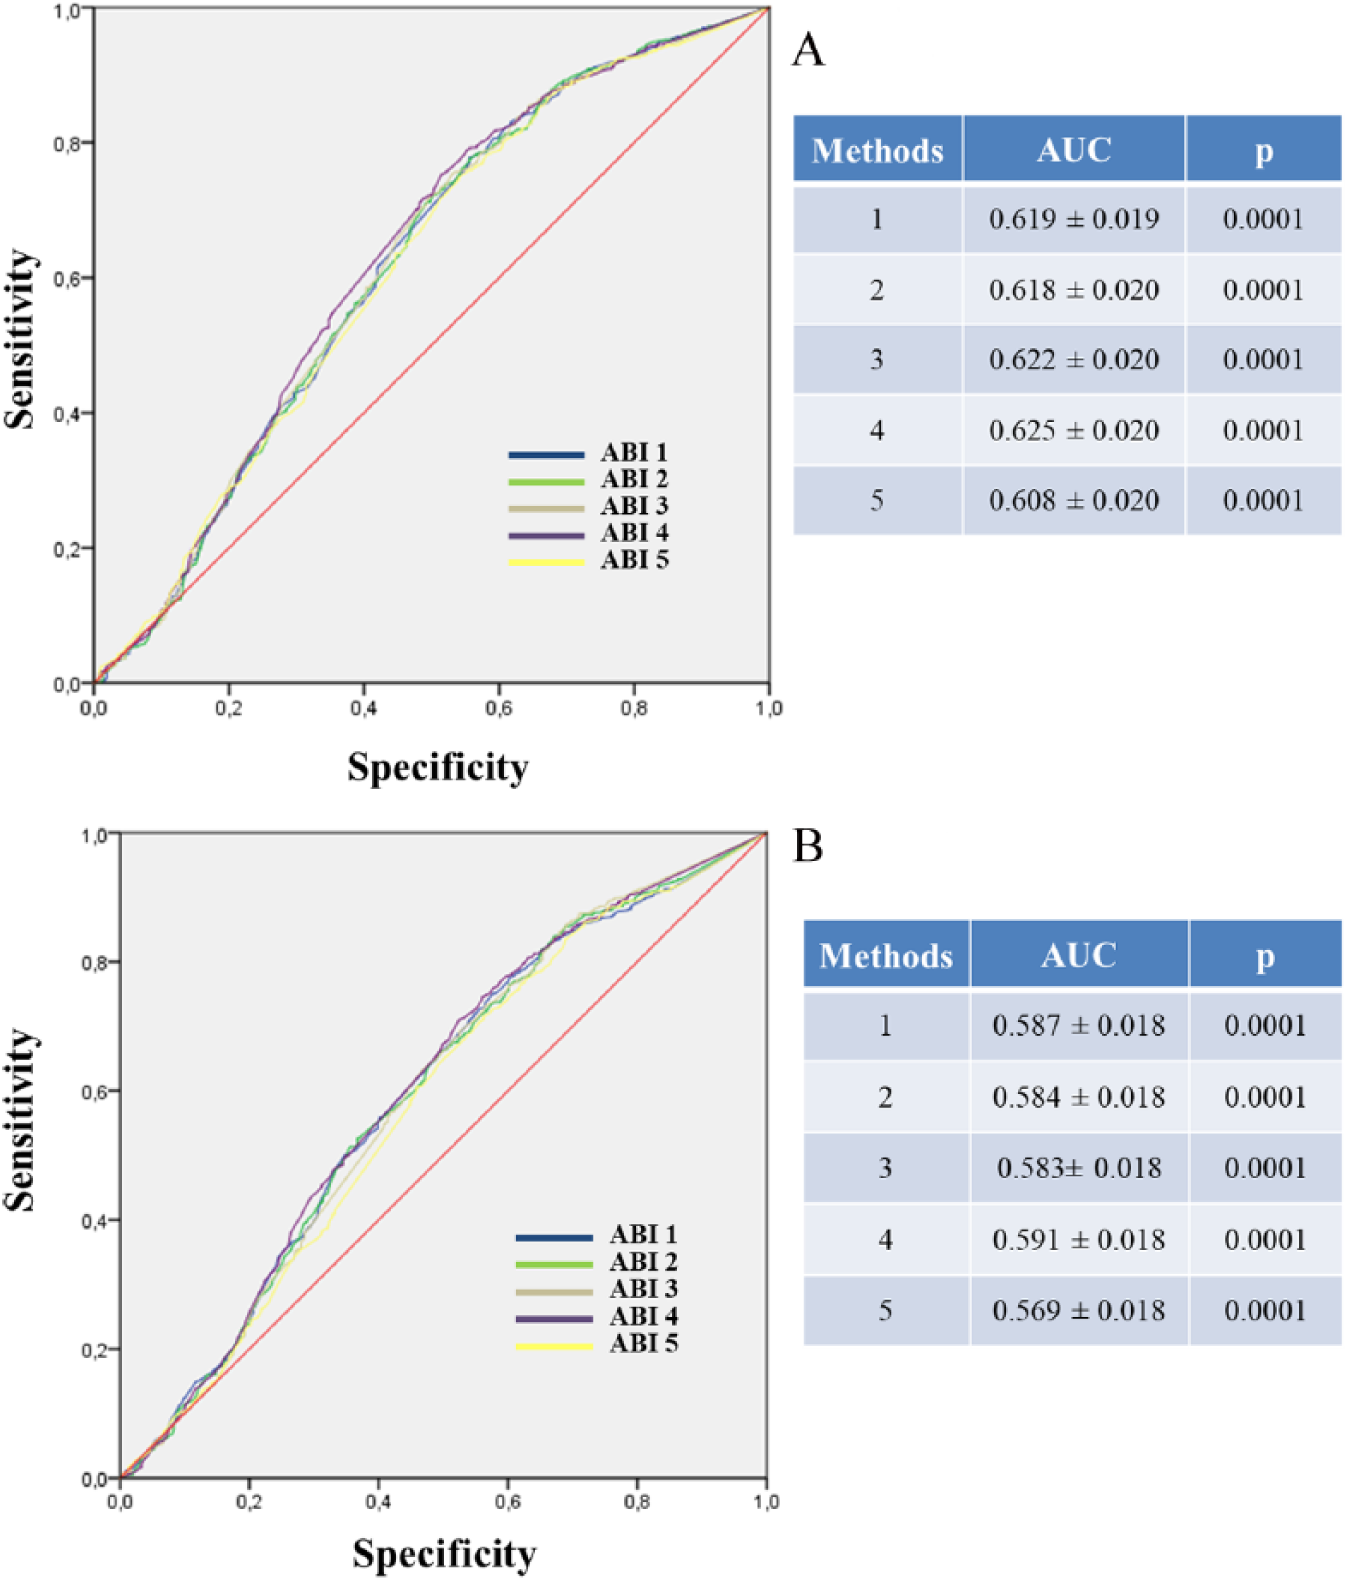
Performance of various modes of ABI calculation to predict death (A) or combined end point occurrence (B).
The independent clinical determinant of death and cardiovascular events identified by multivariate analysis are listed in Table 2. After adjustment, clinical PAD remained a strong determinant for death (HR = 1.85, 95% CI: 1.45–2.37, p < 0.0001) and cardiovascular events (HR = 1.58, 95% CI: 1.28–1.96, p < 0.0001).
Clinical determinants of death and combined end point: multivariate analysis.
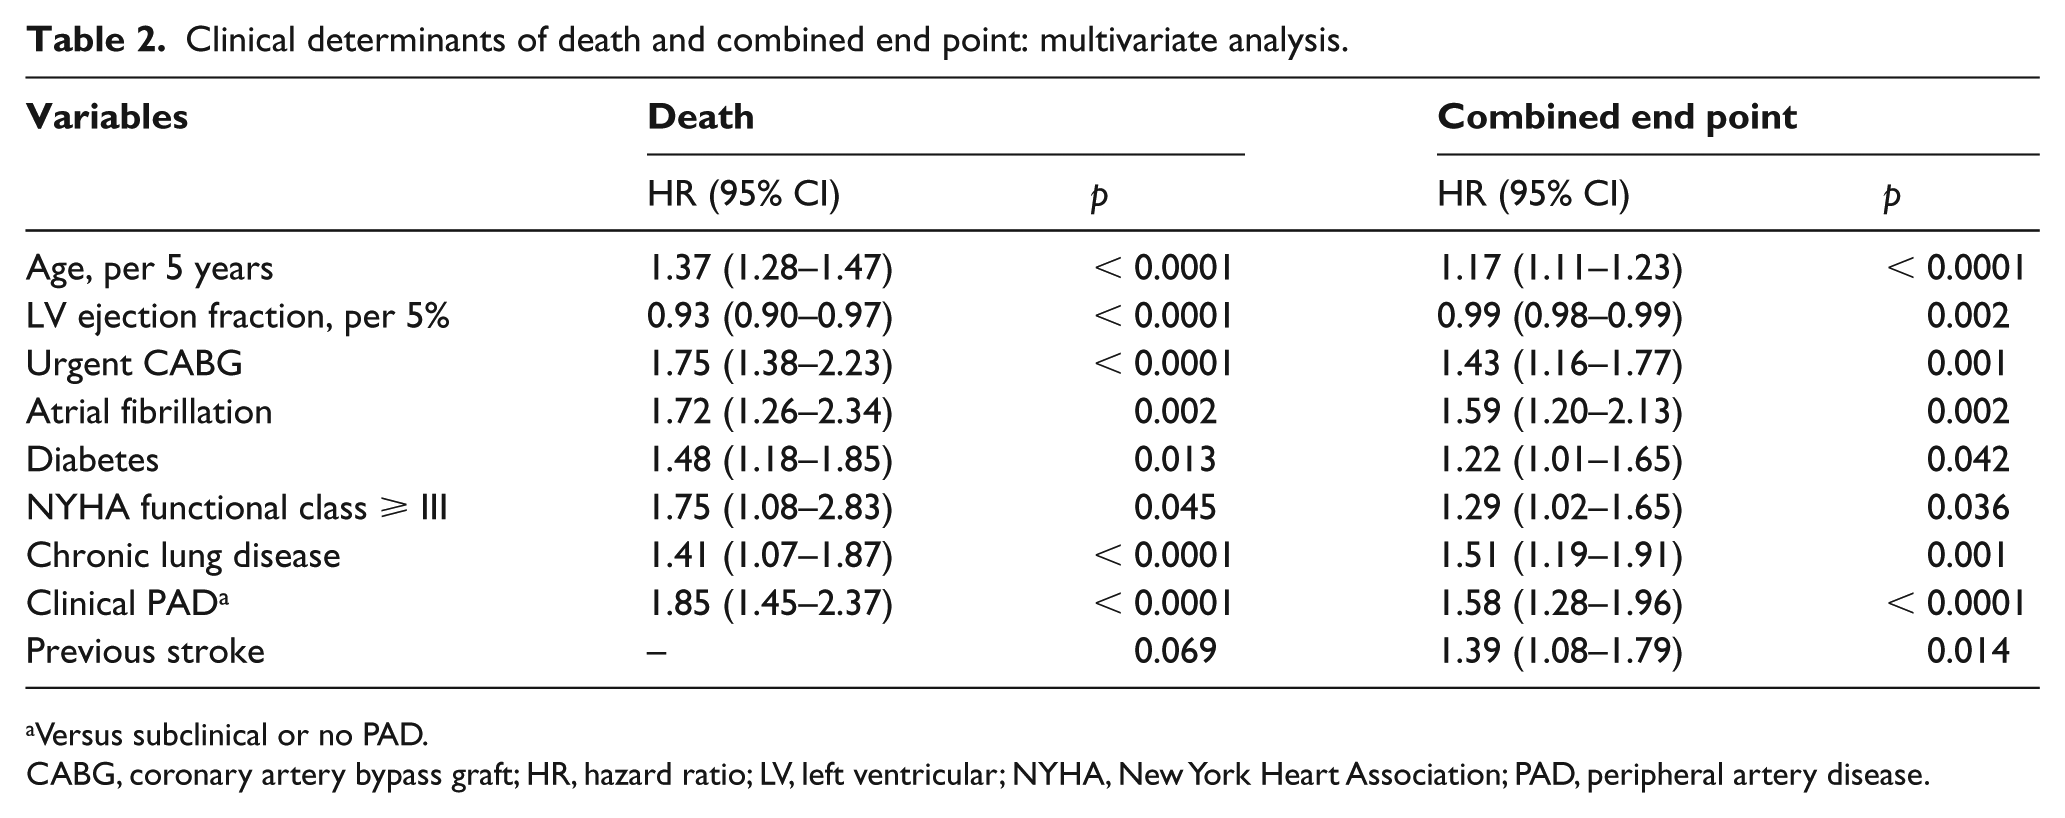
Versus subclinical or no PAD.
CABG, coronary artery bypass graft; HR, hazard ratio; LV, left ventricular; NYHA, New York Heart Association; PAD, peripheral artery disease.
When subclinical PAD, as assessed using various ABI modes, was added to clinical variables, the predictive performance of the model was statistically improved (all p < 0.05), as shown by the increase in chi-squared and C-statistic models (Tables 3 and 4). The risk excess of mortality and cardiovascular event related to subclinical PAD was weakly oscillating from 46% to 67% and from 37% to 51%, respectively, depending on the methods and cut-off of ABI used.
Incremental prognostic value of subclinical PAD as assessed using ABI over clinical variables in the prediction of death, according to various calculation methods.
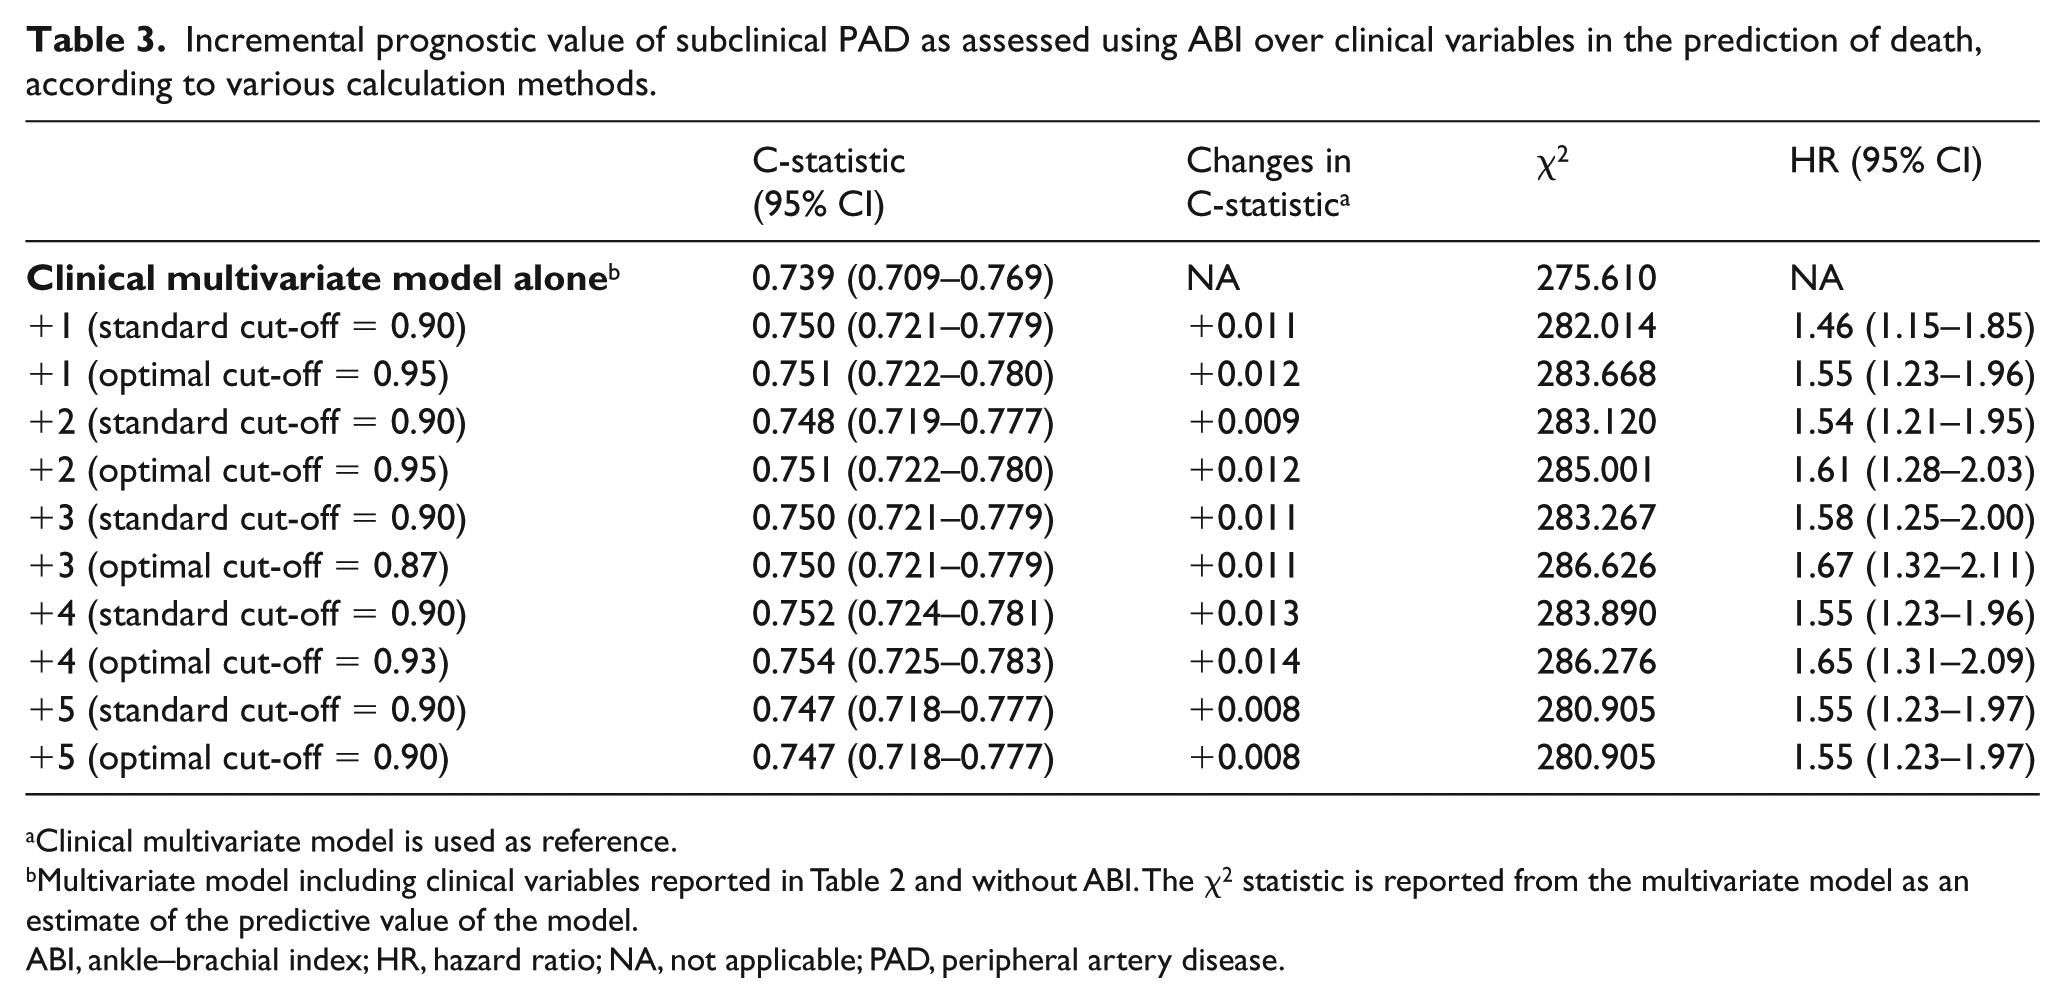
Clinical multivariate model is used as reference.
Multivariate model including clinical variables reported in Table 2 and without ABI. The χ2 statistic is reported from the multivariate model as an estimate of the predictive value of the model.
ABI, ankle–brachial index; HR, hazard ratio; NA, not applicable; PAD, peripheral artery disease.
Incremental value of subclinical PAD as assessed using ABI over clinical variables in the prediction of a combined end point, according to various calculation methods.
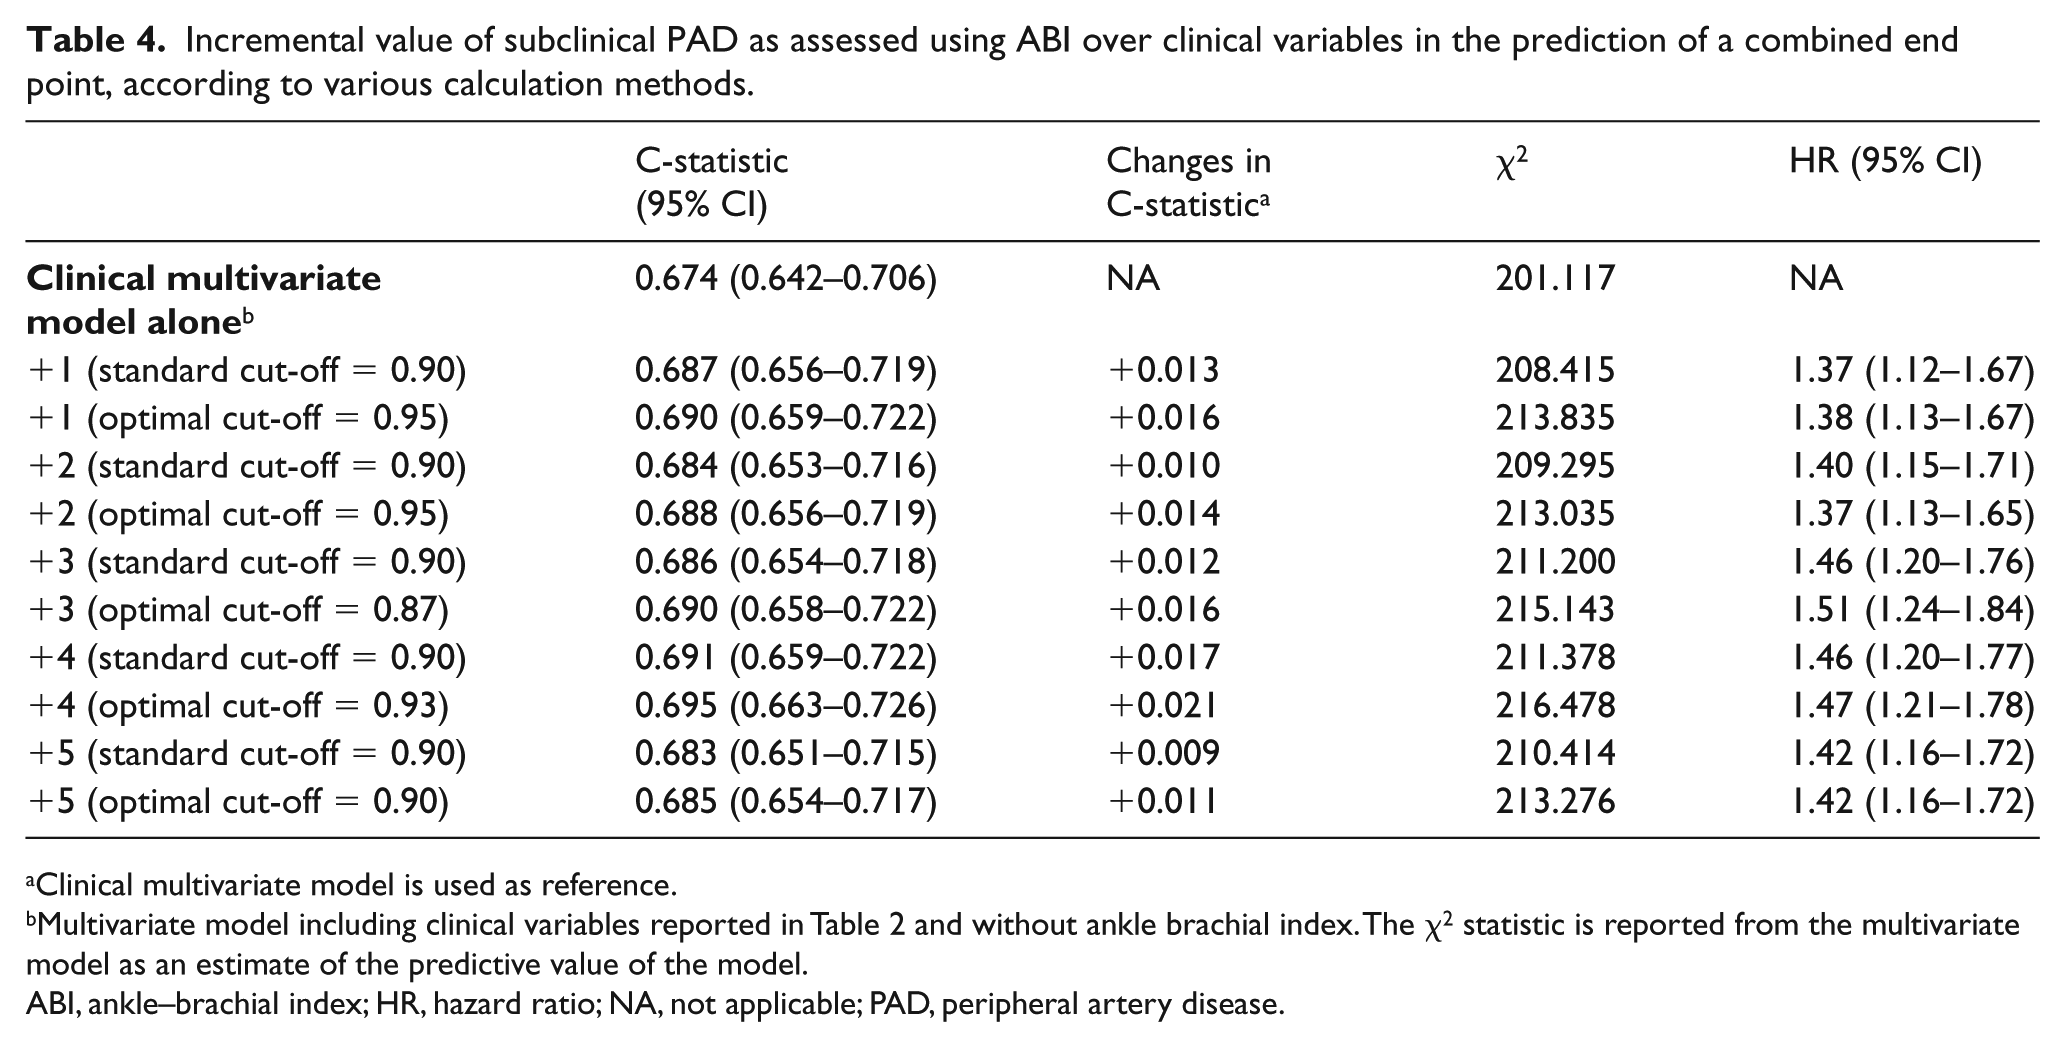
Clinical multivariate model is used as reference.
Multivariate model including clinical variables reported in Table 2 and without ankle brachial index. The χ2 statistic is reported from the multivariate model as an estimate of the predictive value of the model.
ABI, ankle–brachial index; HR, hazard ratio; NA, not applicable; PAD, peripheral artery disease.
The predictive value of ABIs according to different modes (from 1 to 5) was not statistically different between each other (all p > 0.13).
In addition, the use of an optimal cut-off derived from ROC curves for each method of ABI did not statistically modify the predictive value of the multivariate models (Tables 3 and 4) compared to the standard cut-off (all p > 0.66).
Discussion
The results of our study show that in patients referred for CABG: (1) subclinical PAD, detected by the ABI, is associated with intermediate survival and event-free survival as compared to patients with no PAD and clinical PAD; (2) as compared to method 1, method 3 of ABI calculation may identify a subset of subclinical PAD with reduced survival and event-free survival; (3) subclinical PAD provides incremental prognostic values as compared to clinical variables; (4) the independent prognostic value of the ABI is unrelated to its mode of calculation; and (5) to have similar HRs, the cut-points according to the different calculation modes of ABI differ.
The most recent guidelines12,13 recommend the use of the ABI as a first-line tool to diagnose PAD. Its use and measurement methods were further detailed previously. 8
Several studies14–17 compared the various methods of calculation of ABI in terms of their effect on the determination of PAD prevalence. Indeed, in the Multi-Ethnic Study of Atherosclerosis (MESA), 17 including subjects free from clinically apparent cardiovascular disease, the prevalence of PAD reported according to the method of ABI calculation varied from 3.7% to 14.6% in females and from 3.4% to 16% in males.
In our series, the frequency of subclinical PAD varied from 22%, using the highest ankle systolic BP, to 29% with the lowest ankle systolic BP. This emphasizes the difference in sensitivity and specificity of various methods when keeping a similar ABI threshold of 0.90. Of interest, our data suggest that the highest sensitivity is required in these patients since, despite a trend towards better outcome than patients identified with method 1 (Figure 4), those only diagnosed with method 3A are at increased risk of death and cardiovascular events than patients without PAD.
Our study confirms previous studies reporting the poorer prognosis of patients with CAD when associated with PAD, even asymptomatic patients. In patients with CAD, PAD is often underdiagnosed, whereas it is associated with a markedly increased risk of poor prognosis, even after successful myocardial revascularization. This is evidenced by the observed statistically higher C-statistic and χ2 statistic of models when ABI is added to the clinical multivariate model (Tables 3 and 4). Patients with an ABI between 0.90 and 1.00 have similar outcomes to those with an ABI
In addition, the method of calculation of ABI may influence the rate of subclinical PAD identified, and this may have an impact on outcome. Indeed, the use of methods with high specificity may underdiagnose the presence of subclinical PAD and, thus, leave these patients without specific management and treatment. Previous studies have reported that the use of methods considering the highest ankle BP underestimated the prevalence of subclinical PAD and miss diagnosing a subset of patients with only single-artery disease.9,10 Nonetheless, it should be emphasized that the comparison of various methods of ABI according to a predefined threshold (0.90) is the main reason explaining such discrepancies in the prevalence of subclinical PAD. The use of a predefined threshold may artificially increase the sensitivity or specificity of an ABI method. Consequently, ABI should rather be seen as a continuum with different sensitivities and specificities, predicting mortality or events, related to the threshold chosen. The comparison of various methods of ABI calculation, as performed using ROC curves analysis, allows accurate estimation of the intrinsic value of ABI, whatever the calculation method, and regardless of the cut-off used. Our data did not find any difference between ABI methods in terms of prognostic value. However, the use of optimal cut-off for each method seems to weakly increase the predictive value of the ABI. This may suggest that the intrinsic prognostic value of ABI remains independent of the method used. Trivial changes in sensitivity according to its mode of calculus can be compensated by minor variations of the threshold.
Limitations
The population in this study included patients undergoing CABG. These patients have severe CAD, and although revascularized, remain at high cardiovascular risk. Hence, the conclusions require validation in the general population.
Although the sample size of the study is relatively large, the lack of significant differences between the various methods of ABI calculation may be related to a type II error. It could be postulated that a larger sample size may provide significant differences and, thus, a different conclusion. Nevertheless, the observed differences in terms of predictive value between ABI methods would remain weak and unlikely to be clinically relevant.
Conclusion
In patients receiving CABG, subclinical PAD detected by the ABI is associated with poorer outcome. The ABI provides a significant incremental prognostic value compared to clinical parameters. When a similar threshold of 0.90 is retained in all ABI methods, some alternative modes of calculation of the ABI detect more cases than the standard method. This difference can be compensated for by using a higher threshold in less sensitive modes of ABI. Overall, the prognostic information provided by the ABI is intrinsically similar whatever the mode of calculation. Yet the standard mode of ABI can be maintained to keep a similar methodology in different studies. Varying the threshold can modify the sensitivity of the ABI according to the objectives set when using this cardiovascular risk marker. Because our study has been performed in patients at high cardiovascular risk, further confirmation in the general population remains a requirement.
Footnotes
Declaration of conflicting interests
The authors declared no potential conflicts of interest with respect to the research, authorship, and/or publication of this article.
Funding
The authors received no financial support for the research, authorship, and/or publication of this article.