
Abstract
This study investigated the relationship between ankle–brachial index (ABI) and risk for heart failure with reduced ejection fraction (HFrEF) and preserved ejection fraction (HFpEF). ABI has previously been associated with mortality, cardiovascular disease (CVD), and overall HF but the relationship between ABI and risk of HF stratified by EF has not been well characterized. We analyzed data from 6553 participants (53% female; mean age 62 ± 10 years) enrolled in the Multi-Ethnic Study of Atherosclerosis (MESA) who were free of known clinical CVD/HF at baseline (2000–2002) and had baseline ABI measured. Participants were classified as low (≤ 0.90), borderline-low (0.91–1.00), normal (1.01–1.40), and high (> 1.40) ABI. Incident hospitalized HF was determined over a median follow-up of 14 years; we classified HF events (n = 321) as HFrEF with EF < 50% (n = 155, 54%) or HFpEF with EF ⩾ 50% (n = 133, 46%). Low ABI was associated with incident HFrEF (hazard ratio (HR): 2.02, 95% CI 1.19–3.40, p = 0.01) and had no significant association with HFpEF (HR: 0.67, 95% CI 0.30–1.48, p = 0.32). Borderline-low and high ABI were not significantly associated with HFrEF or HFpEF. Cubic spline analyses showed association with both low and high ABI for HFrEF and high ABI for HFpEF. A 1 SD lower ABI (for ABI < 1.1) was associated with incident HFrEF in multivariable analysis (HR: 1.27, 95% CI 1.05–1.54) but was not significant after additionally adjusting for interim myocardial infarction (HR: 1.21, 95% CI 0.99–1.48). Low ABI was associated with higher risk for incident HFrEF but not HFpEF in persons free of known CVD. Future studies of a larger size are needed for high ABI analyses.
Keywords
Introduction
Heart failure (HF) is a major public health problem that is expected to increase in prevalence as our population ages, risk factor profile worsens, and acute care of cardiovascular events continues to improve.1,2 HF with reduced ejection fraction (HFrEF) and HF with preserved ejection fraction (HFpEF), differ in prevalence, pathophysiology, and evidence-based management.3,4 Proven therapies for HFpEF are lacking, partially due to incomplete understanding of the pathophysiology of the disease. 5 Ankle–brachial index (ABI) is an easily and inexpensively collected non-invasive measure of peripheral artery disease (PAD) and subclinical atherosclerosis. 6 ABI has previously been associated with mortality and cardiovascular events, and for ABI < 1.1, lower ABI has been associated with higher risk of mortality, cardiovascular disease (CVD) mortality, and major coronary events. 7 However, the relationship between ABI and risk of HF stratified by ejection fraction (EF) has not been well characterized.8–11 PAD and HF share many risk factors including advanced age, tobacco use, atherosclerosis, and diabetes mellitus. 12
Multiple studies have confirmed the association between ABI and incident overall HF13–15; only one has explored HF subtype. Nishimura et al. presented a retrospective single-center study of 2824 participants from a Japanese university hospital cohort of cardiology inpatients (2005–2012). 16 In secondary analysis, low ABI (< 0.90) was associated with more HFpEF than HFrEF. The authors concluded that low ABI, a marker of atherosclerosis, indicates vascular abnormalities and thus can predict incident HFpEF, as HFpEF is often associated with arterial and ventricular stiffening. Whether the association between ABI and HF is independent of newer measurements of subclinical atherosclerotic CVD, like coronary artery calcium (CAC) score, has never been studied before to our knowledge. We therefore investigated the association between ABI and incident HFrEF vs HFpEF in the Multi-Ethnic Study of Atherosclerosis (MESA) cohort of middle-aged to older adults free of overt CVD at baseline. We hypothesized that low ABI would more strongly relate to HFrEF, particularly ischemic cardiomyopathy, rather than HFpEF. Understanding this association may aid in targeting screening or treatment.
Methods
Study participants
The MESA study has been previously described in detail. 17 MESA is a prospective cohort study of 6814 American men and women aged 45–84 of four self-reported ethnicities (non-Hispanic white, Chinese, African American, and Hispanic) recruited between July 2000 and August 2002 from six US communities (Baltimore, MD; Chicago, IL; Forsyth County, NC; Los Angeles County, CA; Northern Manhattan and Bronx, NY; and St Paul, MN). Participants were free of known clinically apparent CVD and HF at baseline exam. The study was approved by the Institutional Review Board of each participating center and written informed consent was obtained from all participants.
Data collection
On the initial MESA examination (July 2000 to August 2002), demographic information, medical history, physical exam, and 12-hour fasting laboratory data, including total cholesterol, high-density lipoprotein (HDL), triglycerides, glucose level, and creatinine, were obtained. 18 Age, sex, race/ethnicity income, and education were self-reported. Annual income was categorized as total gross family income < $20,000 or ⩾ $20,000, and highest level of education was categorized as high school or less or some college or more. Cigarette smoking was defined as current or former versus never smoker. Alcohol use was defined as current use only. Diabetes was defined by the 2003 American Diabetes Association fasting criteria algorithm. 19 Body mass index (BMI) was calculated as weight/height2 (kg/m2). Blood pressure was measured after 5 minutes of rest in a seated position, by taking the average of the second and third readings. Home medication use was recorded from inspection of containers of participants’ prescription and non-prescription medications. Total (TC) and HDL cholesterol (HDL-c) were measured from blood samples obtained after a 12-hour fast. Low-density lipoprotein cholesterol (LDL-c) was estimated by the Friedewald equation. 20 Coronary artery calcium (CAC) was measured as the average of two acquisitions by either electron beam computed tomography (Chicago, Los Angeles, and New York field centers) or helical computed tomography (Baltimore, Forsyth County, and St Paul field centers) and details have been previously reported. 21 The mean phantom-adjusted Agatston score was used in all analyses. CAC was categorized as 0, 1–100, and > 100 Agatston units.
ABI protocol
For each lower extremity, the ABI numerator was the higher of the two systolic ankle pressures (dorsalis pedis and posterior tibial) on that extremity. The denominator was the average of right and left brachial systolic blood pressures if the difference between the two was < 10 mmHg. If the difference was > 10 mmHg, the higher pressure was used as the denominator. All pressures were measured in a supine position after resting quietly for 5 minutes with hand-held continuous-wave Doppler ultrasound probes. Per previous literature, participants were classified into one of four ABI categories: ‘low’ for ABI ⩽ 0.90, ‘borderline-low’ for 0.90 < ABI ⩽ 1.00, ‘normal’ for 1.00 < ABI ⩽ 1.40, and ‘high’ for ABI > 1.4. 22
Interim myocardial infarction
Interim myocardial infarction (MI) was adjudicated by MESA reviewers as definite, probable, or absent based on symptoms, electrocardiogram (ECG), and cardiac biomarker levels after review of medical records. In the majority of cases, definite or probable MI required abnormal cardiac biomarkers (two times the upper limits of normal) regardless of pain or ECG findings; evolving Q waves regardless of pain or biomarker findings; or a combination of chest pain, and ST-T evolution or new left bundle branch block (LBBB), and biomarker levels one to two times the upper limits of normal.
Heart failure follow-up
This cohort was followed for events through December 31, 2015 for a median follow-up time of 14.0 years (IQR: 12.0–14.7 years). Telephone interviewers contacted each participant at intervals of 9–12 months to inquire about interim hospital admissions, outpatient diagnoses, procedures, and deaths. Self-reported diagnoses were verified by death certificates and medical records; 99% of inpatient events and 97% of outpatient records were obtained. The end point for this study was first-time diagnosis of symptomatic hospitalized HF requiring symptoms of shortness of breath or edema, adjudicated by MESA as previously described.23,24 Two cardiologists or cardiovascular physicians independently reviewed records to classify HF events; in the event of disagreement, the full review committee made the final classification. Mandatory criteria included physician diagnosis and medical treatment. Participants with only physician diagnosis without any treatment or evidence on imaging were not classified to have HF. Each new HF diagnosis was categorized as either HFpEF (left ventricular ejection fraction (LVEF) ⩾ 50%) or HFrEF (LVEF < 50%) based on echocardiogram or other imaging studies at the time of HF event hospitalization when available in medical records.
Statistical analysis
We excluded participants with missing ABI measurements at the initial evaluation, missing follow-up for incident HF, or missing baseline covariates.
Baseline characteristics were compared by HF status and by ABI category. Continuous variables were presented as means ± SD and compared between groups by the analysis of variance (ANOVA) method. Categorical variables were presented as frequency and percentage and compared between groups using chi-squared tests. For the skewed continuous variables, CAC score and triglycerides, Kruskal–Wallis and Wilcoxon tests were used in place of ANOVA for four-group and two-group analyses, respectively.
Follow-up time was defined as the time between the baseline ABI measurement until a diagnosis of HF, death, loss to follow-up, or end of follow-up (December 31, 2015). Cox proportional hazards models were constructed for the analysis of the association of ABI category with incident HF by computing hazard ratios (HRs) and 95% CIs. The p-values for the HRs were computed using the likelihood ratio method. Multivariable models were constructed as follows: model 1 unadjusted; model 2 adjusted for age, sex, race/ethnicity, and education level; model 3 adjusted for model 2 covariates plus cigarette smoking, BMI, diabetes mellitus, systolic blood pressure, TC, HDL-c, antihypertensive medication usage, and lipid-lowering medication usage; model 4 adjusted for model 3 covariates plus CAC (categorized as 0, 1–100, and > 100 Agatston units); and model 5 adjusted for model 4 covariates plus interim MI. A restricted cubic spline function using the P-spline method was approximated for HR estimation for continuous ABI fully adjusted for all previously described covariates. A Cox proportional hazards ratio was additionally calculated for ABI as a continuous variable for both unadjusted and multivariable-adjusted regression analyses. Kaplan–Meier analyses and the log-rank test were used to explore the association between ABI category and incident HF.
The above analyses were repeated separately for both incident HFrEF and HFpEF. We accounted for the competing risk of each HF type. Participants with incident HF with unknown EF were censored at the time of their HF diagnosis for these analyses.
Two-sided p-values < 0.05 were considered significant. All statistical analyses were performed using R (R Foundation for Statistical Computing, Vienna, Austria), version 3.5.1.
Results
Of the 6814 MESA participants, after exclusions for those missing ABI measurements at the initial evaluation (n = 79), missing follow-up for incident HF (n = 30), and missing baseline covariates (n = 152), the analysis sample included 6553 (96%) of the MESA participants.
Among the 6553 study participants, mean age was 62 ± 10 years and 53% were female. Thirty-eight percent were Caucasian, 28% were African American, 22% were Hispanic, and 12% were Chinese. A total of 246 participants (4%) had low ABI measurements ≤ 0.90, 611 participants (9%) had borderline-low ABI between 0.91 and 1.00, 5654 participants (85%) had normal ABI between 1.01 and 1.40, and 42 participants (1%) had high ABI > 1.40 (Table 1). After a median of 14 years (maximum 15.8 years) of follow-up, 321 participants went on to develop hospitalized HF and of those 155 (54%) had HFrEF and 133 (46%) had HFpEF (Table 2). Thirty-three participants with incident HF did not have a recorded EF at the time of diagnosis. Compared to participants with normal ABI scores (1.01–1.40), those with ABI scores ≤ 0.90 and > 1.40 had a higher prevalence of advanced age, smoking, family history of MI, diabetes mellitus, hypertension, elevated CAC score, and interim MI (Table 1). BMI was lower in the low ABI group and LDL-c was lower in the high ABI group. Compared to HFrEF, HFpEF participants were more likely to be of advanced age, female sex, Caucasian or Chinese ethnicity, and less likely to have interim MI (Table 2).
Baseline characteristics of 6553 MESA participants free from prevalent HF, tabulated by ABI category.
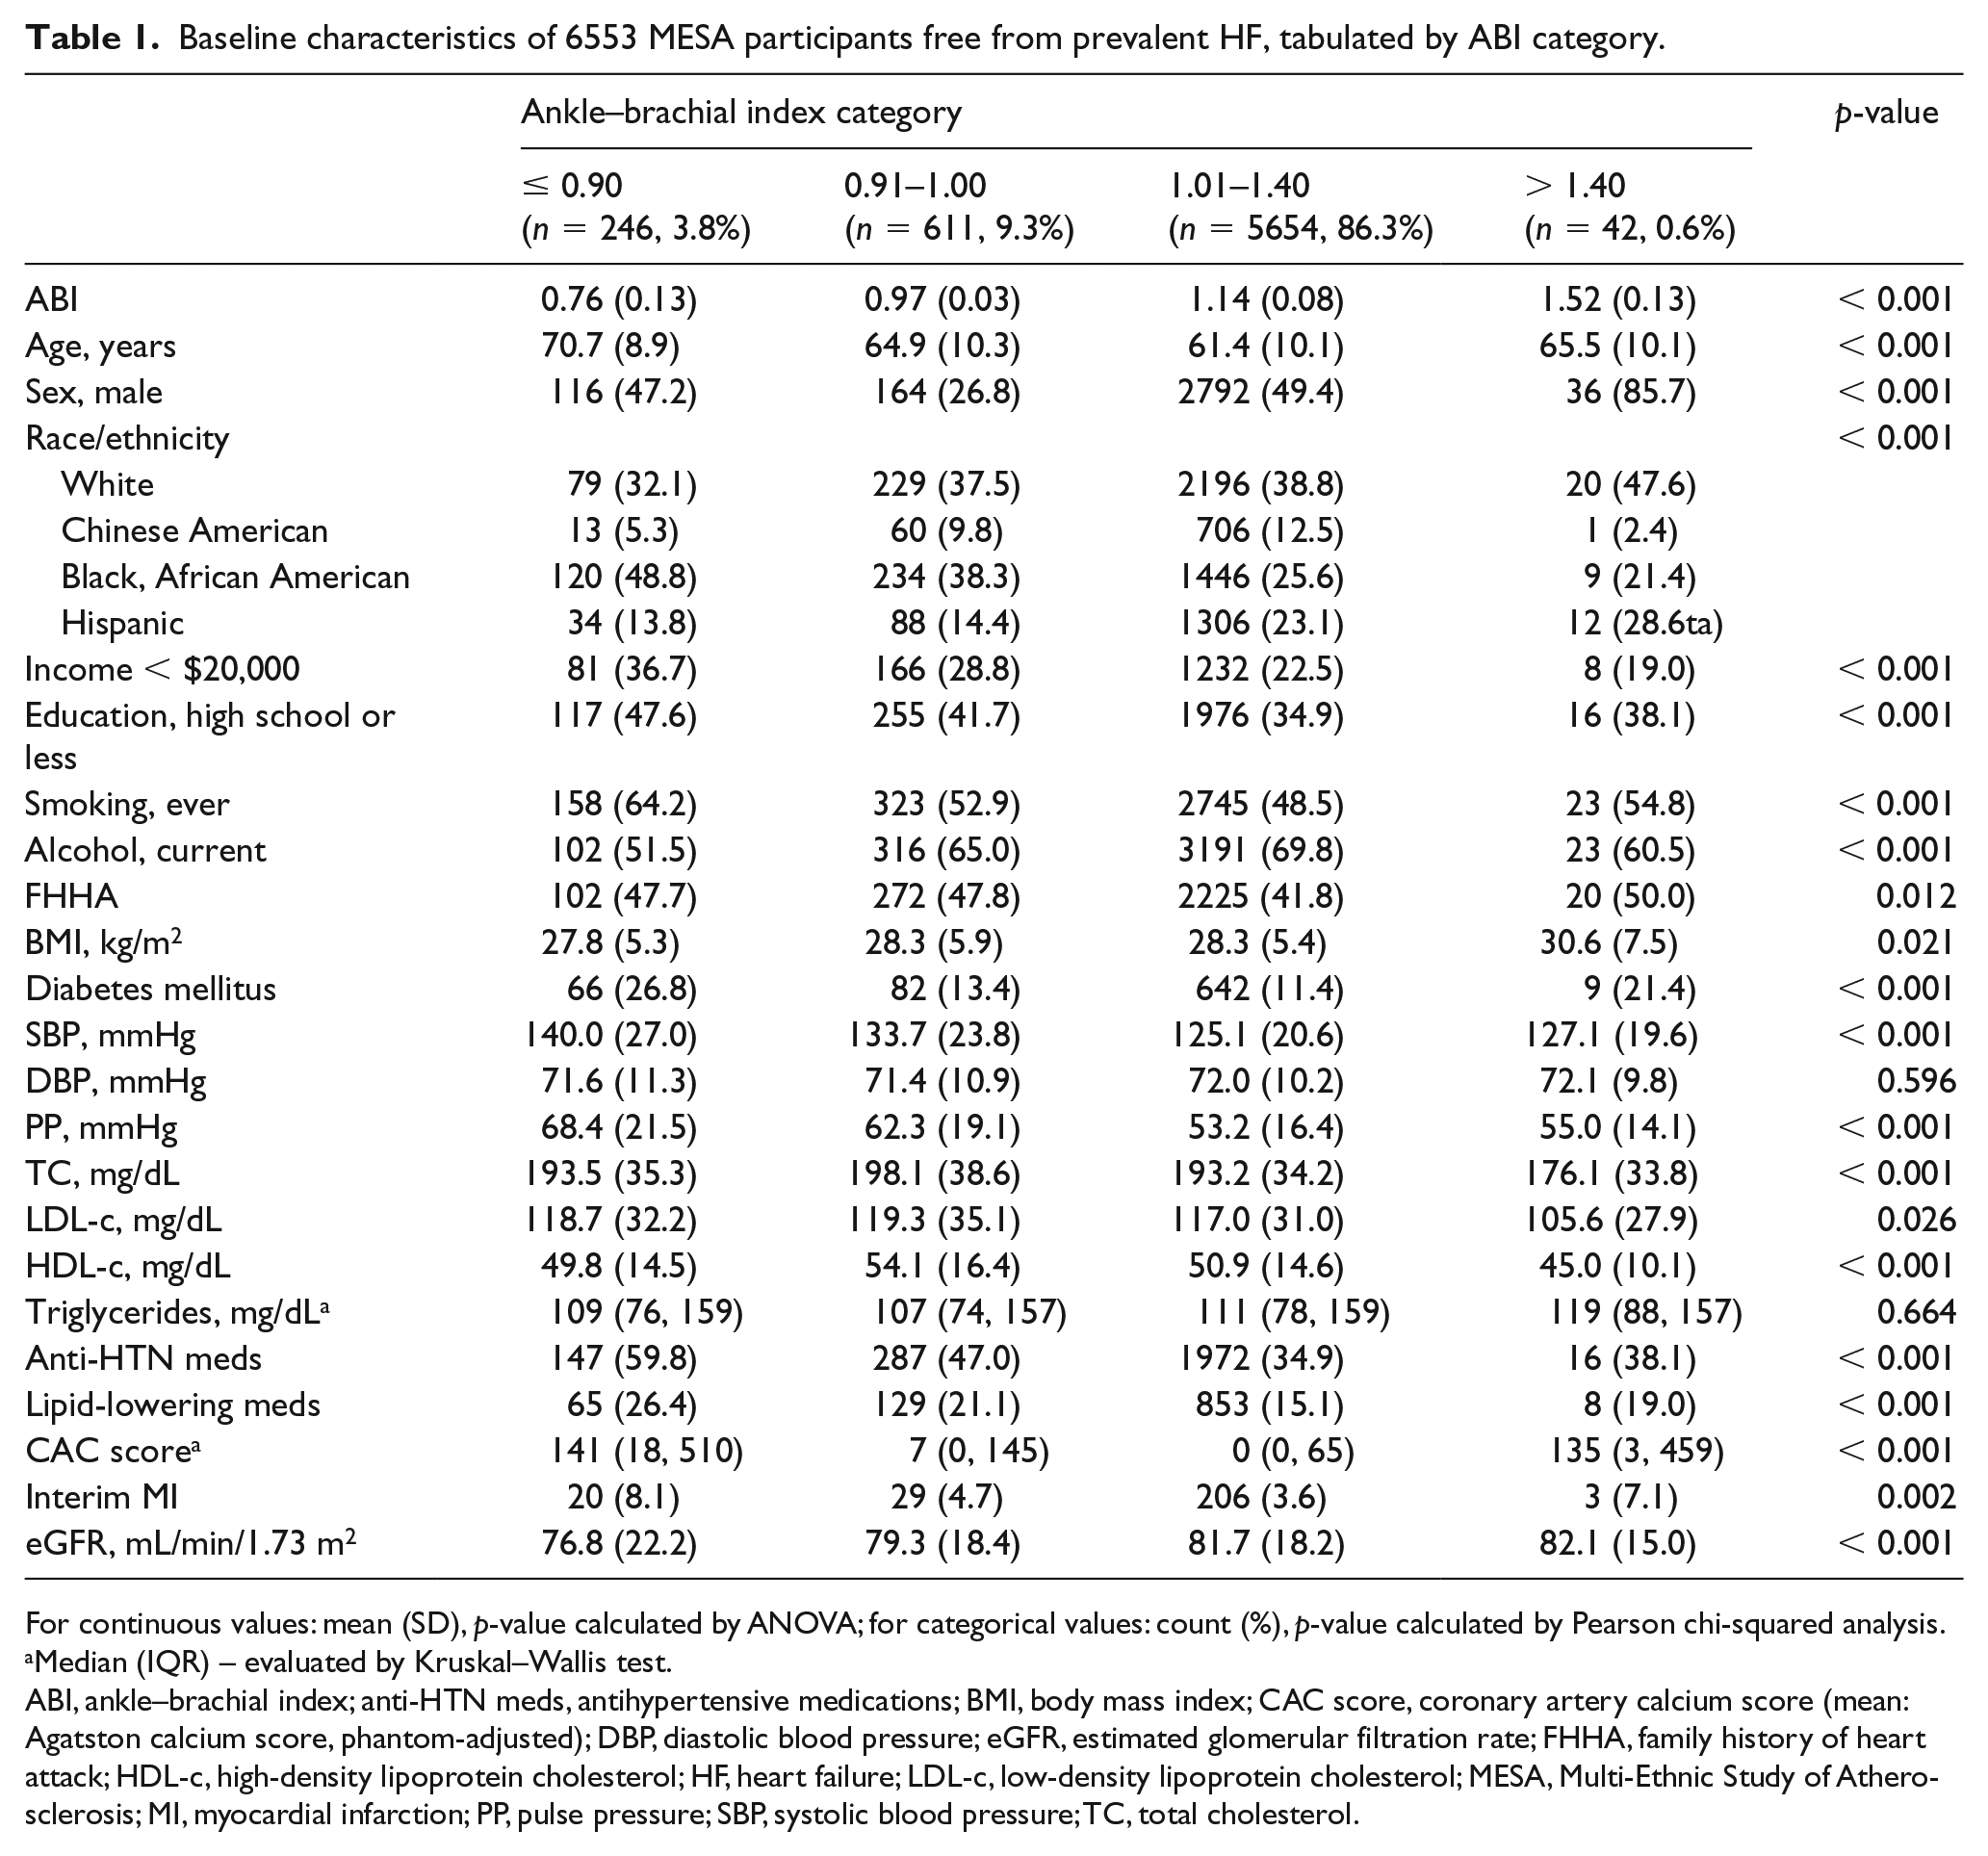
For continuous values: mean (SD), p-value calculated by ANOVA; for categorical values: count (%), p-value calculated by Pearson chi-squared analysis.
Median (IQR) – evaluated by Kruskal–Wallis test.
ABI, ankle–brachial index; ANOVA, analysis of variance; anti-HTN meds, antihypertensive medications; BMI, body mass index; CAC score, coronary artery calcium score (mean: Agatston calcium score, phantom-adjusted); DBP, diastolic blood pressure; eGFR, estimated glomerular filtration rate; FHHA, family history of heart attack; HDL-c, high-density lipoprotein cholesterol; HF, heart failure; LDL-c, low-density lipoprotein cholesterol; MESA, Multi-Ethnic Study of Atherosclerosis; MI, myocardial infarction; PP, pulse pressure; SBP, systolic blood pressure; TC, total cholesterol.
Baseline characteristics of 6553 MESA participants free from prevalent HF, tabulated by incident HF status (no HF, HF, HFrEF, HFpEF).
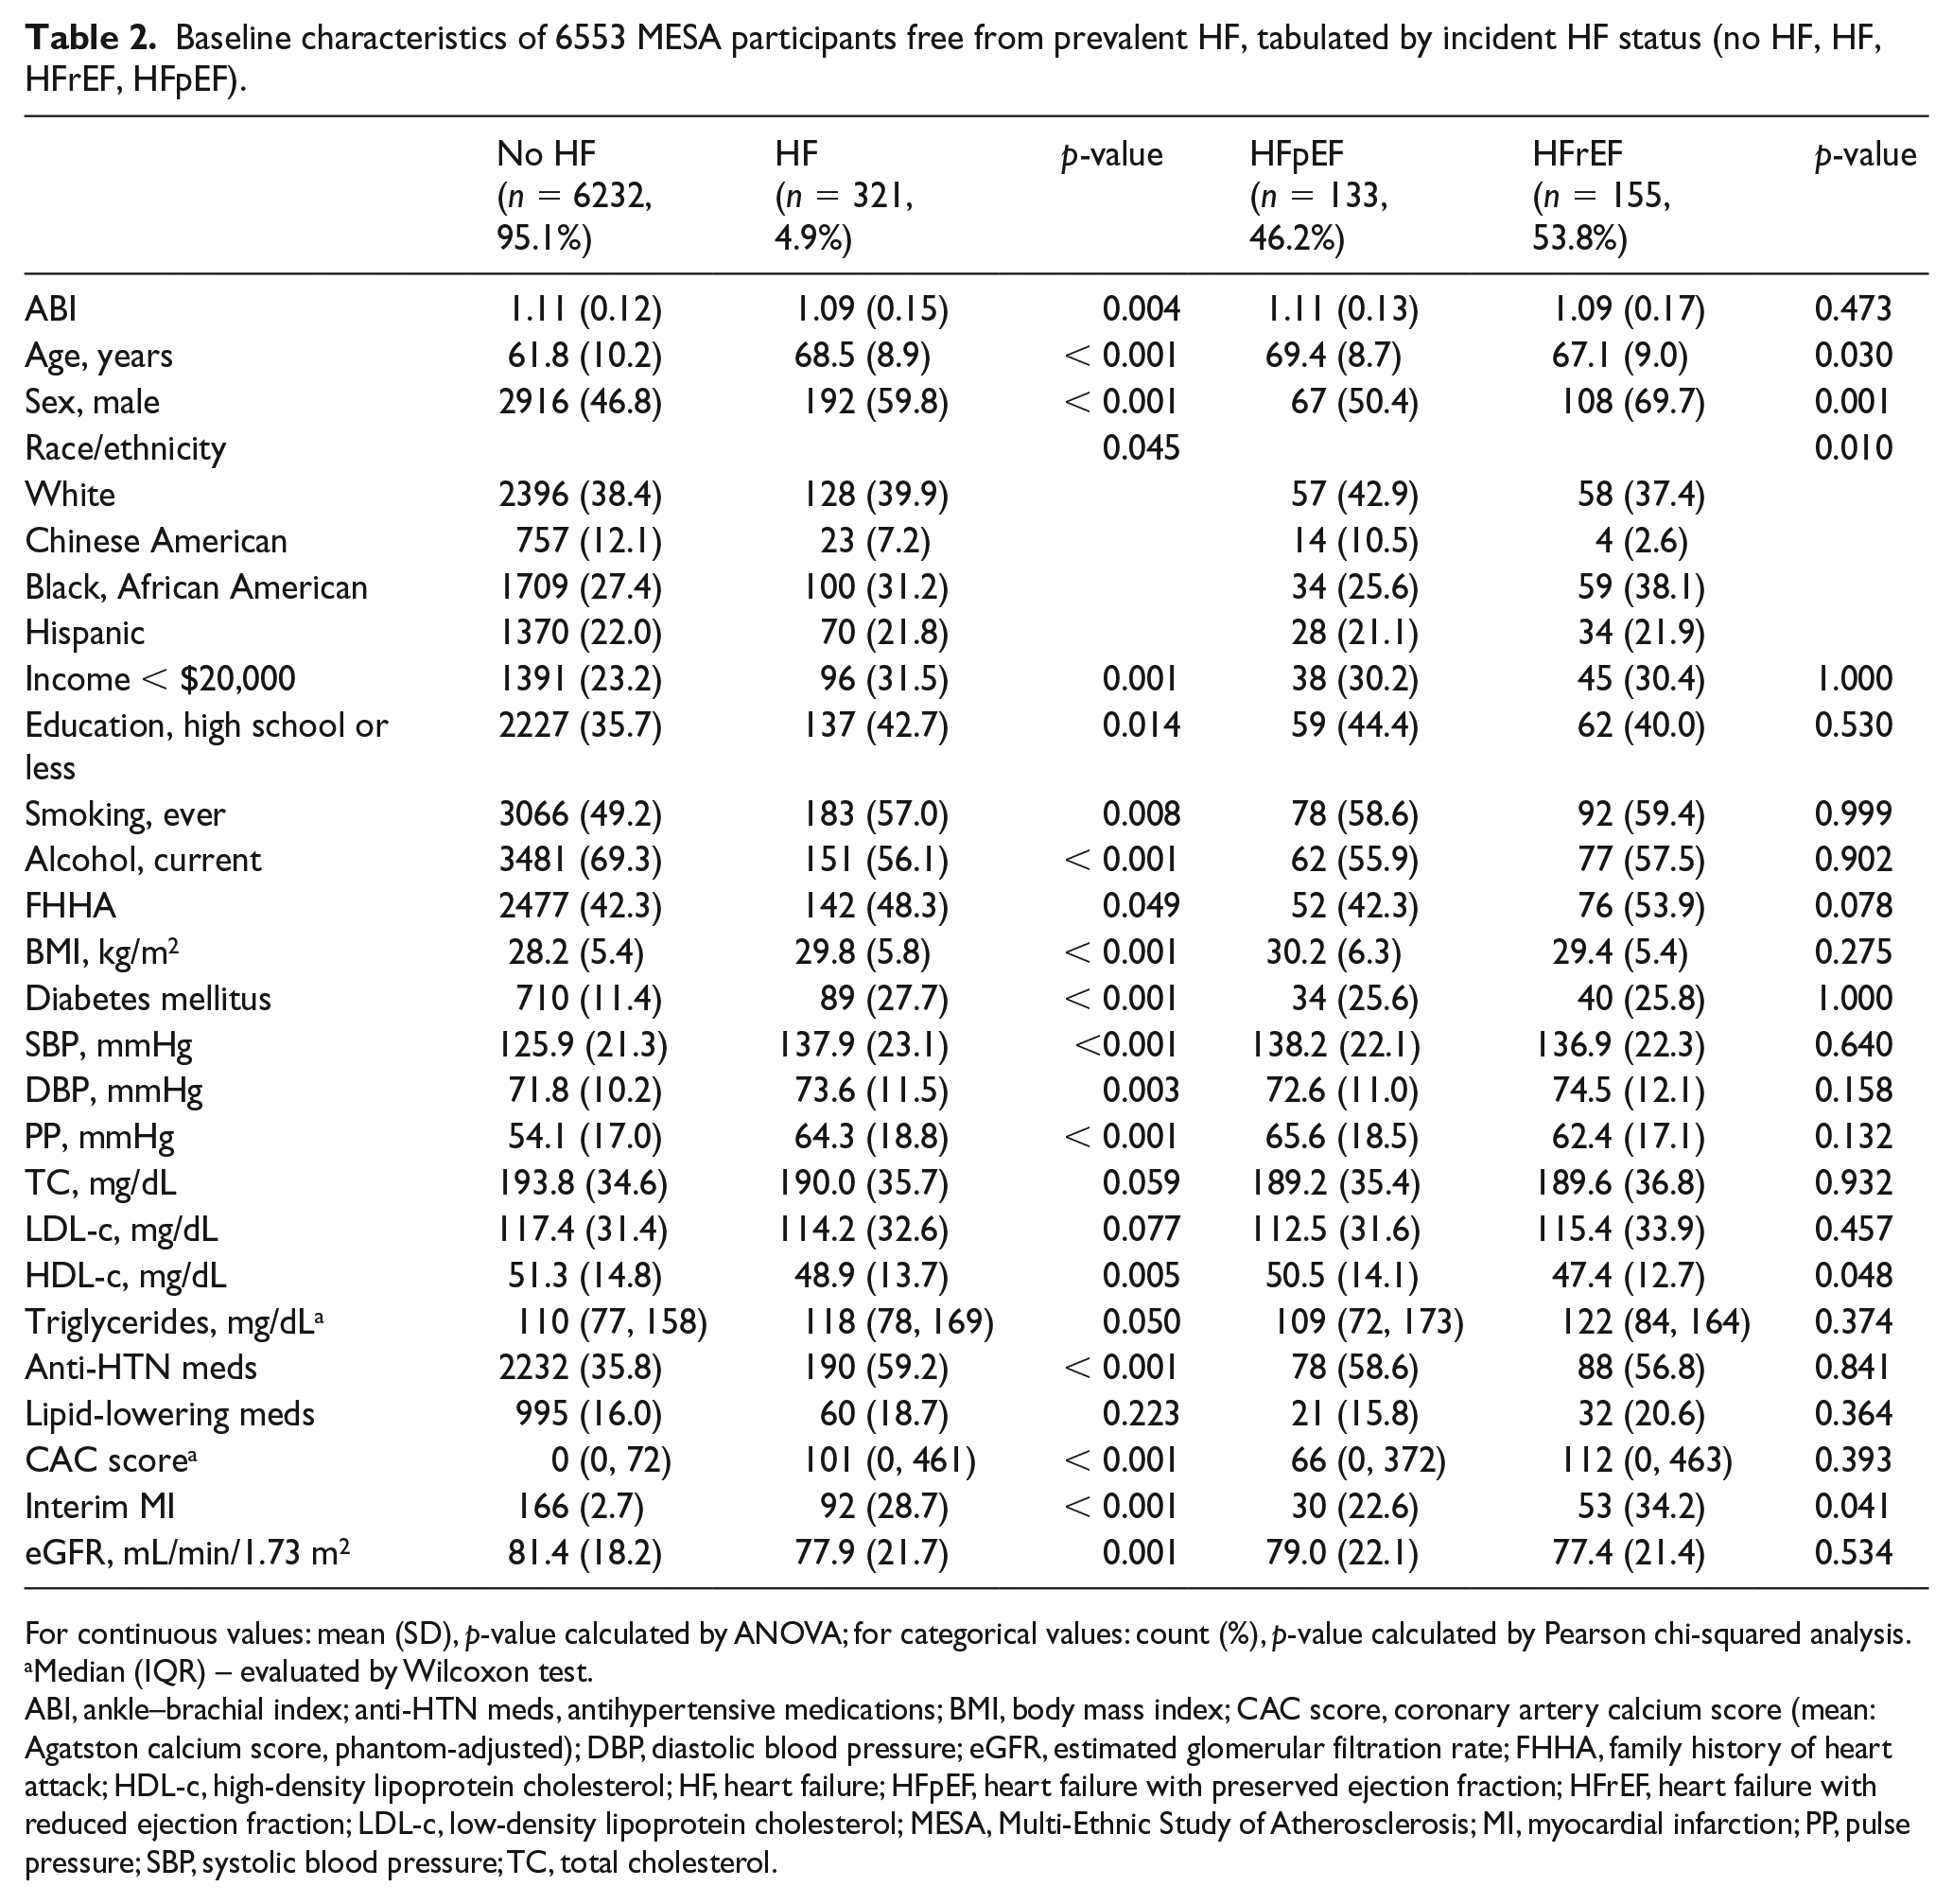
For continuous values: mean (SD), p-value calculated by ANOVA; for categorical values: count (%), p-value calculated by Pearson chi-squared analysis.
Median (IQR) – evaluated by Wilcoxon test.
ABI, ankle–brachial index; ANOVA, analysis of variance; anti-HTN meds, antihypertensive medications; BMI, body mass index; CAC score, coronary artery calcium score (mean: Agatston calcium score, phantom-adjusted); DBP, diastolic blood pressure; eGFR, estimated glomerular filtration rate; FHHA, family history of heart attack; HDL-c, high-density lipoprotein cholesterol; HF, heart failure; HFpEF, heart failure with preserved ejection fraction; HFrEF, heart failure with reduced ejection fraction; LDL-c, low-density lipoprotein cholesterol; MESA, Multi-Ethnic Study of Atherosclerosis; MI, myocardial infarction; PP, pulse pressure; SBP, systolic blood pressure; TC, total cholesterol.
In the Kaplan–Meier analyses (Figure 1A–C), participants with low ABI (≤ 0.90) and high ABI (> 1.40) had a higher risk for incident HF compared with normal ABI (log-rank p < 0.01 and p = 0.04, respectively). These risks for both groups compared to normal ABI remained significant for HFrEF (log-rank p < 0.01 for both) but not for HFpEF (log-rank p = 0.09 for low ABI and p = 0.79 for high ABI). The risk for incident HF was not significantly elevated for borderline-low ABI (0.90–1.00) compared to normal ABI for overall HF (log-rank p = 0.32), HFrEF (log-rank p = 0.75), or HFpEF (log-rank p = 0.62).
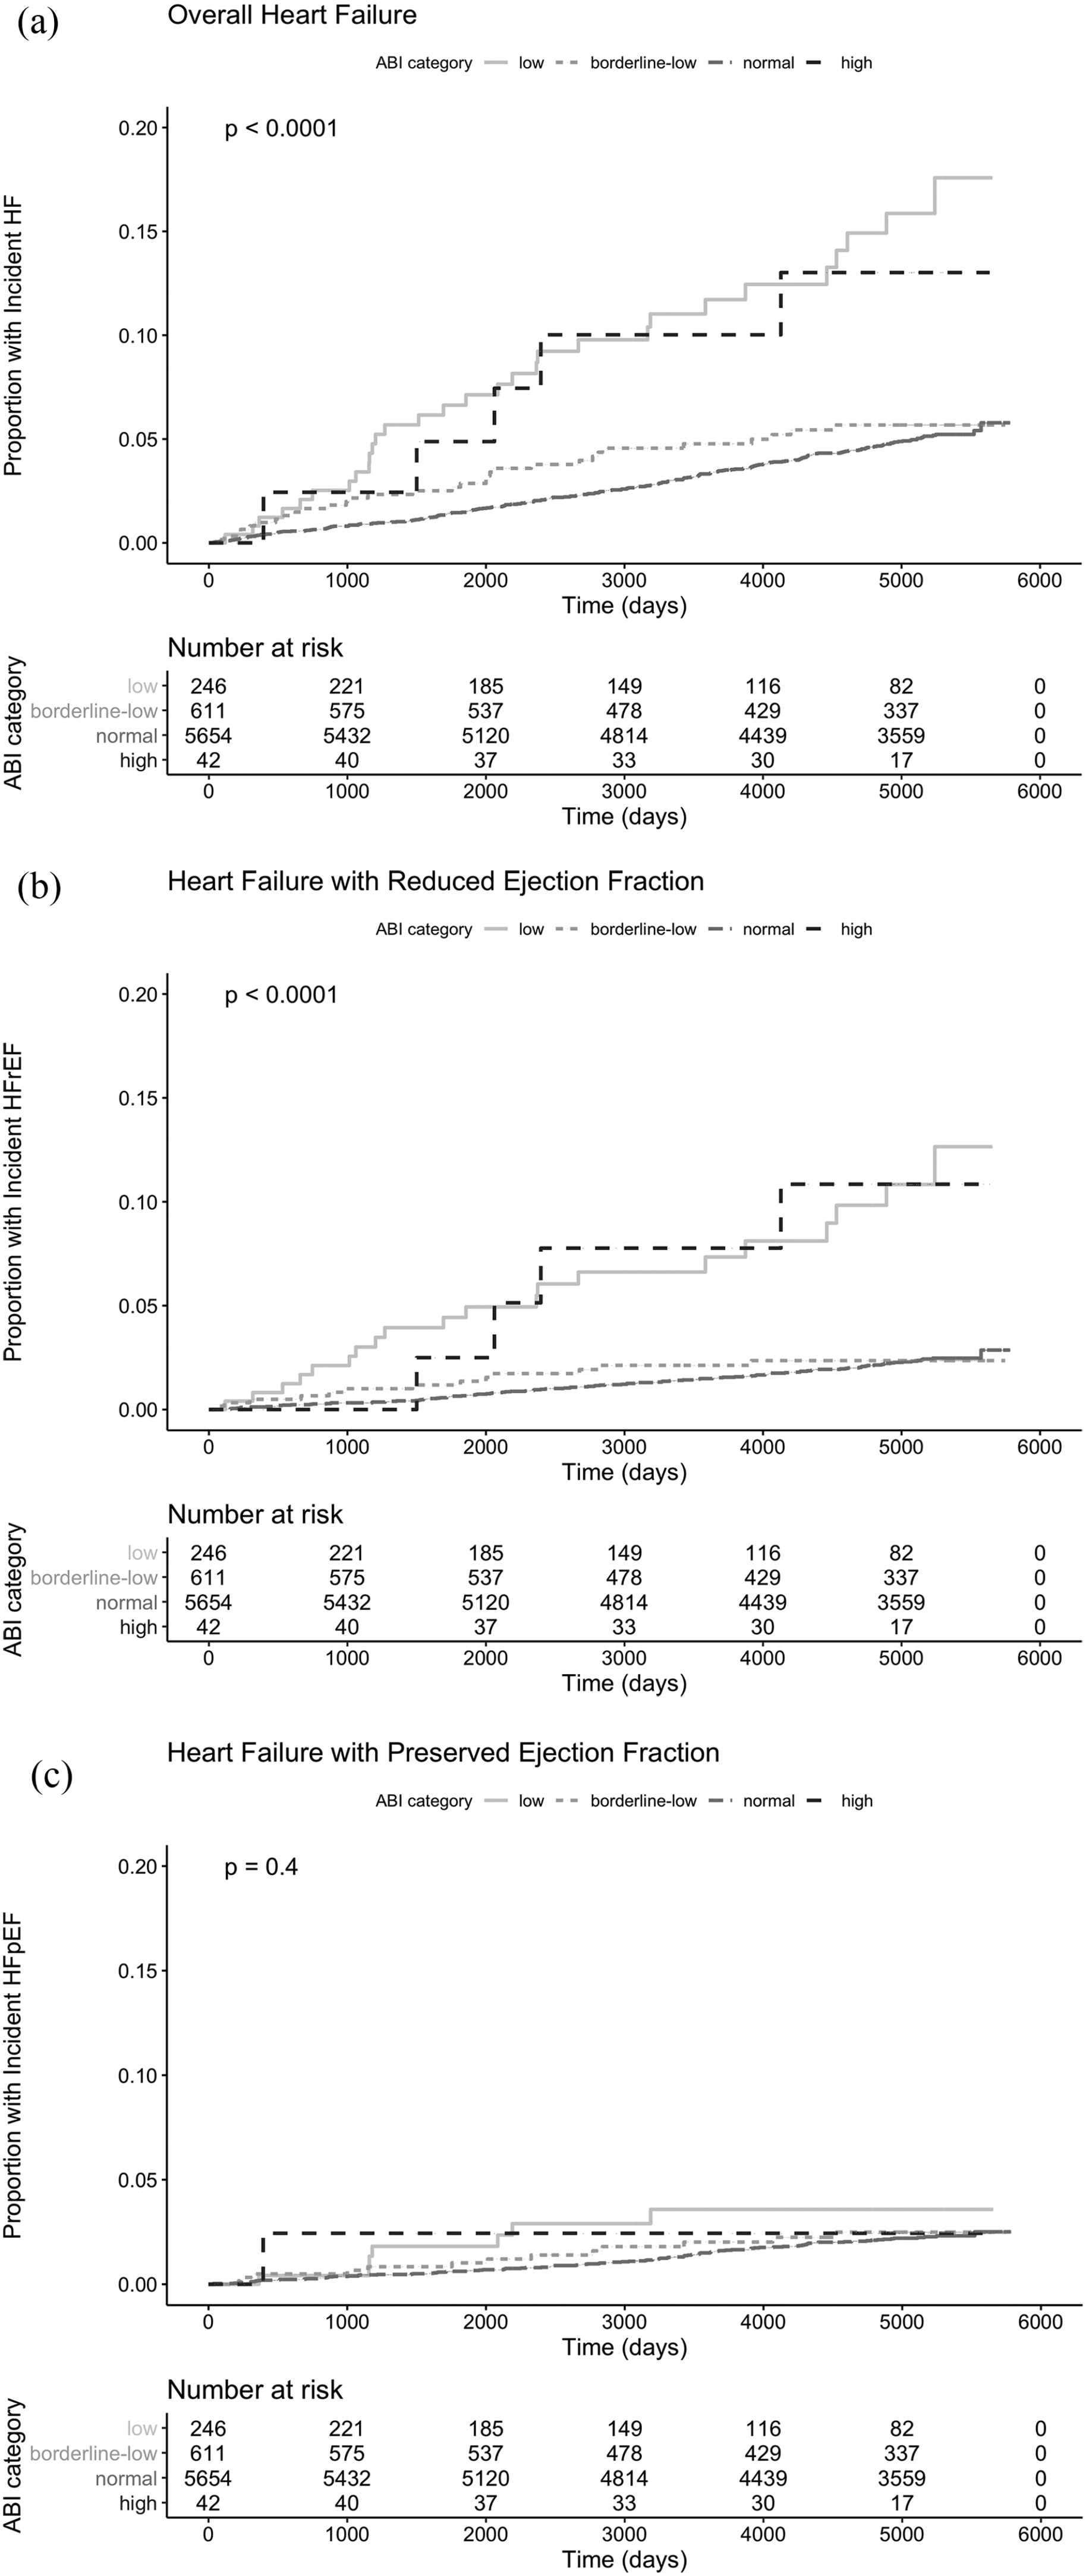
Cumulative incidence curves for incident HF, HFrEF, and HFpEF by ABI. Kaplan–Meier curve depicting cumulative risk of (A) HF; (B) HFrEF; and (C) HFpEF among (1) low ABI; (2) borderline-low ABI; (3) normal ABI; and (4) high ABI over a median follow-up period of 14 years.
Table 3 shows the results of the Cox proportional hazards analyses. In univariate analysis, low ABI was associated with a HR of 3.57 (95% CI 2.44–5.21, p < 0.01) for overall HF and 5.18 (95% CI 3.22–8.33, p < 0.01) for HFrEF. Adjusting for covariates in the multivariate model, the HR for low ABI was attenuated to 1.22 (95% CI 0.82–1.84, p = 0.33) for incident overall HF; attenuation was also was noted for HFrEF with a HR of 2.02 (95% CI 1.19–3.40), though the association remained significant (p = 0.01). HRs for HFpEF were not significant in both univariate models, HR 1.90 (95% CI 0.88–4.08, p = 0.10), and multivariate models, HR 0.67 (95% CI 0.30–1.48, p = 0.32), for low ABI. High ABI was associated with HF and HFrEF in unadjusted analysis with HRs of 2.86 (95% CI 1.18–6.94, p = 0.02) and 4.99 (95% CI 1.84–13.52, p < 0.01), respectively; however, both associations were not significant in multivariable analysis with HRs 1.46 (95% CI 0.59–3.60, p = 0.42) and 2.59 (95% CI 0.92–7.28, p = 0.07), respectively. HRs for HF, HFrEF, and HFpEF in the borderline-low ABI group were all not significant.
HRs for incident HF by ABI categorized by clinically relevant ranges (normal ABI is ref). Cox proportional hazards analysis of risk of incident HF by ABI level includes hierarchical adjustments (five models total).
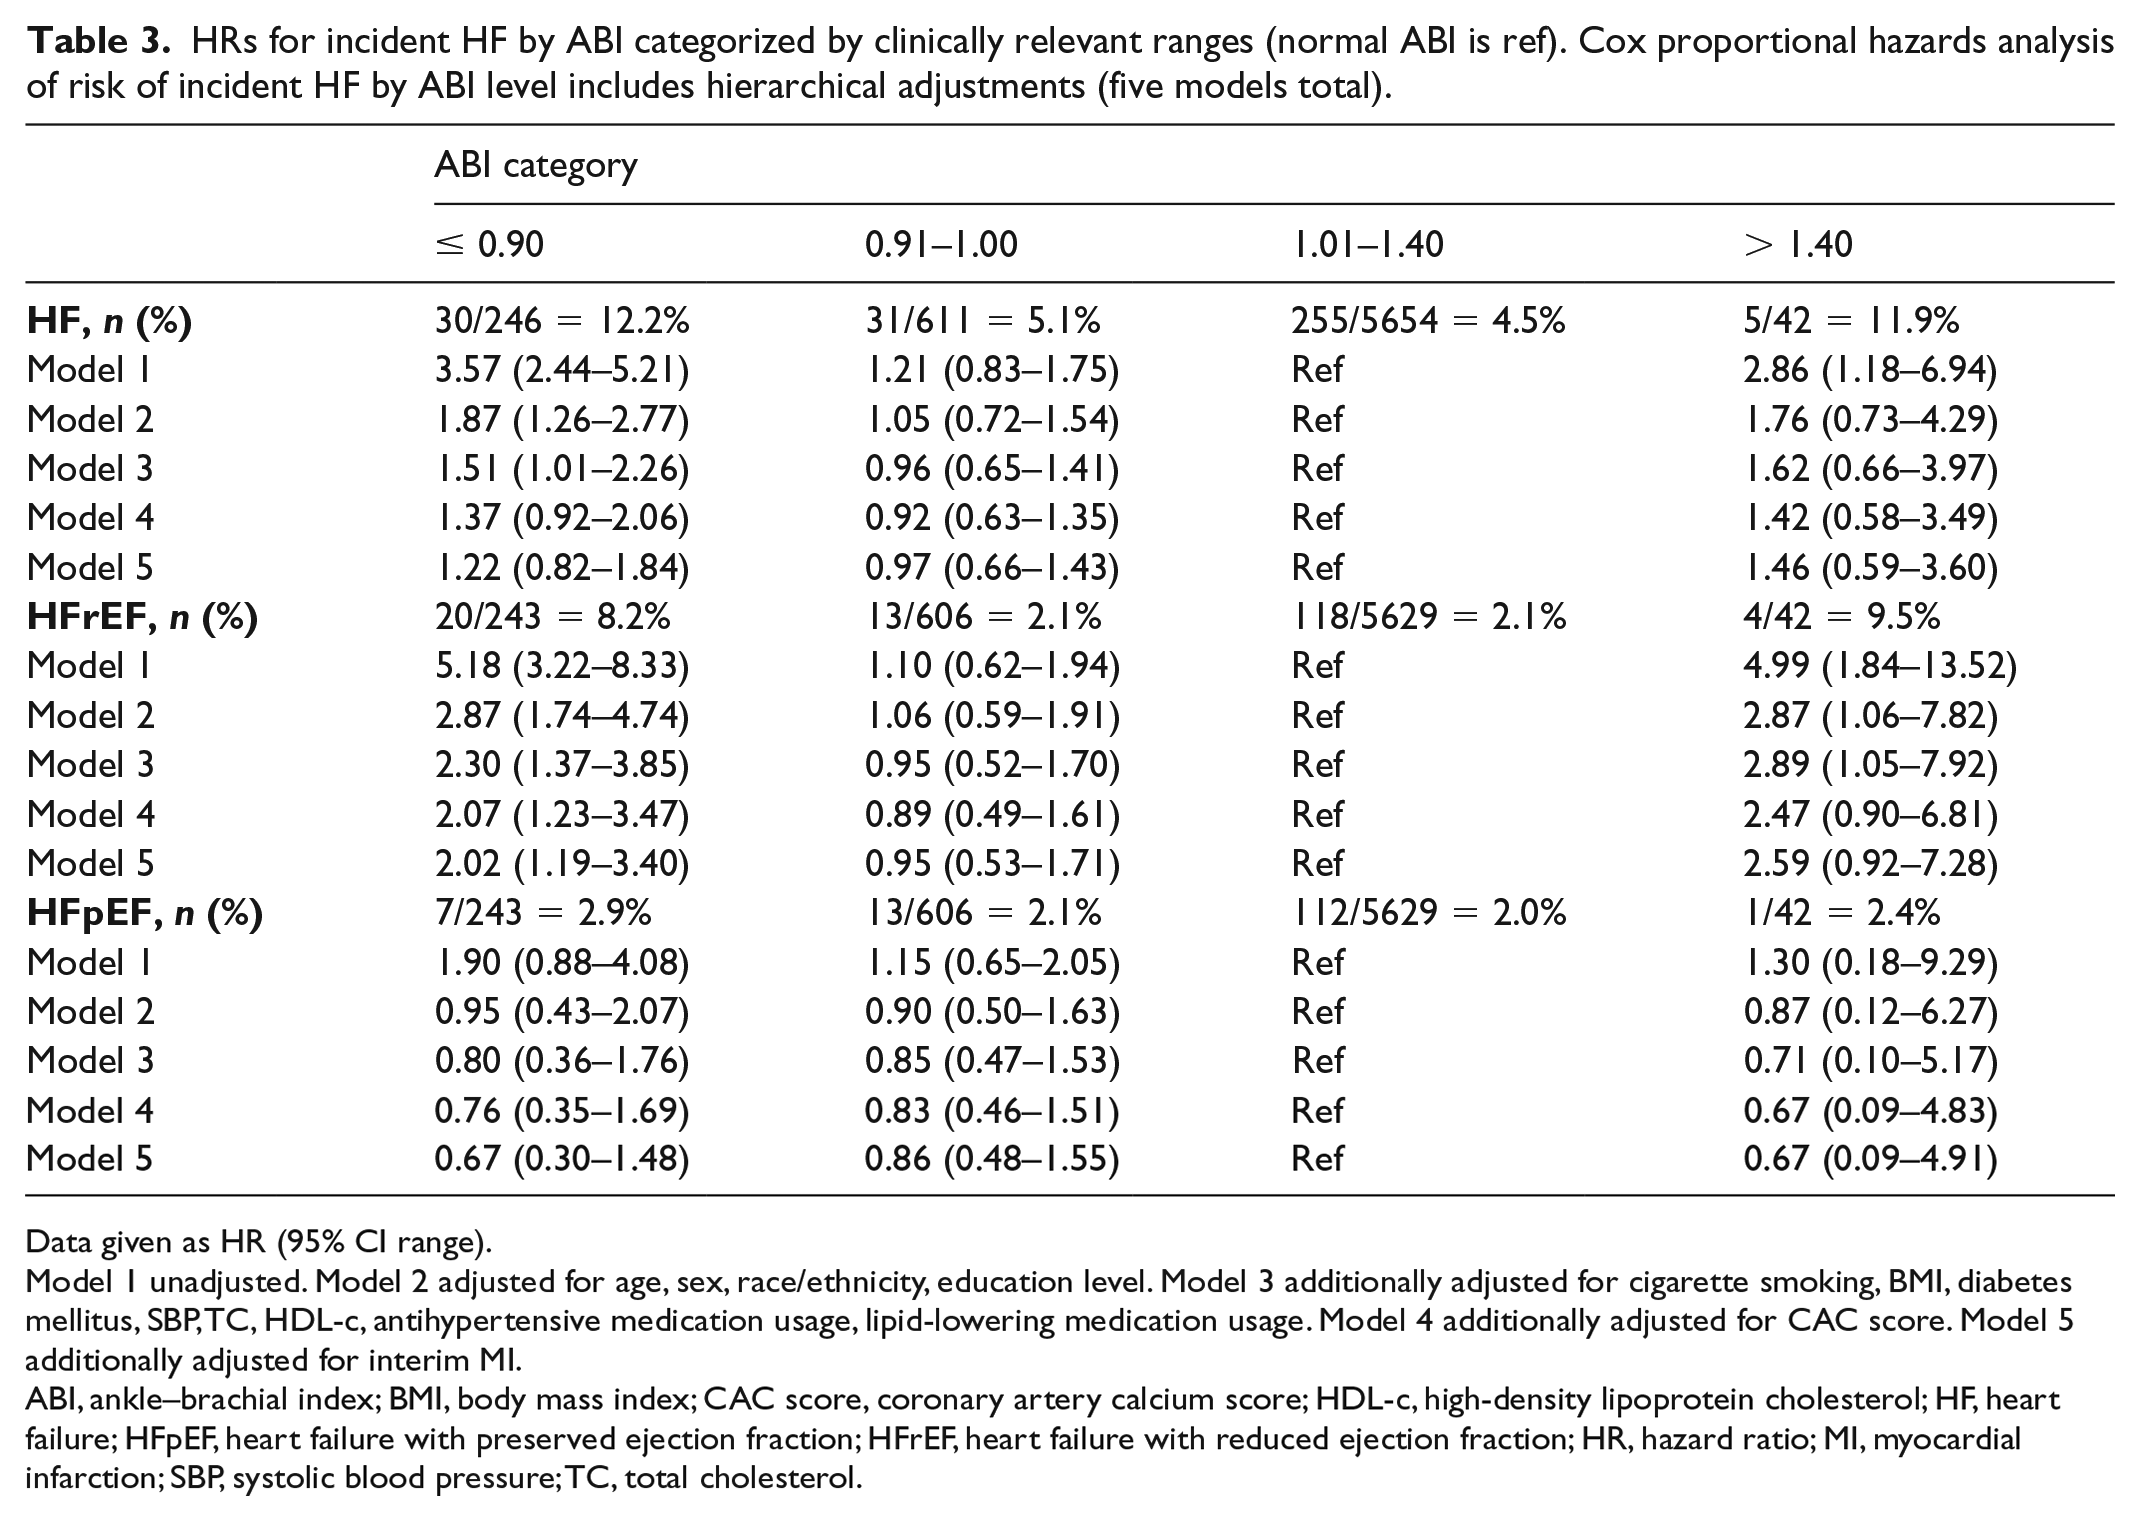
Data given as HR (95% CI range).
Model 1 unadjusted. Model 2 adjusted for age, sex, race/ethnicity, education level. Model 3 additionally adjusted for cigarette smoking, BMI, diabetes mellitus, SBP, TC, HDL-c, antihypertensive medication usage, lipid-lowering medication usage. Model 4 additionally adjusted for CAC score. Model 5 additionally adjusted for interim MI.
ABI, ankle–brachial index; BMI, body mass index; CAC score, coronary artery calcium score; HDL-c, high-density lipoprotein cholesterol; HF, heart failure; HFpEF, heart failure with preserved ejection fraction; HFrEF, heart failure with reduced ejection fraction; HR, hazard ratio; MI, myocardial infarction; SBP, systolic blood pressure; TC, total cholesterol.
Cubic spline analysis of risk of incident HF (Figure 2) showed a bimodal distribution for increased risk for HFrEF with particularly increased risk at ABI ⩽ 0.70 and ABI ⩾ 1.50 (Figure 2B). Risk for HFpEF increased as ABI increased within the high ABI range, though 95% CI was large (Figure 2C).
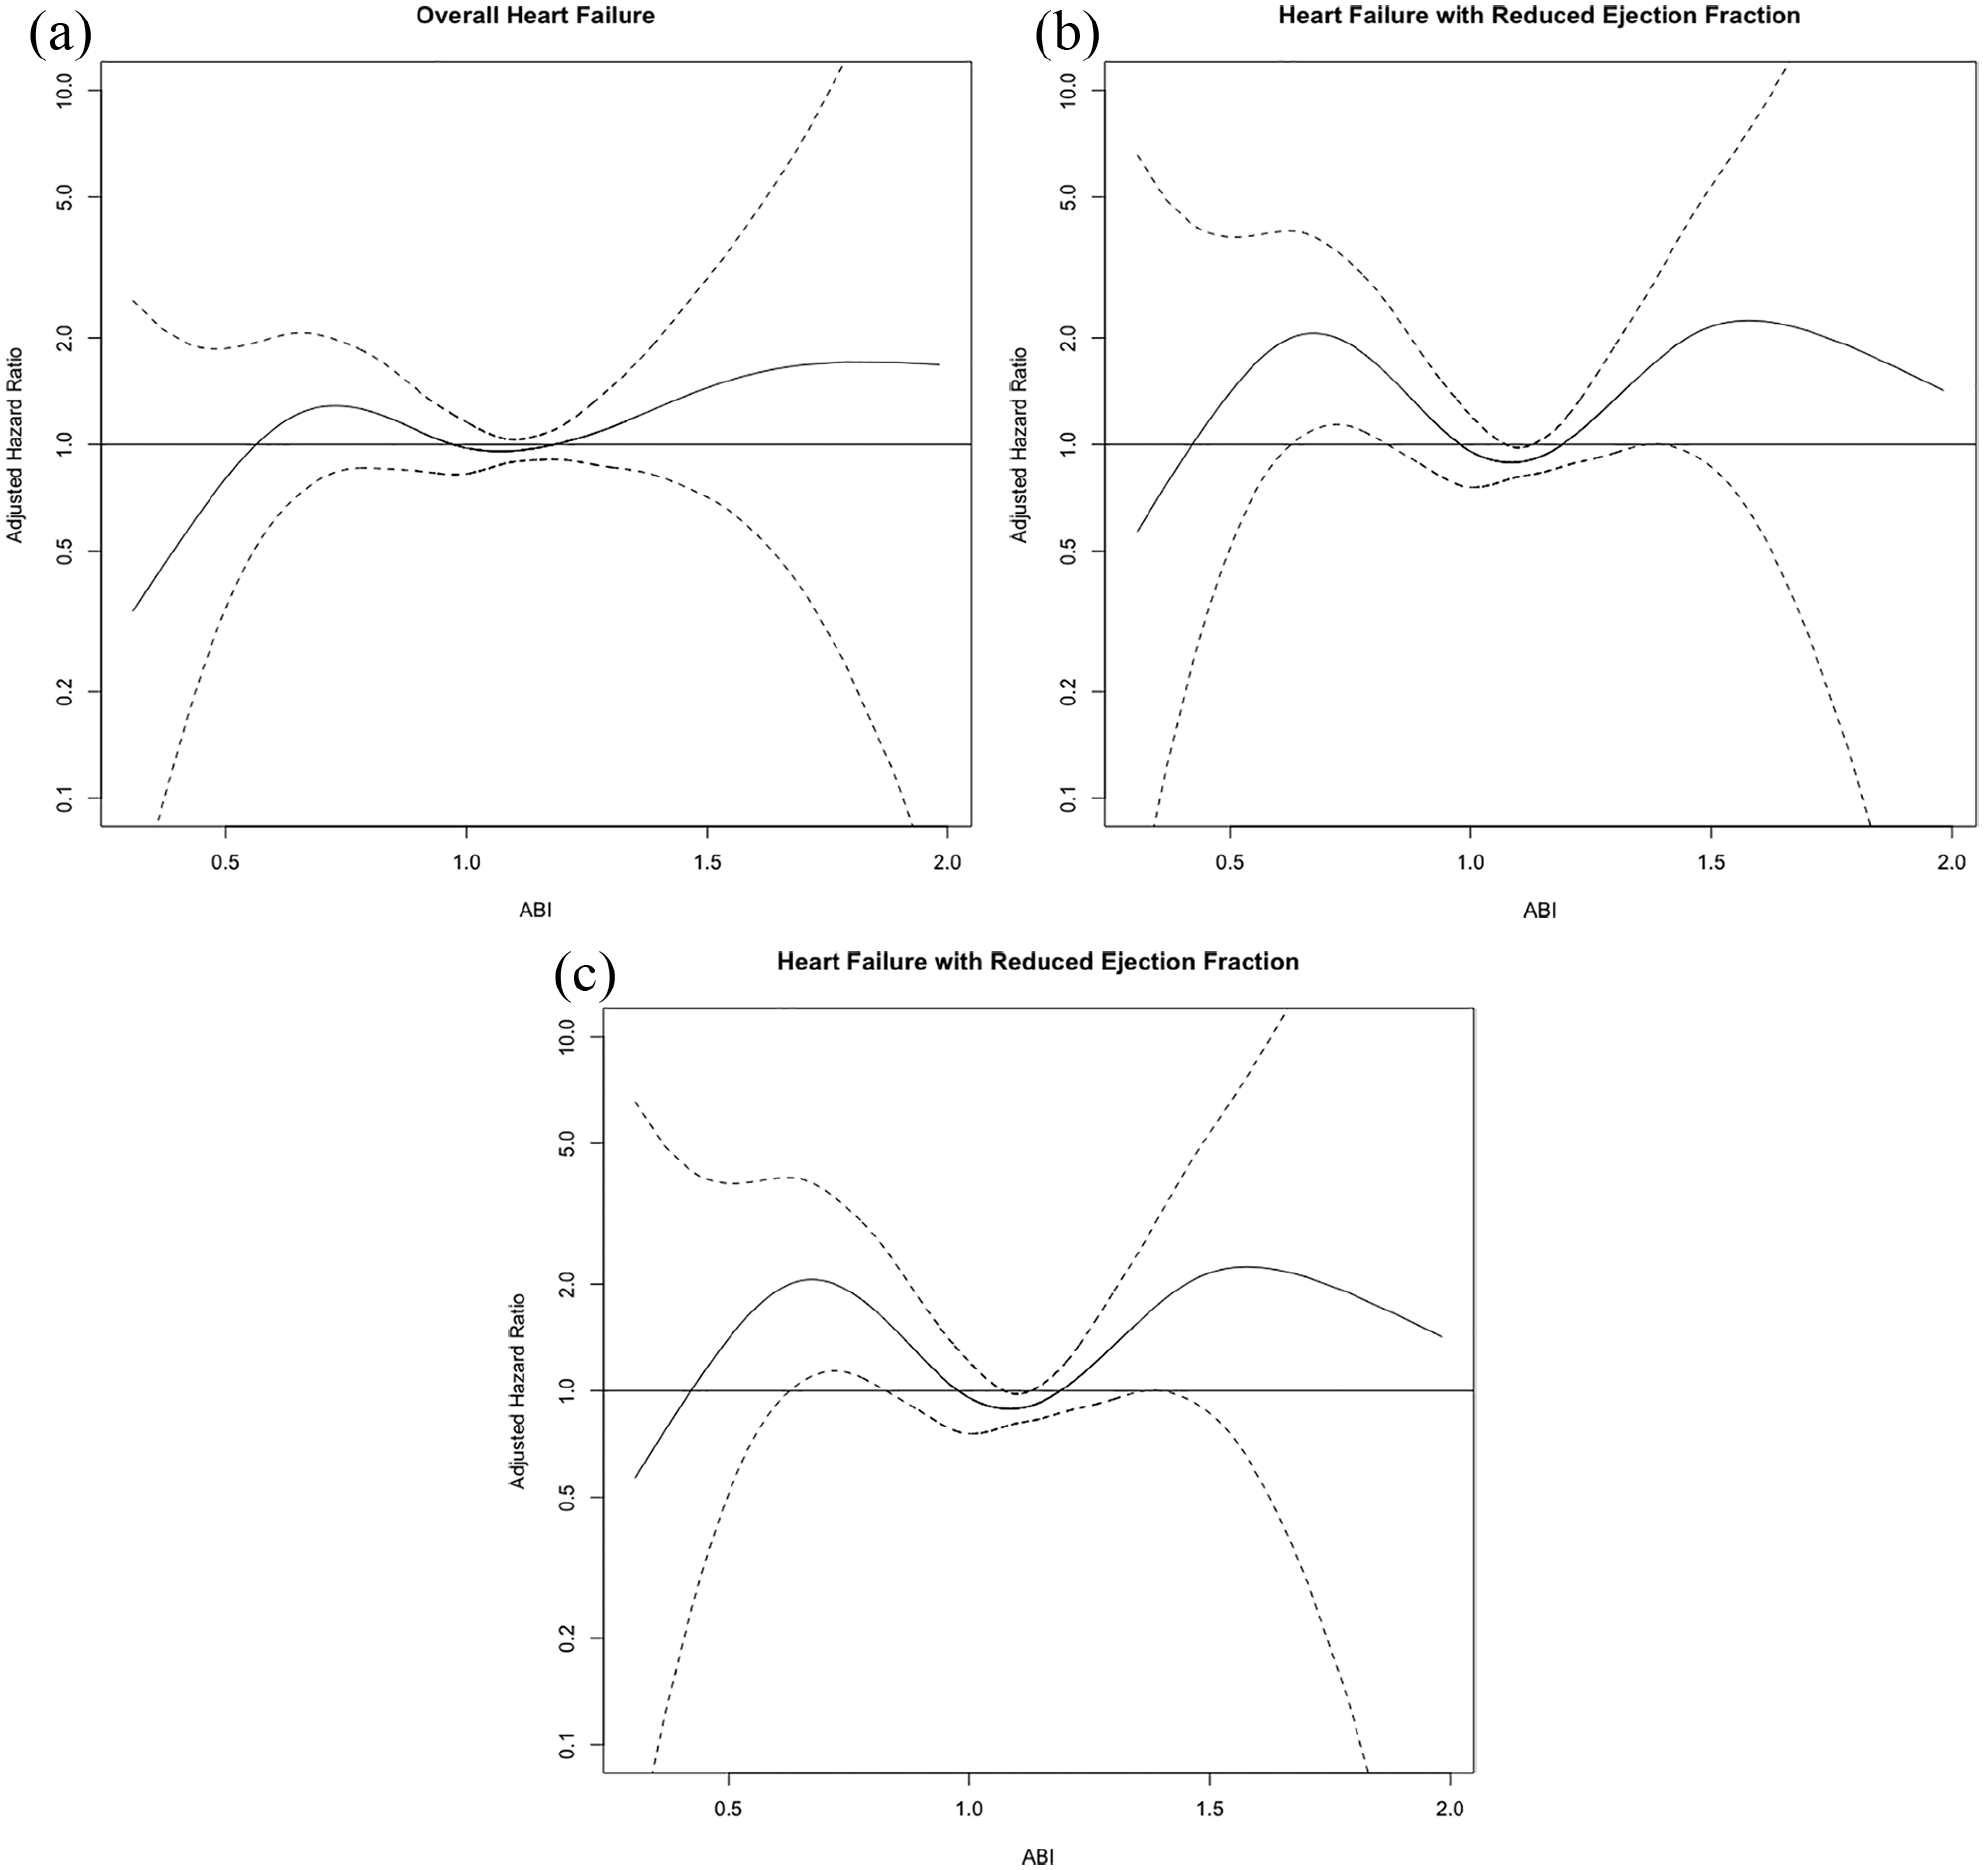
Cubic spline analyses of risk of incident HF by ABI with 95% CIs of the spline, fully adjusted. (A) Overall HF; (B) HF with reduced ejection fraction; and (C) HF with preserved ejection fraction.
Cox proportional hazards ratios of ABI as a continuous variable were separately calculated for ABI < 1.1 and ABI ⩾ 1.1 (Table 4). Analysis for ABI < 1.1 showed a HR for HFrEF of 1.27 (95% CI 1.05–1.54, p = 0.02) per 1 SD lower ABI after adjusting for Model 4 covariates; the association became statistically insignificant after additional adjustment for interim MI with a HR of 1.21 (95% CI 0.99–1.48, p = 0.07). Analysis for ABI ⩾ 1.1 showed a HR of 1.22 (95% CI 0.93–1.59) for HFrEF and 1.15 (95% CI 0.82–1.62) for HFpEF after adjusting for Model 4 covariates; a HR of 1.30 (95% CI 1.00–1.71) for HFrEF and a HR of 1.22 (95% CI 0.87–1.72) for HFpEF after additionally adjusting for interim MI.
Association between one SD of continuous ABI with incident HF in MESA with Cox proportional hazards after a median of 14 years of follow-up.
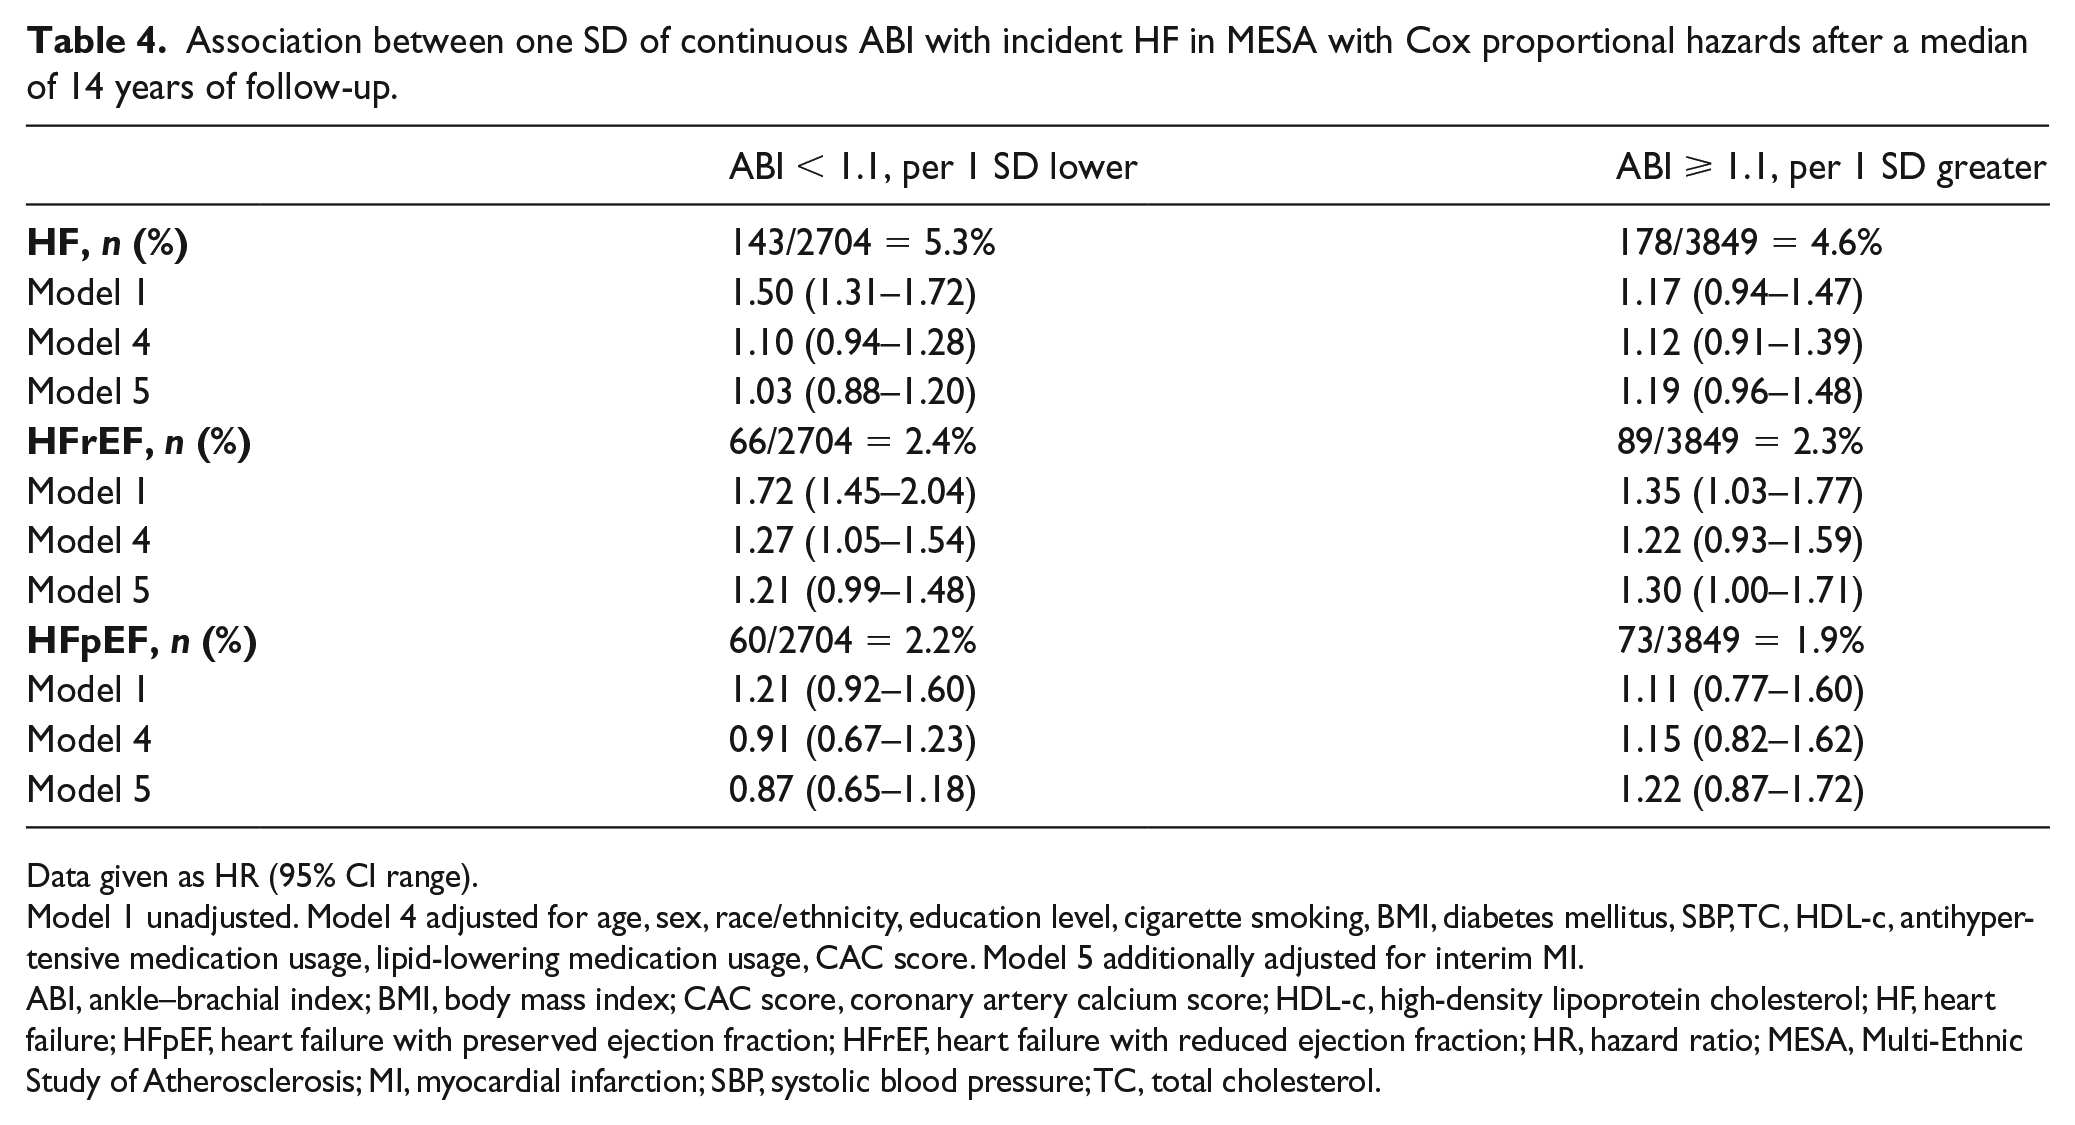
Data given as HR (95% CI range).
Model 1 unadjusted. Model 4 adjusted for age, sex, race/ethnicity, education level, cigarette smoking, BMI, diabetes mellitus, SBP, TC, HDL-c, antihypertensive medication usage, lipid-lowering medication usage, CAC score. Model 5 additionally adjusted for interim MI.
ABI, ankle–brachial index; BMI, body mass index; CAC score, coronary artery calcium score; HDL-c, high-density lipoprotein cholesterol; HF, heart failure; HFpEF, heart failure with preserved ejection fraction; HFrEF, heart failure with reduced ejection fraction; HR, hazard ratio; MESA, Multi-Ethnic Study of Atherosclerosis; MI, myocardial infarction; SBP, systolic blood pressure; TC, total cholesterol.
Discussion
In a large ethnically diverse population free of clinical CVD/HF at baseline, we demonstrated an association between low ABI (≤ 0.90) and incident hospitalized HFrEF that remained significant even after adjustment for demographics, traditional CVD risk factors, CAC, and interim MI compared to normal ABI (p < 0.01). A similar association was seen when ABI was measured as a continuous variable; however, after additional adjustment for interim MI, the association was attenuated and no longer significant.
Low ABI indicates PAD and systemic atherosclerosis, and elevated ABI typically indicates vascular calcification. 25 Previously, low ABI was shown to be a predictor for HFpEF more than HFrEF. 16 Nishimura et al. suggested that this marker of atherosclerosis indicates vascular abnormality and predisposes to vascular stiffness which has been implicated in HFpEF, though that study had notable limitations including a homogeneous population, oscillometric ABI measurement which overestimates ABI, Teichholz method EF measurement which underestimates EF, and a short follow-up period of 4.8 years on average. Our results contradict those as we found baseline low and high ABI to be associated with HFrEF whereas no ABI level was associated with incident HFpEF, though we may be underpowered to detect an association between high ABI and incident HFpEF.
Gupta et al. found a significant association between the low ABI (< 0.90) group and overall HF in the Atherosclerosis Risk in Communities (ARIC) Study, even in fully adjusted models (including interim MI). 13 We did not find such an association to persist after adjusting for CAC score and interim MI. Our findings suggest that low ABI may correlate to risk of HF by way of coronary heart disease and interim MI.
Ischemic heart disease from coronary artery disease is a well-known major risk factor for HF. 26 Ischemia and infarction lead to left ventricular (LV) dysfunction via sympathetic catecholamine activation, hibernation, and LV remodeling, which can cause systolic dysfunction.27–29 The association we confirmed between low ABI (< 0.90), a marker of systemic atherosclerosis, and HFrEF is consistent with this understanding. However, in continuous ABI analysis, the attenuation of the association after adjusting for interim MI suggests that obstructive epicardial disease leads to ischemic cardiomyopathy and supports the concept that PAD is a marker of overall atherosclerosis rather than a primary contributor to HFrEF development.
High ABI analyses were limited by small sample size. There is a possible, though statistically insignificant, association between high ABI and both HFpEF and HFrEF. High ABI is related to arterial stiffening due to vascular calcification in the arterial wall. 30 Ventricular-vascular stiffening is one pathophysiology of HFpEF that has been suggested.31–33 Our study supports the association between vascular calcification and stiffness as measured by high ABI and incident HFpEF, though this association was not statistically significant. The relationship between high ABI and incident HFrEF may be explained by chronic ischemia due to vascular inflammation and stiffening that leads to the previously mentioned neurohormonal changes and LV remodeling. Given few HF cases in the high ABI group (n = 5), we were underpowered to adequately establish associations between high ABI and HF subtype; future studies that specifically study those with high ABI and the development of both HFrEF and HFpEF are necessary.
Strengths and limitations
Strengths of this study include a large ethnically and geographically diverse population without baseline clinical CVD who were well characterized by standardized protocols, which increases generalizability of results. The duration of follow-up was long and outcomes were adjudicated by formal review panel. All participants had baseline CT for presence of CAC. ABI was measured with guideline-recommended Doppler BP methods as opposed to an oscillometric method which can overestimate ABI; additionally, ABI was rigorously obtained using the higher ankle pressure and average brachial pressure as opposed to random extremity measurements. There were also several limitations of our study that should be noted. Only hospitalized HF events were included in the outcome definition, and thus milder cases of HF treated only in the outpatient setting may have been missed. HFpEF may have been underdiagnosed and we had few participants with ABI > 1.40 (n = 42), which limits statistical power. Furthermore, this was an observational study which limits our ability to evaluate for causality of associations. Despite adjustment for a number of important covariates, residual confounding may in part explain some of the associations noted.
Conclusions
In this US-based cohort without a history of CVD or HF at baseline, low ABI (≤ 0.90) was associated with incident HF, specifically HFrEF. This association was independent of CVD risk factors and CAC but not interim MI. Future studies with higher sample sizes of high ABI participants are required to perform analysis with adequate statistical powering to allow more meaningful conclusions to be made for this group.
Footnotes
Acknowledgements
Declaration of conflicting interests
The authors declared no potential conflicts of interest with respect to the research, authorship, and/or publication of this article.
Funding
The authors disclosed receipt of the following financial support for the research, authorship, and/or publication of this article: Dr Shah is supported by National Institutes of Health grants R01 HL107577, R01 HL127028, and R01 HL140731. The views expressed in this manuscript are those of the authors and do not necessarily represent the views of the National Heart, Lung, and Blood Institute; the National Institutes of Health; or the US Department of Health and Human Services.