
Abstract
The ankle–brachial index (ABI) is a predictor of cardiovascular events, mortality and functional status. Some studies have noted a higher prevalence of peripheral artery disease in females compared to males. Differences in height might account for these observed sex differences, but findings are conflicting. The 2003–2004 National Health and Nutrition Examination Survey (NHANES) cohort includes participants from 15 geographic locations, selected annually to represent the general population. Sample-weighted multivariable linear and logistic regression modeling was performed with ABI as the dependent variable and height and sex as primary exposure variables of interest. There were 3052 participants with ABI data (mean age 57 years, 51% female). The mean (±SE) ABI was 1.09 (±0.006) and 1.13 (±0.005) for females and males, respectively (p < 0.0001). Shorter height was associated with a low ABI (OR 0.91 per 4 cm, 95% CI: 0.86–0.96; p=0.001). In a fully adjusted model, female sex was associated with a low ABI (OR 1.34, 95% CI: 1.04–1.72; p=0.025) independent of height and traditional cardiovascular disease (CVD) risk factors. Age, diabetes, tobacco use, known CVD, hypertension and race were associated with a low ABI (all p < 0.001). The ABI was 0.03 lower in females than in males in the general population and in a healthy cohort. Lower ABI values in healthy females do not appear to be due to occult vascular disease but rather a normal phenomenon with some contribution from height. Therefore, population sex-specific ABI thresholds should be utilized in the diagnosis of peripheral artery disease to account for these intrinsic differences.
Introduction
Peripheral artery disease (PAD) has been associated with functional limitations, reduced quality of life and an increased risk of major cardiovascular events and mortality. 1 The ankle–brachial index (ABI) threshold most commonly used to diagnose lower-extremity PAD is ⩽ 0.90, with a sensitivity and specificity > 90% compared with gold standard angiography. 2 Even in the absence of symptoms, an abnormal ABI is a reliable marker of future cardiovascular events.3,4 Although earlier studies suggested that PAD was more common in men, more recent studies show a prevalence of PAD in women at least the same as in men, if not higher. 5
A few studies have noted sex differences regarding ABI values. In the Rotterdam Study, the average ABI in women was 1.03 compared with 1.08 in men. 6 In the Multi-Ethnic Study of Atherosclerosis, women had ABI values 0.02 lower than men in a fully adjusted model. 7 It is not obvious whether these sex differences in ABI are actually related to the atherosclerotic process or if some other intrinsic anatomic (smaller arteries) or physiologic factor is involved. 7 There is some speculation that differences in height might account for these sex differences, but findings are conflicting.5,8 To our knowledge, this relationship has not been examined in the National Health and Nutrition Examination Survey (NHANES) population. Therefore, the purpose of this study is to investigate the association between sex, height and ABI in the general population, independent of traditional PAD risk factors.
Methods
Study population
We analyzed ABI data from the NHANES 2003–2004 surveys. NHANES is an in-depth, complex, ongoing series of surveys conducted by the National Center for Health Statistics to assess the health of the US civilian, non-institutionalized population. The main components of the study include an interview in the participants’ homes, a medical exam, and several medical and laboratory tests. Comorbidities are assessed by self-report. NHANES over-samples individuals aged 60 years and older, African Americans and Hispanics to produce more reliable statistics. ABI measurements were only done in participants 40 years of age or older. Participants from 15 geographic locations are selected annually to represent the general population. The National Center for Health Statistics Ethics Review Board approved the protocols, and informed consent was obtained from all subjects.
Ankle–brachial index measurements
The ABI measurements were completed using the Parks Mini-Lab IV, Model 3100, a vascular testing device. The appropriate size cuff was determined by measuring the subject’s bare upper arm at the midpoint. In the supine position, systolic blood pressure was measured in one upper extremity, the right brachial artery, if accessible, and both ankles (posterior tibial arteries) with an 8.1 MHz Doppler probe. In subjects aged 40–59 years, each pressure was measured twice but only once for subjects aged 60 years and older. The ABI was automatically calculated by the computer system for each leg as the ankle pressure divided by the arm pressure. These measurements were verified by the National Center for Health Statistics before data release. Using an ABI cut-off of < 1.0 increases sensitivity for significant PAD to as high as 100%. 9 Therefore, for our logistic regression models, we defined a low ABI as < 1.0 in either leg (to include borderline values of 0.91–0.99). We also analyzed ABI as a continuous variable in linear regression models. Participants with an ABI over 1.4 (n=34) were excluded from this analysis, as these individuals generally have artificially elevated lower-extremity arterial pressures from calcified arterial vessels.
Other measures
Demographics including age and race were collected in the home prior to the health examinations. History of atherosclerotic cardiovascular disease (CVD) was self-reported and included history of coronary heart disease, heart attack, or stroke. History of tobacco use, hypertension and diabetes mellitus were also based on participant self-report. Standing height was measured with a fixed stadiometer with a vertical backboard and movable headboard. Proper vertical positioning was ensured per protocol by trained health technicians. Weight was measured on a Toledo scale, in pounds and converted to kilograms in the automated system. Blood specimens were collected and stored under appropriate temperature conditions until they were shipped to Johns Hopkins University Lipoprotein Laboratory for testing. Non-high-density lipoprotein (HDL) cholesterol was calculated by subtracting direct HDL cholesterol from measured total cholesterol.
Statistical analysis
Descriptive statistics and proportions were calculated by considering the survey design and using appropriate NHANES sampling weights. The sample weights account for the complex sample design, survey non-response, and the planned over-sampling of selected population subgroups. Baseline characteristics by sex were compared using the Student’s t-test. Multivariable logistic and linear regression modeling were performed with height and sex as the primary predictor variables of interest. Low ABI was the dependent, dichotomous variable in the logistic models. Sample weighting was implemented to adjust the collected data to represent the general population. Other independent variables included age, race, body mass index (BMI), tobacco use, known CVD, hypertension, diabetes mellitus and non-HDL cholesterol. A backward elimination model selection technique was performed to identify significant covariates. Adjusted odds ratios (ORs) and 95% confidence intervals (CIs) are reported for the logistic multivariable analysis. All analyses were performed using SAS University Edition software (SAS Institute Inc., Cary, NC, USA). Multivariable linear regression models were performed to estimate the ABI difference between males and females.
Results
Cohort characteristics
A total of 3052 participants aged ⩾ 40 years of age were included in the study. Baseline characteristics of the participants by sex are shown in Table 1. The study population included 51% women (mean age 57 years). Non-HDL cholesterol levels and the percentage of participants with CVD, hypertension, and diabetes did not differ between males and females. The percentage of current smokers was lower in females (18% vs 25% for males; p < 0.0001).
Study population characteristics by sex.
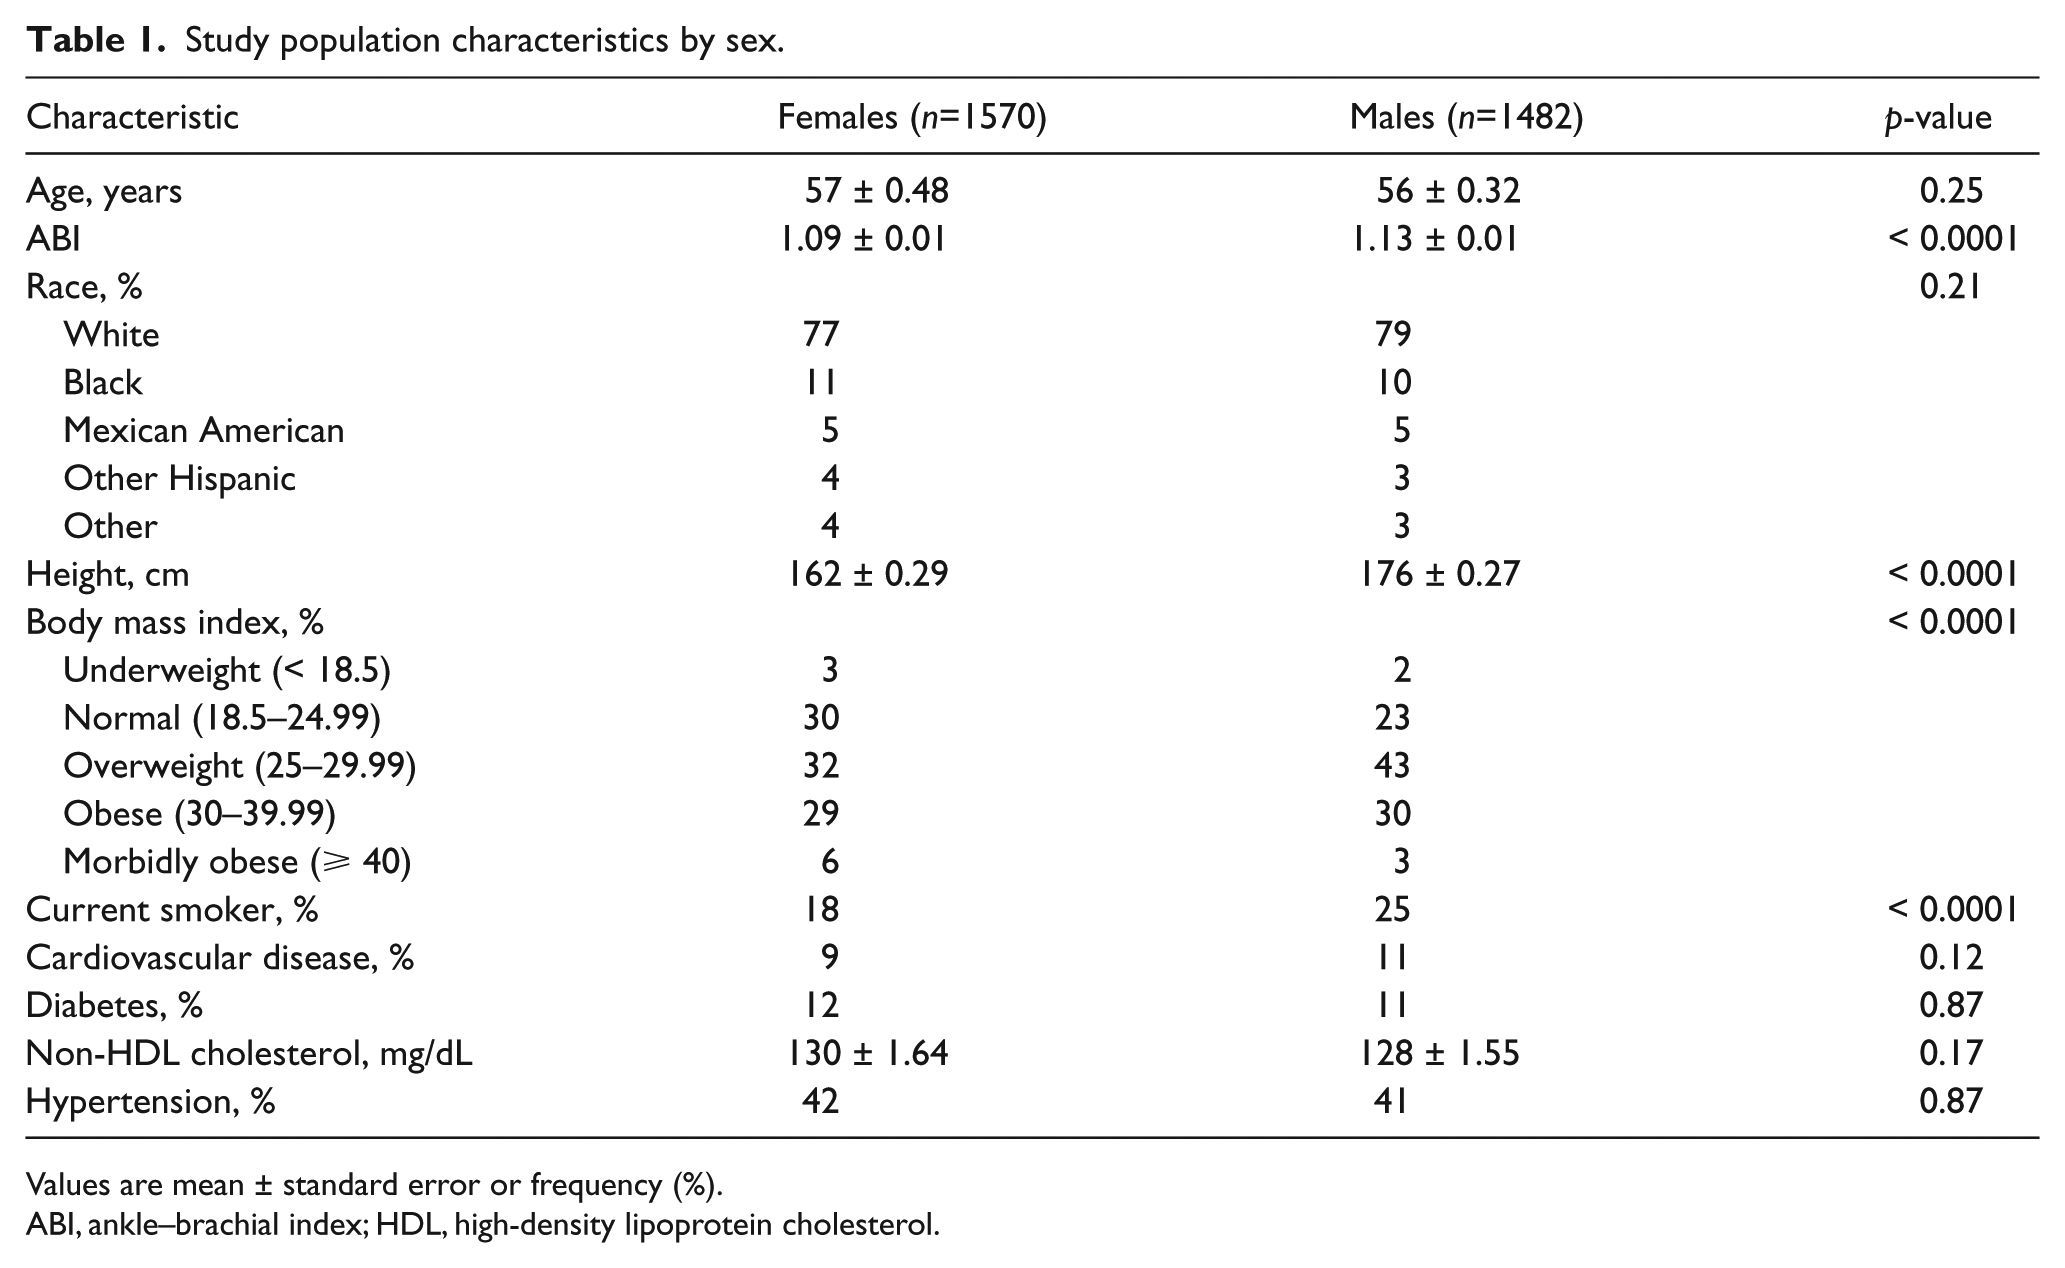
Values are mean ± standard error or frequency (%).
ABI, ankle–brachial index; HDL, high-density lipoprotein cholesterol.
Females had a higher prevalence of a low ABI when compared to men (18% vs 14%, respectively; p < 0.0001). The sample-weighted mean (±SE) ABI was 1.09 (±0.006) and 1.13 (±0.005) for females and males, respectively (p < 0.0001). Figure 1 displays the distribution of the ABI in NHANES males and females. The median ABI for females (1.09 ± 0.13) is lower than the median ABI for males (1.14 ± 0.15) (p < 0.0001). Height differed by sex, with females approximately 14 cm shorter than men (p < 0.0001). Figure 2 demonstrates distribution of the ABI normalized to height. Interestingly, the mean ABI, when normalized to height, is lower in males (6.43 × 10⁻³ ± 0.0009) compared to females (6.76 × 10⁻³ ± 0.0008) – the reverse finding. This small difference is statistically significant (p < 0.0001). The histograms do not consider age or the survey design. To incorporate age and sampling weights, regression analyses were performed (more below). In a sensitivity analysis that only includes healthy NHANES participants with ABI data (no CVD, diabetes, smoking, hypertension, or high cholesterol), these findings are similar (mean ABI 1.11 vs 1.15 in females and males, respectively (p < 0.0001); see the figures in the supplementary material).
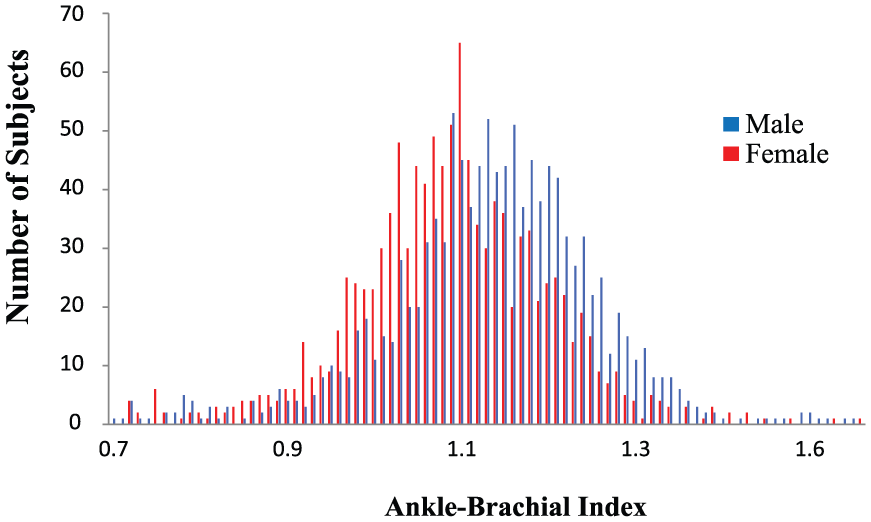
Distribution of raw ABI values in NHANES males and females.
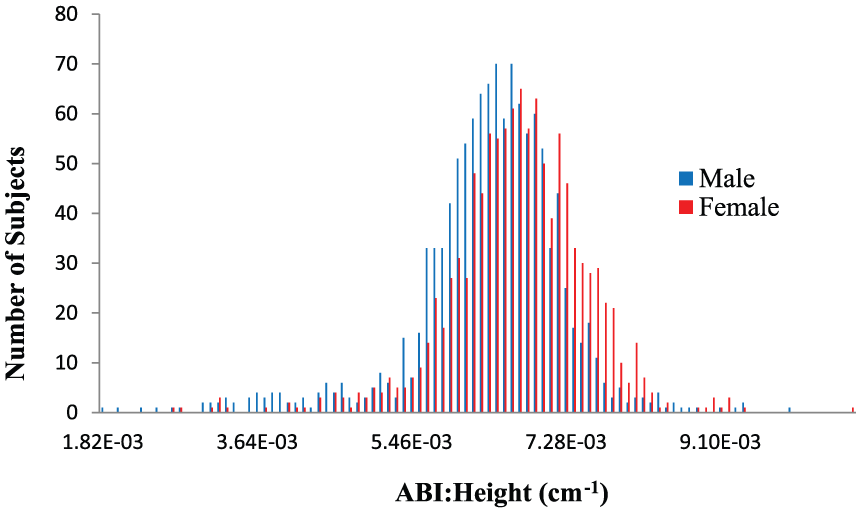
Distribution of raw ABI normalized to height in NHANES males and females.
To expand on the above findings, we analyzed the distribution of the ABI values from the healthy subset by looking at separate lower 1.0, 2.5 and 5.0 percentile cut-off points by sex, as was done by Hiatt et al. in the San Luis Valley Diabetes Study. 10 ABI cut-off points are consistently lower in females across percentiles. When we apply these sex-specific cut-off points to the entire cohort (> 40 years), crude prevalence estimates of PAD are now higher in men compared to women (Table 2). While the prevalence rates of low ABIs are higher (ABI < 1.0) or similar (ABI ⩽ 0.90) in females compared to males, males have a higher prevalence of more severe PAD (ABI < 0.70) – more than twice as high as females.
Crude prevalence of low ABIs in all NHANES subjects > 40 years of age.
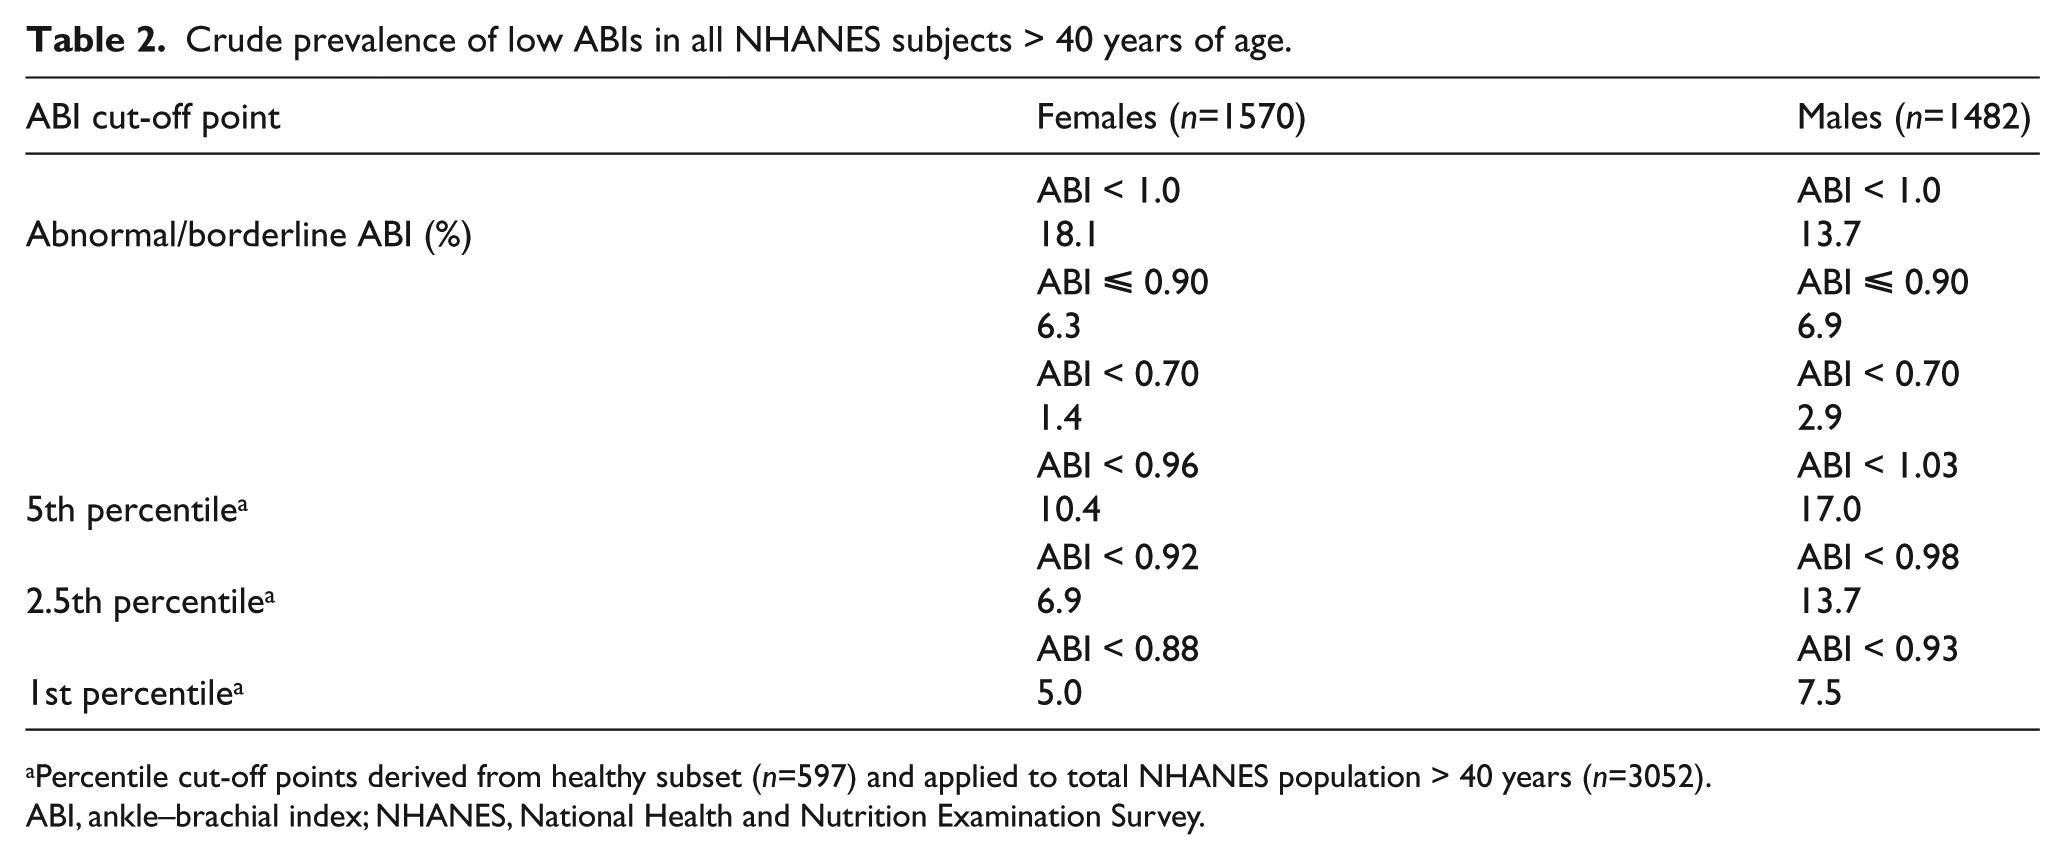
Percentile cut-off points derived from healthy subset (n=597) and applied to total NHANES population > 40 years (n=3052).
ABI, ankle–brachial index; NHANES, National Health and Nutrition Examination Survey.
Multivariable analysis
The results of the sample-weighted linear regression analyses are show in Supplemental Table 1 (healthy subset) and Table 3 (full cohort). In a model including only height and sex, the beta coefficient for sex, while similar in magnitude, was not statistically significant. However, in fully adjusted, multivariable models, the estimated beta coefficient for females was similar and significant in both the healthy and full cohort at −0.03 (p < 0.02). Black and Mexican American races were associated with a lower ABI in both groups (all p < 0.05).
Correlates of ABI in all NHANES subjects > 40 years.
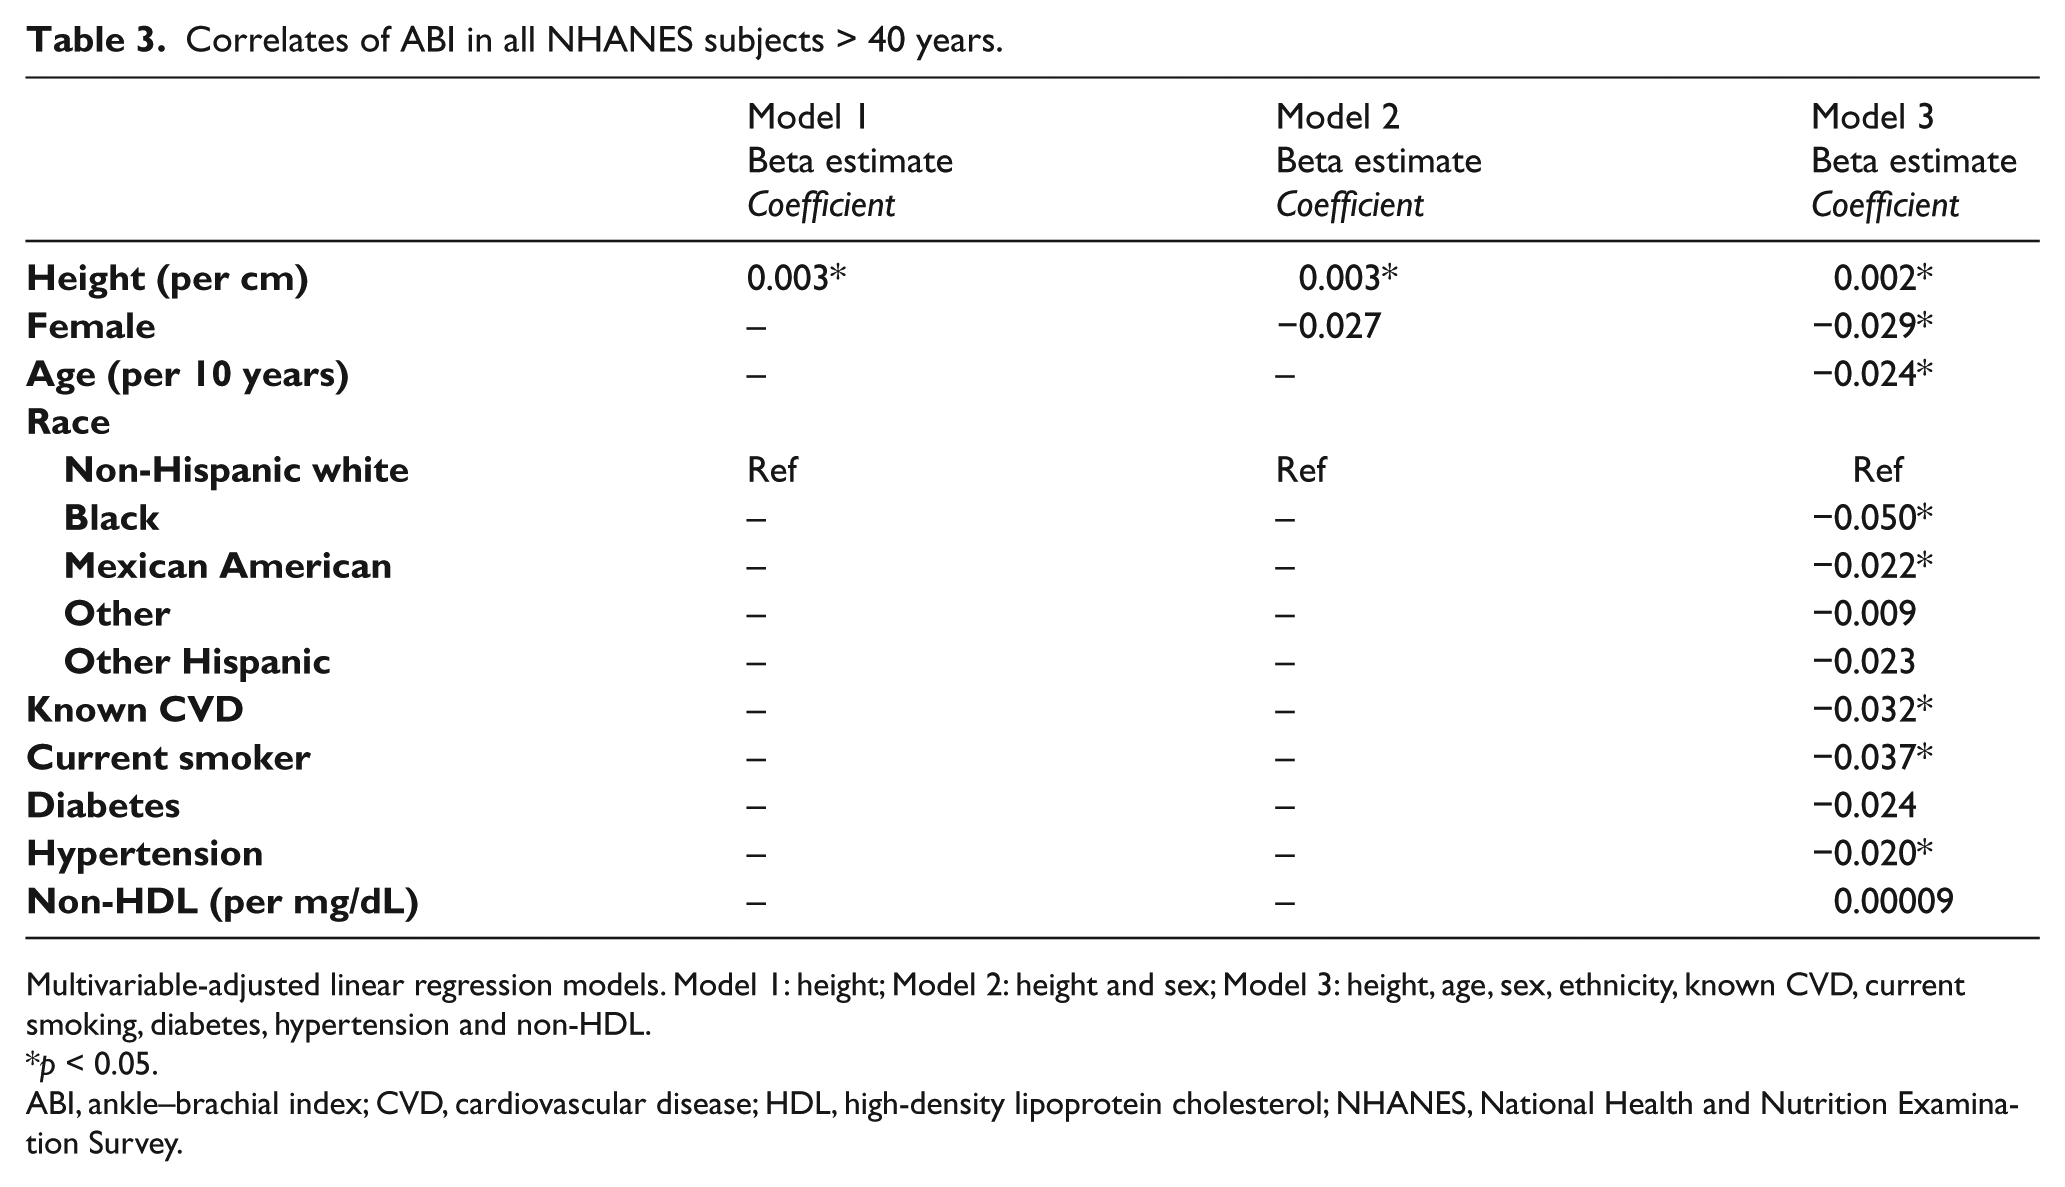
Multivariable-adjusted linear regression models. Model 1: height; Model 2: height and sex; Model 3: height, age, sex, ethnicity, known CVD, current smoking, diabetes, hypertension and non-HDL.
p < 0.05.
ABI, ankle–brachial index; CVD, cardiovascular disease; HDL, high-density lipoprotein cholesterol; NHANES, National Health and Nutrition Examination Survey.
The results of the multivariable logistic regression analysis are shown in Supplemental Figure 3. Age, female sex, black race, known CVD and traditional CVD risk factors were associated with the ABI measurement. Black race was associated with low ABI (OR 1.91, 95% CI: 1.38–2.64; p < 0.0001). Current tobacco use was also associated with low ABI (OR 1.45, 95% CI: 1.18–1.78; p=0.0004). Other known risk factors including diabetes (OR 1.66, 95% CI: 1.29–2.15; p=0.0001) and known history of cardiovascular disease (OR 1.58, 95% CI: 1.21–2.06; p=0.0009) were associated with low ABI.
Female sex was associated with a low ABI (OR 1.34, 95% CI: 1.04–1.72; p=0.025), independent of traditional CVD risk factors. Shorter height was also associated with a low ABI (OR 0.91, 95% CI: 0.86–0.96; p=0.001). Height consistently correlates with ABI in both the healthy cohort (n=597) and the full cohort (n=3052) (R=0.18 and 0.23, respectively, both p < 0.0001). Therefore, in both logistic and linear regression modeling, the association of a low ABI and female sex is independent of height.
Discussion
In this cross-sectional analysis of 3052 participants from the general population, female sex is associated with a low ABI even after adjustment for height and traditional CVD risk factors. It is postulated that height may affect ABI measurement because blood pressure waves are amplified with increasing distance from the heart to the site of peripheral measurement.11,12 In our study, height is indeed associated with the ABI measurement. However, in our fully adjusted model, height appears to lessen but not eliminate the association of female sex with a low ABI, even in the healthy subset. These lower ABI values in healthy females do not appear to be due to occult vascular disease but rather a normal phenomenon with some contribution from height. Therefore, we propose using sex-specific thresholds to define PAD moving forward.
Our data suggest that the ABI is about 0.03 lower in females than males (in both our healthy cohort and full cohort analyses). This finding has been observed in other population studies.7,10 Height consistently correlates with the ABI. In our linear regression models, ABI was an average of 0.002 units higher for every 1 cm more height. In addition, there appears to be some contribution from race. When compared to non-Hispanic white individuals, black and Mexican American subjects had lower ABI values. Similar population studies report higher rates of PAD (as defined by an ABI ⩽ 0.9) in black individuals, even after adjustments for traditional and novel risk factors.7,13–16 Because these race differences are significant in both our healthy and full cohorts, and observed in other studies, this finding may not necessarily reflect more disease in these groups.
Sex differences with lower ABI values in females compared to males, such as those from the Rotterdam Study, 6 MESA, 7 our study and others have brought into question whether lower ABI cut-offs are needed in females for improved PAD diagnosis.8,17,18 Prior studies using contrast angiography to determine the ABI cut-offs are older (1960s) and studied a predominantly high-risk, male population with younger healthy volunteers.19–21 In a more recent study of young, healthy adults (median age 20 years) with a low pre-test probability of PAD, an ABI < 1.0 was observed in 18.1% of males and 25.6% of females. 22 Our results were similar, with 18% of females and 14% of males having an ABI < 1.0. In MESA, the authors suggested that the threshold of 0.9 might overestimate PAD prevalence by 37% in non-Hispanic Caucasian women and by 36% in black women. 2 In the San Diego Population Study, a lower ABI was reported for females (1.12 vs 1.16 for males). 17 Most studies have shown that asymptomatic disease is more prevalent in females than in males.23–25 Perhaps this is related to overestimation of PAD rates in females with the current ABI cut-offs. To improve population estimates of disease burden and PAD diagnosis in females, we recommend the use of sex-specific thresholds from a normal subset of the population being studied to define an abnormal ABI. When we analyzed the distribution of ABI values from a healthy NHANES subset using 1.0, 2.5 and 5.0 percentile cut-off points by sex, ABI prevalence estimates of PAD were consistently higher in males compared to females (Table 2). For example, the 2.5 percentile ABI cut-off points (ABI < 0.92 for females and < 0.98 for males) result in prevalence rates of 7% and 14%, respectively. These sex-specific ABI cut-points are consistently lower in males compared to females. Considering the ‘traditional’ cut-point for PAD of an ABI < 0.90, the total population prevalence is 13.2%. Using sex-specific cut-points, 1st percentile thresholds of an ABI < 0.88 for females and an ABI < 0.93 for males, the total prevalence is similar (12.5%), but results in 50% more males than females with PAD (7.5% vs 5.0%, respectively). Our findings that males have more severe disease is also noteworthy and supported by prior studies.26,27
Female sex is a known risk factor for abdominal aortic aneurysm (AAA) rupture,28,29 with rates of rupture fourfold that of males at all AAA diameters. 30 Traditionally, we have used the same AAA diameter (5.5 cm) in males and females to determine timing of elective intervention for AAA. Studies have reported sex differences in aortic compliance, and females have been shown to have smaller aortas than males. 30 As such, several variations of an ‘aortic index’ have been proposed to lower intervention thresholds in this at-risk population.31,32 Even though our study shows that height matters, without additional research we cannot conclude that normalizing ABI to height is the correct solution. Variability in the method of ABI assessment, in addition to sex differences in arterial size, body habitus, and biomechanical characteristics such as aortic wall stress and arterial distensibility, may all need to be considered. Rather than adjusting for these methodological, anatomical and physiological differences, implementing population and sex-specific thresholds seems far more feasible and practical.
Based on our prevalence estimates using 1st percentile, sex-specific cut-points, males have more PAD compared to females. In our study, female sex remains associated with a low ABI even after multivariable adjustment for height and traditional CVD risk factors. This finding may be due to unmeasured confounders. Comorbidities that may increase PAD risk and are more prevalent in women include osteoporosis, use of oral contraceptives or hormone replacement therapy (HRT), autoimmune diseases and adverse pregnancy outcomes. At least a couple of studies have shown a higher prevalence of PAD in osteoporotic women compared with matched postmenopausal women with normal bone mineral density.33,34 The RATIO (Risk of Arterial Thrombosis in Relation to Oral Contraceptives) study in young women aged 18–49 years of age found an adjusted OR for PAD in women using any type of oral contraceptives versus no use of 3.8 (95% CI: 2.4–5.8). Importantly, this study based the diagnosis of PAD almost exclusively on gold standard angiography rather than the non-invasive ABI. 35 The Women’s Health Initiative noted an increase in peripheral vascular events and re-intervention in women treated with estrogen plus progestin or estrogen alone. 36 As such, HRT is currently considered a risk factor in women with vascular disease. For most systemic, inflammatory autoimmune disorders, there is a clear sex difference in prevalence ranging from a female to male ratio of 2.5:1 for rheumatoid arthritis (RA) and 9:1 for systemic lupus erythematous (SLE). 37 Patients with RA have a two to threefold higher risk of myocardial infarction and a 50% higher risk of stroke, with the risks even higher in SLE, independent of traditional risk factors and the adverse effects of drugs used to treat these diseases, such as steroids. 38
The relationship of adverse pregnancy outcomes – specifically, hypertensive disorders of pregnancy such as pre-eclampsia – with cardiovascular morbidity and mortality is well established. 37 In a retrospective study comparing women less than 50 years old with healthy women matched for age and body mass index, Ben-Ami et al. found a composite of pregnancy complications, including intrauterine growth restriction, pregnancy-induced hypertension, and pre-eclampsia, were independently associated with atherothrombotic occlusive vascular disease, including PAD. 39 While the exact pathophysiology remains obscure, abnormal placental vasculature dysfunction and a systemic inflammatory response may play a role. 40
Our study does have limitations. First, it is a cross-sectional study and association does not imply causation. In addition, the estimated prevalence of PAD may vary substantially according to the mode of ABI calculation. 2 ABI measurements for the NHANES participants were performed per a predefined protocol to minimize measurement variability. These were done, however, prior to the 2012 AHA scientific statement with standardized guidelines for the measurement and interpretation of the ABI. 2 For example, the AHA guidelines recommend obtaining brachial pressures in both arms and using the higher of the two. 41 In NHANES, brachial artery pressures were obtained from the right upper extremity only. This could lead to falsely high ABI values if there is right subclavian artery stenosis present. In addition, a small study of healthy subjects showed that inter-arm systolic blood pressure differences were related to arm dominance. 42 Current guidelines also recommend using the higher of the dorsalis pedis or posterior tibialis pressures in each leg. In NHANES, only the posterior tibialis pressures were measured. 2 Current guidelines also recommended a 5 to 10-minute rest period in the supine position that was not required in the NHANES protocol. Additionally, factors such as temperature of the examination room and smoking prior to measurements, which may affect the ABI, were not included in the NHANES protocol.
Conclusion
Female sex is associated with a lower ABI even after adjustment for height and traditional CVD risk factors. Sex-specific studies focused on cardiovascular disease suggest that emerging, non-traditional CVD risk factors including adverse pregnancy outcomes, autoimmune disease, osteoporosis and hormone therapy likely contribute to this important finding. Lower ABI values in healthy females do not appear to be due to occult vascular disease but rather a normal phenomenon with some contribution from height (and race). We recommend that population and sex-specific percentile ABI thresholds be utilized to diagnose PAD in females and improve population estimates of disease burden. Additional, prospective investigation considering these sex differences will likely improve our understanding, prevention and management of not only PAD in women but of all CVD in this population that has classically been under-represented in research studies.
Supplemental Material
VMJ774845_Supplementary_Figures – Supplemental material for Association of sex and height with a lower ankle brachial index in the general population
Supplemental material, VMJ774845_Supplementary_Figures for Association of sex and height with a lower ankle brachial index in the general population by Ridhima Kapoor, Colby Ayers, Alexis Visotcky, Peter Mason and Jacquelyn Kulinski in Vascular Medicine
Supplemental Material
VMJ774845_Supplementary_Table – Supplemental material for Association of sex and height with a lower ankle brachial index in the general population
Supplemental material, VMJ774845_Supplementary_Table for Association of sex and height with a lower ankle brachial index in the general population by Ridhima Kapoor, Colby Ayers, Alexis Visotcky, Peter Mason and Jacquelyn Kulinski in Vascular Medicine
Footnotes
Declaration of conflicting interests
The authors declared no potential conflicts of interest with respect to the research, authorship, and/or publication of this article.
Funding
The authors disclosed receipt of the following financial support for the research, authorship, and/or publication of this article: this publication was supported by the National Center for Research Resources and the National Center for Advancing Translational Sciences, National Institutes of Health (NIH), through Grant Number UL1TR001436. Its contents are solely the responsibility of the authors and do not necessarily represent the official views of the NIH.
Supplementary material
The supplementary material is available online with the article.
References
Supplementary Material
Please find the following supplemental material available below.
For Open Access articles published under a Creative Commons License, all supplemental material carries the same license as the article it is associated with.
For non-Open Access articles published, all supplemental material carries a non-exclusive license, and permission requests for re-use of supplemental material or any part of supplemental material shall be sent directly to the copyright owner as specified in the copyright notice associated with the article.