
Abstract
Common carotid artery (CCA) intima-media thickness (IMT) is associated with coronary heart disease and can be measured on ultrasound images either by hand or with an automated edge detector. The association of CCA IMT with incident peripheral artery disease (PAD) is poorly studied. We studied 5467 participants of the Multi-Ethnic Study of Atherosclerosis composed of non-Hispanic white, Chinese, Hispanic, and African American participants with a mean age of 61.9 years (47.8% men). Framingham Risk Factors, manual-traced IMT (mt-IMT), and edge-detected IMT (ed-IMT) were entered into multivariable Cox proportional hazards models with incident PAD as the outcome. There were 87 events during a median follow-up of 12.2 years. In fully adjusted models and expressing the hazard ratios (HR) as an increment in SD values, both mt-IMT and ed-IMT were significantly associated with incident PAD: HR 1.36 (95% CI: 1.15, 1.61) and 1.29 (95% CI: 1.04, 1.60), respectively. We conclude that ed- and mt-CCA IMT measurements are associated with incident PAD.
Keywords
Introduction
Common carotid artery (CCA) intima-media thickness (IMT) is a marker of cardiovascular disease. IMT measurements can be done by readers who identify the key wall interfaces on ultrasound images and then place calipers at selected points, 1 trace continuous lines along the key interfaces of the artery wall 2 or use edge detectors to automatically detect the key wall interfaces.3–9
Two consensus groups have proposed the use of edge detection for IMT measurements.10,11 Manual and edge detected IMT measurements have been shown to have similar associations with cardiovascular risk factors. 9 CCA IMT values derived from both measurement approaches have also shown associations with first-time coronary heart disease events. 12
Although CCA IMT has associations with incident cardiovascular disease and prevalent peripheral artery disease (PAD),13–16 associations with incident PAD are poorly studied.
We test the hypothesis that manual-traced IMT (mt-IMT) and edge-detected IMT (ed-IMT) measurements are associated with incident PAD in a large multi-ethnic cohort followed longitudinally, the Multi-Ethnic Study of Atherosclerosis (MESA).
Materials and methods
Population
MESA recruited and examined a multi-ethnic population of 6814 men and women aged 45–84 years old without history of clinical cardiovascular disease 17 between July 2000 and August 2002. MESA included non-Hispanic white, African American, Hispanic, and Chinese participants being followed longitudinally. Participants were excluded at baseline if they had a physician diagnosis of heart attack, stroke, transient ischemic attack, heart failure, angina, atrial fibrillation or history of any cardiovascular procedure, weighed more than 300 lb (136 kg), were pregnant, or had any medical conditions that would prevent long-term participation. We further excluded any individuals with PAD at baseline. MESA protocols and all studies described herein have been approved by the institutional review boards of all collaborating institutions and all participants gave informed consent. Of the 6814 participants studied, 5641 underwent ed-IMT measurements in addition to manual measurements as part of an ancillary study (ClinicalTrials.gov Identifier: NCT00063440). 9 We excluded one individual with PAD at baseline. There were 5467 participants with full risk factors.
Risk factors and anthropomorphic variables
The risk factors used in this article were derived from the updated Framingham Risk Score as presented by D’Agostino et al. 18 and also included in the Global Atherosclerotic Cardiovascular Disease (ASCVD) score from the American College of Cardiology and American Heart Association 19 : age, smoking, diabetes status, systolic blood pressure, treatment for blood pressure, and total and high-density lipoprotein (HDL) cholesterol with sex, race/ethnicity, and lipid lowering treatment added.
Age, sex, race/ethnicity, and medical history were self-reported. Current smoking was defined as self-report of a cigarette in the last 30 days. Body mass index (BMI) was measured as kilograms (kg) divided by height squared (m2). Resting blood pressure was measured at rest and after 5 minutes of rest, in the seated position, using a Dinamap model PRO 100 automated oscillometric sphygmomanometer (Critikon, Tampa, FL, USA) as the average of the last two of three measurements. Glucose and lipid levels were measured after a 12-hour fast. The presence of diabetes mellitus was based on self-reported physician diagnosis, use of insulin and/or oral hypoglycemic agent, or a fasting glucose value ⩾ 126 mg/dL. Total cholesterol was measured using a cholesterol oxidase method (Roche Diagnostics, Indianapolis, IN, USA), as was HDL cholesterol after precipitation of non-HDL cholesterol with magnesium/dextran. The ankle–brachial index (ABI) was calculated with a hand-held Doppler instrument equipped with a 5-MHz probe (Nicolet Vascular, Golden, CO, USA). Systolic blood pressures were measured in both brachial arteries and in both legs at the dorsalis pedis and posterior tibial arteries. The ABI in each leg was calculated by dividing the highest pressure for either the dorsalis pedis or posterior tibial artery by the highest brachial artery pressure. The lowest of either the right or left ABI was used in these analyses.
The Chronic Kidney Disease Epidemiology Collaboration (CKD-EPI) equation was used to calculate the estimated glomerular filtration rate (eGFR). 20 C-reactive protein (CRP) and fibrinogen were measured using immunochemical reactions with the BN II nephelometer – for CRP with N High Sensitivity CRP (Dade Behring Inc., Deerfield, IL, USA) and for fibrinogen with N Antiserum to Human Fibrinogen (Dade Behring Inc.).
Carotid artery measures
Carotid ultrasound examinations were made at the baseline visit. Participants were examined supine with the head rotated 45° towards their left. Arms were held slightly abducted from the body. Imaging was done in the plane parallel to the right CCA long axis, with the jugular vein lying immediately above the artery (or at 45° from the vertical if the internal jugular vein is not seen). Longitudinal images of the right CCA were centered below (caudad to) the right CCA bulb. A matrix array probe (M12L; General Electric, Waukesha, WI, USA) was used, with the frequency set at 13 MHz, two focal zones, and the frame rate at 32 frames per second. A super-VHS videotape recording was then made for 20 seconds. Images were digitized at 30 frames per second and automated diameter measurements were made from this digital video segment using customized software. End-diastolic images (smallest diameter of the artery) were captured based on measurements of diameters during the cardiac cycle. 21
A region-of-interest was defined along the far wall for approximately 10 mm, starting at least 5–10 mm below (caudad to) the beginning of the right CCA bulb. The region was adjusted in order to exclude any carotid artery plaque. Trained readers traced lines along the key two interfaces: the lumen-intima and media-adventitia. An automated edge detection algorithm was then used to determine these same two key interfaces within the same region-of-interest. The tracings from manually drawn and edge-detected interfaces were then applied to the same algorithm in order to calculate mean mt-IMT and ed-IMT. 9
Reproducibility was assessed by blinded replicate re-reads performed by two readers of a set of 114 studies read by another reader. 9 The process included application of the diameter edge detector, the selection of an appropriate image, and the IMT measurements. The between-reader correlation coefficients were 0.78 for mt-IMT and 0.71 for ed-IMT.
Internal carotid artery plaque was measured by selecting the largest height of the IMT from three longitudinal images taken of the bulb/proximal internal carotid artery in the anterior, lateral, and posterior projections on each side. The ultrasound transducer frequency was set at 9 MHz. The largest measurement from either side was used. Carotid plaque was defined as an IMT of 1.5 mm or more.10,22,23
Outcomes
Events were identified during follow-up examinations and by telephone interview conducted every 9–12 months to inquire about all interim hospital admissions, cardiovascular outpatient diagnoses, and deaths. Copies of all death certificates and of all medical records for hospitalizations and outpatient cardiovascular diagnoses were obtained. Two members of the MESA events committee adjudicated for the presence of incident PAD events from information derived from the participants’ medical records and the International Classification of Diseases, Ninth Revision (ICD-9) codes. We report first-time incident PAD events.
PAD events were determined based on the following criteria: symptomatic disease such as lower extremity claudication, atherosclerosis of the lower extremity, arterial embolism and/or thrombosis of the lower extremity. Probable PAD required only a documented physician diagnosis of a PAD condition with symptoms. Definite PAD required one or more other criteria, such as: ultrasonographically or angiographically demonstrated obstruction, OR ulcerated plaque (⩾ 50% of the diameter or ⩾ 70% of the cross-sectional area) demonstrated on ultrasound or angiogram of the iliac arteries or below; claudication confirmed by a post-exercise decrease in ABI; revascularization for PAD; amputation for ischemia; or an ankle–brachial ratio ⩽ 0.8. Follow-up of 10 years or more was obtained in 89.1% of participants (n = 4871). In addition to ABI measurements made for clinical care, the ABI measurements were repeated during two of the four follow-up examinations: visit #3 (March 2004 – September 2005) and visit #5 (April 2010 – February 2012).
Statistical analyses
The mean and standard deviation (SD) values of continuous variables are presented. The distribution of categorical variables is shown as a percent value (%).
Cox proportional hazards models were constructed with mt-IMT and ed-IMT as independent variables. The mt-IMT and ed-IMT were then added to separate multivariable Cox proportional hazards models first adjusted for age, sex, and race/ethnicity and then for all risk factors.
Hazard ratios for the final multivariable models are presented in units of one standard deviation for the continuous variables, except age, in order to facilitate comparisons between risk factors and the two IMT measurements.
Kaplan–Meier curves were generated, separately plotting mt-IMT and ed-IMT by quartiles.
We performed secondary analyses using the Framingham Risk Score as described by Wilson et al., 24 to which we added BMI and eGFR. CRP and fibrinogen were also included since they have been linked to an increased risk of incident cardiovascular events. 25 We further added internal carotid artery plaque defined as an IMT ⩾ 1.5 mm22,23 to the model and tested for an association of mt- and ed-CCA IMT with PAD events.
Statistical analyses were performed using Stata Statistical Software, Release 11.2 (StataCorp LP, College Station, TX, USA). The level of statistical significance was set at p ⩽ 0.05 (two-sided).
Results
There were 5467 individuals, with a mean age of 61.9 years (Table 1). The mean mt-IMT and ed-IMT values were 0.68 mm (± 0.19 SD) and 0.87 (± 0.23 SD), respectively. The largest ethnicity was non-Hispanic white at 39.7% of participants, with the smallest being Chinese (12.2%). There were 87 PAD events, with 78 classified as definite and nine as probable for a mean follow-up of 12.2 years.
Demographics and key variables of the population studied.
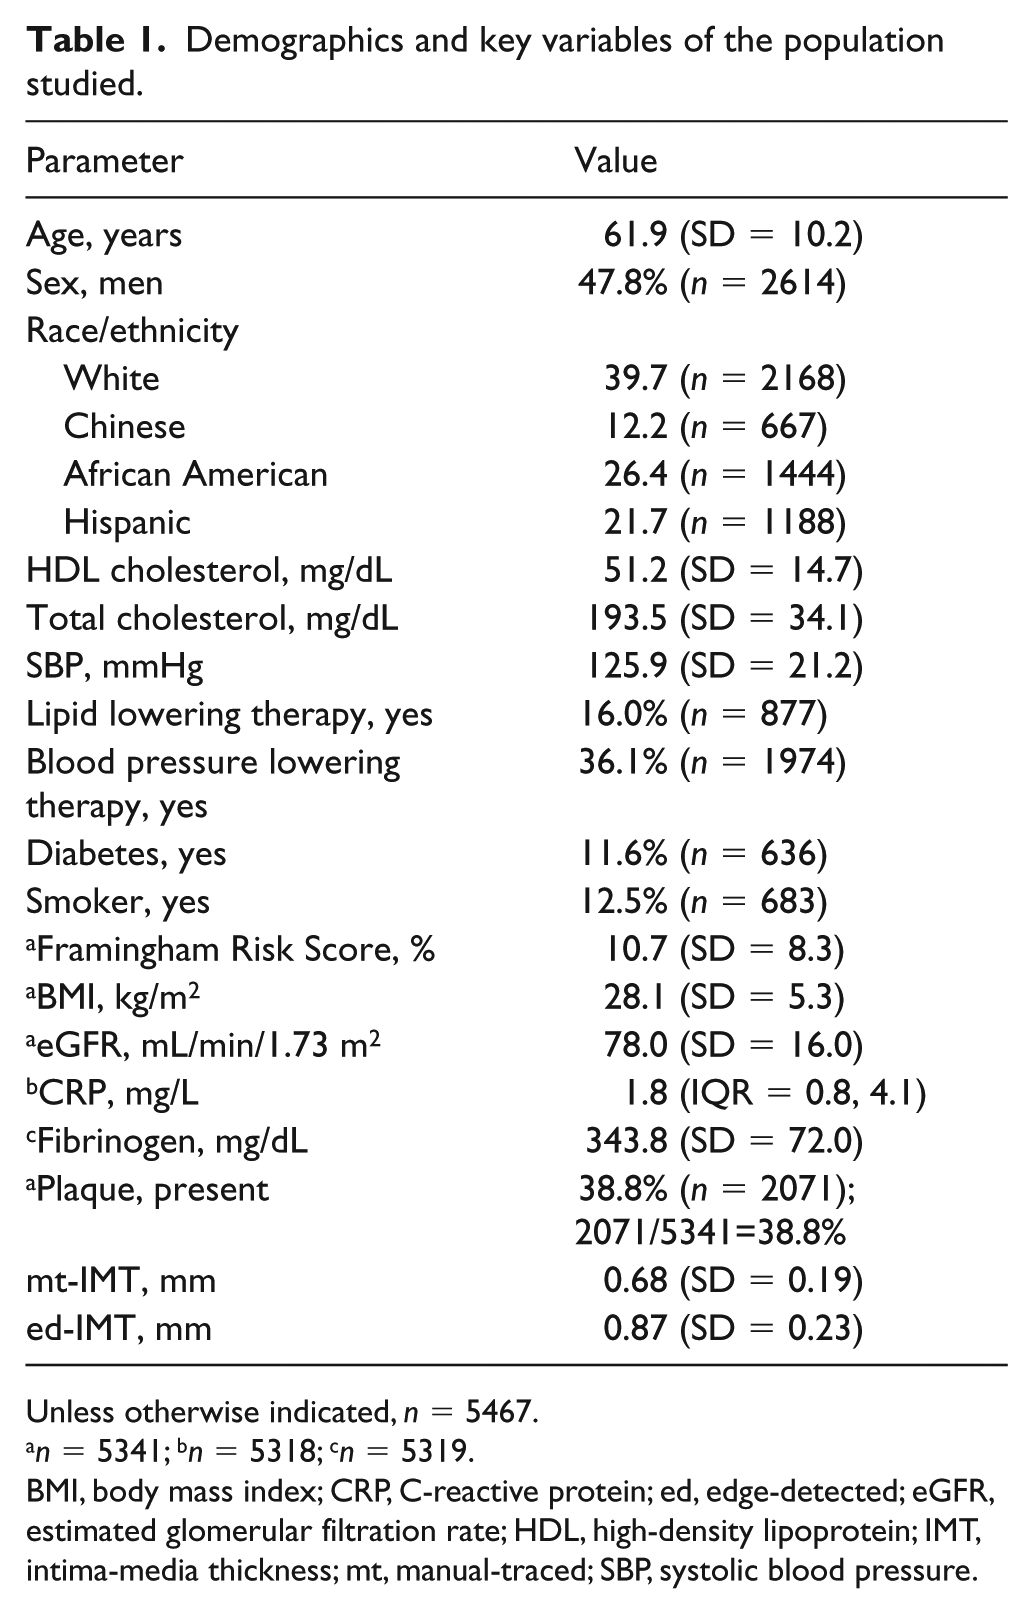
Unless otherwise indicated, n = 5467.
n = 5341; bn = 5318; cn = 5319.
BMI, body mass index; CRP, C-reactive protein; ed, edge-detected; eGFR, estimated glomerular filtration rate; HDL, high-density lipoprotein; IMT, intima-media thickness; mt, manual-traced; SBP, systolic blood pressure.
The means (median) with SD (IQR) for both mt- and ed-IMT are shown for each sex and race/ethnicity (Table 2). The values were higher for black American men and lowest for Chinese women.
Mean and median for both mt- and ed-CCA IMT are shown broken down by sex and race/ethnicity.
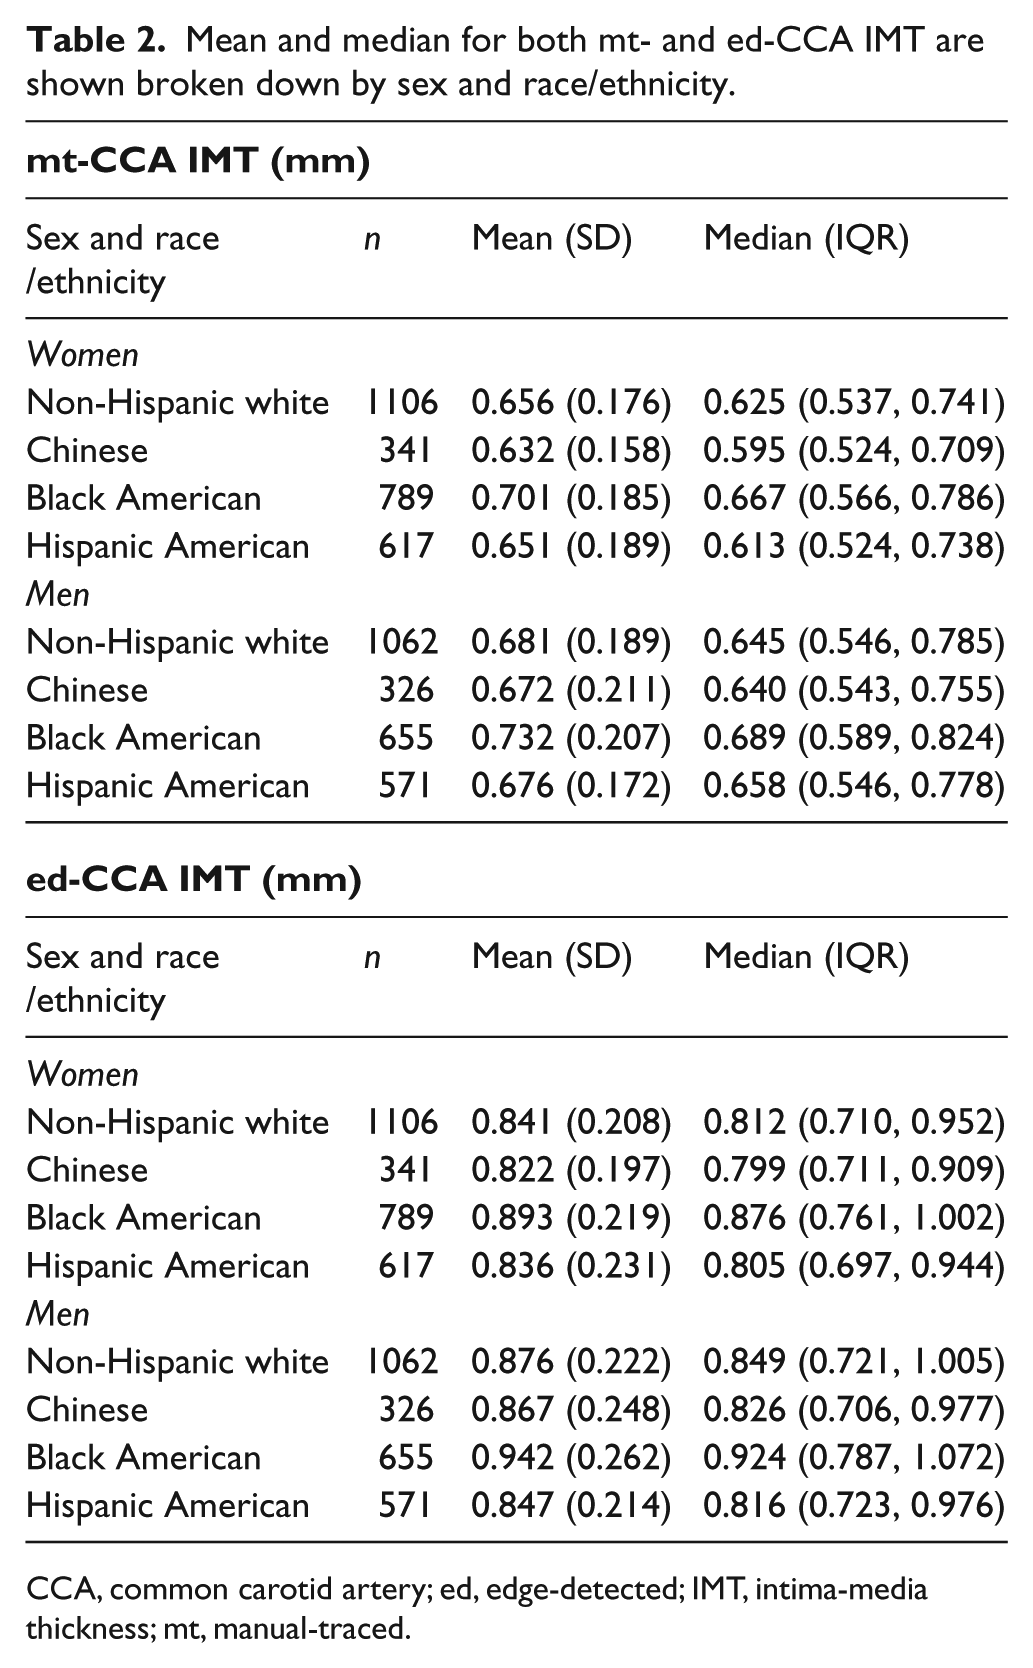
CCA, common carotid artery; ed, edge-detected; IMT, intima-media thickness; mt, manual-traced.
In unadjusted models, hazard ratios were higher for mt-IMT than for ed-IMT: 11.7 (95% CI: 5.8, 23.4) versus 6.5 (95% CI: 3.4, 12.3) per mm increase in IMT. In minimally adjusted models (age, sex and race/ethnicity), hazard ratios were also higher for mt-IMT than for ed-IMT: 9.0 (95% CI: 3.4, 23.5) versus 4.6 (95% CI: 1.8, 11.5) per mm increase in IMT. The Kaplan–Meier plots for both mt-IMT and ed-IMT are shown in Figure 1A and Figure 1B, respectively.
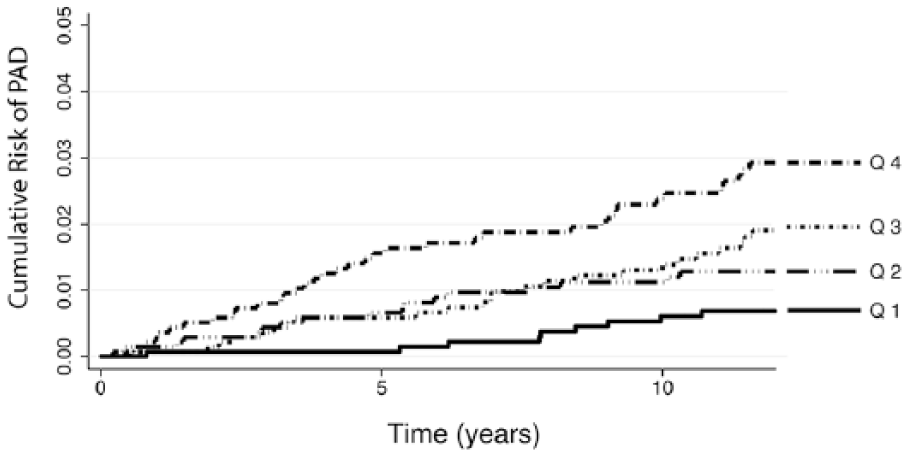
Kaplan–Meier failure curves by quartiles (Q1: 0.316–0.547 mm; Q2: 0.0547–0.644 mm; Q3: 0.644–0.768 mm; Q4: ⩾ 0.768 mm) of mt-CCA IMT values for first-time incident PAD.
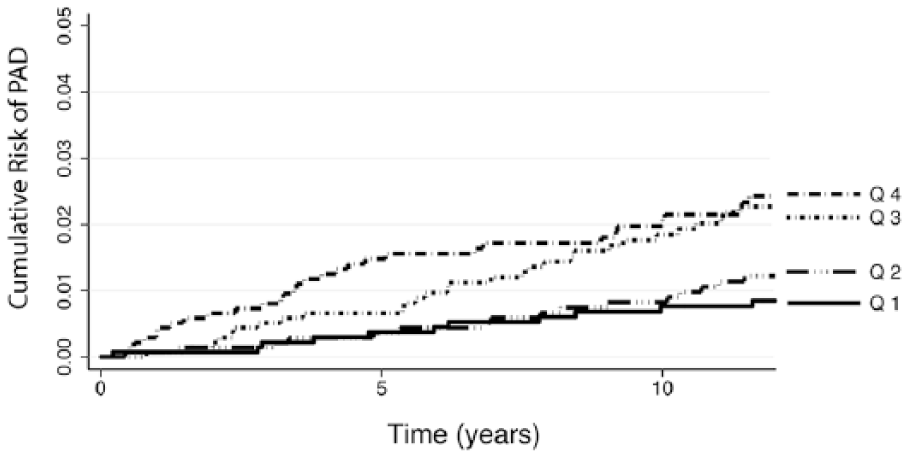
Kaplan–Meier failure curves by quartiles (Q1: 0.219–0.722 mm; Q2: 0.722–0.837 mm; Q3: 0.837–0.987 mm; Q4: ⩾ 0.987 mm) of ed-CCA IMT values for first-time incident PAD.
Results of the fully adjusted Cox proportional hazards model for mt-IMT are shown in Table 3 and those for ed-IMT in Table 4. Hazard ratios are calculated for a change of 1 SD. The hazard ratio for mt-IMT (i.e. 1.36 (95% CI: 1.15, 1.61) for a 0.19 mm increment) was similar to that of ed-IMT (i.e. 1.29 (95% CI: 1.04, 1.60) for each 0.23 mm increment). Smoking and diabetes were strong predictors of future PAD events in both models.
Results of Cox proportional hazards model with time to PAD as outcome using mt-CCA IMT measurements and risk factors as predictors (87 events from 5467 participants).
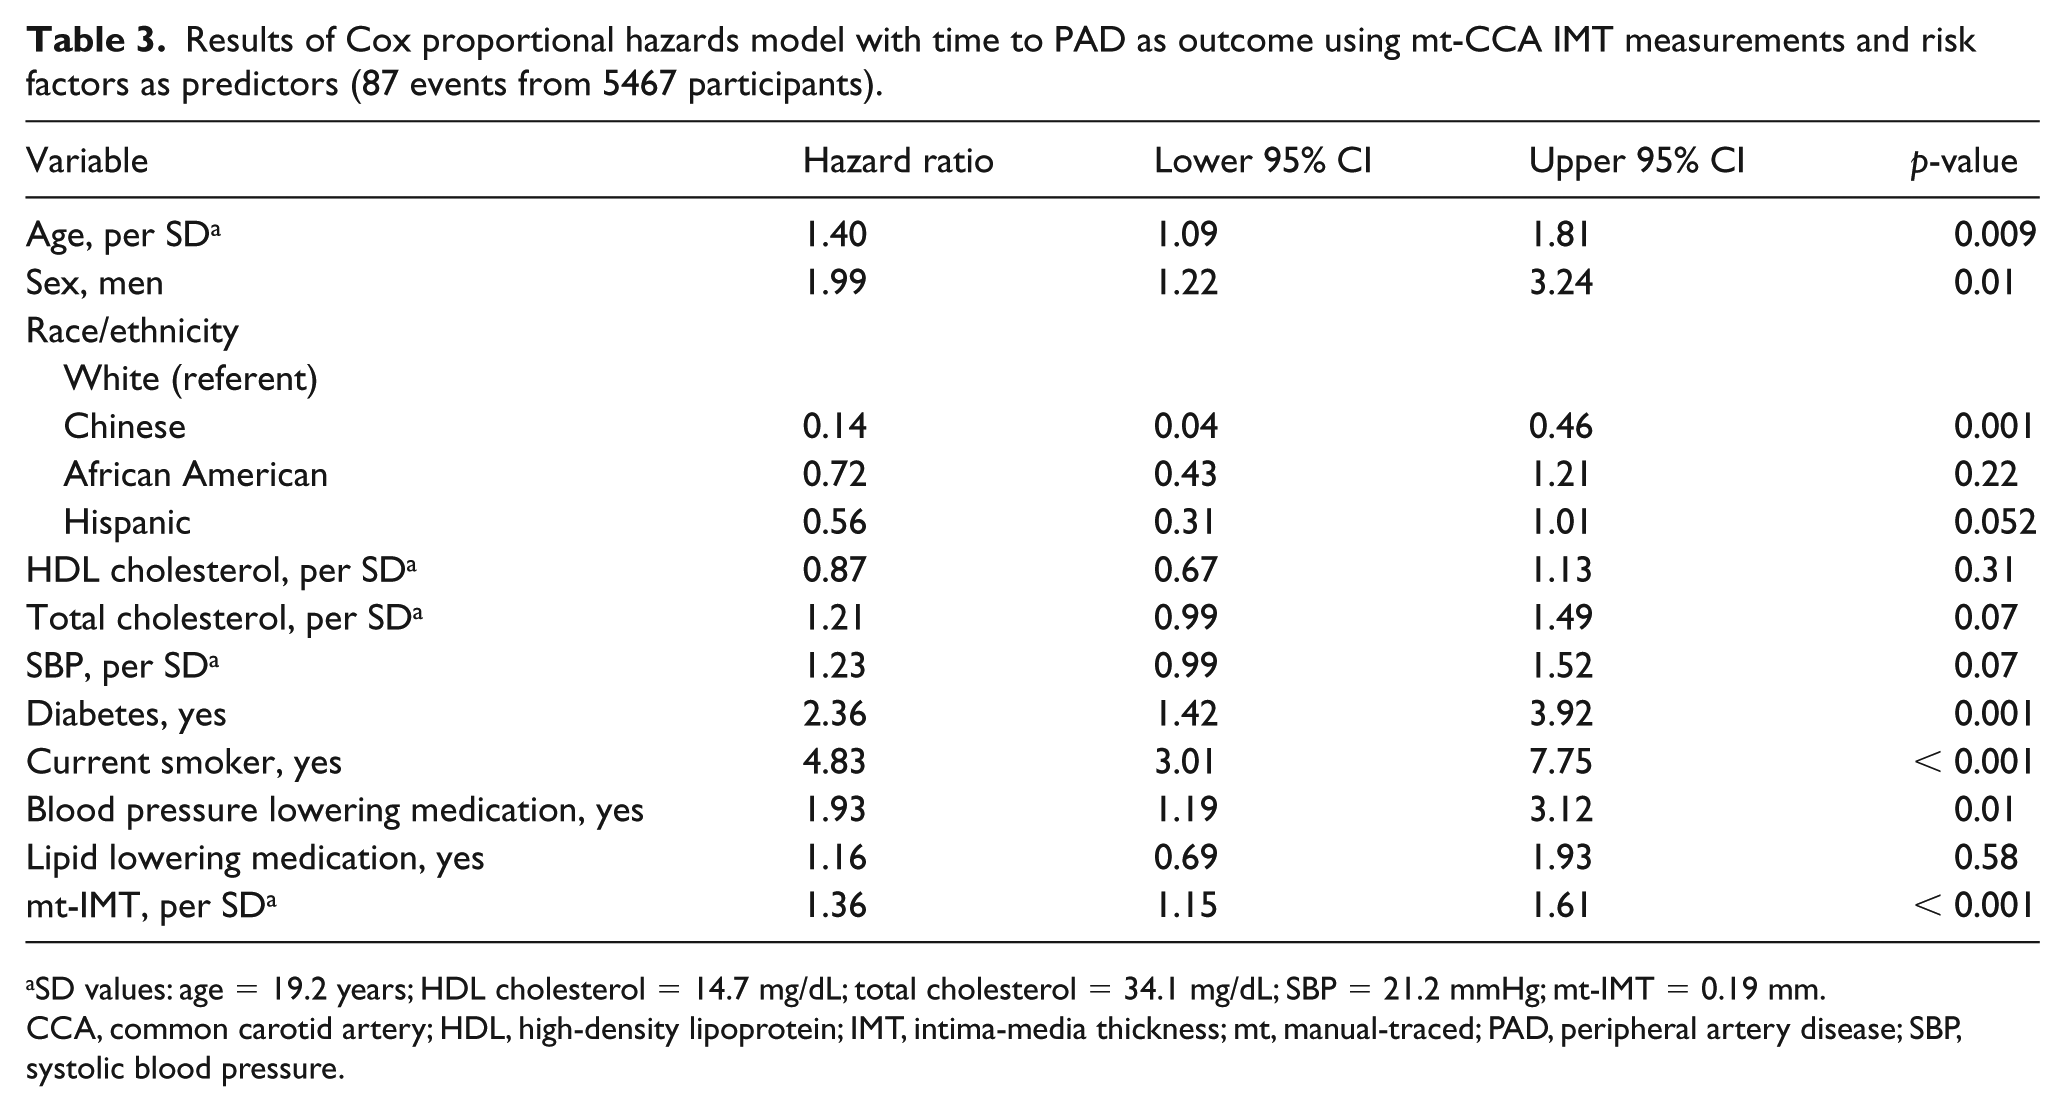
SD values: age = 19.2 years; HDL cholesterol = 14.7 mg/dL; total cholesterol = 34.1 mg/dL; SBP = 21.2 mmHg; mt-IMT = 0.19 mm.
CCA, common carotid artery; HDL, high-density lipoprotein; IMT, intima-media thickness; mt, manual-traced; PAD, peripheral artery disease; SBP, systolic blood pressure.
Results of Cox proportional hazards model with time to PAD as outcome using ed-CCA IMT measurements and risk factors as predictors (87 events from 5467 participants).
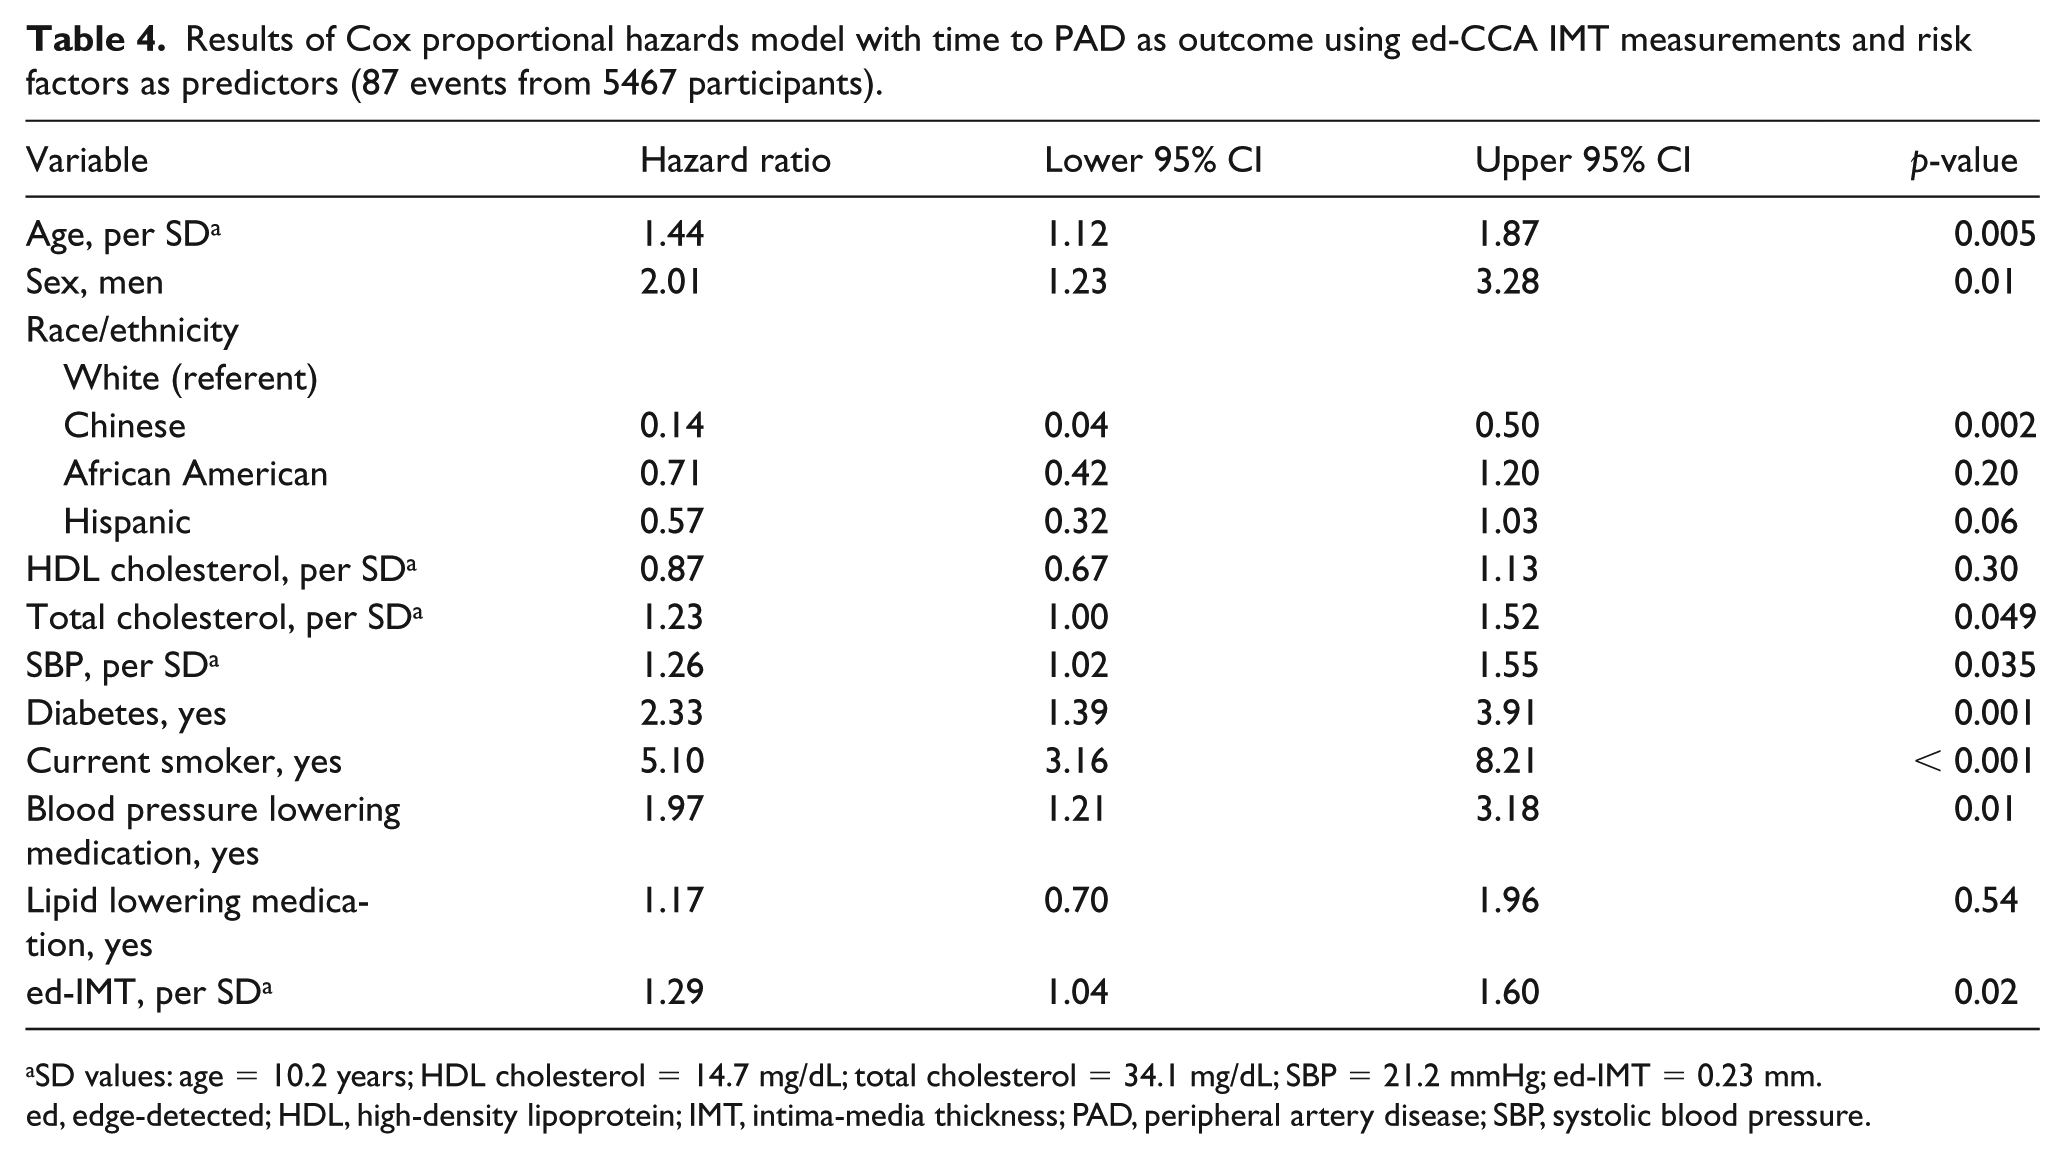
SD values: age = 10.2 years; HDL cholesterol = 14.7 mg/dL; total cholesterol = 34.1 mg/dL; SBP = 21.2 mmHg; ed-IMT = 0.23 mm.
ed, edge-detected; HDL, high-density lipoprotein; IMT, intima-media thickness; PAD, peripheral artery disease; SBP, systolic blood pressure.
Table 5 summarizes the results of models where the Framingham Risk Score was used in addition to inflammatory markers, CRP, and fibrinogen, as well as BMI and eGFR. In the model without CCA IMT, carotid plaque was significantly associated with PAD events. When they were added to this model, ed- and mt-CCA IMT where independent predictors of PAD events. Their introduction into the model blunted the association between carotid plaque and PAD events. Both fibrinogen and CRP were independent predictors of PAD events.
Hazard ratios (and 95% CI) for multivariable Cox proportional hazards models a predicting incident PAD using Framingham Risk Score with BMI, renal function, inflammatory markers, and carotid artery plaque, and CCA IMT added.
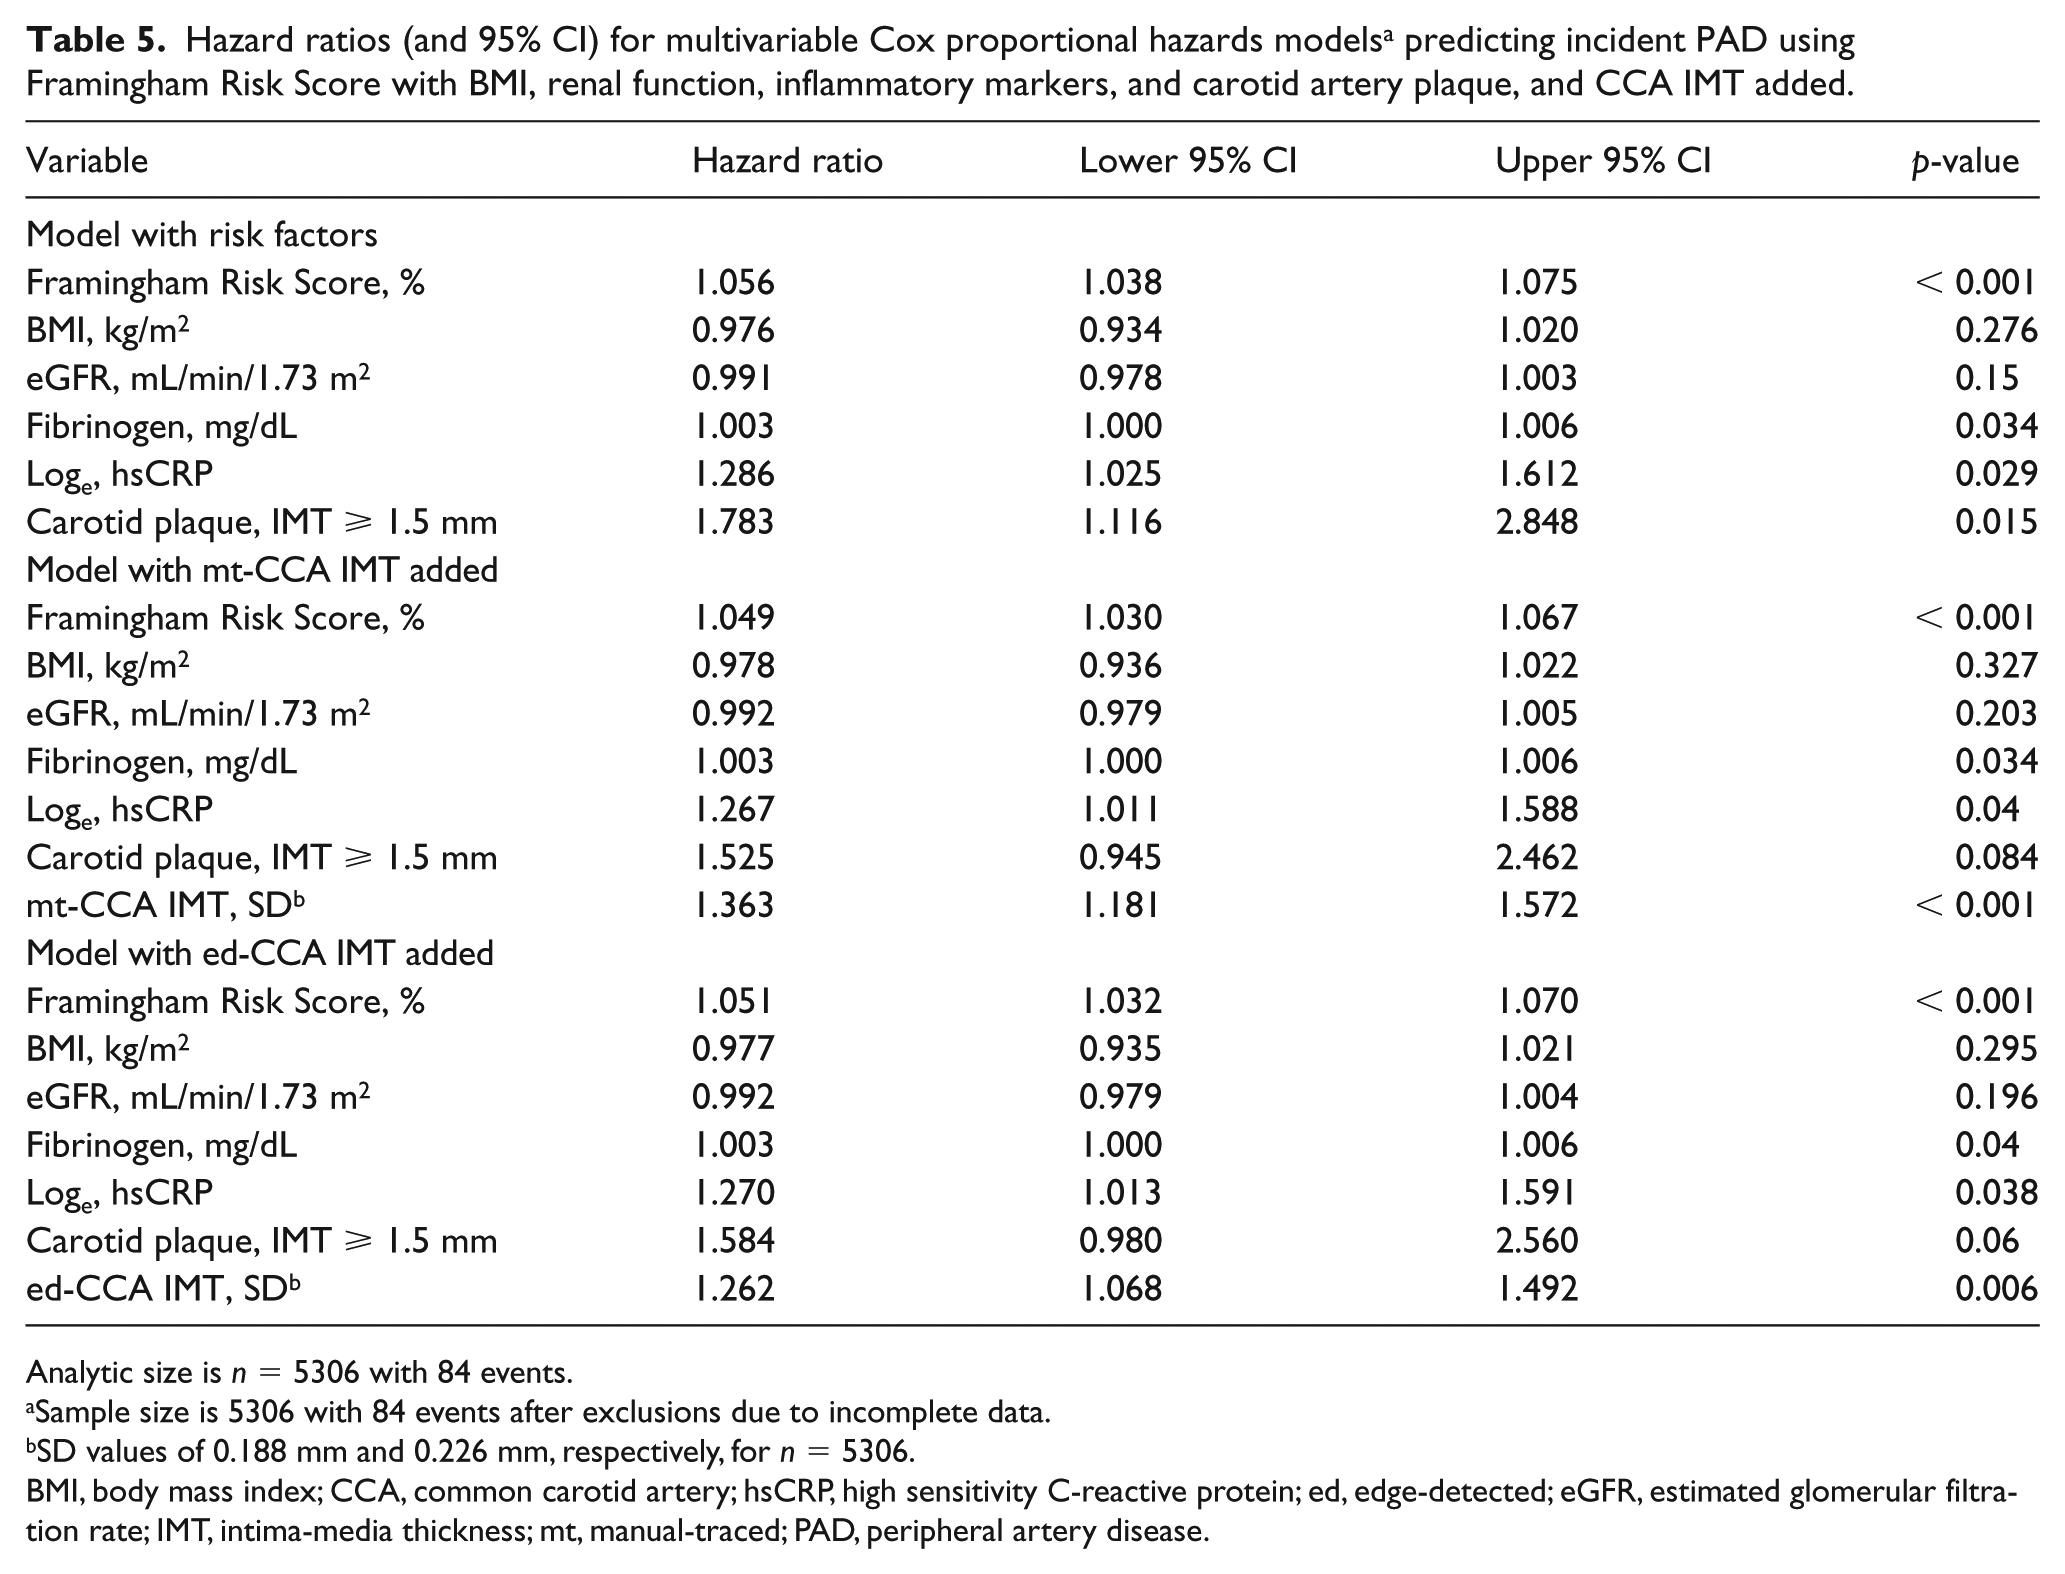
Analytic size is n = 5306 with 84 events.
Sample size is 5306 with 84 events after exclusions due to incomplete data.
SD values of 0.188 mm and 0.226 mm, respectively, for n = 5306.
BMI, body mass index; CCA, common carotid artery; hsCRP, high sensitivity C-reactive protein; ed, edge-detected; eGFR, estimated glomerular filtration rate; IMT, intima-media thickness; mt, manual-traced; PAD, peripheral artery disease.
Discussion
We have found that mt- and ed-IMT measurements of the CCA far wall IMT are associated with incident PAD.
Prior investigators have confirmed that IMT has cross-sectional associations with ankle–brachial indices14,26 and with clinically defined PAD.13,15 Few studies have looked at associations between IMT and incident PAD. We have found an association between CCA IMT and incident PAD similar to that reported in a population-based cohort of diabetics 27 and have confirmed this finding in a multi-ethnic cohort composed of diabetics and non-diabetics.
Our analyses looked at very specific instances of PAD. The MESA PAD events included cases of aneurysm formation and interventions for aneurysm disease. We excluded these cases as an outcome since PAD has a very different pathology and associations with risk factors than aneurysm disease. 16
The event rate and number of events observed in our population are relatively small (Figures 1A and 1B). This limits our ability to perform additional statistical adjustments for other plausible risk factors, such as additional inflammatory markers, or to focus solely on diabetics. 27
Our analyses show that CCA IMT values derived from hand measurements and from an automated edge detector both predict incident PAD. Our prior observations have shown that both measurements were associated with cardiovascular risk factors 9 and coronary heart disease events. 12 This suggests that, from the perspective of cardiovascular outcomes, hand drawn CCA IMT measurements made by trained readers are as reliable as CCA IMT measurements made using an automated method. While this might contradict two consensus statements that recommended the use of edge detectors for CCA IMT measurements,10,11 a reading of both documents indicates that this recommendation was subjective and not supported by any hard data comparing both methods.
The Mannheim consensus statements made the important distinction between CCA IMT measurements and focal carotid plaque (defined as an IMT ⩾ 1.5 mm). 10 The etiology of the wall thickening is slightly different in the common and internal carotid arteries. CCA laminar flow is associated with changes in shear stress causing relative hypertrophy of the wall. 28 Cyclical blood flow reversal in the proximal internal carotid artery favors more generous penetration of low-density lipoprotein (LDL)-cholesterol into the artery wall.29,30 This likely, in part, explains differences in cross-sectional associations with risk factors 31 and in incident coronary heart disease events.22,23 In the case of incident PAD, we note that there is greater statistical power with CCA IMT than with plaque. The reason for this difference will require future investigations. Since both mt- and ed-IMT measurements have independent associations with events, either IMT measurement might be useful for future risk prediction
Limitations and strengths
One limitation of our study is that we only used one edge detector. It relied on an algorithm based on dynamic programming that resembles the one developed by Wendelhag et al. 8 This algorithm processes pixel intensity and gradient. It differs from algorithms based on polynomial fitting of intensity curves perpendicular to interfaces or to algorithms using template matching.6,7,32 It is plausible that the results presented in this article are specific to the algorithm used and might not apply to other edge detection algorithms, thereby limiting the general applicability of our results.
Another plausible limitation is the use of an ultrasound device whose technology might appear dated and a measurement process that relied on acquisitions on videotape. Although apparently dated, our imaging platform used higher ultrasound frequencies, and hence higher resolution than used in other IMT outcome studies, such as in the Cardiovascular Health Study (CHS) and the Framingham Offspring Heart Study. Although use of videotape might appear to have potentially degraded resolution, we are not aware of a study where a side-by-side comparison has shown a significant difference. If anything, super-VHS videotape permits identification of the end-diastolic (lowest diameter) frame and limits measurement errors linked to the phase of the cardiac cycle when image acquisition is made.
Another study limitation was the selection of the IMT measurement site. Given that the imaging protocol was designed to evaluate IMT progression, the location for IMT measurement was paired to a follow-up ultrasound image and interfaces traced in an area free of plaque. Determining the presence of a plaque was subjective and depended on the sonographer acquiring the image as well as on the reader performing the IMT measurement. This might have introduced a selection bias and blunted potential associations between IMT and cardiovascular events.
Finally, despite the MESA quality control processes, our results likely do not have the statistical power of a single center study since ultrasound imaging was performed at six different sites by 28 sonographers, albeit 10 performed the majority of image acquisitions. Four readers then performed the IMT measurements.
The strengths of our article are findings that apply to a large multi-ethnic cohort with an age between 45 and 84 years and composed of four ethnic groups. The study design was such that key cardiovascular risk factors were available as well as a blinded adjudication process that did not look at the IMT results in the ascertainment process of PAD events.
Conclusion
We conclude that ed-CCA IMT measurements and mt-IMT measurements are associated with PAD outcomes. These findings will need confirmation by other studies.
Footnotes
Acknowledgements
Declaration of conflicting interests
The authors declared no potential conflicts of interest with respect to the research, authorship, and/or publication of this article.
Funding
The authors disclosed receipt of the following financial support for the research, authorship, and/or publication of this article: this research was supported by contracts HHSN268201500003I, N01-HC-95159, N01-HC-95160, N01-HC-95161, N01-HC-95162, N01-HC-95163, N01-HC-95164, N01-HC-95165, N01-HC-95166, and N01-HC-95167 from the National Heart, Lung, and Blood Institute, and by grants UL1-TR-000040, UL1-TR-001079, and UL1-TR-001420 from NCATS as well as R01 HL069003 and R01 HL081352.