
Abstract
An exercise ankle–brachial index (ABI) test can provide further insight into the functional significance of peripheral artery disease (PAD). The variability in its use, associated patient factors and its relation to patients’ symptoms are unknown. From the international PORTRAIT registry, we identified 1131 patients with PAD. We fit a hierarchical logistic regression model, adjusting for patient factors, country and site, to examine predictors of and variation in ordering exercise ABI testing. We also examined the associations between test components and health status as quantified by the Peripheral Artery Questionnaire (PAQ) using semi-parametric regression methods. Testing was ordered in 22% in the United States versus 80% in the Netherlands and 90% in Australia. Testing was likely to be performed if the patient was male, younger, had typical symptoms and a higher resting ABI, with substantial variability across sites (median odds ratio=5.9, 95% CI: 3.2–19.5). Adjusting for country and site, the resting ABI and all exercise ABI metrics were associated with the PAQ Physical Limitation score. In addition, important components of the test, namely time to onset of claudication, pain-free walking distance (PFWD), and maximum walking distance (MWD), were also associated with PAQ Symptoms and Summary scores. More importantly, even after adjusting for resting ABI, a patient with a post-exercise ABI of 0.29 (25th percentile), compared to 0.61 (75th percentile), achieved 4.4 (95% CI: 0.4–8.4, p=0.031) points less on the PAQ Physical Limitation score. Exercise ABI test use is remarkably variable, and less used in the United States. Its data, specifically PFWD and MWD, might help in objectively assessing the impact of PAD on patients’ functioning and quality of life.
Keywords
Introduction
Health status (symptoms, functioning, and quality of life) is an important endpoint1–4 in patients with peripheral artery disease (PAD), and is known to be associated with certain patients’ baseline characteristics5,6 and clinical outcomes.7–9 A compromised health status and functioning due to PAD is often also the primary reason why symptomatic patients seek specialty care. Hence, it is imperative to assess the functional status of these patients, especially when claudication is the presenting symptom. While resting ankle–brachial index (ABI) is an established predictor of health status in patients with PAD,10–12 little is known about post-exercise ABI. The American College of Cardiology/American Heart Association (ACC/AHA) guidelines recommend post-exercise ABI only when the resting measurement is normal and symptoms are suggestive of PAD, 2 and this diagnostic application dominates exercise ABI test utilization in daily clinical practice. However, exercise ABI, compared to resting ABI, is a functional test, and the information (time to onset of claudication, pain-free walking distance (PFWD) and maximum walking distance (MWD)) obtained may provide greater insight into the functional significance of PAD. We investigated the variability in the use of exercise ABI testing, patient factors associated with its use, and its relation to patients’ health status as quantified by the validated and PAD-specific Peripheral Artery Questionnaire (PAQ). 13
Methods
Study population
The PORTRAIT (Patient-centered Outcomes Related to TReatment practices in peripheral Arterial disease: Investigating Trajectories) PAD is an international multicenter cohort study which enrolled 1275 patients with PAD (resting ABI ≤ 0.9 or a drop in post-exercise ankle pressure of ≥ 20 mmHg), 14 who presented to 16 PAD specialty clinics between 06/2011 and 12/2015 with new-onset or exacerbation of their claudication. 15 Patients with incompressible vessels (resting ABI ≥ 1.30), critical limb ischemia, or lower extremity revascularization within 1 year of enrollment were excluded. PORTRAIT aims to analyze the relation between patients’ outcomes at 1 year, the medical care they receive, and their baseline characteristics. For the present analyses, we studied only those who had documented resting ABI ≤ 0.90 within 3 months of enrollment (n=1131; 115 had a resting ABI ≥ 0.90, 22 had ABI assessments more than 3 months prior to enrollment, and seven had no documented ABI). Of these, exercise ABI tests were available in 571 (50%) patients. The study was approved by the appropriate institutional review boards (IRBs) and informed consent was obtained from all participating patients.
Data collection, ABI testing, and primary endpoint
Medical records were reviewed up to 1 year pre- and 1 month post-enrollment to acquire the following data: demographics, cardiovascular and non-cardiovascular comorbidities, relevant laboratory results, compliance with the PAD performance measurement set (antiplatelet medications, statins, supervised exercise therapy, and smoking cessation) as suggested by societal guidelines, and PAD-specific data (symptomatic leg, level of claudication, Rutherford category, pulse examination, and invasive and non-invasive testing, including ABI). Other information in regard to the socioeconomic, psychosocial, and functional status of the study’s patients was collected through a baseline interview of each patient at the outpatient clinic or over the phone at the time of enrollment.
The resting ABI for each leg was calculated by dividing the highest ankle systolic blood pressure (posterior tibial or dorsalis pedis) by the highest brachial systolic blood pressure; all resting pressures were measured using a Doppler device at least 5 minutes after the patient had rested quietly in the supine positon. Resting pressures were re-measured after performing a treadmill exercise protocol, and the post-exercise ABI was re-calculated. The lowest of the two legs’ ABI was considered the index ABI for each patient. Each site conducted ABI testing using its own vascular lab’s equipment and exercise protocol. Additionally, and if available, time to the onset of claudication, PFWD and MWD were captured from the exercise testing report. All ABI testing was performed within 3 months of enrollment and prior to undergoing any peripheral invasive procedures.
Each patient’s health status was quantified using the validated and PAD-specific Peripheral Artery Questionnaire (PAQ) 13 conducted at the time of enrollment by trained coordinators at each enrollment site. The PAQ consists of 20 items and scores health status in six different aspects: Physical Limitation, Symptoms, Symptom Stability, Social Limitation, Treatment Satisfaction, and Quality of Life. A Summary score is also generated. Each score ranges between 0 and 100, with lower scores indicating worse health status and higher ones indicating better health status. In this study, the Physical Limitation score was chosen as the primary endpoint, while Symptoms and Summary scores were secondary endpoints.
Statistical analysis
Baseline characteristics of those who had an exercise ABI test ordered versus those who did not were examined. Continuous variables are displayed as mean ± standard deviation and were compared using t-tests. Categorical variables are displayed as counts and percentages and were compared using chi-squared or Fisher’s exact tests. Characteristics were also compared using standardized differences. The standardized difference is a measure of effect size, calculated as the difference in means divided by a pooled estimate of the within-group standard deviations and expressed as a percent. Unlike p-values, standardized differences do not depend on the sample size. Standardized differences > 10% have been suggested as indicating imbalances between groups.16,17
We examined the variation in frequency of ordering exercise ABI tests across study sites and countries graphically using bar plots. Next, we fit a hierarchical logistic regression model to examine predictors of, and to quantify site variability in, ordering exercise ABIs. We included the following predictor variables based on clinical judgment: country, age, sex, race, chronic heart failure, prior stroke, prior peripheral intervention, prior amputation, atypical versus typical symptoms, new-onset versus exacerbation of symptoms, location of claudication, Rutherford class and resting ABI. The model also included a random effect for site. Site variation was expressed using the median odds ratio (MOR). The MOR is a transformation of the site-level variance and represents the median relative difference in odds of receiving an exercise ABI test for patients with identical covariates seen at two different sites. 18 Larger MORs denote greater variability. For example, an MOR of 1.5 would denote that, for two patients with the same covariates seen at two randomly select sites, the odds ratio for receiving an exercise ABI at one site versus the other would exceed 1.5 about 50% of the time.
Finally, we explored the associations of resting ABI and various exercise test measures (post-exercise ABI, time to the onset of claudication, PFWD and MWD) with patients’ health status, as quantified by the PAQ Physical Limitation, Symptoms and Summary scores. We first examined these relationships visually with scatterplots, using smoothing splines to fit non-linear trends. Next, we estimated the effect of each measure individually on PAQ scores using mixed-effect models adjusting for country and site; non-linear associations were accommodated using restricted cubic splines. Associations were summarized as the adjusted mean difference in PAQ scores between the 1st and 3rd quartiles of the given measure, in order to facilitate comparability of effect sizes across the different measures. Finally, we repeated the analyses of post-exercise ABI adjusting for resting ABI in addition to country and site. A p-value of < 0.05 defined the threshold for statistical significance. All statistical analyses were performed using SAS software, Version 9.4 (SAS Institute Inc., Cary, NC, USA) and R version 3.4.0. 19
Results
Baseline characteristics
Of the 1131 patients with resting ABI ≤ 0.90, only half (n=571) had an exercise ABI test ordered. Patients who received exercise testing, compared to those who did not, were more likely to be from the Netherlands or Australia, younger, male, white, have fewer cardiovascular comorbidities, and were less likely to have a history of prior peripheral intervention or amputation. In addition, they presented with milder exertional symptoms and had higher baseline resting ABI measurements (Table 1). There were also significant differences between the two groups in regard to baseline socioeconomic status, psychosocial factors, activity level, and PAD risk management, with higher education level, lower economic status, and a more sedentary life in those who did not have the exercise ABI test performed. Although the latter group was often on optimal medical treatment, possibly due to higher cardiovascular comorbidities, they were much less likely to receive supervised PAD exercise therapy (2.9% vs 41.2%) compared to the group that had exercise ABI testing (Supplemental Table 1).
Baseline characteristics of patients according to ordering exercise ABI testing.
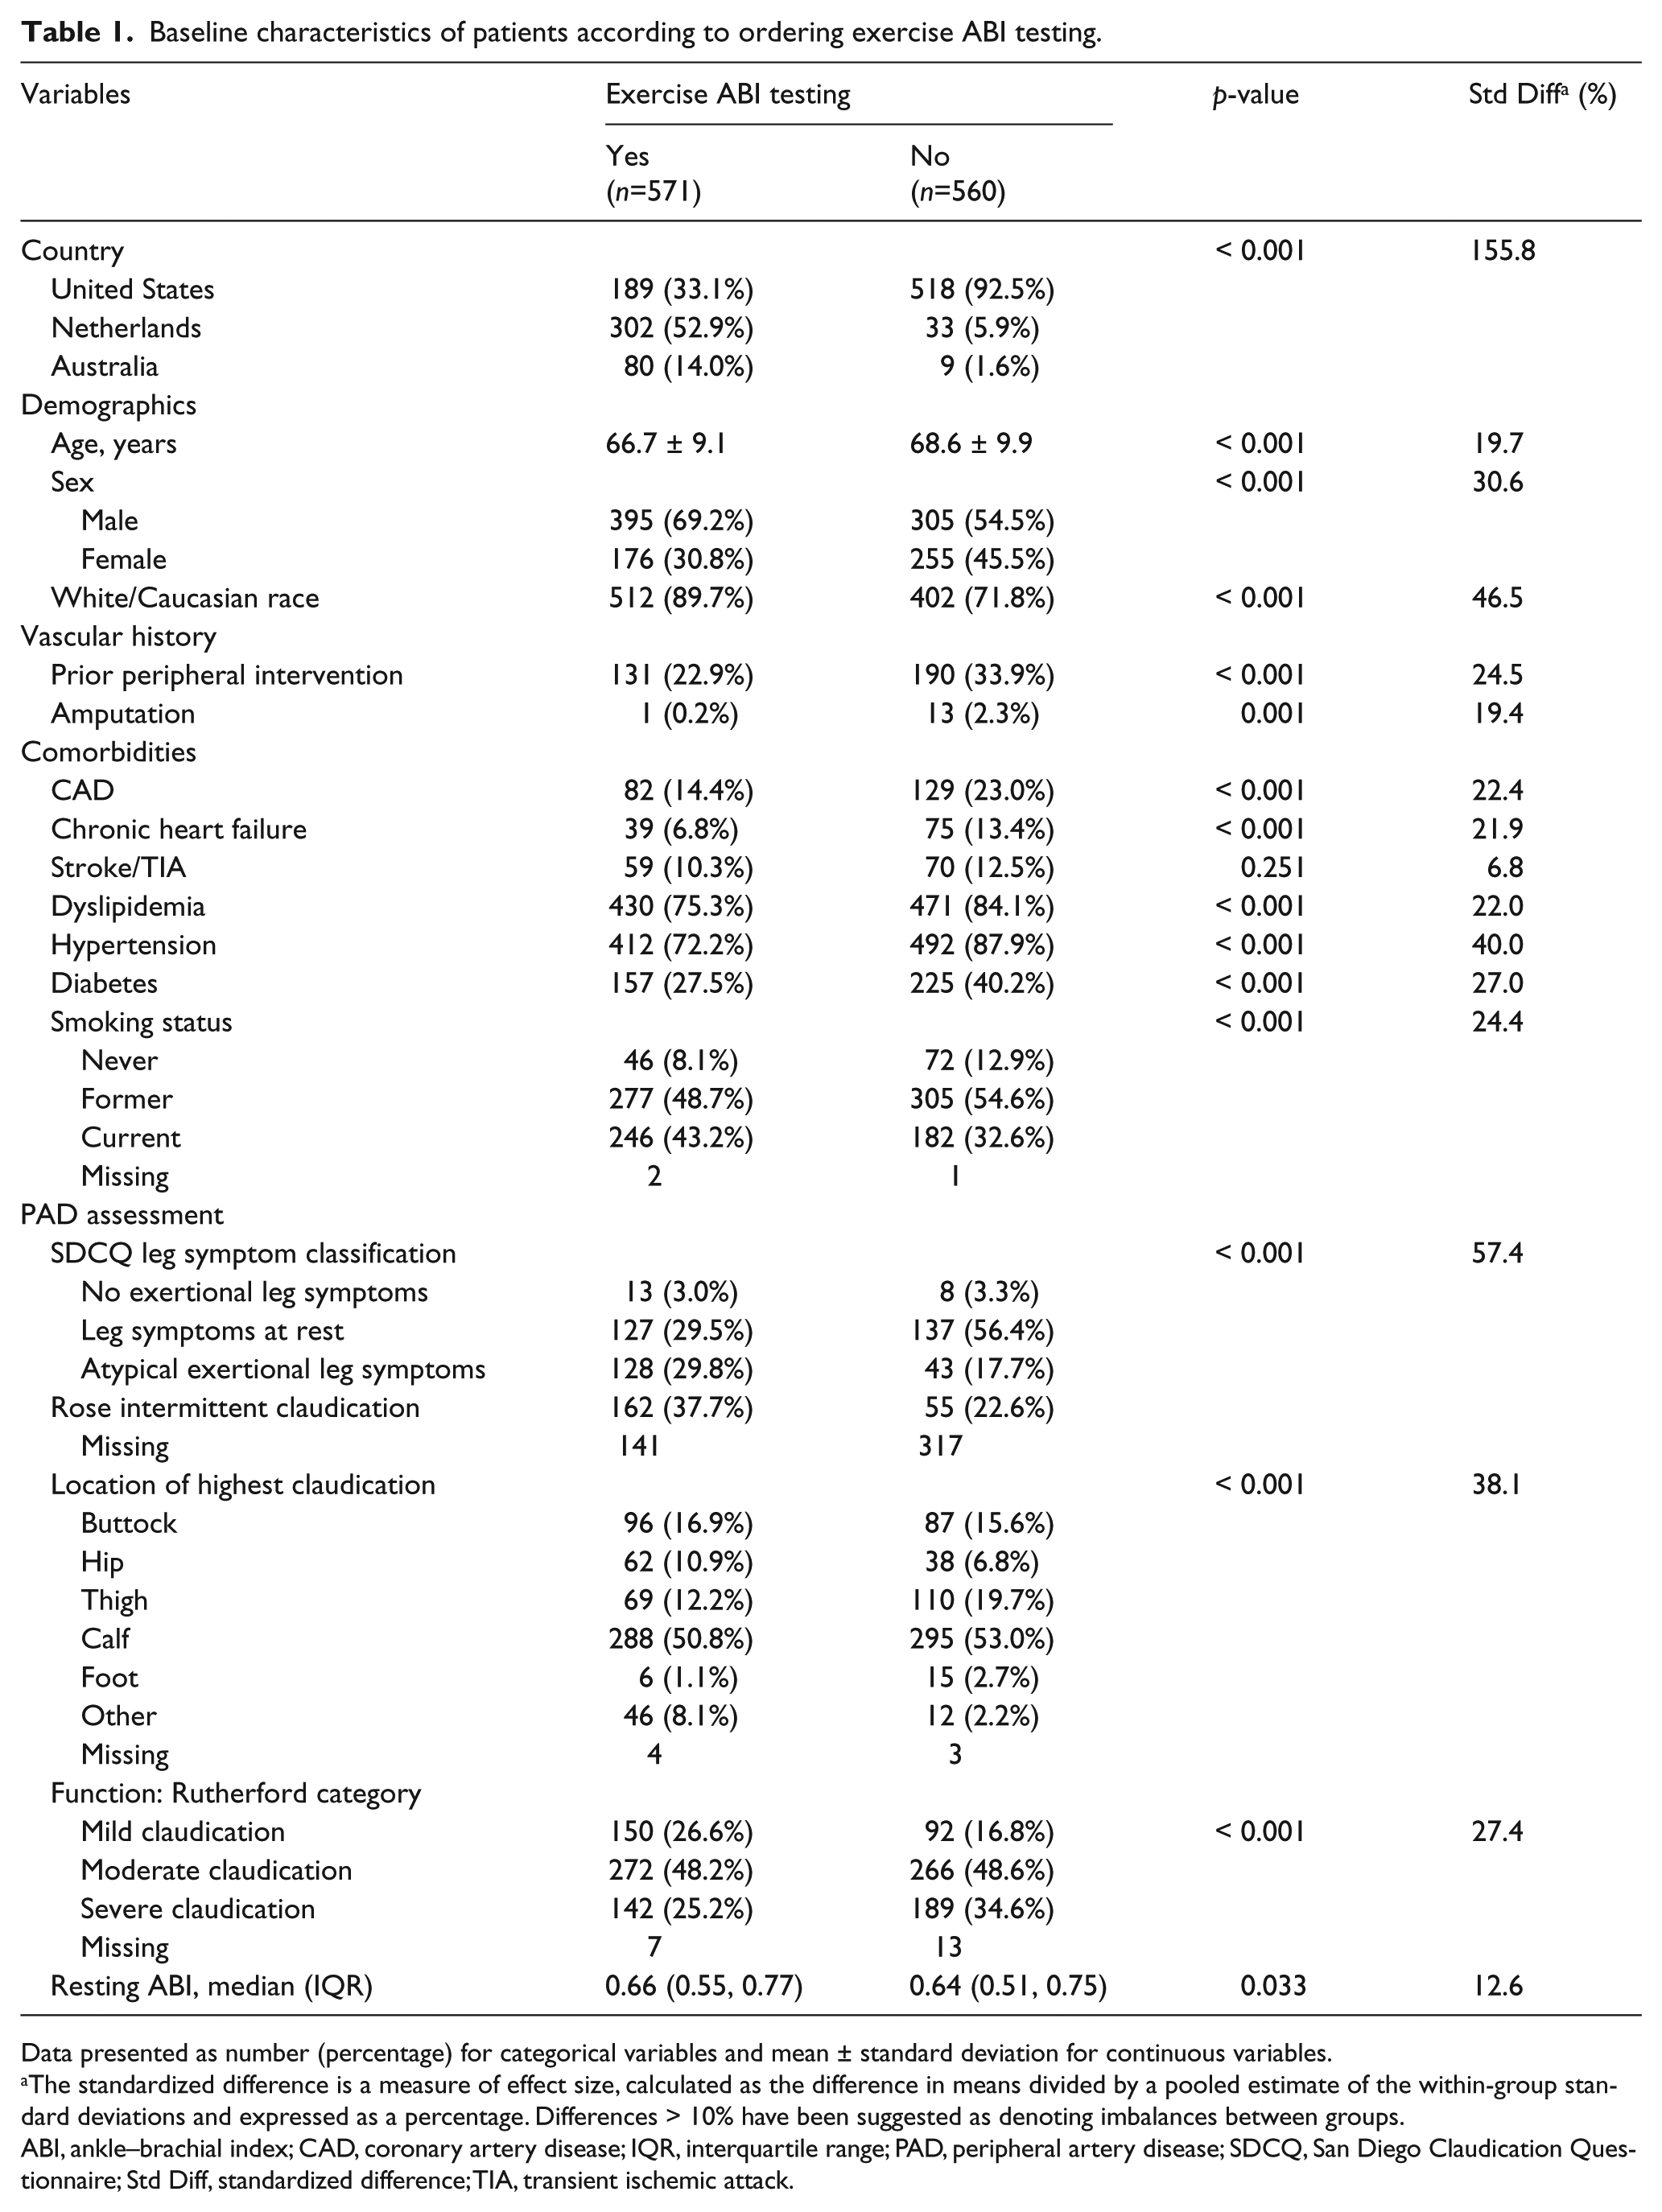
Data presented as number (percentage) for categorical variables and mean ± standard deviation for continuous variables.
The standardized difference is a measure of effect size, calculated as the difference in means divided by a pooled estimate of the within-group standard deviations and expressed as a percentage. Differences > 10% have been suggested as denoting imbalances between groups.
ABI, ankle–brachial index; CAD, coronary artery disease; IQR, interquartile range; PAD, peripheral artery disease; SDCQ, San Diego Claudication Questionnaire; Std Diff, standardized difference; TIA, transient ischemic attack.
Variability in and predictors of the use of exercise ABI testing
There was a total of 16 investigational PAD centers across three different continents: 10 in the United States, five in the Netherlands, and one in Australia. Australia had the highest rate of ordering exercise ABI testing (90%), followed by the Netherlands (average of 80% per center) and lastly the United States, where ordering exercise ABI testing ranged from 0% to 68% (average of 22%) depending on the center (Figure 1).
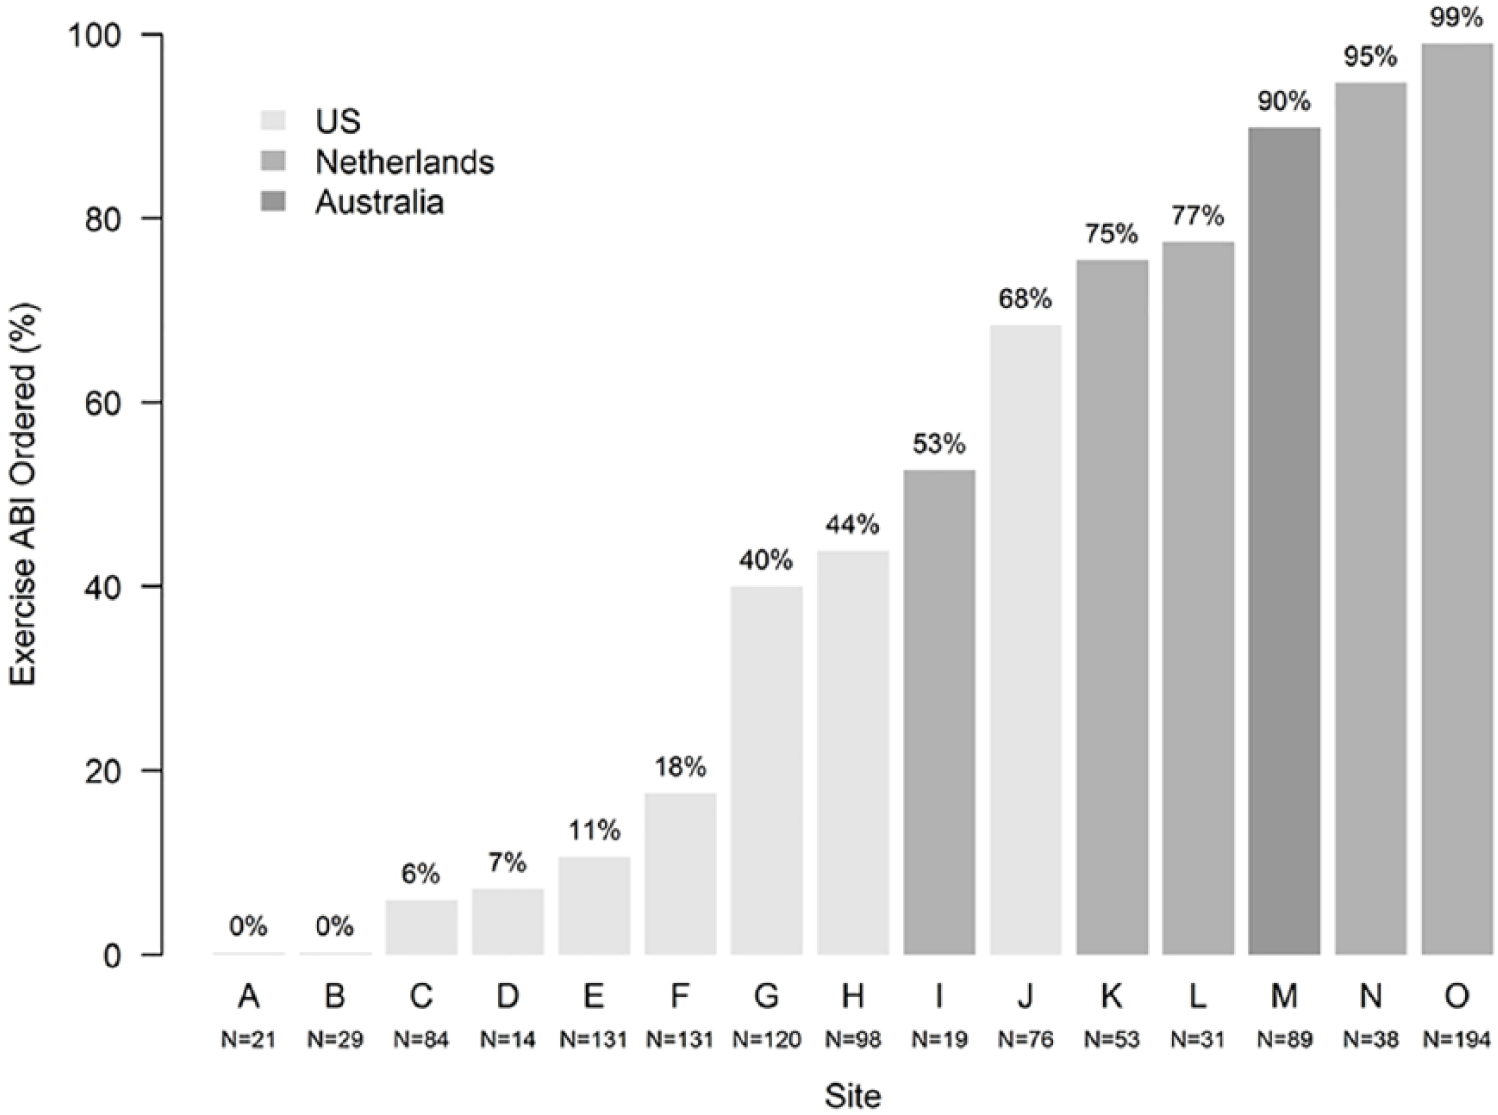
The variation in ordering exercise ABI testing by country and center.
In a hierarchical logistic regression model adjusting for patient characteristics, country, and site, patients’ likelihood to undergo exercise ABI testing was site-dependent (MOR=5.9, 95% CI: 3.2–19.5) and increased if they were male (OR=2.0, 95% CI: 1.4–2.9), younger, had typical symptoms (OR=3.5, 95% CI: 1.9–6.5), and had near normal resting ABI measurements (Figure 2).
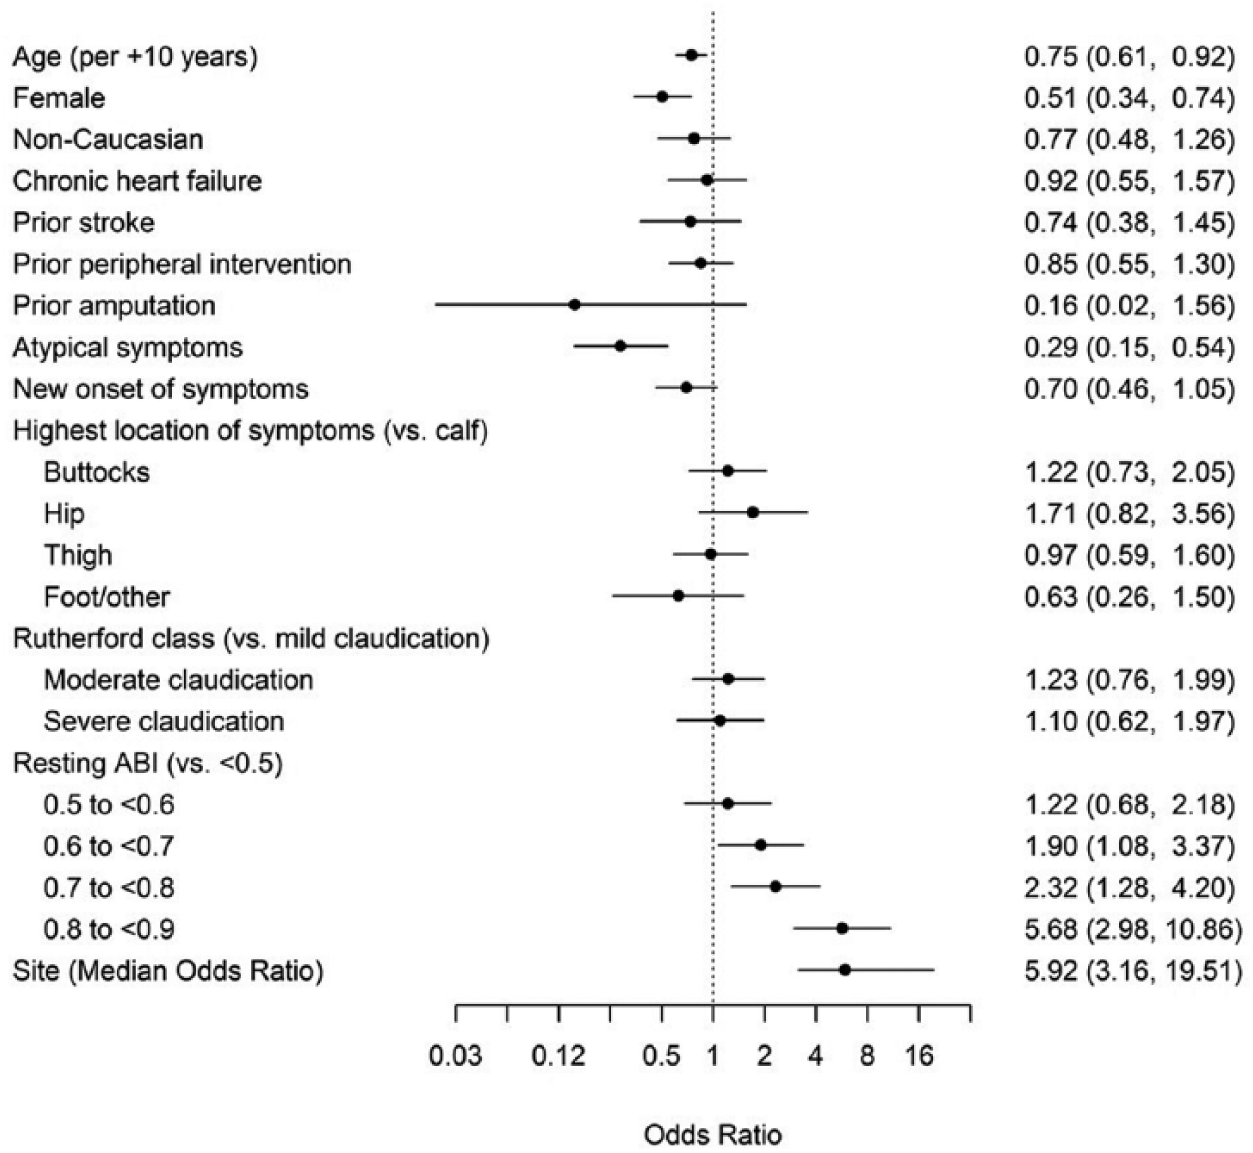
Predictors of ordering exercise ABI testing.
Association between exercise ABI testing and health status
Unadjusted analyses showed various patterns and strengths of the relationship between resting ABI/exercise testing measures (post-exercise ABI, time to onset of claudication, PFWD, and MWD) and PAQ scores (Physical Limitation score, Symptoms score, and Summary score) (Figures 3–5). Time to claudication, PFWD, and MWD were consistently associated with all three PAQ domain scores (p ≤ 0.001), whereas resting ABI (p=0.003) and post-exercise ABI (p=0.004) were associated with the PAQ Physical Limitation score, and an association was found between resting ABI and PAQ Summary scores (p=0.02).
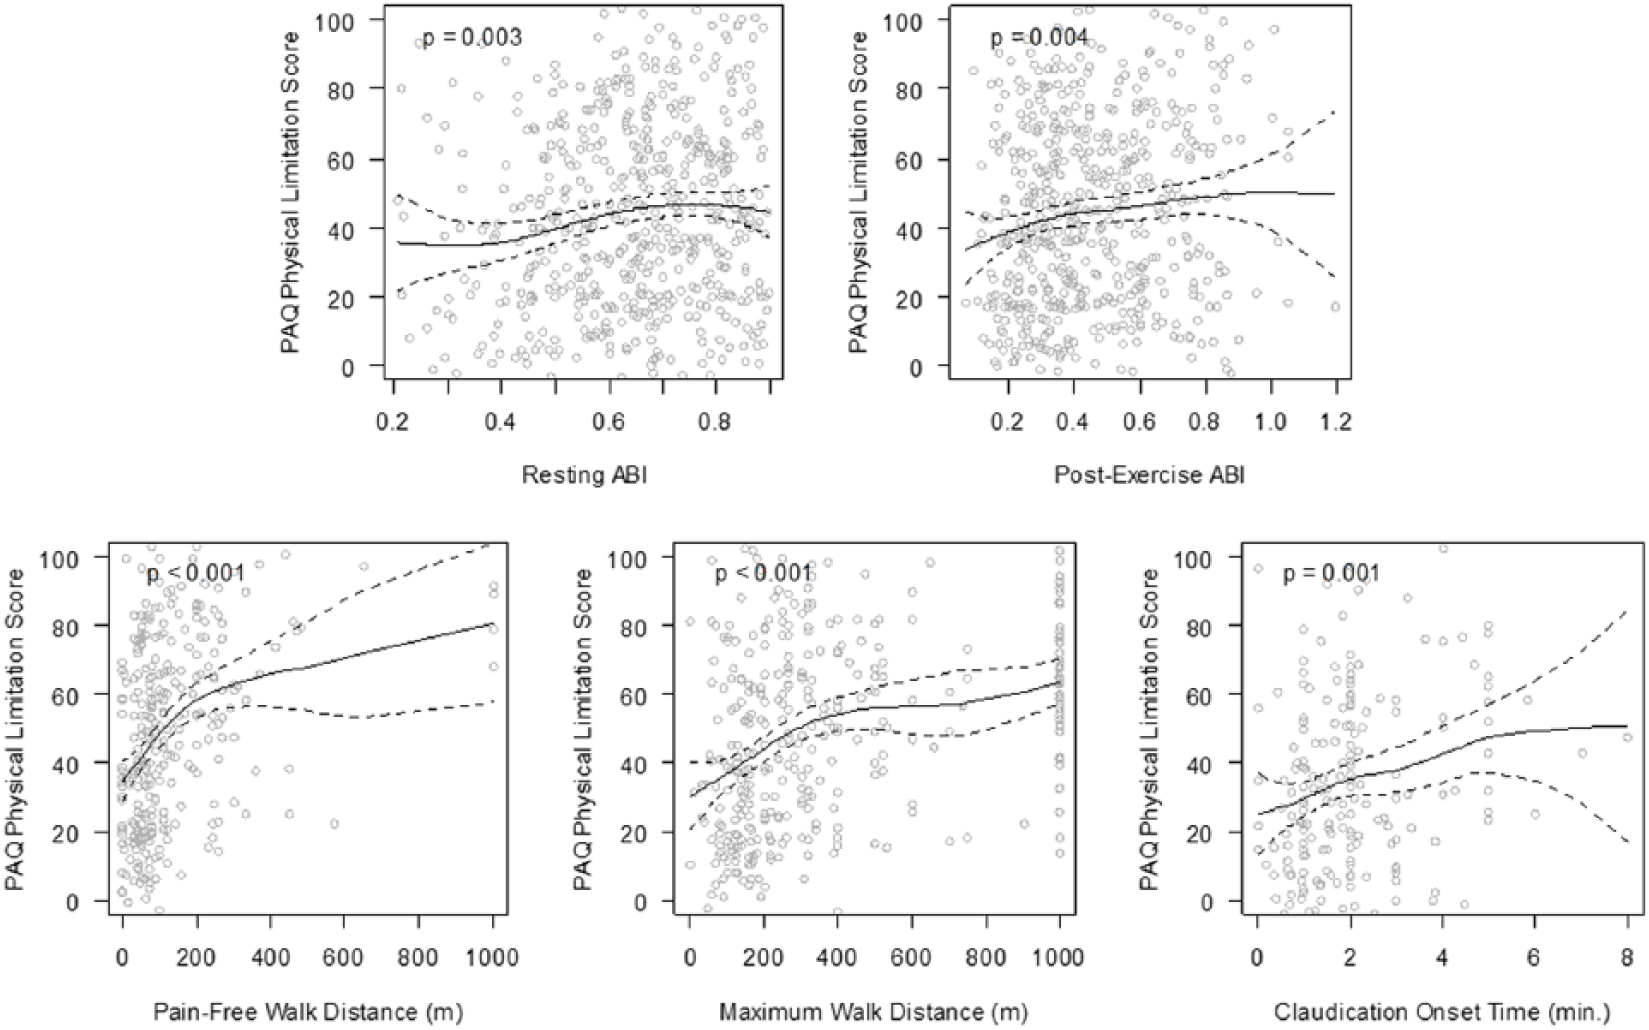
Scatterplots of resting ABI and exercise ABI test components (post-exercise ABI, time to onset of claudication, PFWD, and MWD) against the PAQ Physical Limitation score.
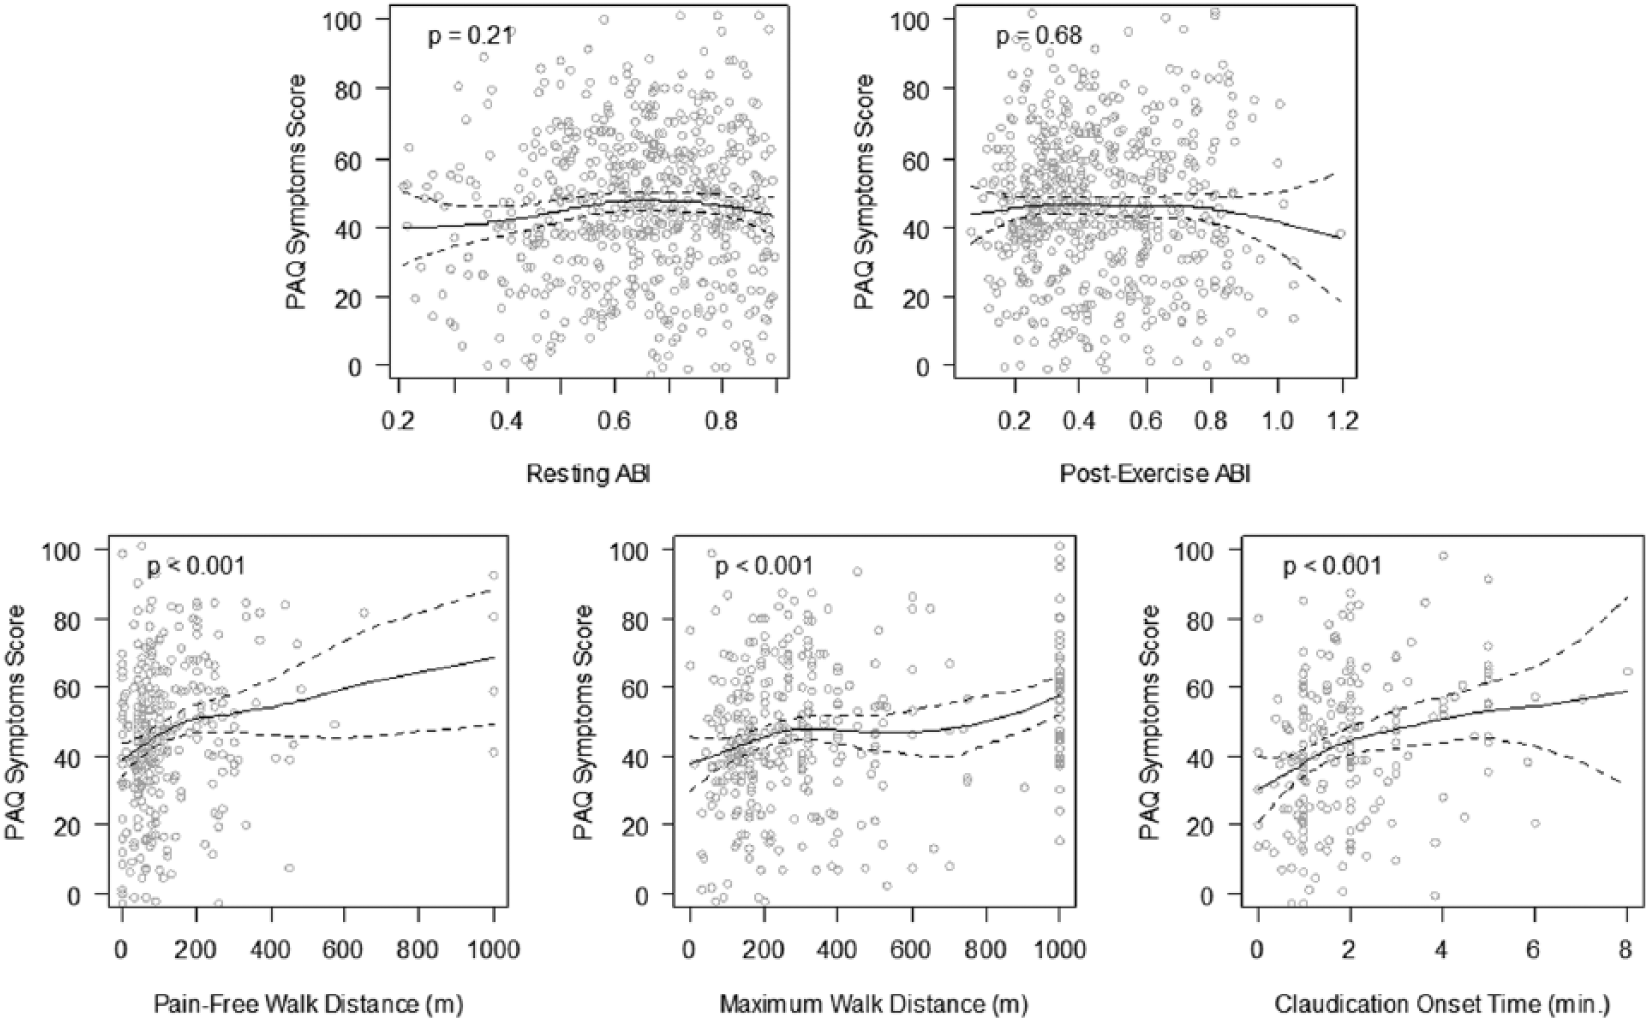
Scatterplots of resting ABI and exercise ABI test components (post-exercise ABI, time to onset of claudication, PFWD, and MWD) against the PAQ Symptoms score.
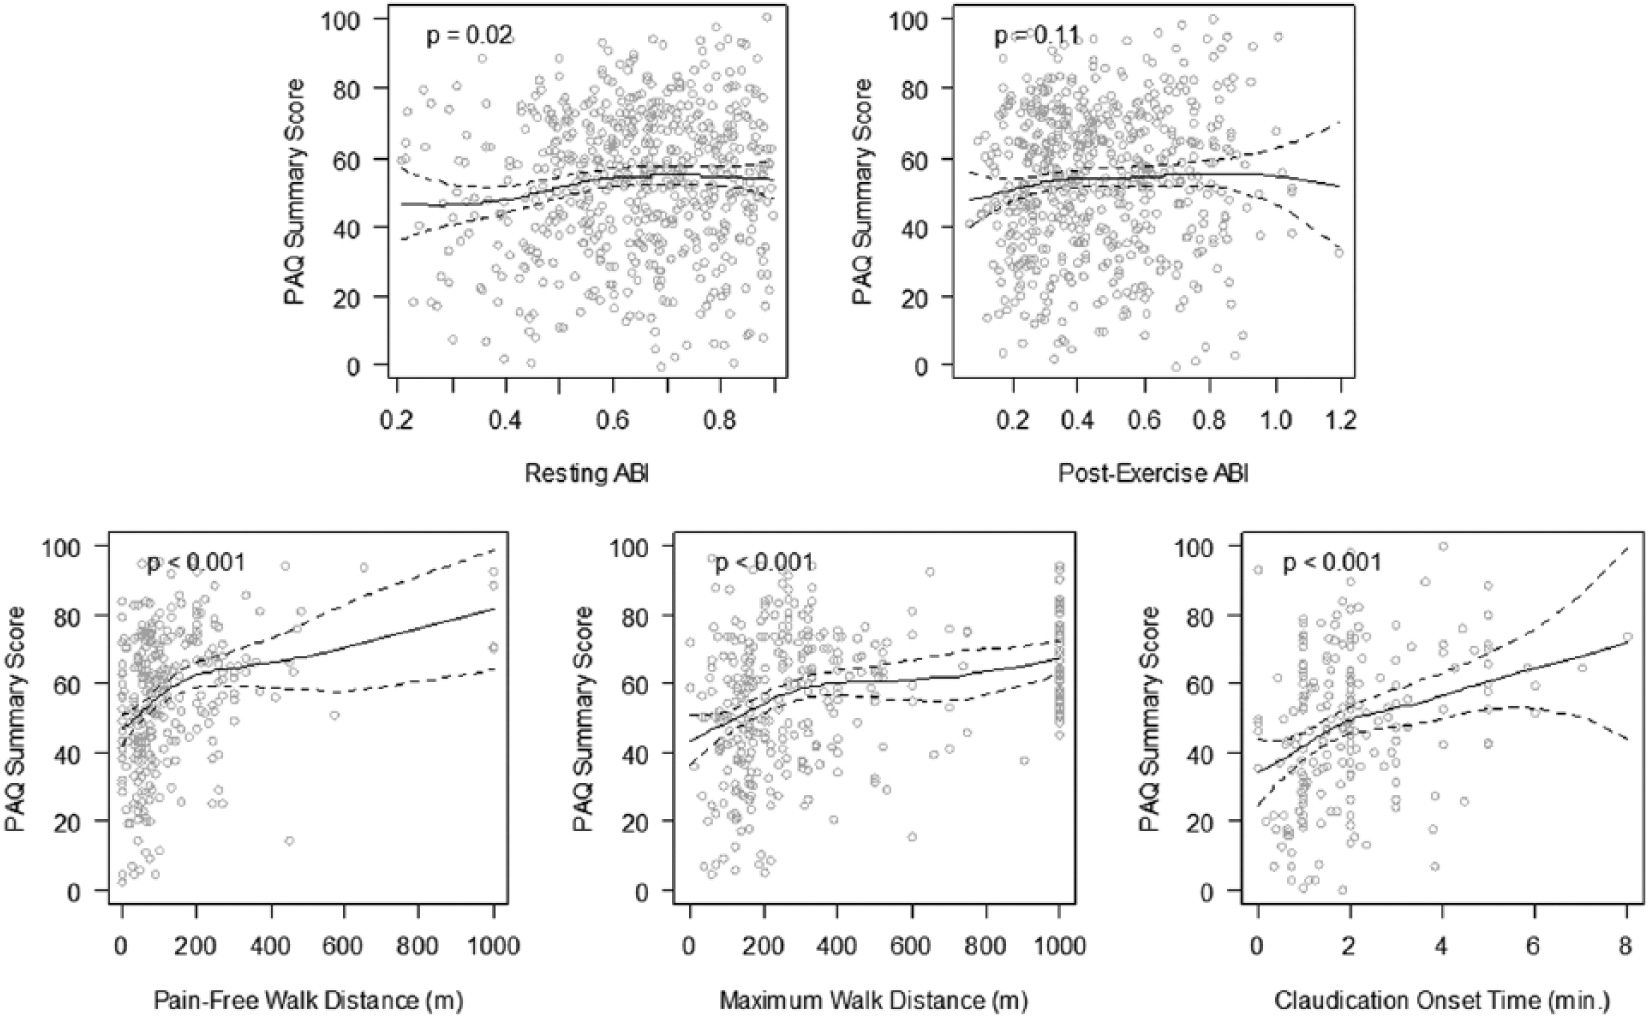
Scatterplots of resting ABI and exercise ABI test components (post-exercise ABI, time to onset of claudication, PFWD, and MWD) against the PAQ Summary score.
In mixed-effect models, adjusting for country and site, the estimated difference in the PAQ Physical Limitation score between the 1st (0.29) and 3rd (0.61) quartiles of post-exercise ABI was significant (6.1, 95% CI: 2.9–9.4, p < 0.001). In addition, resting ABI and other exercise testing measures (time to claudication, PFWD, and MWD) maintained their observed associations with PAQ scores in the non-linear regression models (Table 2). The observed impact of PFWD and MWD on PAQ scores was greater in the Physical Limitation domain; the latter increased by 13.4 (95% CI: 8.5–18.3, p<0.001) between the 1st (50 meters) and 3rd quartiles (168.5 meters) of PFWD and by 15.2 (95% CI: 9.3–21.1, p<0.001) between the 1st (150 meters) and 3rd quartiles (460 meters) of MWD. For claudication onset time, the highest influence was noted on the PAQ Summary score, which varied by 10.3 (95% CI: 5.2–15.4, p<0.001) between the 1st (1 minute) and 3rd (2.37 minutes) quartiles.
Associations between resting ABI and exercise testing measures, and PAQ scores.
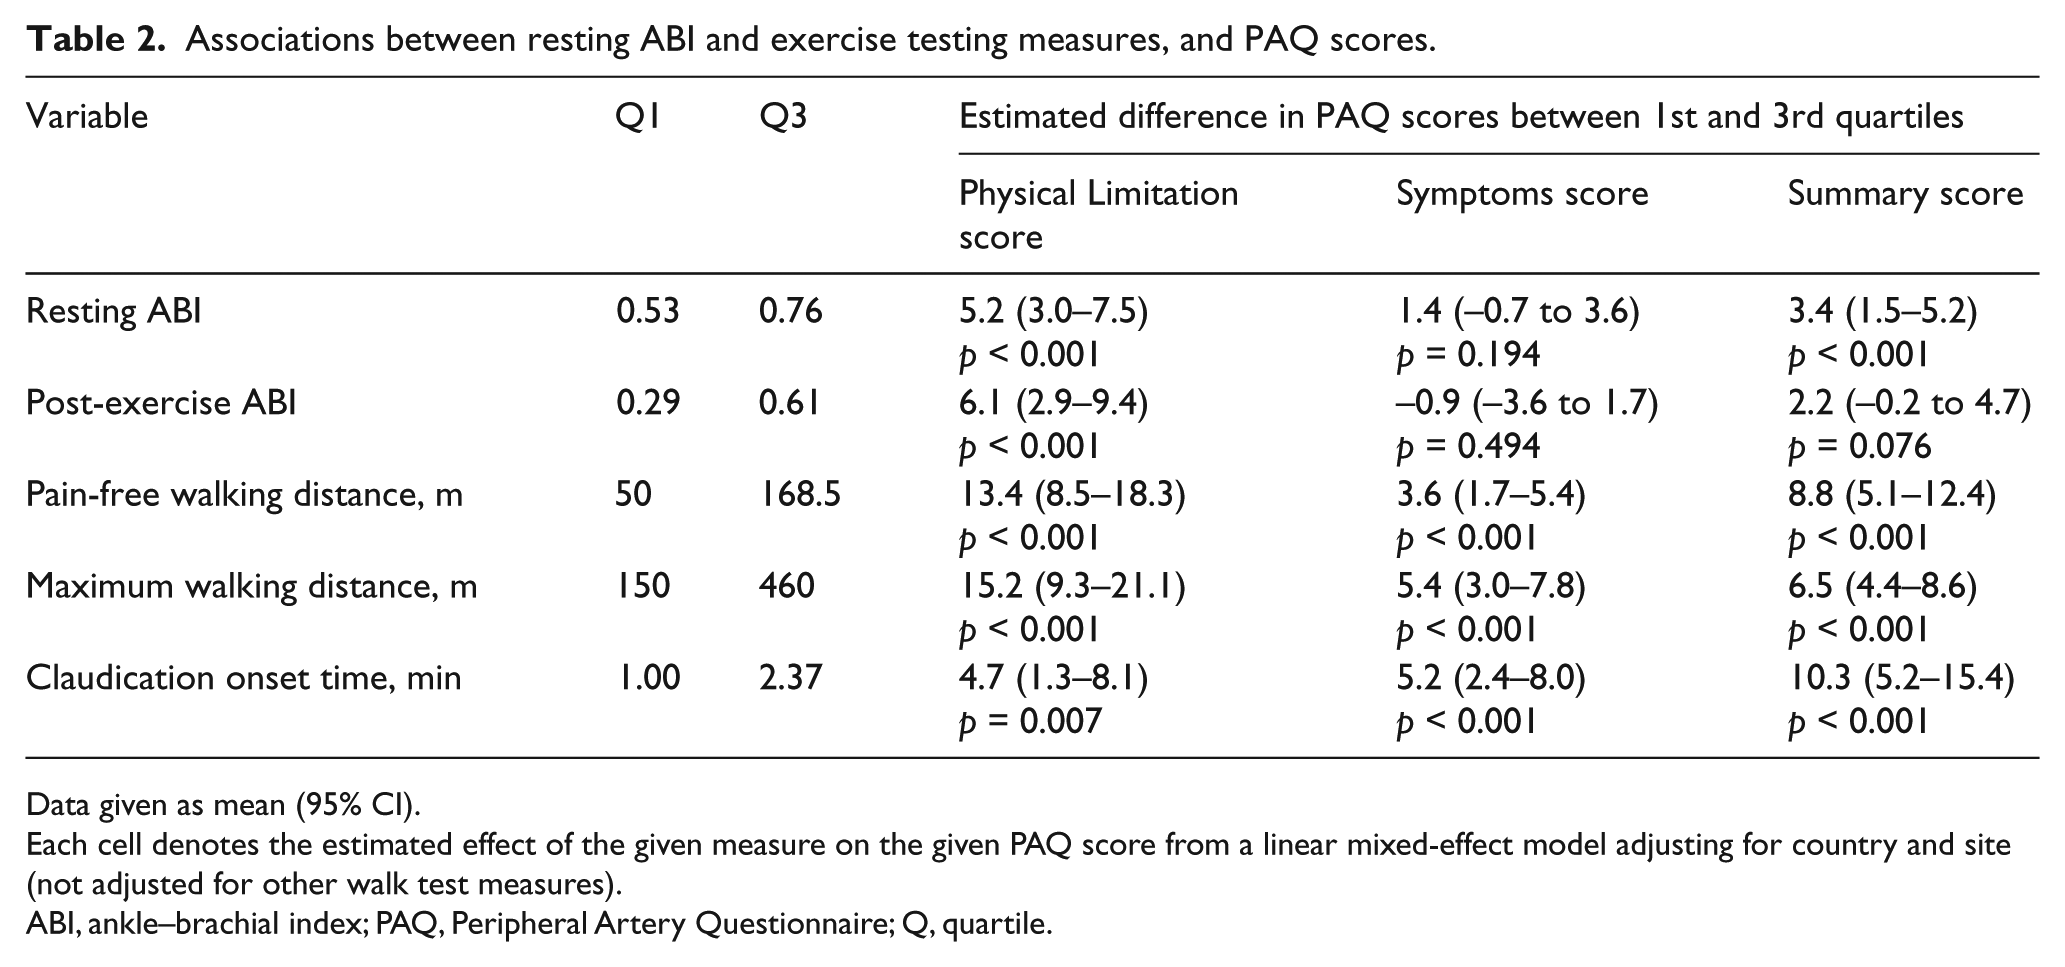
Data given as mean (95% CI).
Each cell denotes the estimated effect of the given measure on the given PAQ score from a linear mixed-effect model adjusting for country and site (not adjusted for other walk test measures).
ABI, ankle–brachial index; PAQ, Peripheral Artery Questionnaire; Q, quartile.
Remarkably, the associations of post-exercise ABI with the PAQ Physical Limitation score remained significant even after adjusting for resting ABI, with an estimated difference of 4.4 (95% CI: 0.4–8.4, p=0.031) (Table 3).
Associations between post-exercise ABI and the PAQ Physical Limitation score after adjusting for resting ABI.
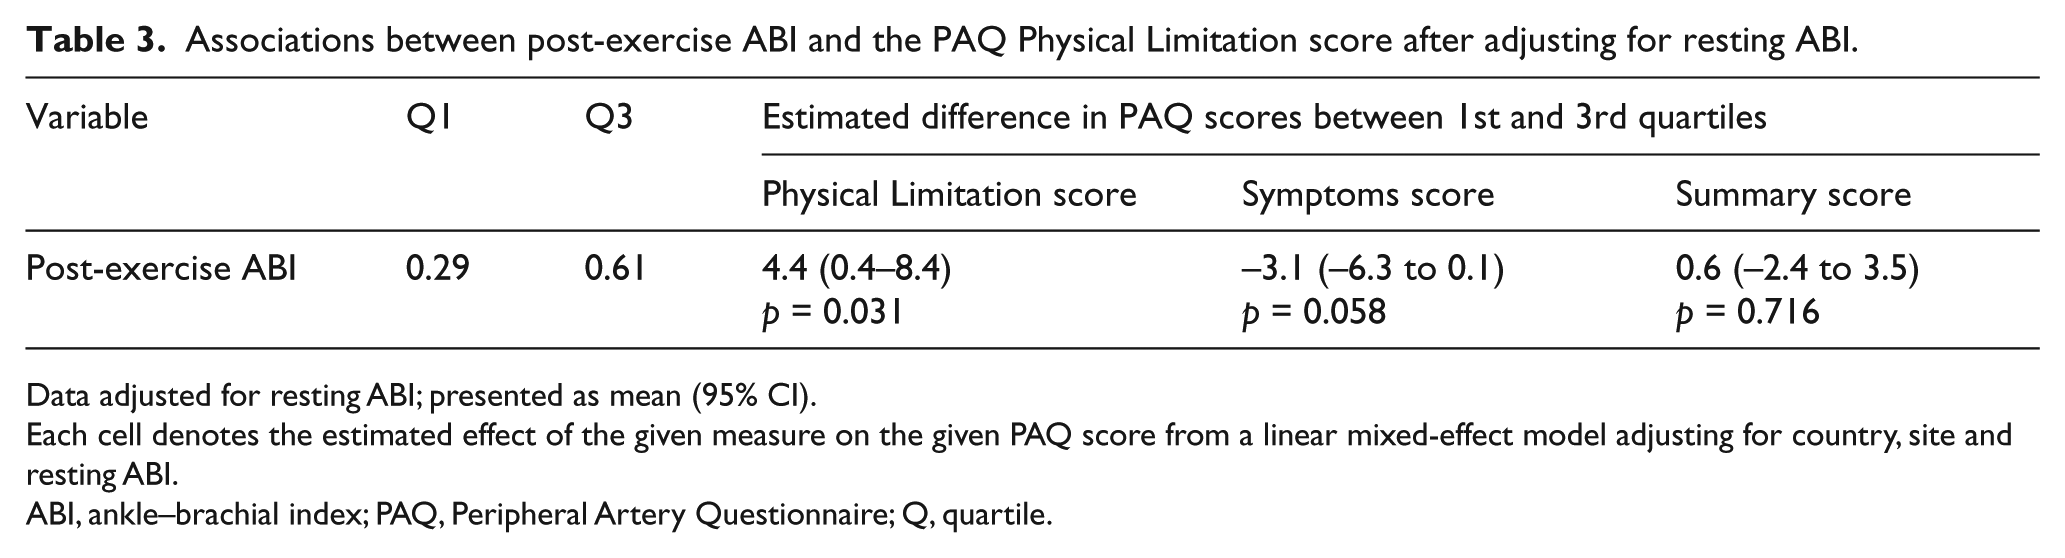
Data adjusted for resting ABI; presented as mean (95% CI).
Each cell denotes the estimated effect of the given measure on the given PAQ score from a linear mixed-effect model adjusting for country, site and resting ABI.
ABI, ankle–brachial index; PAQ, Peripheral Artery Questionnaire; Q, quartile.
Discussion
We found a substantial variation in ordering exercise ABI testing in symptomatic patients with PAD and claudication, with sites that order no exercise ABI testing to clinics ordering it almost 100% of the time. Female and elderly patients with atypical symptoms and lower resting ABI values seemed to have the least amount of opportunities of receiving this test, especially if they were located in the United States. Importantly, post-exercise ABI, even beyond resting measurements, appears to be capable of predicting the functional status of patients with PAD. After adjusting for resting ABI, there was a four to five point difference in the PAQ Physical Limitation score between a patient who scores in the middle of the lower half, and another patient who scores in the middle of the upper half of the distribution of post-exercise ABI. Furthermore, exercise testing provides other measures (time to claudication, PFWD, and MWD) that provide an assessment of patients’ functioning, strongly mirroring the health status of these patients. For example, the impact on the PAQ Physical Limitation score from the change between the 1st and 3rd quartiles for each of PFWD and MWD, compared to that of resting ABI, is three times greater.
Data have consistently shown that patients’ health status, specifically the level of physical functioning, is greatly impacted in patients with PAD,1–4 especially in those with exertional leg symptoms. 20 In fact, diminished functioning due to exertional leg symptoms is the primary reason for seeking care in patients with symptomatic PAD. Besides cardiovascular risk management, improving patients’ functioning and reducing their symptoms are the primary treatment goals of PAD. Therefore, the evaluation of patients’ functioning seems to be an essential part of the PAD evaluation to help physicians better understand the burden of PAD and patients’ needs, to make informed treatment decisions, and to be able to monitor the response to therapy. Thus, there has been an increasing emphasis by many relevant societies on including functional-focused outcomes in PAD studies.2–4 Many subjective, yet few objective, tools are available to help measure these meaningful patient-centered outcomes.13,21,22
In the current study, we showed that there are some US centers that did not use this test, with an average use of only 22% per center within the US. How are we objectively assessing functional performance in the rest of these patients (78%)? This may explain in part why only 2.9% of those who did not receive exercise ABI testing, compared to 41.2% of those who did, had a prescription for a supervised exercise program. Even among those 2.9%, and in the absence of baseline objective functional assessment, how are we supposed to monitor their response to prescribed training? Unfortunately, the main focus of exercise ABI testing is its diagnostic value, while other walking metrics are usually overlooked. The 2016 ACC/AHA guidelines state that ‘In patients with PAD and an abnormal resting ABI (≤ 0.90), exercise treadmill ABI testing can be useful to objectively assess functional status’ 2 with a ‘IIa’ class of recommendation and ‘B-NR’ level of evidence based on one study by Raines et al. who defined the probability of having limiting claudication based on post-exercise ankle pressure values. 23
Mixed data exists regarding resting ABI. Many studies found that lower resting ABI values were linked to greater functional loss, applying non-PAD specific tools like the Short Form (36) Health Survey (SF-36) and Walking Impairment Questionnaire (WIQ).10–12 On the other side, Long et al., 24 using the same tools, detected only a weak and non-significant correlation between resting ABI and physical performance. Our results, using PAQ, showed that resting ABI was associated with functional performance; however, post-exercise ABI appears to offer a fair objective evaluation of the functional condition of these patients, and in excess of that provided by resting measurement. Notably, post-exercise ABI failed to predict the PAQ Symptoms score; this is perhaps related to the fact that many patients with claudication are likely to limit their activities to soften their symptoms. 25 In our prior work, we demonstrated a post-exercise ABI ability to predict future lower extremity revascularization among those with an already abnormal resting ABI; if a patient has a drop of > 20% with exercise, then he/she is two times more likely to undergo revascularization compared to the same patient who did not have this drop. 26 Though the exact mechanism is still not fully understood, according to this study, those who dropped their ABI values with exercise were probably more likely to have poor functional performance necessitating an intervention. More importantly, exercise testing offers other quantitative information (time to onset of claudication, PFWD and MWD), which greatly concords with all PAQ scores and therefore substantially enhances physicians’ understanding of the patient’s health status and helps physicians make an appropriate treatment decision.
Study limitations
The current work needs to be interpreted against the following limitations. The PORTRAIT enrollment process allowed for either an abnormal resting ABI or an abnormal exercise ABI; thus, all those with a normal resting ABI, but not necessarily all those with an abnormal resting ABI, had exercise ABI testing and were enrolled if they had the required drop. In addition, only those with symptomatic PAD were involved; however, the impact of PAD on health status is greater in those with claudication. 20 The heterogeneity of exercise protocols among different centers may have affected our results; however, this represents real world practice and highlights the need for more efforts to standardize exercise protocols and health status questionnaires. Lastly, although we have shown that exercise ABI testing predicts functional performance in patients with claudication, this is only a thought-generating analysis and no conclusion can be made regarding this application of exercise ABI testing in clinical practice, as this would require further research of its impact on patient outcomes.
Conclusion
Assessment of the functioning of patients with claudication is vital, as their symptoms and functioning are the main reason why they seek PAD specialty care. Non-diagnostic application of exercise ABI testing in those with known PAD (resting ABI ≤ 0.9) is remarkably variable, with lower rates in patients who are elderly, in women, in those with atypical symptoms, and in patients with near normal resting ABI values, especially if they were in the US. However, careful examination of exercise ABI testing results (post-exercise ABI, time to claudication, PFWD, and MWD) appears to be helpful in evaluating functional performance in such patients. This objective tool might need to be considered more and should not replace, but only complement, subjective questionnaires to assess PAD impact on health status. Both should be more implemented in daily practice and clinical research to obtain objective measures of patients’ levels of functioning and to be able to adequately evaluate the impact and success of treatments offered to patients. For future steps, we would like to study how ordering exercise ABI testing would affect the management plan, and if a change in exercise ABI values at follow up would translate into a change of health status outcomes.
Supplemental Material
VMJ785026_Supplemental_Table_1 – Supplemental material for Associations of exercise ankle–brachial index, pain-free walking distance and maximum walking distance with the Peripheral Artery Questionnaire: Finding from the PORTRAIT PAD Registry
Supplemental material, VMJ785026_Supplemental_Table_1 for Associations of exercise ankle–brachial index, pain-free walking distance and maximum walking distance with the Peripheral Artery Questionnaire: Finding from the PORTRAIT PAD Registry by Tarek A Hammad, Kim G Smolderen, John A Spertus, Philip G Jones and Mehdi H Shishehbor in Vascular Medicine
Footnotes
Declaration of conflicting interests
The authors declared no potential conflicts of interest with respect to the research, authorship, and/or publication of this article.
Funding
The authors disclosed receipt of the following financial support for the research, authorship, and/or publication of this article: research reported in this manuscript was funded through a Patient-Centered Outcomes Research Institute (PCORI) Award (CE-1304-6677).
Supplementary material
The supplementary material is available online with the article.
References
Supplementary Material
Please find the following supplemental material available below.
For Open Access articles published under a Creative Commons License, all supplemental material carries the same license as the article it is associated with.
For non-Open Access articles published, all supplemental material carries a non-exclusive license, and permission requests for re-use of supplemental material or any part of supplemental material shall be sent directly to the copyright owner as specified in the copyright notice associated with the article.