
Abstract
Background:
Research proved the prognostic significance of the neutrophil-to-lymphocyte ratio (NLR), lymphocyte-to-monocyte ratio (LMR), platelet-to-lymphocyte ratio (PLR), and red blood cell distribution width (RDW) in some hematological malignancies. This study aimed to analyze the role of pretreatment NLR, LMR, PLR, RDW coefficient of variation (RDW-CV), and RDW standard deviation (RDW-SD) as prognostic markers for acute myeloid leukemia (AML).
Methods:
This retrospective cohort study included 204 patients newly diagnosed with AML in the Department of Hematooncology and Bone Marrow Transplantation of the Medical University of Lublin.
Results:
In the univariate models, higher RDW-CV and lower LMR predicted a poorer response to induction chemotherapy (odds ratio [OR] = 1.21, 95% confidence interval [CI95] = [1.09-2.36], P < .001; OR = 0.95, CI95 = [0.89-0.99], P = .045, respectively). In the multivariate model, age of diagnosis, ECOG (Performance Status Assessment by Eastern Cooperative Oncology Group) score, cytogenetic risk, NLR, and RDW-CV affected the odds of no response to chemotherapy significantly. The risk of progression was influenced by NLR and RDW-CV in the univariate analysis (hazard ratio [HR] = 1.20, CI95 = [1.09-1.33], P < .001; HR = 1.10, CI95 = [1.04-1.17], P = .002, respectively). In the multivariate settings, cytogenetic risk, leukocyte count, and RDW-CV affected progression free survival (PFS) significantly. Based on univariate models, the risk of death, when overall survival (OS) was taken into account, was influenced by NLR, LMR, and RDW-CV (HR = 1.05, CI95 = [1.00-1.09], P = .034; HR = 0.94, CI95 = [0.89-0.98], P = .010; HR = 1.06, CI95 = [1.01-1.10], P = .014, respectively).
Conclusions:
Higher NLR, higher RDW, lower LMR, and possibly lower PLR are poor prognostic factors that may help in the risk stratification of patients with AML.
Keywords
Introduction
Acute myeloid leukemia (AML) is a group of neoplastic disorders characterized by clonal expansion of myeloid blasts in peripheral blood, bone marrow, and other tissues. 1 Acute myeloid leukemia is the most common type of acute leukemia in adults. 2 Despite the presence of numerous recognized prognostic factors, survival and clinical outcomes are often variable even in patients with the same cytogenetic risk status. To stratify the risk more precisely and to use treatment of appropriate intensity, new prognostic strategies are being investigated.
Numerous studies have shown a correlation between inflammatory markers and the clinical course of various diseases including malignant neoplasms.3-5 The markers that have been widely evaluated recently are the proportions of different populations of white blood cells and platelets: neutrophil-to-lymphocyte ratio (NLR), lymphocyte-to-monocyte ratio (LMR), and platelet-to-lymphocyte ratio (PLR). The NLR is calculated by dividing the total neutrophil count by the total lymphocyte count, LMR by dividing the total lymphocyte count by the total monocyte count, and PLR by dividing the total platelet count by the total lymphocyte count.6,7
Red blood cell distribution width (RDW) is an indicator of anysocytosis, that is, variation in erythrocyte volume. The RDW can be reported as RDW coefficient of variation (RDW-CV) and the RDW standard deviation (RDW-SD). 8 The RDW-CV is calculated by dividing the SD of the mean cell size by the mean cell volume (MCV) of the red blood cells. Scores are converted into percentages. The RDW-SD is a measurement of the width of the red cell distribution curve measured in femtoliters (fL). 9 Normal values of RDW-CV and RDW-SD range from 11.6% to 14.6% and 39 to 46 fL, respectively. 8 The RDW has been classically used to classify anemia. However, in 2007, Felker et al 10 proved that RDW is a poor prognostic factor for heart failure, and new applications of this indicator have been discovered. It has been reported to be useful in the prognostic stratification of cardiovascular diseases,10-12 autoimmunological diseases, 13 pulmonary diseases, 11 and infectious diseases. 14 The RDW is also a prognostic factor in a variety of solid tumors, 15 including prostate cancer, 16 hepatocellular carcinoma, 17 esophageal cancer, 18 and lung cancer, 19 as well as in hematological malignancies, 20 including chronic lymphocytic leukemia, 21 multiple myeloma, 22 Hodgkin’s lymphoma, 23 diffuse large B cell lymphoma (DLBCL), 24 extranodal NK/T lymphoma, 25 and chronic myeloid leukemia (CML). 26
Despite reports of the prognostic significance of NLR, LMR, PLR, RDW-CV, and RDW-SD in various medical conditions, there are still limited data regarding the clinical value of these parameters in AML. Our study aimed to analyze the possible roles of NLR, LMR, PLR, and RDW as prognostic markers in patients with newly diagnosed AML. We also investigated whether a correlation exists between these markers and some recognized prognostic factors.
Materials and Methods
Patients’ characteristics
The characteristics of 204 patients with newly diagnosed AML are shown in Table 1. All patients included in the study who met the criteria for diagnosis of AML according to the revised fourth edition of the WHO (World Health Organization) Classification of Tumors of Hematopoietic and Lymphoid Tissues, 27 were diagnosed between 2006 and 2022 in the Department of Hematooncology and Bone Marrow Transplantation of Medical University of Lublin and had complete blood count test results available before treatment. Patients treated with steroids for any reasons, granulocyte colony-stimulating factor (G-CSF), or those who had received a blood transfusion within the previous 6 months before the onset of the disease, as well as patients younger than 18 years old, pregnant females, patients with known immunodeficiencies, eg, AIDS, patients with recognized active infections at the time of the diagnosis, and patients with terminal illnesses, were excluded from the study. The research was carried out in accordance with The Code of Ethics of the World Medical Association (Declaration of Helsinki) and was approved by the Committee on Bioethics of the Medical University of Lublin (KE-0254/60/2021).
Baseline characteristics of the group (N = 204).

Abbreviations: 2CdA, cladribine; Ara-C, citarabine; ATRA, all-trans retinoic acid; AZA, azacitidine; CR + CRi, complete remission complete remission with incomplete blood count recovery; DA, daunorubicin and cytarabine; DAC, daunorubicin, cytarabine, and cladribine; DAF, daunorubicin, cytarabine, fludarabine; ECOG, Performance Status Assessment by Eastern Cooperative Oncology Group; FAB classification, French-American-British AML classification; FLT3-ITD, FLT3 internal tandem duplication; HD Ara-C, high dose citarabine; Ida, idarubicin; LD Ara-C, low dose citarabine; M, mean; Me, median; Q1, Q3, first and third quartiles; SD, standard deviation; TKI, tyrosine kinase inhibitor
Data are presented as n (%) for categorical parameters and as mean ± standard deviation or median (interquartile range), depending on the distribution normality, for numerical parameters.
After initial diagnosis, most of the patients were treated with intensive chemotherapy. Around 84.3% of patients treated with intensive chemotherapy received DAC (daunorubicin, cytarabine, and cladribine) or DA (daunorubicin and cytarabine). More than half of the patients (54%) treated with non-intensive regimens received azacitidine in monotherapy (see Table 1).
Data collection and statistical analysis
Data were obtained retrospectively from patients’ medical records. Lymphocyte, monocyte, neutrophil, platelet counts, RDW-SD, and RDW-CV were measured at the time of diagnosis, before the treatment. The NLR, LMR, and PLR were calculated by dividing adequate cell counts. The baseline characteristics of the patients’ complete blood count (CBC) and CBC-derived parameters are presented in Table 2. Cytogenetics was classified according to 2022 European LeukemiaNet (ELN) genetic risk classification. 28 Response criteria were defined according to 2022 edition of the ELN recommendations for diagnosis and management of AML. 28 Overall survival (OS) was calculated from the date of diagnosis to death, regardless of its cause. Progression free survival (PFS) was calculated from the date of reported CR/CRi/PR to documented peripheral or bone marrow relapse with a blast percentage ⩾ 5%.
Baseline characteristics of patients’ complete blood count (CBC) and CBC-derived parameters (N = 204).

Abbreviations: HB, hemoglobin; LMR, lymphocyte-to-monocyte ratio; LYMPH, lymphocytes; M, mean; Me, median; MONO, monocytes; NEU, neutrophils; NLR, neutrophil-to-lymphocyte ratio; PLR, platelet-to-lymphocyte ratio; PLT, platelets; Q1, Q3, first and third quartiles; RDW-CV, red cell distribution width coefficient of variation; RDW-SD, red cell distribution width standard deviation; SD, standard deviation; WBC, white blood cell.
Statistical calculations were performed using R software version R4.1.2. Numerical variables were presented as means and standard deviations or medians and interquartile ranges, depending on the normality of the distribution. Categorical variables are presented as absolute and relative frequencies. Normality was checked using the Shapiro-Wilk test and verified using skewness and kurtosis. Variance homogeneity was verified using Levene’s test. Comparisons between groups were performed using the independent Student’s t-test, independent t-test, Mann-Whitney test, or Kruskal-Wallis test, as appropriate. Post hoc evaluation was performed using Dunn’s test with Bonferroni correction. Correlation analyses were performed using Spearman’s method. Survival analysis was performed using the Kaplan-Meier method. The log-rank test was used to determine whether survival was dependent on the levels of the analyzed parameters. All those statistical tests were considered significant at α < 0.05.
Logistic and Cox regression analyses were conducted in two steps: univariate and multivariate. Variables that were significant at α < 0.250 in the univariate analyses were considered for multivariate analyses. Stepwise regression was then performed, which resulted in a list of predictors included in the multivariate models. The logistic regression model fit was verified using the Nagelkerke R2 and Hosmer-Lemeshow tests. The Cox model fit was verified using the Wald test. To verify collinearity, variance inflation factor (VIF) indicators were calculated.
Results
Significant positive correlations were found between older age and RDW-CV and RDW-SD. In addition, there was a significant negative correlation between hemoglobin level and RDW-SD (P = .020), indicating that each additional g/dL was associated with a lower RDW-SD. However, the strength of these relationships is limited. Significant correlations were also found between the proportion of blasts in the bone marrow at the time of diagnosis and the LMR and PLR (P < .001 each). Both associations were negative with moderate effect (rho = –0.47 and rho = –0.37, respectively), meaning that each additional percentage point of blasts in the bone marrow was associated with lower LMR and PLR, with moderate strength of the effect. The correlations between the analyzed predictors and selected numeric variables are listed in Table 3.
Correlations between NLR, LMR, RDW-CV, RDW-SD, PLR, and selected numeric variables.

Abbreviations: LMR, lymphocyte-to-monocyte ratio; NLR, neutrophil-to-lymphocyte ratio; PLR, platelet-to-lymphocyte ratio; RDW-CV, red cell distribution width coefficient of variation; RDW-SD, red cell distribution width standard deviation.
Bold values represent statistically significant results.
In patients with ECOG (Performance Status Assessment by Eastern Cooperative Oncology Group) score ⩾ 2 (ie, with poorer performance status), the NLR was significantly higher and the LMR was significantly lower than in patients with an ECOG score < 2 (MD = 0.27, 95% confidence interval [CI95] = [0.01; 0.39], P = .043 and MD = –0.45, CI95 = [–0.19; –0.92], P = .001, respectively; see Figure 1). The frequency of FLT3 mutations differed significantly depending on the levels of LMR, RDW-CV, RDW-SD, and PLR (P = .009, P = .021, P = .032, and P = .042, respectively). Post hoc evaluation aimed at identifying pairs of subgroups with significant association revealed that LMR was significantly lower in patients with FLT3-ITD mutation than in patients without FLT3 mutation (median 0.41 vs 1.12), and RDW-CV was significantly higher in patients with FLT3-ITD mutation than in patients with FLT3 D-835 mutation (median 17.90% vs 14.40%; see Figure 2). Post hoc tests did not identify pairs of subgroups that significantly differentiated between RDW-SD and PLR. A significantly higher RDW-CV was observed in patients with CEBPA mutations than in patients without mutations (MD = 2.10, CI95 = [0.10; 4.20], P = .041; see Table 4).
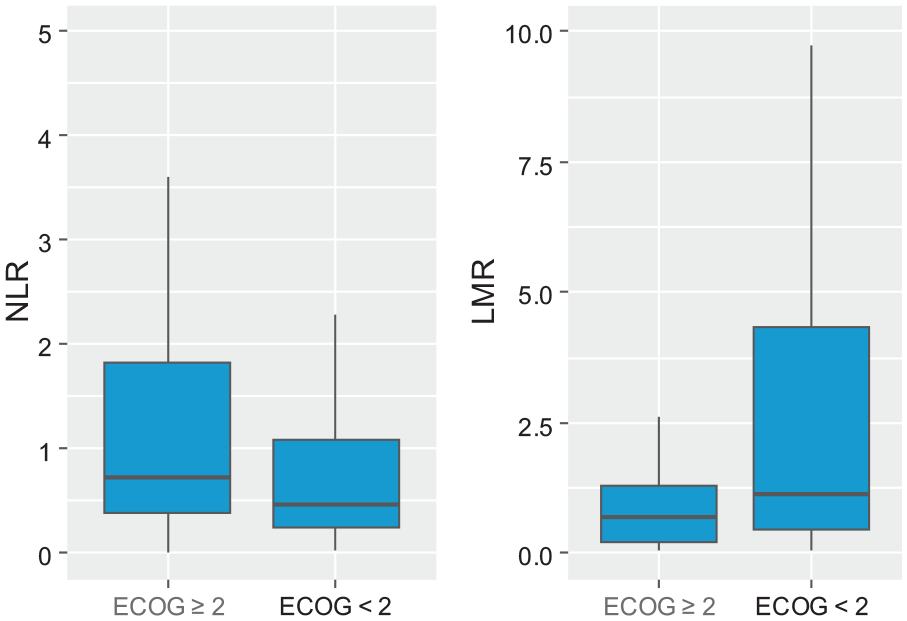
Box and whisker plots showing the differences in NLR and LMR in patients with the ECOG score ⩾ 2 and patients with the ECOG score < 2. ECOG indicates Performance Status Assessment by Eastern Cooperative Oncology Group; LMR, lymphocyte-to-monocyte ratio; NLR, neutrophil-to-lymphocyte ratio.

Box and whisker plots showing the differences in LMR, RDW-CV, RDW-SD, and PLR in patients: with ITD-FLT3 mutation, with D835-FLT3 mutation and with no FLT3 mutations. LMR indicates lymphocyte-to-monocyte ratio; PLR, platelet-to-lymphocyte ratio; RDW-CV, red cell distribution width coefficient of variation; RDW-SD, red cell distribution width standard deviation.
Associations between NLR, LMR, RDW-CV, RDW-SD, PLR, and selected variables.

Abbreviations: LMR, lymphocyte-to-monocyte ratio; Me, median; NLR, neutrophil-to-lymphocyte ratio; PLR, platelet-to-lymphocyte ratio; Q1, Q3, first, and third quartiles; RDW-CV, red cell distribution width coefficient of variation; RDW-SD, red cell distribution width standard deviation.
Comparisons were performed using the Mann-Whitney U test or the Kruskal-Wallis test.
One patient with both ITD and D-835 mutations was excluded from comparison.
Pairs with significant differences indicated by post hoc Dunn’s test with Bonferroni adjustment.
Bold values represent statistically significant results.
The NLR, LMR, RDW-CV, and RDW-SD differentiated the groups with no significant response or response to therapy. The pretreatment NLR, RDW-CV, and RDW-SD were higher on average in patients who did not respond to therapy than in those with any response (MD = 0.34, CI95 = [0.08; 0.49], P = .005; MD = 2.00, CI95 = [1.10; 2.60], P < .001; MD = 3.75, CI95 = [0.10; 6.70], P = .043, respectively). The LMR was lower in patients with no response than in those with partial remission, complete remission, and complete remission with incomplete blood count recovery (MD = –0.34, CI95 = [–0.91; –0.05], P = .015).
Based on the univariate logistic regression model, the odds of no response to induction chemotherapy increased by 21%, with RDW-CV higher by one percentage point (OR = 1.21, CI95 = [1.09-2.36], P < .001). The LMR higher by one resulted in a 5% lower odds of no response (OR = 0.95, CI95 = [0.89-0.99], P = .045). Apart from RDW-CV and LMR, age, age group, ECOG score, and cytogenetic risk influenced the odds of no response in univariate analyses. In the multivariate regression model, age at diagnosis (years), ECOG score, cytogenetic risk, NLR, and RDW-CV were significantly associated with odds of no response to induction chemotherapy. Each additional year of age was associated with a 1% higher risk of non-response to chemotherapy (OR = 1.01, CI95 = [1.00-1.01], P = .002). In patients with ECOG score < 2, the risk of no response was 21% lower than in patients with ECOG score ⩾ 2, OR = 0.79, CI95 = [0.67-0.92], P = .004. In the intermediate and favorable cytogenetic risk groups, the risk of no response was 20% and 31% lower than that in patients with unfavorable cytogenetic risk (OR = 0.80, CI95 = [0.68-0.93], P = .005 and OR = 0.69, CI95 = [0.56-0.85], P = .001, respectively). The RDW-CV higher by one would result in a 2% increased risk of no response, OR = 1.02, CI95 = [1.00-1.04], P = .035, and a higher NLR would result in a 5% increased risk of no response (OR = 1.05, CI95 = [1.02-1.09], P = .006). The multivariate model fit was verified with Nagelkerke R2, with an outcome of 42.4%, indicating a good fit (see Table 5).
Predictors of no response to induction chemotherapy.

Abbreviations: CI, confidence interval; HB, hemoglobin; LMR, lymphocyte-to-monocyte ratio; LYMPH, lymphocytes; MONO, monocytes; NLR, neutrophil-to-lymphocyte ratio; OR, odds ratio produced by logistic regression model; PLR, platelet-to-lymphocyte ratio; PLT, platelets; RDW-CV, red cell distribution width coefficient of variation; RDW-SD, red cell distribution width standard deviation; WBC, white blood cell.
Bold values represent statistically significant results.
In univariate analysis, the risk of progression was significantly influenced by age (years), age group, ECOG score, cytogenetic risk (favorable vs unfavorable), leukocyte count, monocyte count, NLR, and RDW-CV. Within 3 years after diagnosis, higher NLR resulted in a 20% increased risk of progression in the univariate analysis, when PFS was considered (HR = 1.20, CI95 = [1.09-1.33], P < .001). Within 3 years after diagnosis, RDW-CV higher by one would result in a 10% higher risk of progression in univariate analysis (HR = 1.10, CI95 = [1.04-1.17], P = .002). In the multivariate Cox model, cytogenetic risk group (favorable vs unfavorable), white blood cell count, and RDW-CV had a significant impact on PFS. The risk of progression was 87% lower in patients with favorable cytogenetic risk than in those with unfavorable cytogenetic risk (HR = 0.13, CI95 = [0.03-0.51], P = .003). The RDW-CV higher by one resulted in a 15% increased risk of progression (HR = 1.15, CI95 = [1.04-1.27], P = .009; see Table 6). Kaplan-Meier analysis showed a significant dependence of PFS on RDW-CV and RDW-SD. The PFS at three years after diagnosis was higher in patients with RDW-CV lower than the median (39.4%, CI95 = [29.2%; 53.1%] vs 17.9%, CI95 = [10.2%; 31.3%]). The PFS at 3 years after diagnosis was also higher in patients with RDW-CD lower than the median (29.5%, CI95 = [18.7%; 46.6%] vs 10.8%, CI95 = [4.3%; 27.3%]; see Figure 3).
Predictors of progression free survival (PFS).

Abbreviations: CI, confidence interval; HB, hemoglobin; HR, hazard ratio produced by the proportional hazard Cox model; LMR, lymphocyte-to-monocyte ratio; LYMPH, lymphocytes; MONO, monocytes; NLR, neutrophil-to-lymphocyte ratio; PLR, platelet-to-lymphocyte ratio; PLT, platelets; RDW-CV, red cell distribution width coefficient of variation; RDW-SD, red cell distribution width standard deviation; WBC, white blood cell.
Bold values represent statistically significant results.

Progression free survival (PFS) of patients with acute myeloid leukemia grouped according to pretreatment NLR, LMR, RDW-CV, RDW-SD, PLR. (A) PFS curve on 3 years data (dotted lines represent confidence interval for survival curve); PFS curve on 3 years data in split to: (B) NLR, Log rank test outcome: P = .306; (C) LMR, Log rank test outcome: P = .142; (D) RDW-CV, Log rank test outcome: P = .003; (E) PLR, Log rank test outcome: P = .161; and (F) RDW-SD, Log rank test outcome: P = .019. There is significant dependence of survival on RDW-CV and RDW-SD. LMR indicates lymphocyte-to-monocyte ratio; NLR, neutrophil-to-lymphocyte ratio; PLR, platelet-to-lymphocyte ratio; RDW-CV, red cell distribution width coefficient of variation; RDW-SD, red cell distribution width standard deviation.
After 1-year observation, NLR, LMR, and PLR significantly differentiated dead and alive patients. The NLR was higher, on average, in patients who died than in those who survived (MD = 0.22, CI95 = [0.00; 0.40], P = .049). The LMR and PLR were lower in deceased patients than in living patients (MD = –0.58, CI95 = [–1.22; –0.24], P < .001 and MD = –10.23, CI95 = [–12.40; –0.87], P = .018, respectively). Analogous correlations with NLR, LMR, and PLR were also identified after 3-year observation, MD = 0.29, CI95 = [0.01; 0.48], P = .035; MD = –0.71, CI95 = [–1.69; –0.25], P = .001; and MD = –16.92, CI95 = [–25.25; –3.03], P = .004, respectively). In addition, after 3-year observation, RDW-CV was, on average, higher in patients who died than in those who survived (MD = 1.50, CI95 = [0.80; 2.70], P = .001).
Based on the Cox proportional hazard univariate models, when OS was considered, the risk of death was significantly influenced by age (years), age group, ECOG score, cytogenetic risk, leukocyte count, monocyte count, NLR, LMR, and RDW-CV. The NLR higher by one would result in a 5% increased risk, HR = 1.05, CI95 = [1.00-1.09], P = .034, LMR higher by one: in 6% lower risk, HR = 0.94, CI95 = [0.89-0.98], P = .010 and RDW-CV higher by one: in 6% higher risk, HR = 1.06, CI95 = [1.01-1.10], P = .014 (see Table 7). Kaplan-Meier analysis showed a significant dependence of OS on NLR, LMR, RDW-CV, and PLR. The OS at 3 years after diagnosis was shorter in patients with NLR and RDW-CV higher than the median (42.6%, CI95 = [31.9%; 57.0%] vs 22.7%, CI95 = [14.6%; 35.5%]; 39.4%, CI95 = [29.2%; 53.1%] vs 17.9%, CI95 = [10.2%; 31.3%], respectively). The OS at 3 years after diagnosis was shorter in patients with LMR and PLR lower than the median: 43.3%, CI95 = [32.4%; 57.9%] vs 22.4%, CI95 = [14.3%; 35.0%] and 17.9%, CI95 = [10.2%; 31.3%] vs 39.4%, CI95 = [29.2%; 53.1%], respectively (see Figure 4).
Predictors of overall survival (OS).

Abbreviations: CI, confidence interval; HB, hemoglobin; HR, hazard ratio produced by the proportional hazard Cox model; LMR, lymphocyte-to-monocyte ratio; LYMPH, lymphocytes; MONO, monocytes; NLR, neutrophil-to-lymphocyte ratio; PLR, platelet-to-lymphocyte ratio; PLT, platelets; RDW-CV, red cell distribution width coefficient of variation; RDW-SD, red cell distribution width standard deviation; WBC, white blood cell.
Bold values represent statistically significant results.

Overall survival (OS) of patients with acute myeloid leukemia grouped according to pretreatment NLR, LMR, RDW-CV, RDW-SD, PLR. (A) OS curve on 3 years data (dotted lines represent confidence interval for survival curve). OS curve on 3 years data in split to: (B) NLR, Log rank test outcome: P = .020; (C) LMR, Log rank test outcome: P = .009; (D) RDW-CV, Log rank test outcome: P = .009; (E) PLR, Log rank test outcome: P = .006; and (F) RDW-SD, Log rank test outcome: P = .102. There is significant dependence of survival on NLR, LMR, RDW-CV, PLR. LMR indicates lymphocyte-to-monocyte ratio; NLR, neutrophil-to-lymphocyte ratio; PLR, platelet-to-lymphocyte ratio; RDW-CV, red cell distribution width coefficient of variation; RDW-SD, red cell distribution width standard deviation.
Multivariate Cox analysis for OS showed that in patients with ECOG score < 2, the risk of death was 59% lower than in patients with ECOG score ⩾ 2, HR = 0.41, CI95 = [0.19-0.88], P = .022. Cytogenetic risk was significantly associated with OS in the multivariate model. In the intermediate and favorable cytogenetic risk groups, the risk of death was 50% and 87% lower, respectively, than that in patients with unfavorable cytogenetic risk (HR = 0.50, CI95 = [0.25-0.97], P = .040; HR = 0.13, CI95 = [0.03-0.48], P = .002, respectively). None of the analyzed CBC-derived inflammatory factors had an impact on OS in the multivariate analysis (see Table 7).
Discussion
The prognostic roles of NLR and LMR have been proven in several oncological diseases, including hematological malignancies, 7 such as DLBCL,29,30 Hodgkin’s lymphoma, 31 and multiple myeloma.32-34 In our study, a higher NLR predicted a higher risk of nonresponse to induction chemotherapy and an increased risk of progression and death. It was also associated with shorter OS in the univariate analysis, but not in the multivariate analysis. Zhang et al 35 demonstrated that AML patients with > 50% myeloblasts in the bone marrow and a high NLR at the time of diagnosis presented shorter OS and disease-free survival. Zhang et al observed no statistical difference in NLR between patients who achieved CR and those who did not achieve CR. In contrast, in our study, NLR was higher on average in patients who did not respond to therapy than in those who responded. In a study by Zhang et al, there was no correlation between the initial NLR and cytogenetic risk stratification groups, similar to the results of our study. In the study by Van Oorschot et al, 36 conducted on a group of patients with AML, higher NLR was proved to be associated with poorer OS in univariate, but not multivariate analysis, just as in our research. Mushtaq et al 37 explored the association between the NLR and OS in 63 patients with relapsed/refractory acute myeloid leukemia (R/R AML). In R/R AML, higher NLR predicted poorer OS. In the study by Sun et al, 38 conducted on 63 patients with AML, except for APL, in a group of patients with LMR < 1.515; 65% of patients achieved CR after the first course of chemotherapy, compared with 88.4% achieving CR in a group of patients with an LMR ⩾ 1.515. Similarly, in our study, the LMR was lower in patients with no response than in those with PR or CR. We also proved that lower LMR predicts poorer OS in patients with AML. In our study, the LMR was significantly lower in patients with FLT3-ITD mutations than in those without FLT3 mutations. It has been previously proven that patients with FLT3-ITD mutations tend to have an increased risk of relapse and a shorter OS. 28 In this study, low PLR was an adverse prognostic factor for OS only in the Kaplan-Meier analysis. Our study is the first to investigate the role of PLR in a relatively homogeneous population of patients with AML. However, in the study by Woelfinger et al, 39 patients with a high pre-HSCT (hematopoietic stem cell transplantation) PLR showed significantly better OS, fewer relapses, lower non-relapse-mortality, and lower in-hospital mortality. About 49.5% of the patients included in the study were treated with AML. Therefore, our results concerning the role of PLR should be treated with caution. It is widely accepted that NLR, LMR, and PLR have prognostic significance in many medical conditions because they reflect the interaction between the tumor microenvironment and the patient’s immunological response.7,40,41
To the best of our knowledge, only one published study has evaluated the prognostic role of RDW-CV in newly diagnosed AML patients. In a study by Vucinic et al, 42 RDW-CV > 20.7% predicted higher non-relapse mortality, shorter OS, and a trend for shorter event-free survival. In our study, higher RDW-CV identified patients with poorer response to chemotherapy (in univariate and multivariate analyses), higher risk of progression (in univariate and multivariate analyses), and poorer OS in univariate, but not multivariate analysis. In a study by Vucinic et al, RDW was not associated with cytogenetic risk, the same as in our AML cohort. The mechanisms underlying the relationship between RDW and worst outcomes in malignant neoplasms remain to a great extent speculative. First, high RDW defines a proinflammatory state that can worsen the course of neoplastic diseases. Numerous studies have shown that inflammation plays a crucial role in tumor initiation, growth, and progression.43,44 The RDW level correlate with the levels of other inflammatory markers, such as IL-6, tumor necrosis factor-alpha, hepcidin, C-reactive protein (CRP), plasma viscosity, erythrocyte sedimentation rate (ESR), fibrinogen, leukocyte, and neutrophil counts.15,45,46 Also, RDW appears to reflect the general health condition of the patient, including age, nutritional status, and cardiovascular diseases.47,48 In this study, we confirmed a previously observed association between age and RDW-CV. Both RDW-CV and RDW-SD were higher in older patients, which is consistent with the data from healthy individuals. 48 However, we failed to find a significant correlation between RDW and ECOG Performance Status. Patel et al 45 proved that high RDW is a strong predictor of poorer OS and higher mortality for multiple causes in middle-aged and older adults. Our study is the first to evaluate the prognostic role of RDW-SD in AML; however, the prognostic value of RDW-SD is less evident than that of RDW-CV.
Several limitations of this study must be considered thoroughly. First of all, data were retrospectively collected from a single center. Moreover, we recruited patients between 2006 and 2022, and some treatment modalities have changed over time. The diagnostic criteria and risk categories have also evolved; however, we minimized these limitations by using the criteria of the revised fourth edition of the WHO Classification of Tumors of Hematopoietic and Lymphoid Tissues 27 in every individual enrolled in the study, independent of the year of diagnosis.
Conclusions
Our study suggests that NLR, LRM, RDW-CV, PLR, and RDW-SD could be simple, easily available, and cost-effective prognostic tests, which may be clinically useful to help risk-stratify patients with AML to better adjust the treatment intensity. We identified higher NLR, RDW-SD, and RDW-CV as well as lower LMR as poor prognostic factors. Lower PLR was associated with shorter OS and a higher risk of death in this study; however, those associations were observed only in some statistical tests and need to be confirmed. The results of our study should prompt further evaluation of the association between NLR, LRM, PLR, RDW-CV, RDW-SD, and outcomes in AML, preferably in larger prospective randomized studies. Further studies are needed to address the specific molecular mechanisms linking these markers with adverse prognosis in AML. Subsequent efforts should also focus on reviewing the correlations of analyzed factors with the next-generation sequencing studies, what may lead to developing a score followed by cytogenetics and molecular variants. Creating such scores, based on the promising results of this study, could add value to the general prognostication of AML in the future, especially in settings where cytogenetic and molecular studies are not easily available.
Footnotes
Acknowledgements
The authors extend their heartfelt appreciation to the Department of Hematooncology and Bone Marrow Transplantation and the Department of Cancer Genetics with Cytogenetics Laboratory Teams Members, including Doctors, Nurses, Allied Health Stuff, Medical Laboratory Stuff, Medical Secretaries, who made the data collection possible.
Author Contributions
All the authors contributed substantially to this work. PS designed the study, searched for patients included in the study, created the database, analyzed the data, and wrote the article. JM-K searched for the patients included in the study and created parts of the database. DK analyzed and reviewed the data. MH analyzed the data and reviewed the article. MP designed the research, analyzed the data and reviewed the article. All the authors have read and approved the final article.
Declaration of conflicting interests:
The author(s) declared no potential conflicts of interest with respect to the research, authorship, and/or publication of this article.
Funding:
The author(s) disclosed receipt of the following financial support for the research, authorship, and/or publication of this article: This study was funded by a research grant from the Medical University of Lublin.
Availability of Data and Materials
Publication-related data are available from the corresponding author on reasonable request.
Consent for Publication
Not applicable.
Ethics Statement
This study was conducted in accordance with The Code of Ethics of the World Medical Association (Declaration of Helsinki). This study was approved by the Committee on Bioethics of the Medical University of Lublin (ref: KE-0254/60/2021). The requirement for informed consent was waived by the Committee on Bioethics at the Medical University of Lublin (Al. Racławickie 1, 20-059 Lublin, room 08, Poland, +48 (0)814485115, komisja.bioetyczna@umlub.pl).