
Abstract
Objective
To compare the diagnostic value of the neutrophil-to-lymphocyte ratio (NLR), platelet-to-lymphocyte ratio (PLR), monocyte-to-lymphocyte ratio (MLR), C-reactive protein (CRP) level, and cancer antigen 125 (CA125) level for ovarian cancer (OC).
Methods
Data of 72 patients with OC, 50 patients with benign ovarian disease, and 46 healthy controls were retrospectively analyzed, and receiver operating characteristic analysis was performed.
Results
The platelet count was higher in patients with a tumor diameter of ≥10 vs. <10 cm. The absolute lymphocyte count was significantly higher in patients with stage I/II OC than in those with multiple and stage III/IV OC. The absolute monocyte count, NLR, MLR, and CA125 were significantly higher in patients with multiple and stage III/IV OC than in those with single and stage I/II OC. The NLR, PLR, MLR, fibrinogen, D-dimer, CRP, and CA125 were useful for distinguishing between the OC and healthy control groups.
Conclusions
Our analysis showed that the following combinations have practical diagnostic value in OC: NLR + PLR + MLR + CA125, NLR + PLR + MLR + CA125 + CRP, NLR + MLR +PLR + CA125 + CRP + fibrinogen, and NLR + MLR + PLR + CA125 + CRP + fibrinogen + D-dimer.
Keywords
Introduction
Ovarian cancer (OC) is associated with the highest mortality rate among all female reproductive malignancies worldwide. Approximately 314,000 new cases of OC and 207,000 OC-related deaths occur each year globally. 1 The incidence of OC is the third highest among all female reproductive system tumors in China, and the mortality rate is highest among all gynecological malignancies. 2 The initial manifestations of OC are not obvious, and patients are often diagnosed at an advanced stage because of their small ovarian size. The 5-year survival rate of OC is <47%, 3 making it one of the most challenging conditions for many gynecological oncologists to manage. Nevertheless, the 5-year survival rate of stage I OC can reach 90%. 4 Therefore, the survival rate will increase if OC can be detected early, allowing patients to receive standardized treatment. Finding effective biological indicators for the early identification of OC has become a research hotspot. 5
In recent years, research has emphasized the importance of cancer-related inflammation in tumor development and progression. 6 Several systemic inflammatory response indicators, including the neutrophil-to-lymphocyte ratio (NLR), monocyte-to-lymphocyte ratio (MLR), and platelet-to-lymphocyte ratio (PLR), have been confirmed to be new inflammatory markers for the diagnosis and prognosis of breast cancer, lung cancer, and other tumors.7–10
This study was performed to examine the variations in the NLR, MLR, and PLR in association with several clinicopathological characteristics in patients with OC, patients with benign ovarian disease (BOD), and healthy controls (HCs). We further explored the clinical value of the NLR, MLR, PLR, fibrinogen (FIB) level, D-dimer (D-D) level, C-reactive protein (CRP) level, and cancer antigen 125 (CA125) level to provide a reference for auxiliary diagnosis and treatment monitoring of OC.
Methods and methods
Participants
We retrospectively analyzed clinical data obtained from patients with OC who underwent surgical resection in the Department of Obstetrics and Gynecology, Zhejiang Cancer Hospital, Hangzhou Institute of Medicine, Chinese Academy of Sciences from October 2021 to March 2022. For comparison, we also analyzed the clinical data of patients with BOD and HCs.
The clinical stage of OC was determined according to the criteria established by the International Federation of Gynecology and Obstetrics. The diagnosis of OC was confirmed by ultrasound scanning, including color ultrasound blood flow with a mobility index of <1, along with examination by computed tomography or magnetic resonance angiography. The inclusion criteria for patients with OC were (1) pathological confirmation of OC; (2) no coexisting cancers or prior cancers within the previous 5 years; (3) no preoperative treatments, such as radiotherapy or neoadjuvant chemotherapy; (4) complete clinical, laboratory, imaging, and follow-up data; (5) no autoimmune disease or treatment with steroids; (6) no evidence of sepsis; and (7) no hematological disorders or treatment that could result in an elevated MLR or NLR (e.g., administration of hematopoietic agents such as granulocyte colony-stimulating factor) within 1 month before surgery. Routine blood tests and coagulation tests were performed the day before surgery.
The exclusion criteria for patients with OC were (1) immunologic disease or other serious physical illness (e.g., heart disease, diabetes, thyroid disease, or other endocrine disorders); (2) infection, fever, or use of anti-inflammatory drugs, antibiotics, immunological preparations, or other medications that may affect test results in the 4 weeks prior to enrollment; (3) pregnancy, lactation, or pre-menopausal status; and (4) treatment by surgical procedures, especially gynecological procedures, within the previous year.
The patients with OC (n = 72) ranged in age from 38 to 73 years (average age, 56.07 years). The patients with BOD (n = 50) ranged in age from 14 to 71 years (average age, 43.24 years). The HCs (n = 46) ranged in age from 39 to 68 years (average age, 51.89 years). The participants’ clinical characteristics are shown in Table 1. The MLR, NLR, and PLR were defined as the ratio of the absolute monocyte count (AMC) and absolute lymphocyte count (ALC), absolute neutrophil count (ANC) and ALC, and platelet (PLT) count and ALC, respectively, in peripheral blood.
Characteristics of study population.
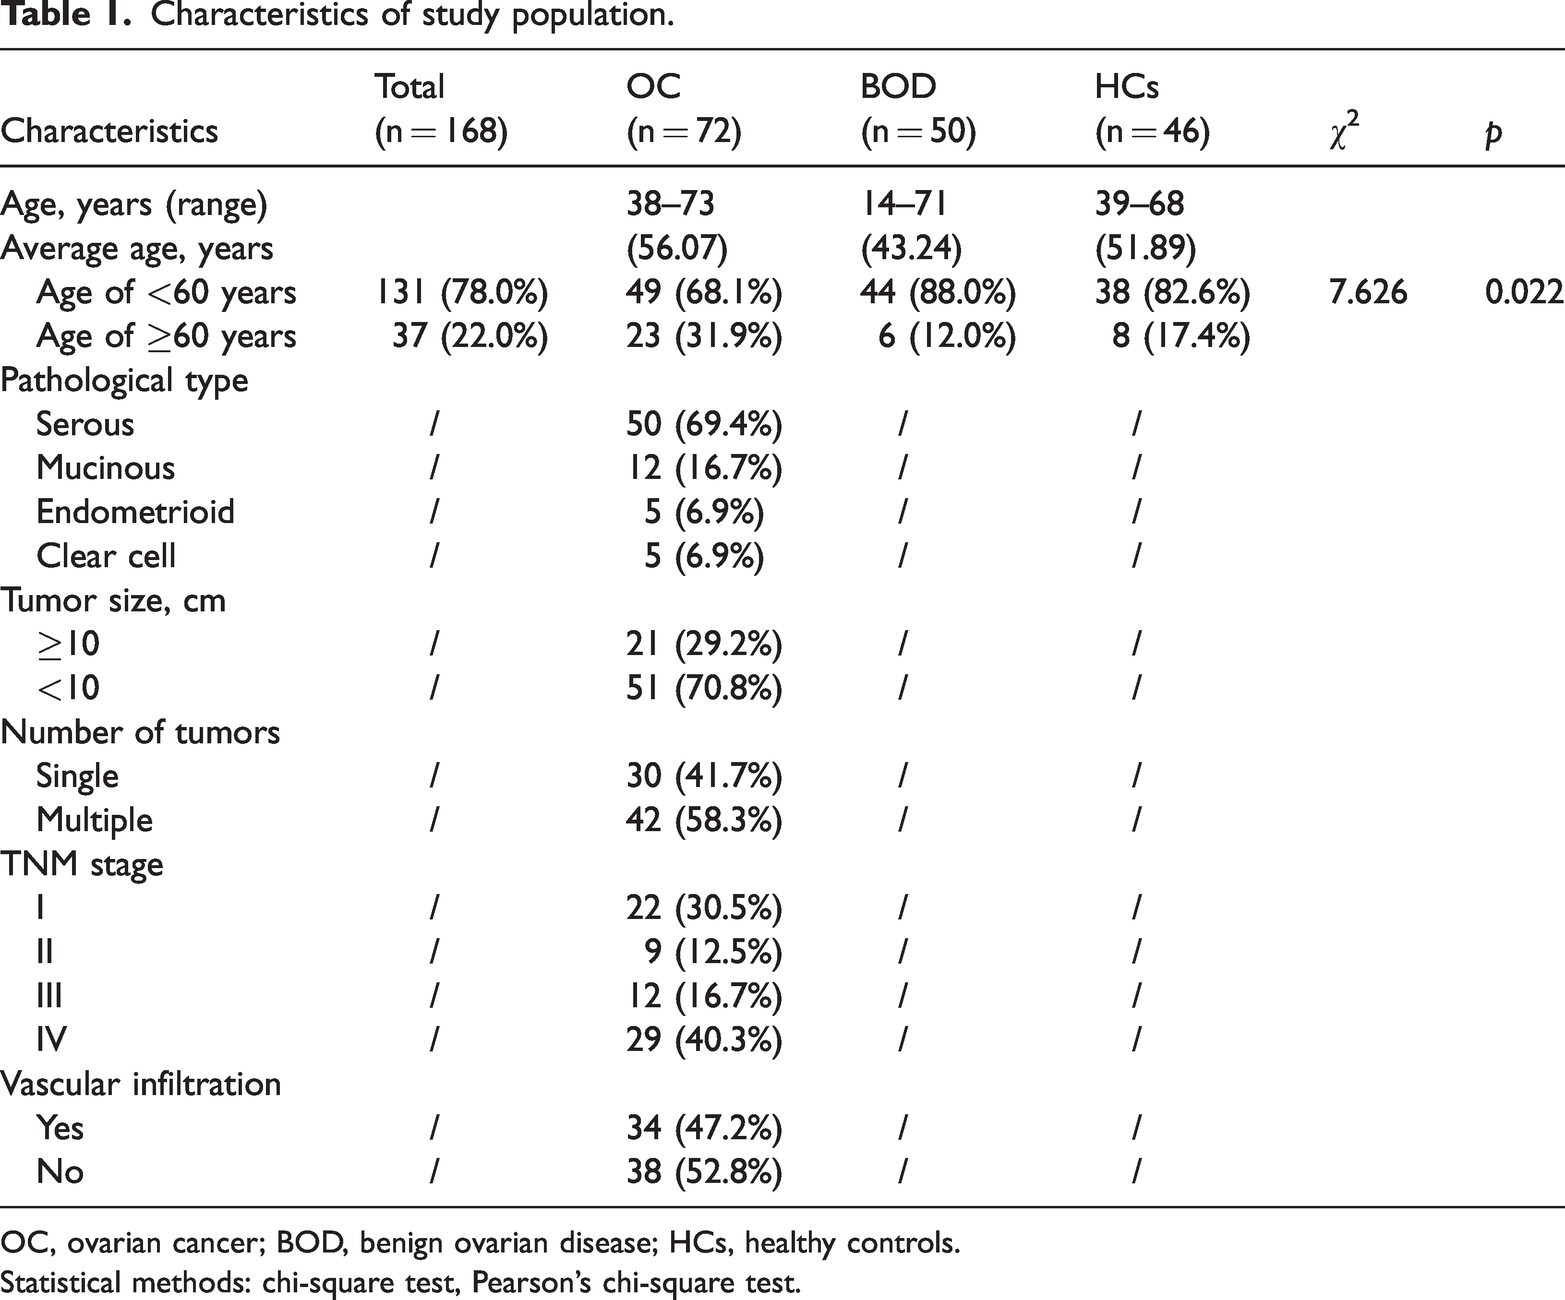
OC, ovarian cancer; BOD, benign ovarian disease; HCs, healthy controls.
Statistical methods: chi-square test, Pearson’s chi-square test.
Sample collection and measurement
Blood samples (2 mL) were collected in anticoagulant blood collection tubes containing ethylenediaminetetraacetic acid (Zhejiang Gongdong Medical Device Co., Ltd., Taizhou, China). Complete blood count parameters, including the white blood cell (WBC), ANC, ALC, AMC, and PLT count as well as the PLT distribution width (PDW) and red cell distribution width (RDW), were detected using a Mindray BC-7500 CRP auto hematology analyzer (Mindray, Shenzhen, China). The FIB and D-D levels were measured using a Sysmex CS-5100 coagulation analyzer (Sysmex, Kobe, Japan). The CRP level was measured up to 1 day before the operation using a Mindray BC-7500 CRP auto hematology analyzer. The NLR, MLR, and PLR were calculated. CRP was measured together with the routine blood parameters, and CA-125 was measured with a chemiluminescent immunoassay analyzer (Architect i2000; Abbott Laboratories, Chicago, IL, USA).
Statistical analysis
SPSS Version 23.0 (IBM Corp., Armonk, NY, USA) was used for data analysis. A receiver operating characteristics (ROC) curve was plotted using GraphPad Prism 6.0 (GraphPad Software, La Jolla, CA, USA). The chi-square test was used to compare proportions in different groups. The Kolmogorov–Smirnov test was used to analyze data with a non-normal distribution. Data are expressed as median (interquartile range). The Kruskal–Wallis H test was used to compare differences among three groups, and Dunn’s nonparametric multiple-comparison test was used for comparisons between two groups. The ROC curve was applied to analyze the diagnostic efficiency. A p value of <0.05 was considered statistically significant.
Ethics approval and consent
This study was approved by the Ethics Committee of Taizhou Municipal Hospital, Zhejiang, China (LWYJ2023171) and Zhejiang Cancer Hospital (1RB-2019-13), and written informed consent was obtained from each of the participants in accordance with the Declaration of Helsinki. Written informed consent was obtained from the patients in order to use their data for academic purposes.
Results
Comparison of NLR, MLR, PLR, FIB, D-D, CRP, CA125, and other laboratory-related parameters among the three groups
There were significant differences in the ANC, ALC, NLR, PLR, MLR, FIB, D-D, CRP, and CA125 among the patients with OC, patients with BOD, and HCs (p < 0.001). The NLR, PLR, MLR, CRP, FIB, and CA125 were significantly higher in the OC group than in the BOD and HC groups (p < 0.05). The WBC count, ANC, and ALC were considerably higher in the OC group than in the HC group (p < 0.05). The WBC count, ANC, ALC, NLR, and CA125 were significantly higher in the BOD group than in the HC group (p < 0.05) (Figure 1, Table 2).
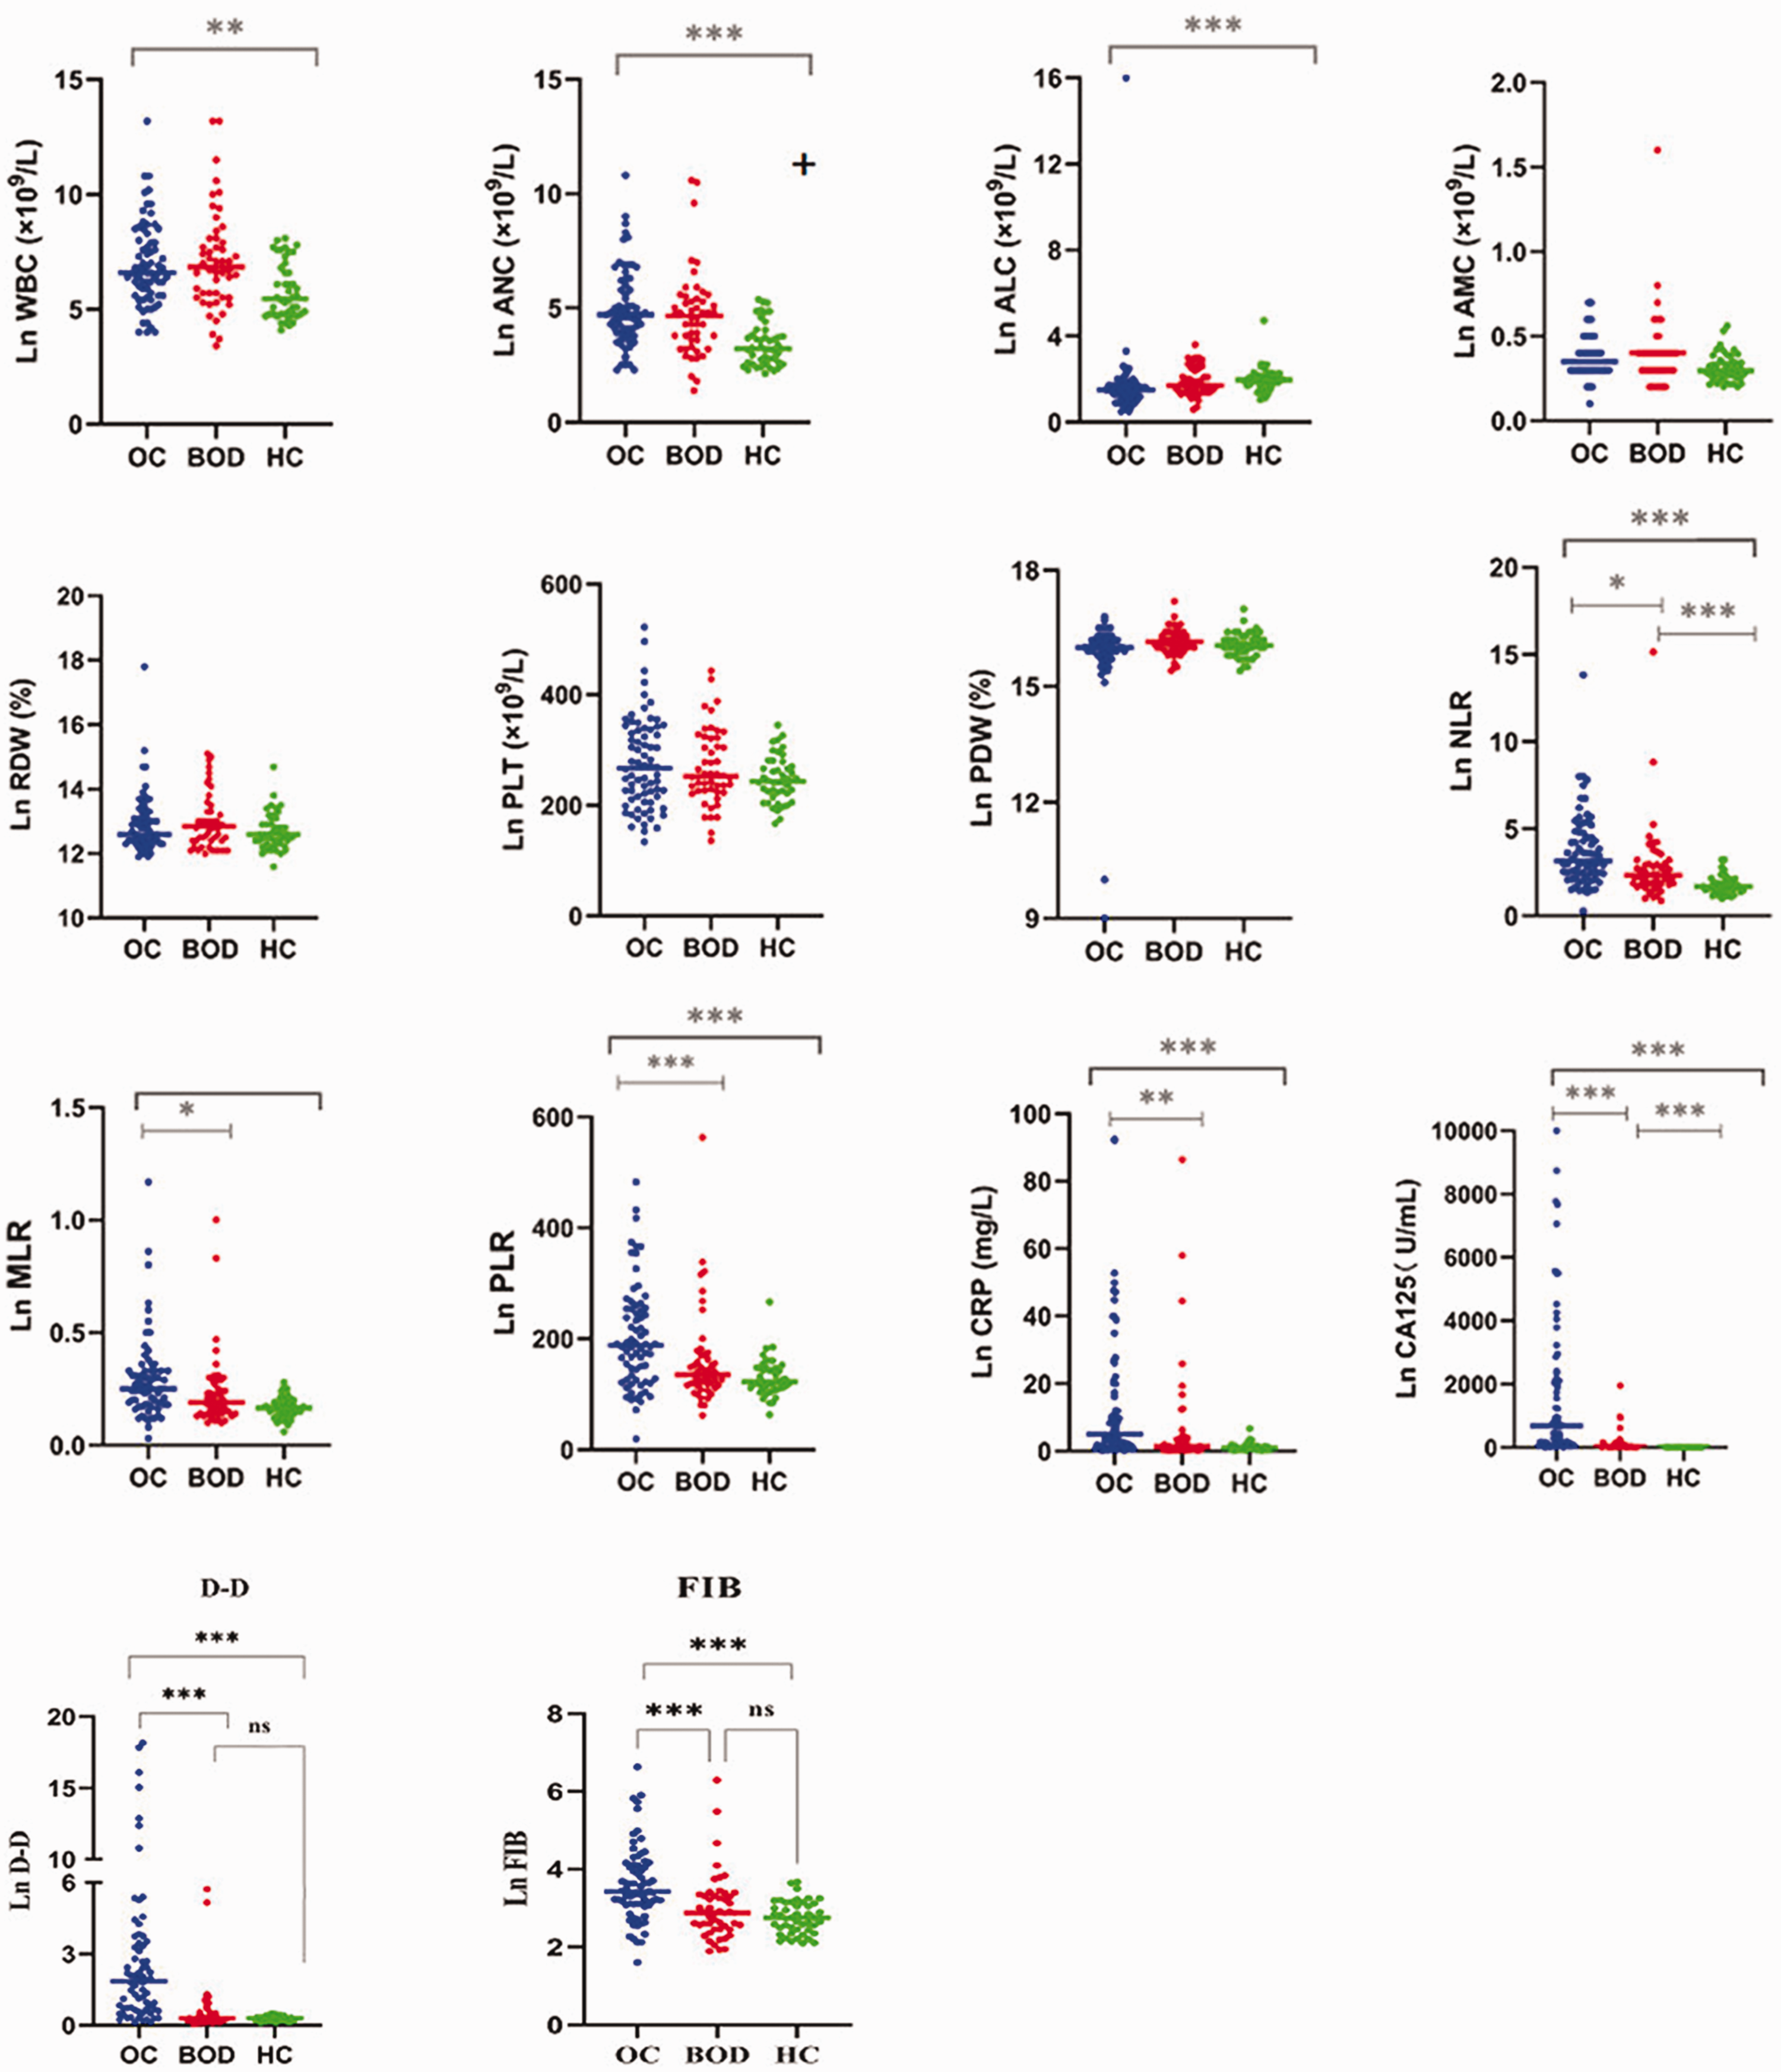
Scatter plots of WBC count, ANC, ALC, AMC, RDW, PLT count, PDW, NLR, PLR, MLR, FIB level, D-D level, CA125 level, and CRP level in patients with ovarian cancer, patients with benign ovarian disease, and healthy controls. WBC, white blood cell; ANC, absolute neutrophil count; ALC, absolute lymphocyte count; AMC, absolute monocyte count; RDW, red cell distribution width; PLT, platelet; PDW, platelet distribution width; NLR, neutrophil-to-lymphocyte ratio; PLR, platelet-to-lymphocyte ratio; MLR, monocyte-to-lymphocyte ratio; FIB, fibrinogen; D-D, D-dimer; CA125, cancer antigen 125; CRP, C-reactive protein.
Levels of different markers among the three groups.

Data are presented as median (interquartile range).
OC, ovarian cancer; BOD, benign ovarian disease; HCs, healthy controls; WBC, white blood cell; ANC, absolute neutrophil count; ALC, absolute lymphocyte count; AMC, absolute monocyte count; RDW, red cell distribution width; PLT, platelet; PDW, platelet distribution width; NLR, neutrophil-to-lymphocyte ratio; PLR, platelet-to-lymphocyte ratio; MLR, monocyte-to-lymphocyte ratio; FIB, fibrinogen; D-D, D-dimer; CRP, C-reactive protein; CA125, cancer antigen 125.
***Comparison with BOD group, **Comparison with HC group, p < 0.05.
Statistical methods: rank sum test for multiple independent-sample comparisons, Kruskal–Wallis H test; two-by-two comparison method: non-parametric Dunn’s multiple-comparison test.
-, no data.
Comparison of NLR, MLR, PLR, and other laboratory-related parameters in association with different clinical characteristics of patients with OC
The WBC count, ANC, ALC, AMC, RDW, PDW, NLR, PLR, MLR, FIB level, and CRP level were not significantly associated with age, pathological type, or tumor size in patients with OC. The PLT count was higher in patients with a tumor diameter of ≥10 than <10 cm (p = 0.037). Stage I/II OCs were associated with a higher ALC than multiple and stage III/IV OCs (p < 0.05). The AMC, NLR, MLR, and CA125 were higher in patients with multiple and stage III/IV OCs than in patients with single and stage I/II OCs (p < 0.05) (Table 3).
Pathological characteristics of patients with ovarian cancer.

Data are presented as median (interquartile range).
WBC, white blood cell; ANC, absolute neutrophil count; ALC, absolute lymphocyte count; AMC, absolute monocyte count; RDW, red cell distribution width; PLT, platelet; PDW, platelet distribution width; NLR, neutrophil-to-lymphocyte ratio; PLR, platelet-to-lymphocyte ratio; MLR, monocyte-to-lymphocyte ratio; FIB, fibrinogen; D-D, D-dimer; CRP, C-reactive protein; CA125, cancer antigen 125
Statistical methods: rank sum test for comparison of two samples, Mann–Whitney U test.
Logistic regression analysis of NLR, MLR, PLR, CRP, FIB, and D-D in diagnosing OC
The ROC curves of the NLR, MLR, and PLR were used to examine the corresponding areas under the curve (AUCs), and the differences were statistically significant (p < 0.01). The optimal cut-off value for the NLR was 2.435, with 71% sensitivity, 75% specificity, and an AUC of 0.765. The optimal cut-off value for the MLR was 0.235, with 79% sensitivity, 58% specificity, and an AUC of 0.716. The optimal cut-off value for the PLR was 164.41, with 82% sensitivity, 65% specificity, and an AUC of 0.719. The optimal cut-off value for the FIB level was 3.06, with 68% sensitivity, 78% specificity, and an AUC of 0.758. The optimal cut-off value for the D-D level was 0.565, with 90% sensitivity, 81% specificity, and an AUC of 0.881. The optimal cut-off value for the CRP level was 2.485, with 78% sensitivity, 67% specificity, and an AUC of 0.755. The optimal cut-off value for the CA125 level was 31.94, with 84% sensitivity, 96% specificity, and an AUC of 0.936. Combining the NLR, PLR, and MLR yielded a sensitivity of 69%, specificity of 78%, and AUC of 0.764. Combining the NLR, PLR, MLR, and CRP yielded a sensitivity of 78%, specificity of 73%, and AUC of 0.786. Combining the NLR, PLR, MLR, and CA125 yielded a sensitivity of 86%, specificity of 88%, and AUC of 0.922. Combining the NLR, PLR, MLR, CA125, and CRP yielded a sensitivity of 85%, specificity of 89%, and AUC of 0.924. Combining the NLR, PLR, MLR, FIB, CA125, and CRP yielded a sensitivity of 92%, specificity of 77%, and AUC of 0.905. Combining the NLR, PLR, MLR, FIB, D-D, CA125, and CRP yielded a sensitivity of 85%, specificity of 92%, and AUC of 0.925 (Figure 2, Figure 3, and Table 4).

Receiver operating characteristic plot and area under the curve for WBC count, ANC, ALC, AMC, RDW, PLT count, PDW, NLR, PLR, MLR, FIB level, D-D level, CA125 level, and CRP level in patients with ovarian cancer and healthy controls. WBC, white blood cell; ANC, absolute neutrophil count; ALC, absolute lymphocyte count; AMC, absolute monocyte count; RDW, red cell distribution width; PLT, platelet; PDW, platelet distribution width; NLR, neutrophil-to-lymphocyte ratio; PLR, platelet-to-lymphocyte ratio; MLR, monocyte-to-lymphocyte ratio; FIB, fibrinogen; D-D, D-dimer; CA125, cancer antigen 125; CRP, C-reactive protein.

Receiver operating characteristic plot and area under the curve for the NLR + MLR + PLR, NLR + MLR + PLR + CRP, NLR + MLR + PLR + CA125 + CRP, NLR + MLR + PLR + CA125 + CRP + FIB, and NLR + MLR + PLR + CA125 + CRP + FIB + D-D in patients with ovarian cancer and healthy controls. NLR, neutrophil-to-lymphocyte ratio; MLR, monocyte-to-lymphocyte ratio; PLR, platelet-to-lymphocyte ratio; CRP, C-reactive protein; CA125, cancer antigen 125; FIB, fibrinogen; D-D, D-dimer.
Diagnostic efficacy of different markers in ovarian cancer.

PPV, positive predictive value; NPV, negative predictive value; AUC, area under the curve; CI, confidence interval; WBC, white blood cell; ANC, absolute neutrophil count; ALC, absolute lymphocyte count; AMC, absolute monocyte count; RDW, red cell distribution width; PLT, platelet; PDW, platelet distribution width; NLR, neutrophil-to-lymphocyte ratio; PLR, platelet-to-lymphocyte ratio; MLR, monocyte-to-lymphocyte ratio; FIB, fibrinogen; D-D, D-dimer; CRP, C-reactive protein; CA125, cancer antigen 125.
Statistical methods: Receiver operating characteristic curve, dichotomous logistic regression analysis.
Comparison of NLR, MLR, PLR, FIB, and D-D with other laboratory-related parameters between OC and HC groups
The ANC, NLR, MLR, PLR, FIB, D-D, CRP, and CA125 displayed significant differences between the patients with OC and the HCs (p < 0.05 or p < 0.01). The WBC count, AMC, ALC, PDW, RDW, and PLT count showed no significant differences between the two groups (Figure 4).
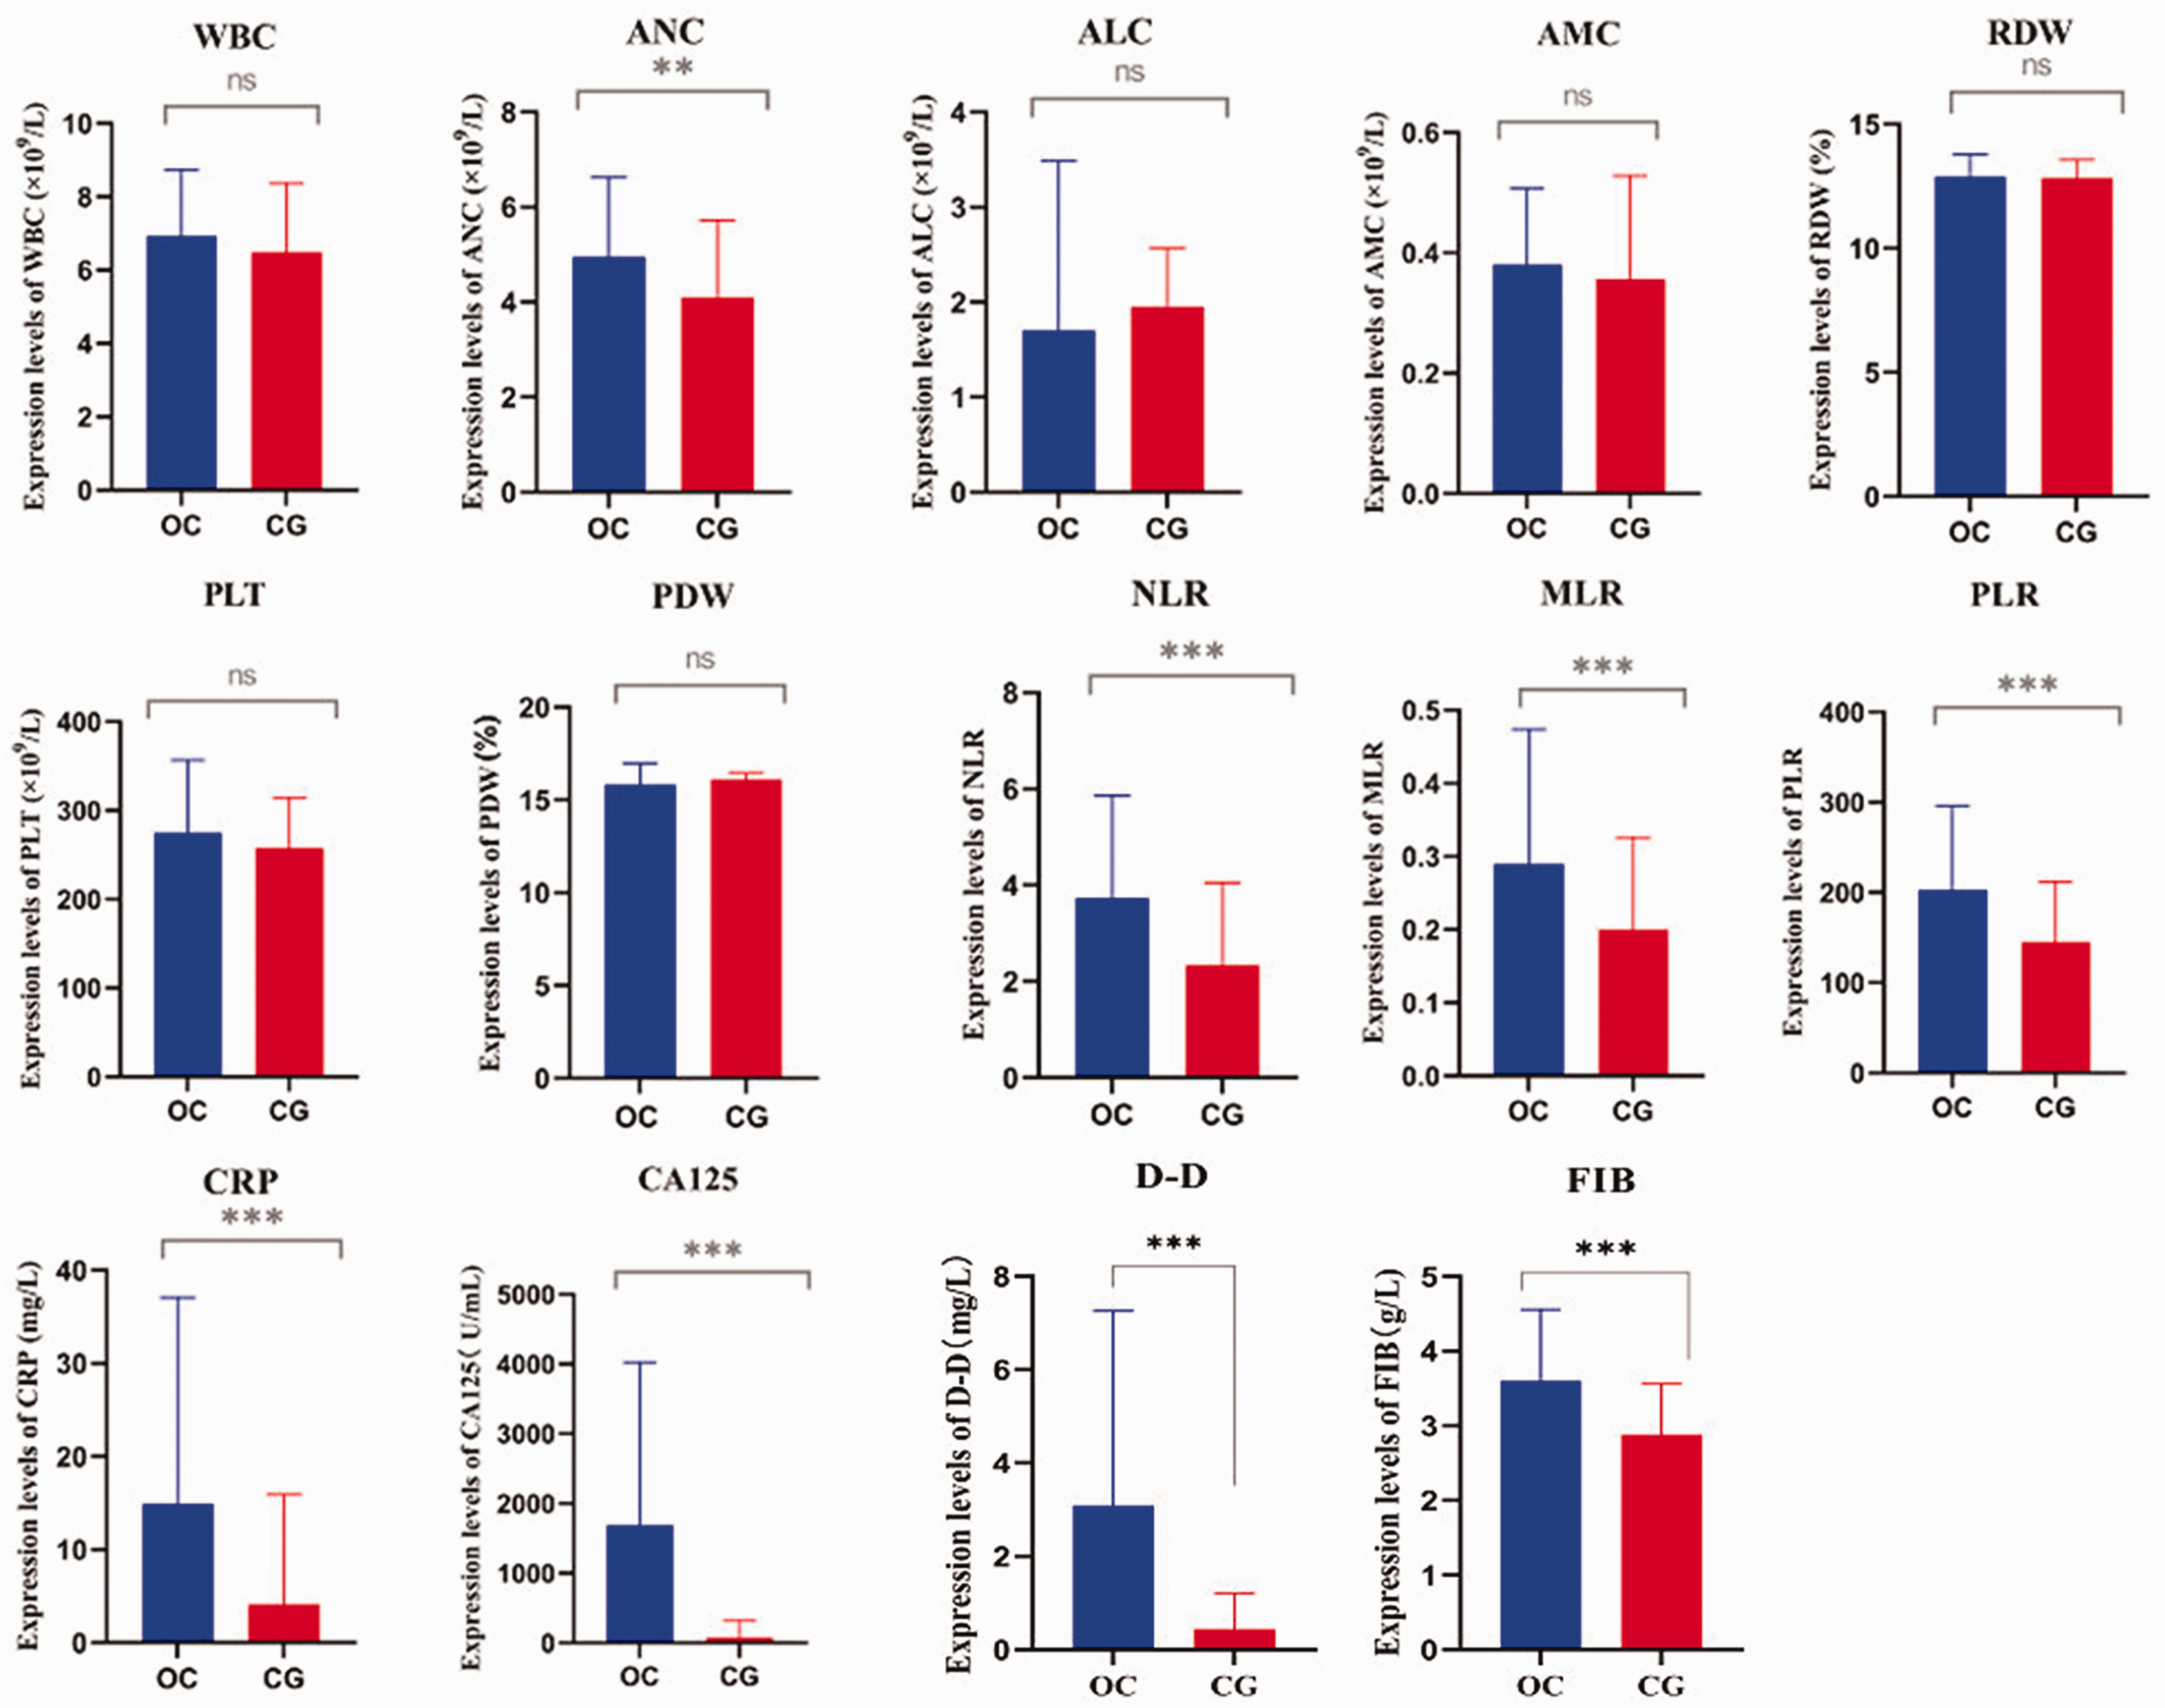
Comparison of expression levels of WBC count, ANC, ALC, AMC, RDW, PLT count, PDW, NLR, PLR, MLR, FIB level, D-D level, CA125 level, and CRP level between patients with ovarian cancer and healthy controls. *p > 0.05, **p < 0.05, ***p < 0.001. WBC, white blood cell; ANC, absolute neutrophil count; ALC, absolute lymphocyte count; AMC, absolute monocyte count; RDW, red cell distribution width; PLT, platelet; PDW, platelet distribution width; NLR, neutrophil-to-lymphocyte ratio; PLR, platelet-to-lymphocyte ratio; MLR, monocyte-to-lymphocyte ratio; FIB, fibrinogen; D-D, D-dimer; CA125, cancer antigen 125; CRP, C-reactive protein.
Correlation analysis of NLR, PLR, and MLR with CRP and CA125 in OC group
Pearson’s correlation analysis showed that the NLR was positively correlated with the PLR (r = 0.654, p < 0.01) and MLR (r = 0.768, p < 0.01) in the OC group. Correlations were also found between the PLR and MLR (r = 0.619, p < 0.01), NLR and CRP (r = 0.491, p < 0.01), NLR and CA125 (r = 0.546, p < 0.001), PLR and CRP (r = 0.337, p < 0.01), PLR and CA125 (r = 0.498, p < 0.001), MLR and CRP (r = 0.405, p < 0.01), and MLR and CA125 (r = 0.506, p < 0.001) (Figure 5, Table 5) as well as between FIB and PDW (r = −0.333, p < 0.001), FIB and PLT (r = 0.389, p < 0.001), and D-D and PLT (r = 0.263, p < 0.05) (Figure 5, Table 6).

Correlations between NLR, MLR, PLR, FIB level, D-D level, CRP level, and CA125 in patients with ovarian cancer using Spearman’s correlation test. NLR, neutrophil-to-lymphocyte ratio; MLR, monocyte-to-lymphocyte ratio; PLR, platelet-to-lymphocyte ratio; FIB, fibrinogen; D-D, D-dimer; CRP, C-reactive protein; CA125, cancer antigen 125.
Correlation of NLR, MLR, and PLR with CA125 in patients with ovarian cancer.

NLR, neutrophil-to-lymphocyte ratio; MLR, monocyte-to-lymphocyte ratio; PLR, platelet-to-lymphocyte ratio; CA125, cancer antigen 125.Statistical method: Pearson’s correlation analysis.
Correlation of FIB and D-D levels with PDW and PLT count in patients with ovarian cancer.
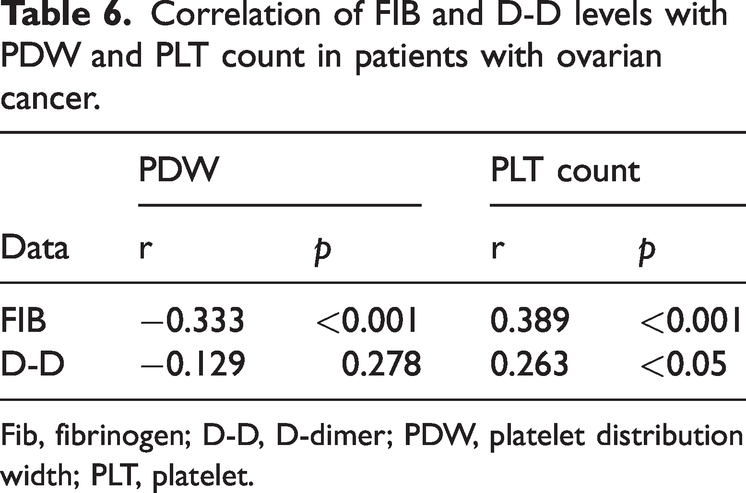
Fib, fibrinogen; D-D, D-dimer; PDW, platelet distribution width; PLT, platelet.
Discussion
The tumor microenvironment is an ideal setting for the development of both primary and secondary tumors. The occurrence and development of a primary ovarian tumor is closely related to the tumor microenvironment. The tumor microenvironment comprises tumor cells, inflammatory cells, and extracellular matrix. It is a local environment conducive to tumorigenesis and development, potentially leading to tumor cell proliferation, invasion, and metastasis. Inflammatory cells include macrophages, neutrophils, lymphocytes, and other cells. The inflammatory response, which involvs numerous inflammatory components, is a complicated reaction that strives to maintain homeostasis of the body’s internal environment. Studies have confirmed that inflammation is closely related to tumor occurrence and development. 11 The inflammatory microenvironment can promote tumor cell proliferation, angiogenesis, immune escape, invasion, and migration.12,13 Chronic inflammation has a strong impact on tumors, which may be due to the persistent effects of inflammatory factors. These factors lead to cell proliferation, inflammatory cell recruitment and activation, and the production of large amounts of reactive oxygen species and proteases, resulting in oxidative damage to DNA in normal cells and tumor occurrence. As a result, inflammatory factors can be used as markers for tumor evaluation.
The complete blood count is frequently utilized in clinical practice and is simple to perform. The ANC, ALC, AMC, and PLT count are closely related to the inflammatory response and immune status of the body. The body’s inflammatory condition can also be sensitively reflected by the integration of the NLR, PLR, MLR, and CRP level. A variety of factors in the body can cause changes in peripheral blood cells, such as physiological cycles, responses to external stimuli, and even the patient’s age. However, the NLR, MLR, and PLR are well protected from the effects of these changes. When inflammation occurs, the ANC markedly increases and various inflammatory mediators are released. The NLR is obtained by combining two neutrophil and lymphocyte markers. It is less affected by physiological, pathological, and physical factors and has better stability and more advantages over other leukocyte parameters. Similar to the NLR, the PLR is an inflammatory marker in some diseases. PLTs, as acute phase reactants, play an essential role in inflammatory responses occurring in the vessel wall and the subsequent tissue repair mechanisms; this is in addition to their hemostatic function following endothelial injury. 14 The MLR is another inflammatory marker because both monocytes and lymphocytes are significant cells in the inflammatory response. A lower ALC and higher AMC are associated with cancer development and progression. 15
Research worldwide has confirmed that the peripheral blood NLR, MLR, and PLR could be the most direct biomarkers of the body’s inflammatory response. These indicators are associated with the diagnosis and prognosis of numerous malignant tumors and are considered the most economical potential surrogate biomarkers for various malignancies. They are widely used in diagnosing malignant tumors of the endometrium, larynx, stomach, pancreas, bladder, and other organs.10,16–20
Numerous investigations have shown that the peripheral blood NLR, PLR, and MLR vary between HCs and patients with malignant ovarian tumors21,22 and that that these ratios are higher in patients with epithelial OC than in HCs. Consistent with the findings of Sastra et al., 23 the present study showed that the NLR, PLR, and MLR were significantly higher in the OC group than in the BOD and HC groups (p < 0.05) (Table 2), suggesting that these inflammatory indexes have specific clinical value in diagnosing OC. Moreover, the NLR and MLR were significantly higher in patients with multiple and stage III/IV OC than in those with single and stage I/II OC, indicating that the NLR and MLR are associated with the severity of OC (Table 3). Logistic regression analysis of the NLR, MLR, PLR, and other laboratory-related parameters revealed that the NLR in the OC group had a sensitivity of 71%, specificity of 75%, accuracy of 72.62%, and AUC of 0.765. The sensitivity, specificity, accuracy, and AUC of the MLR were 79%, 58%, 70.24%, and 0.716, respectively, and those of the PLR were 82%, 65%, 75%, and 0.719, respectively. The combined detection of the NLR, PLR, and MLR yielded a sensitivity of 69%, specificity of 78%, accuracy of 70.2%, and AUC of 0.764 (Table 4). These results indicate that the PLR, NLR, and MLR are reliable inflammatory diagnostic indicators for OC.
Plasma FIB is a precursor of fibrin. In the final stage of coagulation, soluble FIB is converted to insoluble fibrin, causing the blood to clot. Measurement of the plasma FIB level helps to understand the state of the patient’s coagulation function. In the present study, FIB exhibited a sensitivity of 68%, specificity of 78%, accuracy of 72.00%, and AUC of 0.758. Pearson correlation analysis showed that the FIB level was positively correlated with the PLT count in patients with OC (p < 0.001) (Table 6). Changes in the D-D level are a direct response to activation or inhibition of the coagulation and fibrinolytic systems and can be among the most important indicators of thrombus formation in vivo. The D-D level exhibited a sensitivity of 90%, specificity of 81%, accuracy of 82.00%, and AUC of 0.881 in the current investigation. Pearson correlation analysis suggested that the D-D level was positively correlated with the PLT count in patients with OC (p < 0.05) (Table 6).
CRP is a commonly measured inflammatory marker in clinical practice and a sensitive indicator of the systemic inflammatory response. 24 In the present study, the CRP level showed a sensitivity of 78%, specificity of 67%, accuracy of 73.21%, and AUC of 0.755. Pearson correlation analysis showed that the NLR, MLR, and PLR were positively correlated with the CRP level in patients with OC (p < 0.001) (Table 4). According to a report by Yang et al., 25 the diagnostic threshold for CRP in patients with OC was 9.8 mg/L, and high levels of CRP were related to the stage of OC and tumor size. CA125 serves as the most promising biological indicator for screening of OC; however, its accuracy remains unacceptable. 26 The serum CA125 level is elevated in 80% of patients with OC. However, in nearly half of patients with early OC, the CA125 level is not elevated, making it unsuitable as the sole marker for early diagnosis of OC. In 90% of patients, an elevated serum CA125 level is associated with disease progression; thus, it is primarily used for disease detection and assessing treatment efficacy. In the study by Yang et al., 25 the ROC results showed that CA125 had the highest diagnostic efficacy for OC; the sensitivity of CRP was higher than that of CA125, and the specificity of CRP was equal to that of CA125.
Thus, various combinations of the NLR, PLR, MLR, FIB, D-D, CRP, or CA125 had more practical application than any single parameter. The combinations of NLR + PLR + MLR + CRP, NLR + PLR +MLR + CA125, NLR + PLR + MLR + CA125 + CRP, NLR + MLR + PLR + CA125 +CRP + FIB, and NLR + MLR + PLR +CA125 + CRP + FIB + D-D had sensitivities of 78%, 86%, 85%, 92%, and 85%; specificities of 73%, 88%, 89%, 77%, and 92%; accuracies of 69.60%, 79.80%, 79.80%, 80.40%, and 85.10%; and AUCs of 0.786, 0.922, 0.924, 0.905, and 0.925, respectively. These findings indicate that the following combinations have good practical value and clinical significance: NLR + PLR + MLR + CA125, NLR + PLR + MLR + CA125 + CRP, NLR +MLR + PLR + CA125 + CRP + FIB, and NLR + MLR + PLR + CA125 + CRP + FIB + D-D.
Conclusion
In this study, the OC group had considerably greater NLR, PLR, and MLR values than the BOD and HC groups. The NLR, PLR, and MLR were positively correlated with the CRP and CA125 levels; the FIB level was positively correlated with the PLT count; and the D-D level was positively correlated with the PLT count in patients with OC, suggesting that these factors might reflect the inflammatory status of OC. The following combinations had the highest diagnostic efficacy: NLR + PLR + MLR + CA125, NLR + PLR + MLR +CA125 + CRP, NLR + MLR + PLR + CA125 +CRP + FIB, and NLR + MLR + PLR +CA125 + CRP + FIB + D-D. Measurement of these combinations of factors would improve the validity of the diagnosis and significantly reduce the rate of missed OC.
Footnotes
Authors’ contributions
All authors were involved in the design of this study. CL and GZ conducted the literature search and conceived the study. LY drafted the manuscript. LZ, GZ, and CL independently extracted and analyzed the data. LY, DW, SX, CL, and GZ were involved in protocol development, gaining ethical approval, and data analysis. All authors reviewed and edited the manuscript and approved the final version of the manuscript.
Competing interests
The authors declare that they have no conflicts of interest.
Data availability
The datasets used and/or analyzed during the current study are available from the corresponding author on reasonable request.
Funding
This study was supported by the Medical Health Science and Technology Project of Zhejiang Province (2019KY039).