
Abstract
Proviral Integration site for Moloney murine leukemia virus-1 (PIM-1) kinase, a serine/threonine kinase overexpressed in various malignancies, plays a critical role in promoting cell survival and proliferation, making it a promising target for anticancer therapy. This study employed an integrated in silico approach to evaluate Lepiotaprocerin derivatives (A to L) from Macrolepiota procera as potential PIM-1 inhibitors. Molecular docking of 12 Lepiotaprocerins revealed Lepiotaprocerin C as the most potent compound, exhibiting superior binding affinity (−11.4 kcal/mol) compared with the reference inhibitor AZD1208. Binding site validation using CASTp, PrankWeb, and blind docking confirmed the ATP-binding pocket as the active cavity. The Lepiotaprocerin C-PIM-1 complex demonstrated enhanced stability during 200 ns molecular dynamics simulations, maintaining low RMSD and strong hydrogen-bond interactions, supported by a favorable Molecular Mechanics/Poisson-Boltzmann Surface Area (MM/PBSA) binding free energy (−22.0 ± 2.1 kcal/mol). Based on quantitative structure activity relationship (QSAR) analysis, the calculated pIC50 value of Lepiotaprocerin C was 8.67. QSAR modeling (R2 = .74, Q2 = 0.90) confirmed robust predictive capacity, while absorption, distribution, metabolism, and elimination and PerMM analysis indicated favorable pharmacokinetic and permeability profiles. Prediction of Activity Spectra for Substances and toxicity predictions further revealed high antineoplastic potential (Pa = 0.881) and a nontoxic safety profile. These results highlight Lepiotaprocerin C as a promising, stable, and safe inhibitor of PIM-1 kinase, warranting further in vitro and in vivo validation for potential anticancer drug development.
Introduction
Cancer remains one of the leading causes of morbidity and mortality worldwide, accounting for nearly 10 million deaths annually according to the World Health Organization. 1 Among various molecular targets implicated in tumorigenesis, Proviral Integration site for Moloney murine leukemia virus-1 (PIM-1) kinase, a serine/threonine kinase, has garnered significant attention. Overexpression of PIM-1 is associated with poor prognosis in several malignancies, including leukemia, prostate, breast, and colorectal cancers. It promotes tumor cell survival, proliferation, and resistance to apoptosis through modulation of cell cycle regulators and anti-apoptotic proteins.2,3 In experimental models, suppression of PIM-1 reduced cell migration and proliferation, triggered apoptotic cell death, and worked in concert with other chemotherapeutic drugs. 4 Given its pivotal role in cancer progression, PIM-1 kinase has emerged as a compelling target for selective inhibition in anticancer drug discovery.
Several synthetic inhibitors of PIM-1, including AZD12085,6 and SGI-1776,7-9 have demonstrated preclinical efficacy. However, their clinical translation has been hindered by limited bioavailability, off-target toxicity, and pharmacokinetic constraints. These limitations have redirected focus toward the discovery of safer, natural small-molecule inhibitors with improved selectivity and tolerability profiles. Natural products derived from medicinal plants and fungi offer structurally diverse scaffolds with potent bioactivity and reduced systemic toxicity, making them ideal candidates for anticancer drug development.10,11
Macrolepiota procera, commonly known as the Parasol mushroom and a member of the Agariaceae family, offers diverse bioactive compounds, including triterpenoids (Lepiotaprocerins), phenolic acids, and alkaloids, which may target complex cellular pathways with potentially reduced systemic toxicity. 12 Its bioactive profile is less explored than that of other mushrooms. 13 Several isolates from M procera have demonstrated cytotoxic properties, with in vitro IC50 values (6.18 to 80.27 mg/mL) reported in different cancer cell lines, indicating potential anti-proliferative activity.14,15 In vitro studies also showed anti-inflammatory effects by Lepiotaprocerins constituents, supporting ongoing interest in its therapeutic potential. 16
The present study focuses on Lepiotaprocerin derivatives (A to L), major bioactive triterpenoid from M procera, as potential inhibitors of PIM-1 kinase. The research integrates computational approaches—molecular docking, binding site validation, molecular dynamics (MD) simulations, and Molecular Mechanics/Poisson-Boltzmann Surface Area (MM/PBSA) binding energy calculations—to elucidate its structural stability and binding mechanism. In addition, quantitative structure-activity relationship (QSAR) modeling; absorption, distribution, metabolism, and elimination (ADME) profiling; and toxicity prediction were performed to assess its pharmacokinetic feasibility and safety. The study aims to identify the most potent Lepiotaprocerin derivative targeting PIM-1 kinase, validate its dynamic and energetic stability through long-term MD simulations, and evaluate its drug-likeness and biological activity through predictive modeling.
Materials and Methods
Selection of phytochemical
A series of bioactive phytoconstituents, specifically Lepiotaprocerins (A to L) (Figure 1), were selected for this study based on their documented anticancer potential and natural origin from Lepiota species as reported in prior ethnopharmacological and phytochemical literature.14-18 The selection criteria included previously reported cytotoxicity, structural novelty, and drug-likeness properties. The chemical structures of these compounds, along with a reference drug (AZD1208), were retrieved in .sdf format from the PubChem database (https://pubchem.ncbi.nlm.nih.gov/). Various articles reported that AZD1208 showed significant PIM kinase inhibitory activity.19-21 Because of reported PIM kinase inhibitory activity, we used AZD1208 as reference drug in our study.

Selected Lepiotaprocerin derivatives and reference drug with their PubChem ID and 2D structures.
Compound and target protein preparation
All ligand structures underwent energy minimization using MMFF94 force field and Open Babel v2.4.1 for geometry optimization and conversion into pdbqt format. This step ensured that the ligands attained their lowest energy conformations prior to docking simulations. 22
For the protein target, PIM-1 kinase, a serine/threonine kinase implicated in oncogenesis and cell survival, was selected due to its well-established role in hematological malignancies and solid tumors. 7 The specific crystal structure (PDB ID: 4JX3) was chosen from the Protein Data Bank (https://www.rcsb.org/) based on its high resolution (2.50 Å). 23 The energy minimization of selected protein was conducted using Chimera v1.16 at default setting. The protein structure was pre-processed by removing all water molecules, ions, and heteroatoms, followed by the addition of polar hydrogens and assignment of Kollman charges using AutoDock Tools v1.5.7. The prepared structure was then saved in one folder for molecular docking simulations. 24
Protein dynamics and validation by normal mode analysis
To evaluate the structural flexibility and stability of the target protein, normal mode analysis (NMA) was performed using the iMODS online server (https://imods.iqf.csic.es/). 25 The analysis was conducted using default parameters, which included assessment of the deformability, eigenvalues, B-factor (mobility), and covariance matrix of the PIM-1 kinase structure. These parameters collectively provided insights into the intrinsic motions and dynamic behavior of the protein in a simulated environment. Prior to docking, the quality and stereochemical reliability of the selected protein structure (PDB ID: 4JX3) were validated using the PROCHECK online server. 26 The Ramachandran plot confirmed the structural integrity and proper folding of the protein by assessing the phi (φ) and psi (ψ) torsion angles of amino acid residues. Furthermore, the physicochemical characteristics of the PIM-1 kinase were analyzed using the Expasy ProtParam tool (https://web.expasy.org/protparam/). Parameters such as molecular weight, theoretical isoelectric point (pI), instability index, aliphatic index, and grand average of hydropathicity (GRAVY) were computed to assess the protein’s biochemical stability. 27
Binding pocket prediction
Identification of potential binding sites on the PIM-1 kinase structure was done using the Computed Atlas of Surface Topography of Proteins (CASTp 3.0) server (http://sts.bioe.uic.edu/castp/index.html?1bxw). 28 The analysis used the 3-dimensional crystal structure of the protein (PDB ID: 4JX3) to predict and visualize topographical features including solvent-accessible pockets, internal cavities, and surface depressions. The server generated a detailed list of potential binding cavities along with associated surface area, volume, and constituent amino acid residues. The largest and most accessible pocket, located in the ATP-binding region, was selected for subsequent molecular docking based on its structural compatibility with ligand binding.
Binding site validation
Potential binding sites on the PIM-1 kinase structure were identified using a dual-algorithm approach to ensure reliability. The Computed Atlas of Surface Topography of Proteins (CASTp 3.0) served as the primary prediction tool, using alpha complex and discrete flow algorithms to map surface topography and internal cavities. 28
For validation, “PrankWeb (https://prankweb.cz/) is a template-free machine learning method based on the prediction of local chemical neighborhood ligandability centered on points placed on a solvent-accessible protein surface.” 29 In addition, blind docking validation was conducted using AutoDock Vina v1.2.0 across the entire protein surface without predefined constraints. The grid box encompassed the complete protein structure with exhaustiveness set to 8 to ensure comprehensive sampling.
Binding site validation criteria included (1) high overlap between CASTp, blind docking, and PrankWeb predictions; (2) clustering of blind docking poses within predicted cavities; and (3) conservation of key interaction residues across methodologies. The primary binding cavity, located in the ATP-binding region and validated by all 3 approaches, was selected for targeted molecular docking studies.
Molecular docking methodology
Molecular docking simulations were conducted using AutoDock Vina integrated within the PyRx v0.8 software suite, which incorporates Open Babel for file conversion and ligand optimization. 30 The docking procedure aimed to predict the binding affinity and orientation of Lepiotaprocerin compounds (A-L) within the active site of the PIM-1 kinase protein (PDB ID: 4JX3). The optimized structures were also converted to pdbqt format using Open Babel. A site-specific docking approach was employed to explore potential binding modes across the entire binding cavity. The docking grid box was defined with the parameters given in Table 1. We analyzed the cavity dimension of blind docking by generating a grid box around the docked complex after docking and found near similar to other 2 grid dimension. This also confirm the selected binding site is accurate.
Docking grid box dimensions and parameters.
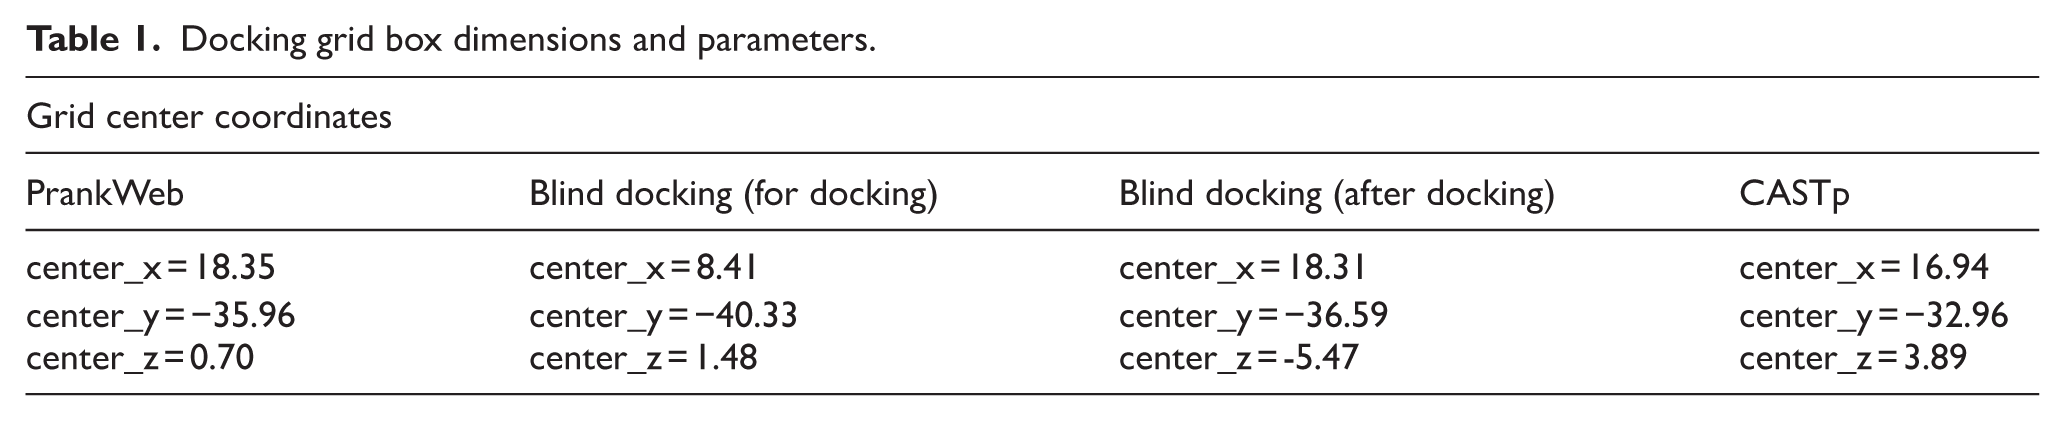
These coordinates ensured coverage of the major binding pockets predicted by CASTp, particularly around the ATP-binding domain. Docking simulations were performed for each Lepiotaprocerin compound, and the resulting binding affinities (in kcal/mol) and poses were analyzed by BIOVIA Discovery Studio Visualizer 2021 to identify the most promising inhibitor candidates.
MD simulation
Protein-ligand interactions involving the protein structure (PDB ID: 4JX3) were evaluated using molecular docking approach. Following docking, MD simulations were conducted using the AMBER software suite, applying the ff19SB force field to accurately represent protein behavior. The systems were solvated in a 12 Å orthorhombic periodic box using the TIP3P explicit water model to fully encompass the protein-ligand complexes. A 2-step energy minimization protocol was employed, beginning with positional restraints on heavy atoms, followed by an unrestrained minimization to optimize system stability. The minimized systems were gradually heated from 0 K to 300 K under the NVT ensemble, then subjected to equilibration. Equilibration was done over 200 ns, with system snapshots taken every 5 ns to monitor stability. Subsequently, a 200 ns production MD simulation was performed under the NPT ensemble to maintain realistic thermodynamic conditions. 31 Trajectory analysis was conducted using the CPPTRAJ module from AmberTools v24, 32 and protein-ligand complex visualizations were generated with VMD. 33
MM/PBSA binding free energy calculation
To evaluate the binding free energy of the Lepiotaprocerin C-PIM-1 kinase complex following MD simulation, the MM/PBSA method was applied using the MMPBSA.py module from the AMBER Tools suite v24. The topology files for the complex (protein-ligand), receptor (protein), and ligand were generated using LEaP, while the last 20 ns of the production trajectory (extracted every fifth frame) were selected for analysis. Water molecules and counterions were stripped using cpptraj to ensure accurate energy computation. The binding free energy (ΔG_bind) was calculated according to the standard MM/PBSA formula, incorporating molecular mechanics energies (electrostatic and van der Waals interactions), polar solvation energy (using the Poisson-Boltzmann model), and nonpolar solvation energy (estimated from solvent-accessible surface area). The MM/PBSA calculations were done under physiological ionic strength (0.15 M) using default dielectric constants. 34
Visualization and interpretation
The resulting energy components and total binding free energy were plotted using XMGrace for visual representation. The time-dependent energy fluctuations and stability trends were analyzed, helping confirm the thermodynamic stability of the complex and the contribution of each interaction to overall binding. Line plots of total ΔG_bind, van der Waals, and electrostatic components were generated to highlight dominant interactions. 35
QSAR model development and validation
The methodology of QSAR model development and validation was based on Rosell-Hidalgo et al, 36 Nguyen et al, 37 and Daoui et al. 38
Studied compounds
A total of 28 PIM-1 kinase inhibitors were retrieved from the ChEMBL database (https://www.ebi.ac.uk/chembl) along with their experimentally reported half-maximal inhibitory concentration (IC50) values. All IC50 values were converted into molar units (M) and subsequently transformed into their negative logarithmic scale, pIC50 = −log10(IC50[M]), to normalize the activity data. The initial energy minimization was conducted using MMFF94 force field. The molecular structures of all compounds were downloaded in .sdf format for descriptor calculation and QSAR modeling. The 2-dimensional (2D) structures of all PIM-1 kinase inhibitors are given in supplementary file (Figure 1S).
Calculation of molecular descriptors
Molecular descriptors were calculated using CheMaster v1.2 software. The program automatically generated descriptors from the molecular structures. From the initially computed set, 7 statistically significant descriptors were selected using the software’s built-in feature selection algorithm, which considers inter-descriptor correlation and relevance to biological activity. The selected descriptors were subsequently used for model construction.
Dataset splitting
To ensure balanced representation and diversity, the dataset was divided into training and test sets using the k-clustering method implemented in CheMaster v1.2. The dataset was partitioned in a 75:25 ratio, with 75% of compounds forming the training set for model development and 25% reserved as the external test set for validation. This method ensures that both sets uniformly represent the chemical space of the studied compounds.
Model development
A multiple linear regression (MLR) model was developed using the training set, where pIC50 served as the dependent variable and the 7 selected molecular descriptors as independent variables. The regression equation was obtained using the ordinary least squares method. Descriptor multicollinearity was examined using the variance inflation factor (VIF), and descriptors with VIF > 5 were excluded to ensure statistical stability. Model adequacy was verified by analyzing residual plots and verifying assumptions of linearity, independence, and normal distribution of residuals.
Internal validation
The internal predictivity and robustness of the QSAR model were evaluated using statistical parameters: the correlation coefficient (R), coefficient of determination (R2), and the cross-validated coefficient (Q2) obtained through leave-one-out cross-validation. A model was considered statistically acceptable when R2 > .6 and Q2 > 0.5, in accordance with established QSAR guidelines.
External validation
The external predictive ability of the model was evaluated using the independent test set. Parameters including R, R2_pred, Q2_pred, and the slopes k and k′ (from regressions through the origin between observed and predicted pIC50 values) were computed. A reliable model was considered to meet the Golbraikh-Tropsha criteria:
R2 > 0.6
Q2_pred > 0.5
0.85 ⩽ k ⩽ 1.15 and 0.85 ⩽ k′ ⩽ 1.15
|R02—R0′2| < 0.3
Y-randomization
To confirm that the model was not a result of chance correlation, Y-randomization (response permutation) tests were conducted. The dependent variable (IC50) was randomly shuffled while maintaining the descriptor matrix constant, and new MLR models were built for each permutation (n = 30). The significantly lower R2 and Q2 values of the randomized models compared with the original model confirmed the robustness and nonrandom nature of the developed QSAR model.
Applicability domain
The applicability domain (AD) of the QSAR model was evaluated using a Williams plot, which relates the standardized residuals to the leverage (hi) values of each compound to identify structural and response outliers. The leverage threshold (h*) was calculated as equation (1).

where p represents the number of descriptors (7) and n the total number of compounds (28). Compounds with leverage values greater than h* are considered structurally influential, whereas those with standardized residuals exceeding ±3 are regarded as response outliers. The graph was generated using MatLab R2024b.
Cell membrane permeability and translocation pathways analysis
The PerMM (Permeability of Molecules across Membranes) web server was used to evaluate the membrane permeability characteristics of Lepiotaprocerin C. Parameters, including permeability coefficient (logP), energy barriers for translocation, and passive diffusion pathways across a biomimetic lipid bilayer model (BLM) were calculated. Experimental conditions were maintained at default settings, with a physiological temperature of 310 K and pH 7.4. Drug optimization mode and BLM-based permeability were selected to ensure a realistic simulation environment for translocation dynamics. 39
Physicochemical, pharmacokinetic properties evaluations
To assess the drug-likeness and pharmacokinetic potential of Lepiotaprocerin C, a comprehensive in silico ADME evaluation was done. The compound’s SMILES notation was input into the SwissADME server to compute key physicochemical parameters (such as molecular weight, lipophilicity, and number of hydrogen bond donors/acceptors), drug-likeness, and bioavailability scores. 40
Prediction of Activity Spectra for Substances analysis
To predict the potential biological activities of Lepiotaprocerin compounds, the Prediction of Activity Spectra for Substances (PASS) server was employed. The input SMILES of each phytoconstituent was analyzed to generate probability scores for activity (Pa) and inactivity (Pi) across a broad range of pharmacological classes. Compounds with Pa > 0.7 were considered to have high confidence in exhibiting the predicted biological effects. 41
Toxicity study
Toxicity predictions were conducted using 2 independent platforms. ProTox-II and the ADMETlab 2.0 server. These tools provided estimated values of toxicity classes, hepatotoxicity, carcinogenicity, and other relevant safety profiles.42,43
Results and Discussion
Protein dynamics and validation
Figure 2 presents a comprehensive analysis of the structural dynamics and validation of the PIM-1 kinase protein (PDB ID: 4JX3). The deformability plot (Figure 2A) revealed multiple peaks across the atom indices, indicating flexible regions within the protein structure, which are essential for ligand accommodation and active-site mobility. In the mobility comparison (Figure 2B), the NMA data were overlaid with the PDB data, and both profiles exhibited similar fluctuation patterns, suggesting that the modeled dynamics were consistent with the experimental structure. The covariance map (Figure 2C) demonstrated correlated (red), anti-correlated (blue), and uncorrelated (white) motions among the residues, with prominent red diagonal regions indicating strong intra-domain interactions that contribute to structural stability. The eigenvalue obtained from the NMA (2.53 × 10⁻⁴) in Figure 2D reflected the energy required for conformational deformation; a relatively low value signified greater flexibility and favorable binding adaptability. Finally, the Ramachandran plot (Figure 2E) validated the stereochemical quality of the protein model, with most residues clustered in the most favored regions (deep red), and very few outliers observed, confirming that the backbone dihedral angles (φ and ψ) were within permissible limits. Collectively, these findings confirmed that the protein structure was dynamically stable, conformationally flexible, and stereochemically valid for subsequent molecular docking and simulation studies.

Illustration of (A) deformability, (B) atom index, (C) residue index, (D) eigenvalue, and (E) Ramachandran plot of 4JX3 protein.
Physiochemical properties of PIM-1 protein
The physicochemical properties of the PIM-1 kinase (PDB ID: 4JX3) were evaluated using the ExPASy ProtParam tool, and the results are summarized in Table 2. The protein was composed of 313 amino acid residues, with a calculated molecular weight of 35 685.78 Da and a theoretical isoelectric point (pI) of 5.72, suggesting that the protein is slightly acidic in nature. The sequence contained 44 negatively charged residues (aspartic acid and glutamic acid) and 34 positively charged residues (arginine and lysine), resulting in a net negative charge under physiological conditions. The aliphatic index was calculated to be 95.88, indicating a high proportion of aliphatic side chains and suggesting that the protein may be thermostable. Furthermore, the GRAVY was −0.247, implying that the protein is overall hydrophilic and likely to be soluble in aqueous environments. These physicochemical parameters supported the protein’s structural stability and its suitability for molecular docking and simulation studies.
Physicochemical parameters of PIM-1 protein.

Binding pocket analysis
The binding pocket analysis of the PIM-1 kinase protein (PDB ID: 4JX3) was conducted using the CASTp server, which identified a prominent cavity with high potential for ligand binding. A total of 28 amino acid residues were mapped within this primary binding pocket, including Leu44, Gly45, Ser46, Gly47, Gly48, Phe49, Val52, Ala65, Lys67, Val69, Arg73, Ile74, Ser75, Asp76, Pro87, Met88, Glu89, Val90, Leu92, Leu93, Ile104, Leu118, Leu120, Glu121, Arg122, Pro123, Val126, Gln127, Asp128, and Asp131. These residues are predominantly located near the ATP-binding domain, which is functionally critical for kinase activity. In addition, a set of secondary residues—Glu171, Asn172, Leu174, Ile185, Asp186, and Phe187—were identified as part of the extended binding cavity, as visualized in Figure 3.

Binding site amino acids are covered with grid box for accurate docking. Grid box of binding site predicted from CASTp server (A), blind docking (B), and Prank web server presenting in brown color (C).
Furthermore, 3 methods show strong agreement on a common binding site, validating the CastP pocket. Nine residues are identified by PrankWeb, CASTp and blind docking (after docking): Leu44, Gly45, Ser46, Lys67, Leu120, Glu121, Arg122, Pro123, Val126—these form the primary consensus interaction motif. Several additional residues are shared by 2 methods (supporting the cavity): Gly47, Gly48, Val69, Arg73, Ile74, Ser75, Asp76, Gln127, Phe49, Val52, Ala65, Ile104, Asp128, Leu93, Glu171, Leu174. Differences reflect each method’s sensitivity: PrankWeb highlights surface-exposed and polar/charged contributors (eg, Glu89, Ile185, Asp186), CASTp maps the full geometric cavity (adds Pro87, Met88, Leu118, Val90, Leu92, Asp131), and blind docking pinpoints ligand-contact residues (eg, Val69, Arg73, Ile74, Ser75, Gln127, Glu171, Leu174). Blind docking residues were cross-validated against the post-docking cavity evaluation, confirming strong agreement and validating the identified binding pocket.
CASTp
Binding site amino acids: Leu12, Phe17, Val20, Lys35, Leu44, Gly45, Ser46, Gly47, Gly48, Phe49, Val52, Ala65, Lys67, Val69, Arg73, Ile74, Ser75, Asp76, Pro87, Met88, Glu89, Val90, Leu92, Leu93, Ile104, Leu118, Leu120, Glu121, Arg122, Pro123, Val126, Gln127, Asp128, and Asp131.
PrankWeb
Binding site amino acids (brown color): Ile104, Leu120, Glu121, Arg122, Pro123, Val126, Asp128, Glu171, Leu174, Ile185, Asp186, Leu44, Gly45, Ser46, Phe49, Val52, Ala65, Lys67, Glu89, Leu93.
Blind docking
Binding site amino acids after docking: Leu44, Gly45, Ser46, Gly47, Gly48, Lys67, Val69, Arg73, Ile74, Ser75, Asp76, Leu120, Glu121, Arg122, Pro123, Val126, Gln127, Glu171, Leu174.
Molecular docking analysis
The docking study of Lepiotaprocerin derivatives against PIM-1 kinase revealed distinct variations in binding affinities across different docking approaches (CASTp, PrankWeb, and blind docking), allowing a comprehensive assessment of ligand-protein interactions. Overall, most Lepiotaprocerin derivatives demonstrated comparable or superior binding affinities to the reference inhibitor AZD1208, which showed docking scores of −9.7, −9.6, and −9.6 kcal/mol across the 3 validation methods (Table 3).
Comparative docking scores of Lepiotaprocerin derivatives and reference inhibitor AZD1208 against PIM-1 kinase obtained from CASTp, PrankWeb, and blind docking analysis.

Among all derivatives, Lepiotaprocerin C exhibited the highest binding affinity across all docking protocols (−11.4 kcal/mol in CASTp and PrankWeb; −10.7 kcal/mol in blind docking), suggesting stronger and more stable interactions with the PIM-1 kinase active site. Its high negative binding energy indicates efficient accommodation within the binding pocket, likely due to optimal hydrophobic contacts and hydrogen-bonding interactions with key residues. Other derivatives, including Lepiotaprocerin D (−10.6 to −11.0 kcal/mol), Lepiotaprocerin F (−10.5 kcal/mol), and Lepiotaprocerin G (−10.5 kcal/mol), also displayed high docking scores, closely approaching the potency of Lepiotaprocerin C. These values suggest that several derivatives exhibit favorable conformational adaptability and strong hydrophobic or π-π stacking interactions within the catalytic pocket. In contrast, compounds such as Lepiotaprocerin H, I, J, and K demonstrated slightly lower docking scores (−9.1 to −9.9 kcal/mol), although still within an active range, indicating stable but comparatively weaker binding energies.
Structural insights into ligand-PIM-1 interactions
The docking visualization from the CASTp cavity binding site reveals that Lepiotaprocerin C (Figure 4A) fits deeply within the PIM-1 kinase pocket, forming a stable hydrogen bond with Glu121 (3.1 Å), while hydrophobic residues contribute to stabilizing the ligand through van der Waals interactions. The reference inhibitor AZD1208 (Figure 4B), in contrast, interacts through multiple hydrogen bonds with Asp128 and Asp131, supported by π-π and hydrophobic contacts within the same cavity.

The interaction is from the CASTp cavity binding site. Molecular docking interaction of Lepiotaprocerin C with PIM-I kinase (A). Molecular docking interaction of AZD1208 with PIM-I kinase (B). Interaction is showing in 3D surface and cartoon model with conventional hydrogen bonds.
The blind docking analysis confirms that Lepiotaprocerin C (Figure 5A) occupies the same predicted pocket, forming stable hydrogen bonds with Asp131 (3.4 Å) and Lys67 (2.6 Å), consistent with the residues identified in the CastP and PrankWeb cavities. AZD1208 (Figure 5B) also interacts with Asp128, Asp131, and Leu44, validating this site as the true active pocket. The docking at the PrankWeb binding site shows that Lepiotaprocerin C (Figure 6A) establishes hydrogen bonds with Lys67, Glu89, and Asp186, reinforcing its strong electrostatic and hydrogen-bonding interactions with catalytically relevant residues. AZD1208 (Figure 6B) forms key hydrogen bonds with Asn172, Glu171, and Asp128, showing similar anchoring within the active cleft. The hydrogen-bonding distances (2.0-3.4 Å) suggest energetically stable interactions for both ligands. The 2D molecular interaction of all derivatives is presented in supplementary file (Tables 1S to 3S).

The interaction is from the blinding docking. Molecular docking interaction of Lepiotaprocerin C with PIM-I kinase (A). Molecular docking interaction of AZD1208 with PIM-I kinase (B). Interaction is showing in 3D surface and cartoon model with conventional hydrogen bonds.

The interaction is from the Prank web binding site. Molecular docking interaction of Lepiotaprocerin C with PIM-I kinase (A). Molecular docking interaction of AZD1208 with PIM-I kinase (B). Interaction is showing in 3D surface and cartoon model with conventional hydrogen bonds.
Across all 3 docking approaches—CastP, blind docking, and PrankWeb—Lepiotaprocerin C consistently demonstrated the strongest binding affinity and most stable orientation within the validated catalytic pocket of PIM-1 kinase. It formed multiple hydrogen bonds with key active-site residues, including Glu121, Lys67, Asp128, and Val126, along with hydrophobic contacts that reinforced complex stability. Compared with the reference inhibitor AZD1208, Lepiotaprocerin C showed deeper binding, stronger electrostatic interactions, and a more favorable docking score, indicating higher affinity and selectivity for the PIM-1 kinase binding cavity. Therefore, the CASTp-docked Lepiotaprocerin C complex—exhibiting the most stable binding conformation and strongest intermolecular interactions—was selected for MD simulation to further validate the structural stability and dynamic behavior of the complex under physiological conditions.
MD simulation and binding analysis of protein-ligand complexes
Figures 7 and 8 illustrate the structural configuration of the most populated cluster obtained from the 200 ns MD simulation of the Lepiotaprocerin C and AZD1209-PIM-1 kinase (4JX3) complex. The dominant conformational state of the complex was extracted using clustering analysis, representing the most stable binding mode over the simulation trajectory. In order to understand how ligand binding influences the structural stability and dynamic properties of protein-ligand complexes, MD simulations were conducted. Parameters such as RMSD, RMSF, Rg, SASA, hydrogen bonding, and binding free energy were analyzed to gain insight into conformational behaviors and interaction profiles in both ligand-bound and unbound (apo) form.

(A) The root means square deviations and (B) root means square fluctuations of ligands bound complexes. (C) Radius of gyrations and (D) SASA of complexes.

The representation structure of the most populated cluster of protein (4JX3) with Lepiptaprocerin C during 200 ns molecular dynamics simulation binding site of Lepiptaprocerin C-4JX3 complex and (A) interaction of with Lepiptaprocerin C ligand in protein (B). The ligand with stick and protein complex shown as cartoon.
RMSD and RMSF analysis
To investigate structural changes throughout the simulation over time, RMSD analysis was performed on the Cα atoms. Comparisons between the protein (4JX3) with Azd1208 ligand and protein (4JX3) with Lepiptaprocerin C revealed that both complexes were stable during 200 ns MD simulations (Figure 7A). To further support the RMSD observations, RMSF analysis was done to evaluate residue-specific flexibility (Figure 7B). The Protein (4JX3) with Lepiptaprocerin C complex showed lower fluctuations in compared with protein (4JX3) with Azd1208 ligand complex. The RMSF plot compares the residue-wise flexibility of protein 4JX3 when bound to 2 different ligands—Azd1208 and Lepiptaprocerin C. Both complexes show similar overall fluctuation patterns, indicating comparable structural dynamics across most residues. However, the Lepiptaprocerin C complex (red) shows slightly higher fluctuations at several regions, particularly near the C-terminal (around residue 250), suggesting increased flexibility in these segments upon ligand binding. The RMSD remain within the range of below 2Å throughout the run. This enhanced flexibility may indicate conformational rearrangements induced by Lepiptaprocerin C binding, potentially affecting protein stability and interaction dynamics compared with Azd1208.
Radius of gyration and SASA analysis
Analysis of Rg and SASA (Figure 7C and D) offered additional insights into the structural compactness and solvent interactions. Higher SASA values in the complexes pointed to increased surface exposure and looser protein folding. The both ligand-bound complexes had lower SASA values, implying improved compactness and structural integrity.
Cluster analysis and representative conformations
To explore dominant binding conformations, trajectory clustering was performed, resulting in 5 unique clusters. The most populated cluster, comprising about 70% of the total simulation time was used to extract representative structures for interaction analysis. These structures (Figure 8A and B)/(Figure 9A and B) served as a basis for detailed interaction mapping, highlighting the residues crucial to stable ligand binding.

The representation structure of the most populated cluster of protein (4JX3) with ligand Azd1208 during 200 ns molecular dynamics simulation. Binding site of Azd1208 in protein (A) interaction of Azd1208 with protein (B).
Hydrogen bonding analysis
Figure 10 provides comparative insights into the dynamic stability and interaction strength of Lepiotaprocerin C versus the reference inhibitor AZD1208 in complex with PIM-1 kinase (4JX3) over the course of the 200 ns MD simulation. In Figure 10A, the hydrogen bond distribution revealed that Lepiotaprocerin C (red line) formed a higher and more sustained number of interactions with the target protein compared with AZD1208 (black line). Most notably, Lepiotaprocerin C consistently formed 5 to 7 hydrogen bonds, with a few frames reaching up to 10 to 12 bonds (Figure 10A). This indicates stronger and more persistent ligand-protein interactions, contributing to complex stability.

(A) The number of hydrogen bonds between ligands and target protein (B) The RMSD of ligand in 2 different complexes.
Ligand RMSD and binding stability
The RMSD profiles of ligand Azd1208 and Lepiptaprocerin C were analyzed to assess their positional dynamics within the active site (Figure 10B). The Lepiptaprocerin C remained firmly bound with minor fluctuations, confirming strong, stable engagement with the active-site residues. On the other hand, Azd1208 was highly stable in the active site of the protein. The ligand Lepiptaprocerin C showed a small deviation from the initial structure; however, this ligand was also never left its active site during simulations.
Binding free energy estimation
To further assess the binding stability of the ligand-protein complexes, the MM/PBSA approach implemented in the AMBER18 software suite was employed to estimate the binding free energy by combining various energetic contributions, including van der Waals interactions, electrostatic forces, polar solvation, and nonpolar solvation energies. The results revealed that the 4JX3-Lepiptaprocerin C complex exhibited a stronger binding affinity (−22.0 ± 2.1 kcal/mol) compared with the 4JX3-Azd1208 complex (−19.82 ± 1.5 kcal/mol), suggesting that Lepiptaprocerin C forms a more stable complex with the protein (Table 4). The electrostatic energy (ΔEEEL) was significantly more favorable for Lepiptaprocerin C (−40.68 kcal/mol) than for Azd1208 (−21.85 kcal/mol), indicating stronger electrostatic interactions in the former complex. Conversely, the van der Waals energy (ΔEVDW was more favorable for Azd1208 (−34.67 kcal/mol) compared with Lepiptaprocerin C (−16.77 kcal/mol), reflecting better hydrophobic interactions in the Azd1208 complex. The polar solvation energy (ΔEPB) contributed unfavorably to binding for both ligands (≈40 kcal/mol), whereas the nonpolar solvation (ΔEPBnp) and dispersion (ΔEDisper) terms provided minor stabilizing effects. Overall, the more negative total binding free energy (ΔG) for Lepiptaprocerin C indicates that its enhanced electrostatic and solvation contributions overcome the relatively weaker van der Waals interactions, resulting in a more stable and energetically favorable complex with the protein 4JX3.
Binding free energy components of protein (4JX3) with Azd1208 ligand and Lepiptaprocerin C.
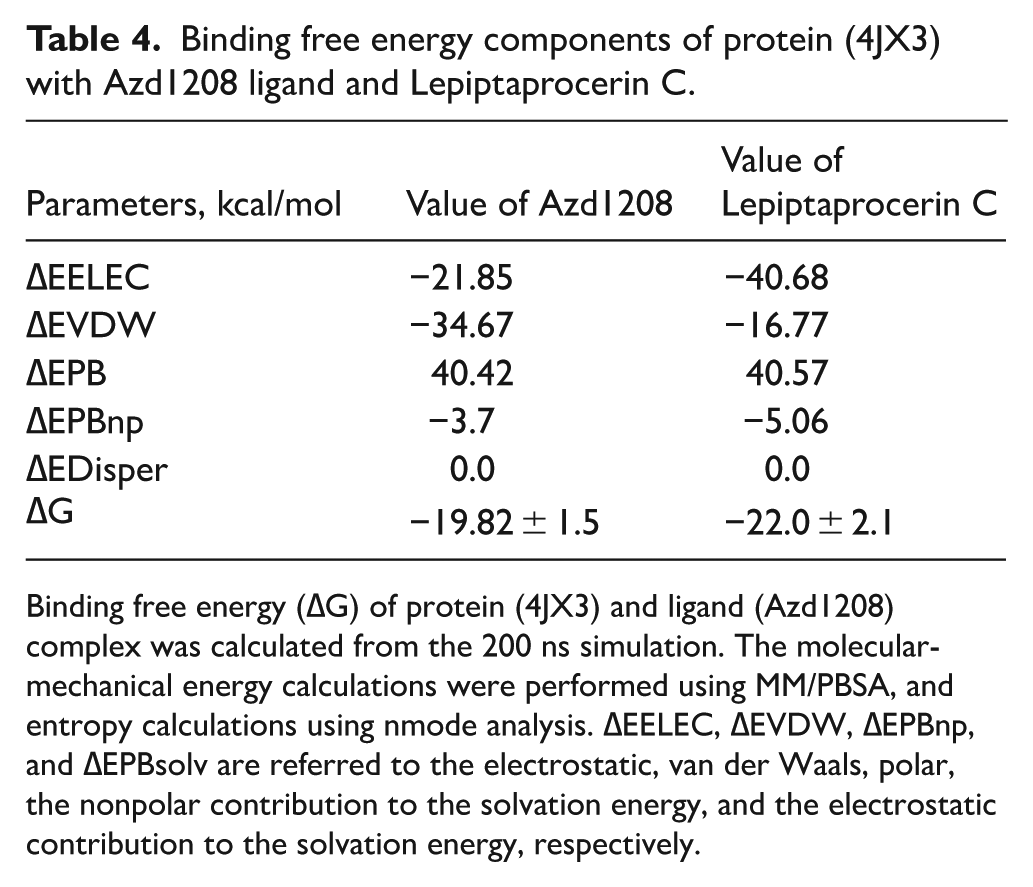
Binding free energy (∆G) of protein (4JX3) and ligand (Azd1208) complex was calculated from the 200 ns simulation. The molecular-mechanical energy calculations were performed using MM/PBSA, and entropy calculations using nmode analysis. ∆EELEC, ∆EVDW, ∆EPBnp, and ∆EPBsolv are referred to the electrostatic, van der Waals, polar, the nonpolar contribution to the solvation energy, and the electrostatic contribution to the solvation energy, respectively.
QSAR Model Development and Validation
Molecular descriptor selection
The dataset of 28 PIM-1 kinase inhibitors exhibited pIC50 values between 7.22 and 9.69, indicating moderate to strong inhibitory potency. Compounds with higher LogP (3.3-4.8) and molar refractivity (>160) generally showed greater activity, suggesting that lipophilicity and molecular polarizability enhance kinase inhibition. The molecular weights ranged from 401 to 644 Da, with most compounds containing 2 H-bond donors and 8 to 10 acceptors, supporting favorable interactions with the enzyme’s active site. Moderate flexibility (3-7 rotatable bonds) was common, indicating structural adaptability during binding. The dataset was evenly divided into training (75%) and test (25%) sets with comparable descriptor ranges, ensuring representative sampling. Overall, the results indicate that hydrophobicity, molecular size, and polarizability play key roles in governing PIM-1 kinase inhibitory activity. Using the k-means clustering method, the compounds were divided into a training set of 21 molecules and a test set of 7 molecules, ensuring uniform chemical space distribution (supplementary file, Table 4S).
MLR
The MLR model established for the PIM-2 kinase inhibitors was expressed as follows:
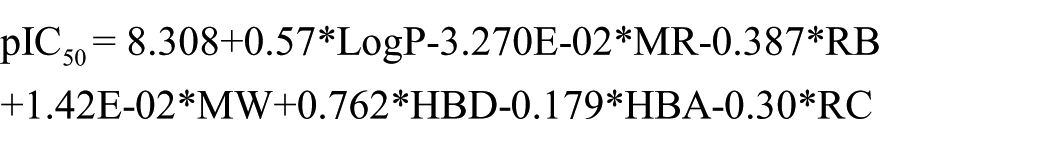
The predicted versus experimental pIC50 plot shows a strong linear correlation, indicating high predictive accuracy of the MLR model. Most compounds cluster near the ideal line, confirming minimal deviation between observed and predicted values. The close alignment demonstrates the model’s robustness, reliability, and strong external predictivity for PIM-1 kinase inhibitors (Figure 11). Furthermore, the comparison between experimental and predicted pIC50 values demonstrates a strong correlation, confirming the reliability of the developed MLR model. Most compounds exhibit minimal deviation (ΔpIC50 ⩽ 0.3) between observed and predicted values, indicating good internal consistency. A few compounds, such as CHEMBL1092653 and CHEMBL4518369, showed slightly higher deviations but remained within acceptable limits (Tables 5 and 6). The close alignment between experimental and predicted activities across the dataset confirms the model’s accuracy, robustness, and ability to capture key structural features influencing PIM-1 kinase inhibition.

Predicted versus experimental pIC50 plot for the MLR model of PIM-1 kinase inhibitors.
Experimental and predicted pIC50 values of the training set compounds used for MLR model development.
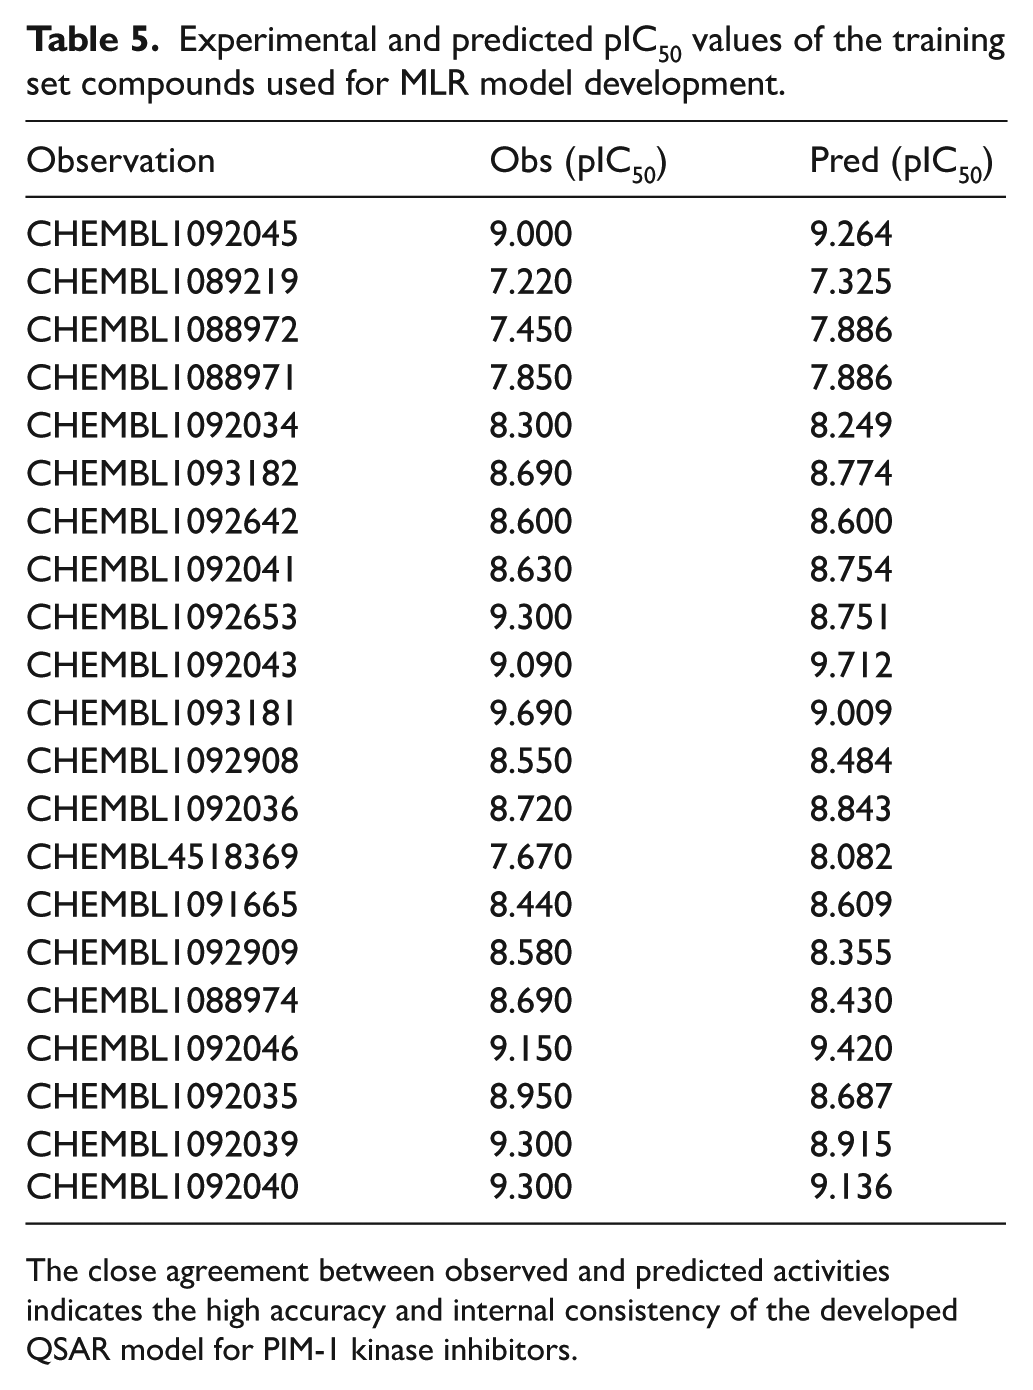
The close agreement between observed and predicted activities indicates the high accuracy and internal consistency of the developed QSAR model for PIM-1 kinase inhibitors.
Experimental and predicted pIC50 values of the test set compounds used for MLR model development.

Internal and external validation
The internal and external validation results of the developed MLR model demonstrate its robustness and predictive reliability. The internal validation parameters (R = .86, R2 = .74, Q2 = 0.90) satisfy the recommended QSAR acceptance thresholds (R2 > .6 and Q2 > 0.5), confirming strong model fitting and internal consistency. The external validation results (R = .79, R2 = .63, Q2 = 0.51) also meet the Golbraikh-Tropsha criteria, indicating good predictive performance on the test set. The regression slopes (k = 1.022, k1 = 0.954) are close to unity, reflecting minimal systematic deviation between experimental and predicted pIC50 values. The low mean squared errors (MSE = 0.1 for internal and 0.42 for external validation) further support the model’s accuracy and reliability (Table 7).
Internal and external validation parameters for the MLR-based QSAR model of PIM-1 kinase inhibitors.
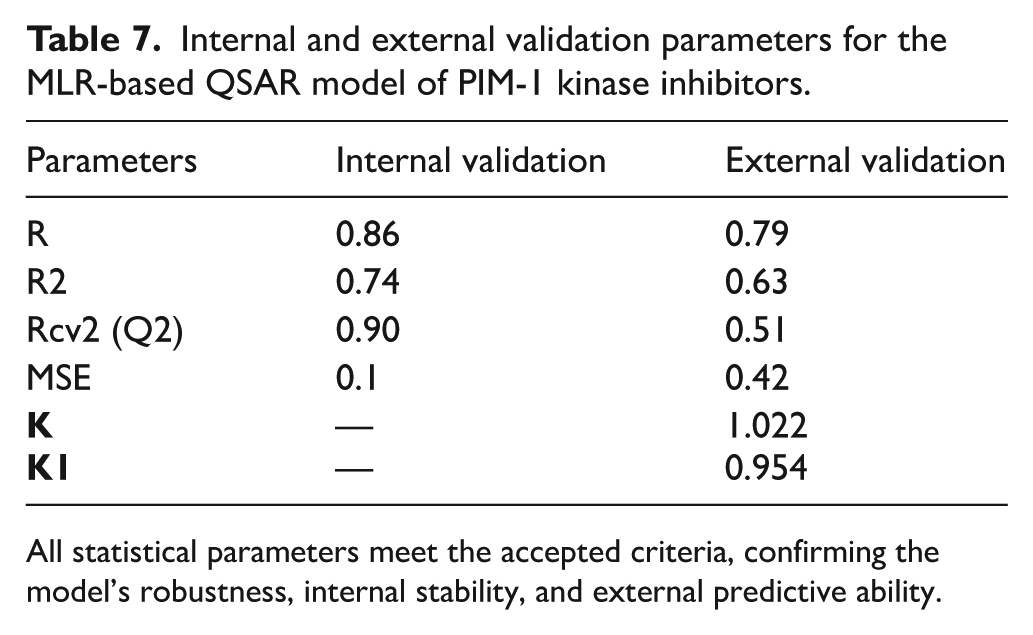
All statistical parameters meet the accepted criteria, confirming the model’s robustness, internal stability, and external predictive ability.
Y-randomization
The Y-randomization (response permutation) test was performed to verify that the developed MLR model was not a result of chance correlation. The randomized models yielded significantly lower statistical values (average r = .618, R2 = .394, Q2 = −1.253) compared with the original model (r = .8839, R2 = .7813, Q2 = 0.3469), confirming the true structure-activity relationship captured by the model (Table 8 and 9). Moreover, the corrected correlation parameter (cRp2 = 0.558) exceeded the recommended threshold (>0.5), further validating the robustness and nonrandom nature of the model.
Y-randomization results for the MLR model.

The original model shows considerably higher R, R2, and positive Q2 values than randomized models, confirming that the developed QSAR model is statistically significant, robust, and not due to random chance.
Y-randomization validation of the MLR model.

The lower R, R2, and Q2 values in randomized trials compared to the original model, along with cRp2 > 0.5, confirm that the model is statistically significant and not generated by random correlation. The lower r, R2, and Q2 values in randomized trials compared with the original model, along with cRp2 > 0.5, confirm that the model is statistically significant and not generated by random correlation.
Applicability domain
In the present model, all training (red) and test (blue) compounds were found within the acceptable leverage and residual limits (|standardized residual| < 3, hi < 0.8571), indicating the absence of both structural and response outliers. The even distribution of test compounds within the training space confirms that the model’s predictions are reliable and fall within its defined chemical AD, demonstrating the robustness and predictive stability of the developed QSAR model (Figure 12).

William’s plot illustrating the AD of the developed MLR model for PIM-1 kinase inhibitors.
Calculation of Cal (pIC50) of Lepiotaprocerin C from QSAR model
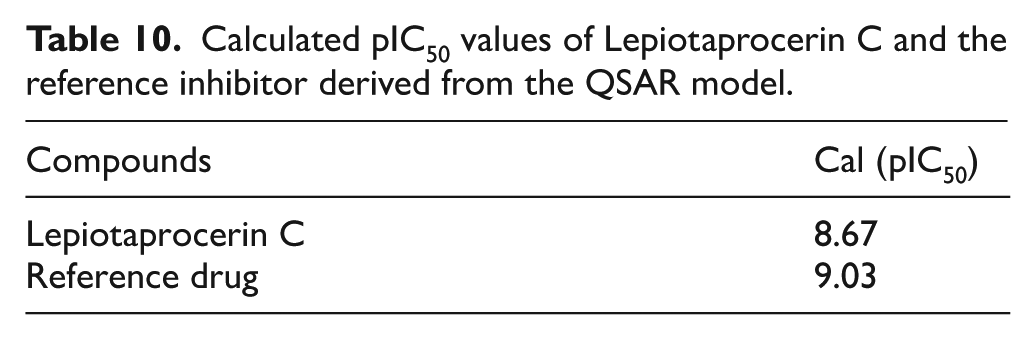
The docked Lepiotaprocerin C conformation obtained from the most stable CASTp docking complex was extracted and used as input for QSAR prediction to estimate its biological activity. Using the developed MLR model, the calculated pIC50 value for Lepiotaprocerin C was determined to be 8.67, whereas the reference inhibitor exhibited a pIC50 of 9.03 (Table 10). This result indicates that Lepiotaprocerin C possesses strong inhibitory potential against PIM-1 kinase, comparable to the reference drug, thereby validating its docking-derived binding affinity and justifying its selection for further MD simulation to assess the stability and binding efficiency of the complex under dynamic conditions.
Calculated pIC50 values of Lepiotaprocerin C and the reference inhibitor derived from the QSAR model.
Pharmacokinetics properties evaluations of Lepiotaprocerin C and reference drug
Lepiotaprocerin C shows a higher molecular weight (478.62) and greater lipophilicity (LogP = 4.82) than the reference drug (379.14; LogP = 2.84), indicating improved membrane permeability. Lepiotaprocerin C has 5 hydrogen bond acceptors (fewer than 10) and no hydrogen bond donors (fewer than 5), meeting most requirements. The results for Lepiotaprocerin C and reference drug are shown in Table 11, which follows the Lipinski rule of 5.
Physicochemical properties of Lepiotaprocerin C and reference drug.

Absorption and distribution study
Lepiotaprocerin C exhibited moderate water solubility (−5.79 log mol/L) compared with the reference drug (−4.55 log mol/L), indicating slightly lower aqueous solubility. However, it showed significantly higher CaCO-2 permeability (1.203 log Papp) than the reference (−5.67 log Papp), suggesting superior intestinal absorption. Both compounds were predicted to be well absorbed in the gastrointestinal tract and acted as P-glycoprotein substrates and inhibitors (I and II), indicating potential involvement in efflux transport. Lepiotaprocerin C displayed better skin permeability (−3.47 log Kp) than the reference (−5.36 log Kp), reflecting improved transdermal diffusion. The compound also showed slightly higher volume of distribution (VDss = 0.67 log L/kg) compared with the reference drug (0.55 log L/kg), suggesting broader tissue distribution. Its fraction unbound (5.5%) was lower than the reference (28.7%), implying stronger plasma protein binding. Moreover, Lepiotaprocerin C demonstrated marginally higher blood-brain barrier (BBB) permeability (log BB = 0.17) relative to the reference (0.14), indicating the potential for limited yet notable central nervous system (CNS) penetration (Table 12). These parameters suggest that Lepiotaprocerin C possesses favorable absorption and distribution characteristics, with enhanced permeability and tissue exposure despite reduced solubility.
Absorption and distribution parameters of Lepiotaprocerin C and the reference drug.
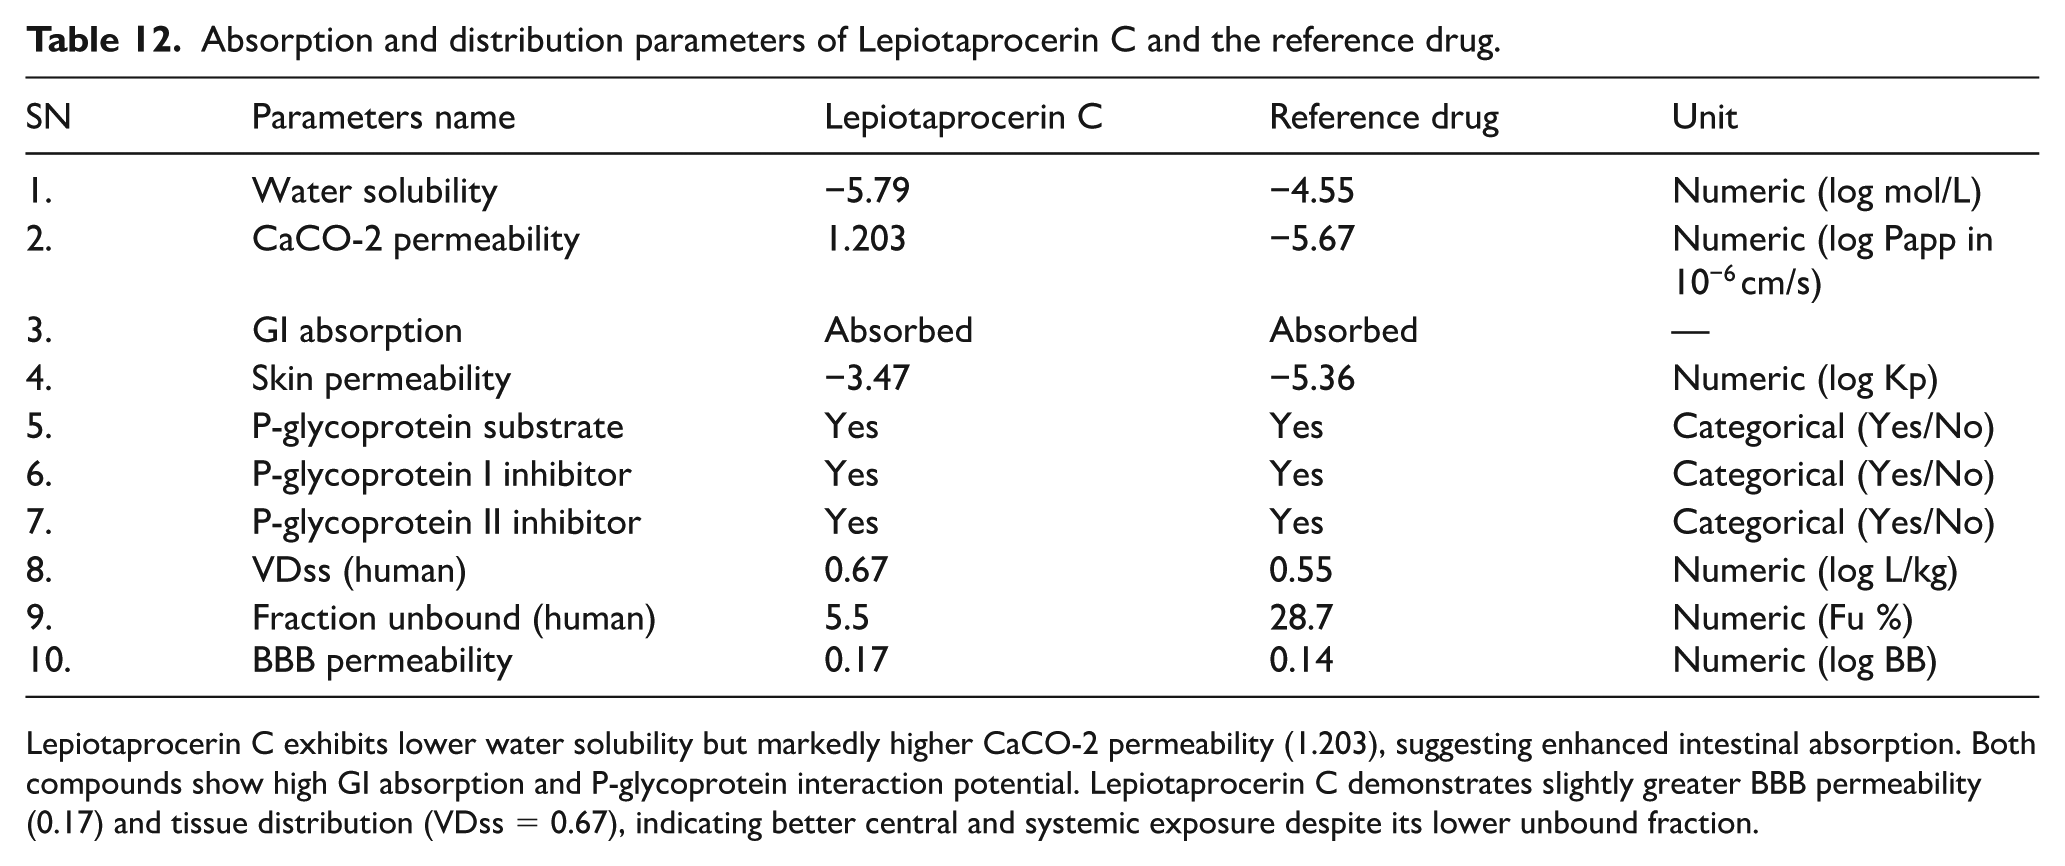
Lepiotaprocerin C exhibits lower water solubility but markedly higher CaCO-2 permeability (1.203), suggesting enhanced intestinal absorption. Both compounds show high GI absorption and P-glycoprotein interaction potential. Lepiotaprocerin C demonstrates slightly greater BBB permeability (0.17) and tissue distribution (VDss = 0.67), indicating better central and systemic exposure despite its lower unbound fraction.
Membrane permeability and binding energy analysis
Lepiotaprocerin C exhibited a lower membrane binding energy (−1.82 kcal/mol) than the reference drug (−4.67 kcal/mol), implying reduced lipid affinity and easier membrane passage. Its higher BLM permeability (0.63) compared with the reference (−4.04) suggests superior passive diffusion potential (Table 13). The compound showed moderate permeability across the BBB (−2.67) and CaCO-2 membrane (−3.32), both improved relative to the reference, indicating better transport efficiency through biological membranes and supporting its favorable absorption profile.
Comparative absorption permeability and membrane binding parameters of Lepiotaprocerin C and the reference drug.
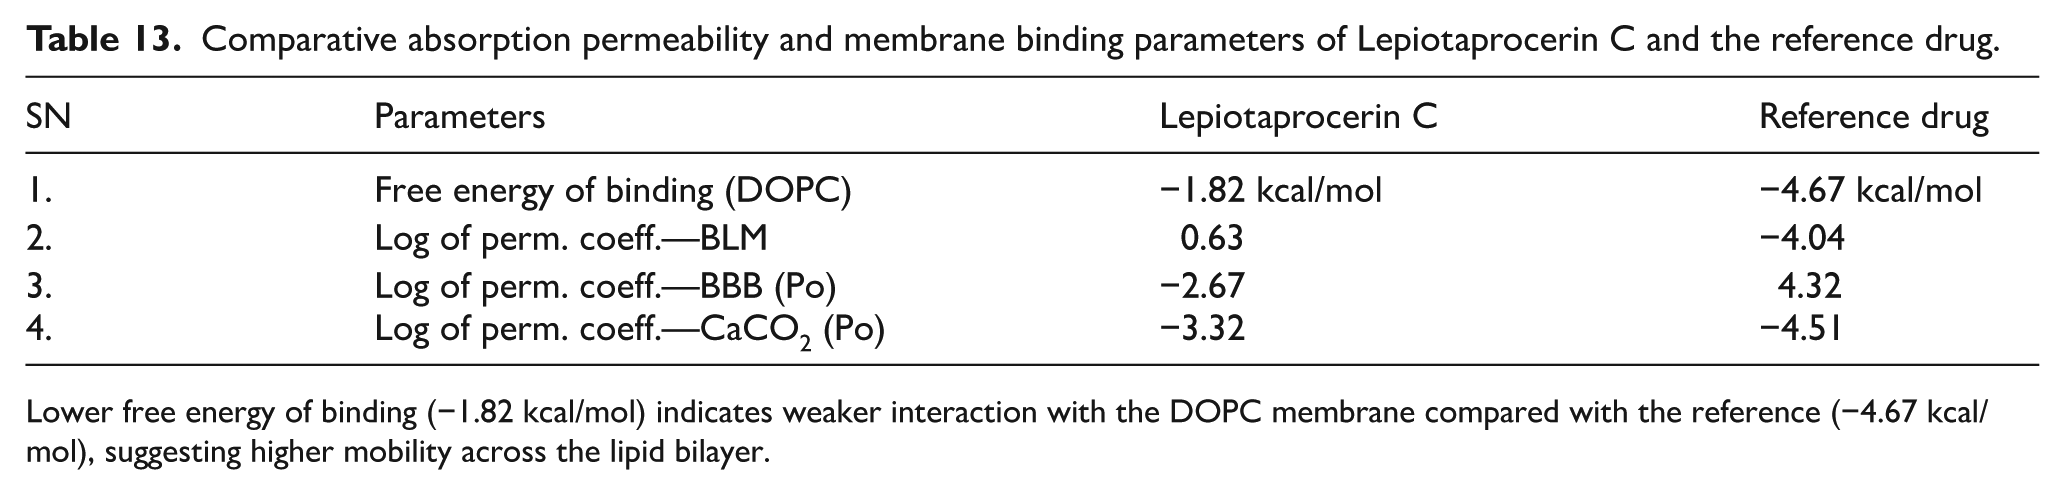
Lower free energy of binding (−1.82 kcal/mol) indicates weaker interaction with the DOPC membrane compared with the reference (−4.67 kcal/mol), suggesting higher mobility across the lipid bilayer.
Lepiotaprocerin C displayed a lower free energy of binding to the dioleoylphosphatidylcholine (DOPC) membrane (−1.82 kcal/mol) than the reference drug (−4.67 kcal/mol), indicating weaker lipid affinity and easier diffusion across membranes. Its BLM permeability (0.63) was markedly higher than the reference (−4.04), demonstrating superior passive transport. The compound also showed moderate BBB (−2.67) and CaCO-2 (−3.32) permeability coefficients, both better than the reference (4.32 and −4.51, respectively), signifying enhanced membrane permeability and overall absorption potential.
Metabolic stability/cytochrome P450 inhibition
Lepiotaprocerin C inhibits CYP1A2 and CYP3A4, suggesting involvement in primary metabolic pathways, while showing no inhibition of CYP2C19, CYP2C9, or CYP2D6, unlike the reference drug (Table 14). This selective inhibition pattern indicates better metabolic stability and a lower likelihood of adverse drug-drug interactions, supporting its suitability as a safer therapeutic candidate.
Prediction of cytochrome P450 inhibition profile and metabolic stability of Lepiotaprocerin C.

Lepiotaprocerin C exhibits lower water solubility but markedly higher CaCO-2 permeability (1.203), suggesting enhanced intestinal absorption. Both compounds show high GI absorption and P-glycoprotein interaction potential. Lepiotaprocerin C demonstrates slightly greater BBB permeability (0.17) and tissue distribution (VDss = 0.67), indicating better central and systemic exposure despite its lower unbound fraction.
Excretion study
The excretion parameters of Lepiotaprocerin C and reference drug were evaluated to understand its elimination potential and renal clearance mechanism. Lepiotaprocerin C demonstrated higher plasma clearance (11.564 mL/min/kg), implying efficient excretory elimination, while maintaining a comparable half-life (1.057 h) to the reference drug (1.006 h) (Table 15). This balance suggests that Lepiotaprocerin C undergoes faster clearance without significantly affecting its duration of pharmacological activity.
Excretion results parameter for Lepiotaprocerin C and reference drug.

PASS prediction of biological activity
Prediction of Activity Spectra for Substances analysis of Lepiotaprocerin C revealed a high probability of antineoplastic activity (Pa = 0.881) and apoptosis antagonism (Pa = 0.865), indicating strong potential for anticancer action. The compound also showed moderate predicted activity against specific cancer types, including breast cancer (Pa = 0.502), lung cancer (Pa = 0.451), colon cancer (Pa = 0.404), colorectal cancer (Pa = 0.403), and ovarian cancer (Pa = 0.334) (Table 16). These findings support potential activity of Lepiotaprocerin C as a multitargeted anticancer agent.
PASS prediction of Lepiotaprocerin C.

Toxicity study
In silico toxicity predictions indicated that Lepiotaprocerin C is likely to be nontoxic across major biological systems. The compound was predicted to be non-hepatotoxic (probability = 0.83), non-neurotoxic (0.81), non-cardiotoxic (0.56), and non-nephrotoxic (0.56). It also showed no evidence of carcinogenicity (0.52), immunotoxicity (0.78), mutagenicity (0.89), or cytotoxicity (0.70). The prediction for overall clinical toxicity was also inactive (0.57) (Table 17). These results suggest that Lepiotaprocerin C has a favorable toxicity profile, supporting its potential for further preclinical development.
Predicted toxicity profile of Lepiotaprocerin C based on in silico analysis.

Limitations and future prospects
While this study provides strong computational evidence supporting Lepiotaprocerin C as a potential PIM-1 kinase inhibitor, it is not without limitations. All results were derived from in silico approaches, including molecular docking, MD simulations, ADMET predictions, and PASS analysis, which rely on theoretical models and algorithms. These methods, although powerful, may not fully capture the complexity of biological systems such as metabolism, off-target interactions, and intracellular signaling pathways. In addition, the lack of in vitro or in vivo validation restricts the ability to confirm the compound’s real-world efficacy, bioavailability, and toxicity profile.
Future work should focus on experimental validation of Lepiotaprocerin C, including enzyme inhibition assays, cytotoxicity studies in cancer cell lines, and in vivo pharmacokinetic and toxicity assessments. Moreover, the compound’s impact on apoptosis and downstream signaling pathways should be explored through proteomic and transcriptomic profiling. Integration of machine learning models for activity prediction and multitarget docking may further strengthen the therapeutic evaluation. Ultimately, such studies will help establish Lepiotaprocerin C as a viable candidate for preclinical and clinical development in cancer therapy.
Conclusion
This comprehensive computational investigation identifies Lepiotaprocerin C from Macrolepiota procera as a promising natural PIM-1 kinase inhibitor with potent anticancer potential. Docking and cavity validation confirmed its selective binding at the ATP-binding site, while 200 ns MD simulations and MM/PBSA analysis substantiated its dynamic stability and favorable energetics. The developed QSAR model provided reliable predictive accuracy for kinase inhibition, aligning with experimental benchmarks. ADMET and permeability analyses supported its drug-likeness, metabolic stability, and safety, while PASS results indicated strong antineoplastic activity. Compared with AZD1208, Lepiotaprocerin C exhibited deeper active-site penetration and higher electrostatic interaction energy, underscoring its superior affinity and pharmacological promise. Overall, the study establishes a mechanistic and pharmacokinetic rationale for further experimental validation of Lepiotaprocerin C as a potential lead compound in targeted anticancer therapy through PIM-1 kinase inhibition.
Supplemental Material
sj-docx-1-bbi-10.1177_11779322251410083 – Supplemental material for In Silico Identification of Lepiotaprocerin C as a Promising PIM-1 Kinase Inhibitor: An Integrated Docking, Molecular Dynamics, MM/PBSA, QSAR, and ADMET Study
Supplemental material, sj-docx-1-bbi-10.1177_11779322251410083 for In Silico Identification of Lepiotaprocerin C as a Promising PIM-1 Kinase Inhibitor: An Integrated Docking, Molecular Dynamics, MM/PBSA, QSAR, and ADMET Study by Keshava KS, Faten Qais Ibraheem, Shankar Thapa, Somashekhar M Metri, Sadik Shaik, Santosh Prasad Chaudhary Kurmi, Abhishek Chowdhury, Vipin Kumar Mishra and Pramila T in Bioinformatics and Biology Insights
Footnotes
Acknowledgements
We thank the Department of Pharmacology, GM Institute of Pharmaceutical Sciences and Research, Davangere, Karnataka, India, for providing resources and platform.
Ethical Considerations
Ethical approval was not required for this study as it did not involve any human participants or animal subjects.
Author Contributions
Funding
The authors received no financial support for the research, authorship, and/or publication of this article.
Declaration of Conflicting Interests
The authors declared no potential conflicts of interest with respect to the research, authorship, and/or publication of this article.
Supplemental Material
Supplemental material for this article is available online.
References
Supplementary Material
Please find the following supplemental material available below.
For Open Access articles published under a Creative Commons License, all supplemental material carries the same license as the article it is associated with.
For non-Open Access articles published, all supplemental material carries a non-exclusive license, and permission requests for re-use of supplemental material or any part of supplemental material shall be sent directly to the copyright owner as specified in the copyright notice associated with the article.