
Abstract
The human immunodeficiency virus (HIV) infection and the associated acquired immune deficiency syndrome (AIDS) remain global challenges even after decades of successful treatment, with eastern and southern Africa still bearing the highest burden of disease. Following a thorough computational study, we report top 10 phytochemicals isolated from Croton dichogamus as potent reverse transcriptase inhibitors. The pentacyclic triterpenoid, aleuritolic acid (L12) has displayed best docking pose with binding energy of -8.48 kcal/mol and Ki of 0.61 μM making it superior in binding efficiency when compared to all docked compounds including the FDA-approved drugs. Other phytochemicals such as crotoxide A, crothalimene A, crotodichogamoin B and crotonolide E have also displayed strong binding energies. These compounds could further be investigated as potential antiretroviral medication.
Introduction
Globally more than 75.7 million people have been infected and more than 33 million died since the HIV pandemic. Currently, 38 million people are living with the virus, out of which 54% (20.7 million) live in southern and East African region. By the end of 2020, the global death by the epidemic has reached more than half a million, where more than 300,000 of these deaths occurred in southern and East African region. In 2020, over 1.7 million people were infected by the virus. 1 In southern and East African region, more than 25% (5 million) people do not have access to the treatment. 1
Phytochemicals isolated from natural products are important sources of lead compounds for the treatment of HIV/AIDS and other viral diseases. A number of natural products were investigated as promising phytochemicals for treatment of HIV including baicalin (a flavonoid), 2 calanolides (coumarins), 3 betulinic acid (a triterpene),4,5 polycitone A (an alkaloid), 6 lithospermic acid, sulphated polysaccharides, cyanovirin-N, 7 pokeweed antiviral protein 8 and alpha-trichobitacin (proteins) 9
The Croton genus has gained attention of many researchers for their potential source of bioactive compounds against HIV. Among the Croton genus, Croton dichogamus has wide ethnomedicinal use in East African countries including treatment of fever, stomach illness, respiratory disorders, malaria, impotence and infertility.10-14 The objective of this study was to elucidate and analyze the binding mode of phytochemicals isolated from C. dichogamus in the active site of reverse transcriptase (PDB ID:
Materials and Methods
Computational tools
Docking studies were performed using AutoDock 4.2.6 (http://autodock.scripps.edu/).15-17 Discovery Studio Visualizer 3.1 Studio (Version 3.5, Accelrys Software Inc. Accelrys, San Diego, CA, USA) was used to visualize the protein ligand interactions. 18
Ligand selection and preparation
The two dimensional structures of 24 phytochemicals isolated from Croton dichogamus were obtained from literature and chemical structure databases (Table S3 in Supplementary).19,20 The ChemDraw 19.1 software was used to draw the 2D structures of compounds. For purpose of comparison, the structures of 4 FDA-approved drugs (abacavir, delaviridine, nevirapine and zidovudine) were obtained from pubchem database. The structures for ligands (phytochemicals and ARV’s) were optimized for energy minimization using the MMFF94 force field 21 and were subsequently converted to protein data bank (pdb) format using Discovery studio. 18
In silico drug likeness and ADMET prediction
The ligands were screened on the basis of Lipinski’s “Rule of five,” such as MW < 500, log P < 5, hydrogen bond donors < 5 and hydrogen bond acceptors < 10 22 using SWISS ADME web based application.21,23,24 Typical ADME prediction methods that involve aqueous solubility (PlogS), PlogBB (blood/brain), logHIA (intestinal barrier), PCaco-2 (cell permeability), logPgp (substrate/non-Inhibitor), PlogS (aqueous solubility) and LogPapp (cell permeability), CYP inhibition were calculated using ADMET SAR Toolbox and SWISS ADME, a free web tool used to evaluate pharmacokinetics, drug-likeness and medicinal chemistry friendliness of small molecules. 25
Toxicity prediction that involve AMES toxicity, carcinogenicity, fish toxicity, Tetrahymena Pyriformis toxicity (TPT), honey bee toxicity, mutagenicity, tumerogenicity, reproductive effect and irritation were calculated using admetSAR, a comprehensive source and free web tool for assessment of chemical toxicity properties. 26 AMES toxicity test, is bacterial reverse mutation assay to detect frame-shift mutations or base-pair substitutions invitro which may be detected by exposure of histidine-dependent strains of Salmonella typhimurium to a test compound. Tetrahymena pyriformis toxicity is often used as a toxic endpoint.
Protein preparation
The three-dimensional structure of target HIV reverse transcriptase (PDBID: 1REV) was retrieved from protein data bank (http://www.pdb.org) at 2.60 Å RMSD resolution. 1REV has a molecular weight of 116.34 kDa and is active at a pH of (6.5–8.1). 27
The protein molecule 1REV was prepared using Swiss-PdbViewer v4.1 and autodock 4.2. The protein was in complex with a ligand, water molecules and heteroatoms. Water molecules, inhibitor, and other heteroatoms from the protein were removed using notepad ++ and used for docking. The preparation process involved: deleting water molecules and co-crystallized DNA primer complex, adding hydrogen atoms at a pH range of 6.5–8.1 for effective ligand binding using Swiss-PdbViewer v4.1 28 and autodock 4.2. 29 The atom constraints were applied to the protein backbone and the Magnesium Ion were fixed to avoid any modifications in the experimental structure, and then saved in PDB format for energy minimization.
Active site prediction
The active site of reverse transcriptase (PDB ID: 1REV) was predicted using MetaPocket 2.0 online server (https://projects.biotec.tu-dresden.de/metapocket/).30,31 The processed protein data file without heteroatoms was uploaded and the top result from the three best (based on the z-score) potential ligand-binding site was chosen for docking. Active site prediction using MetaPocket 2.0 has revealed presence of 35 amino acid residues in the ligand binding pocket of 1REV. The amino acid residues predicted were then compared with the amino acids in the active site of the ligand-1REV complex. This was done by using LigPlot + v 2.2 32 and discovery studio softwares. 18 Molecular docking steps were performed after this step.
Molecular docking experiments
Docking experiment was performed with potential active site on HIV reverse transcriptase enzyme using AutoDock 4.2.6 (http://autodock.scripps.edu/). 33 During docking at first the explicit hydrogens, charges, flexible torsions, were assigned by the AD program for both the protein and ligands.
Polar H-atoms were added to the target protein for correct ionization and tautomeric states of amino acid residues. Kollman united charge and Gasteiger charge were added to protein and ligands, respectively. Rigid roots were also assigned to the ligand and five bonds were made “active” or rotatable. 34 The modified 3-dimensional structure of HIV-1RT and ligands accounting for the flexibility of its bonds were converted to PDBQT format as required in AutoDock calculations.
The Lamarckian genetic algorithm (LGA) was utilized to search for the conformations using the following docking parameters: a population size of 150 dockings, a maximum number of generations of 27,000, a maximum energy evaluation of 25 million, 50 docking runs, and random initial positions and conformations. 33 Other parameters such as crossover rate and mutation rate, were used in the default mode. The autogrid program was used to generate grid size for specifying the search space and grid box was set with center x = -36.956; y = 31.989; z = -19.75 and size x = 40; y = 60; z = 50 centered on the predicted cavities with a default grip maps space 0.375 Å spacing. Pre-calculated grid maps, which store grids of energy based on the interaction of the ligand atom probes with receptor targets, were obtained using AutoGrid4.2.
The least binding energy conformation was considered as the most favorable docking pose. The images and output of AutoDock and all modeling studies were analyzed using PyMOL. 35 The interaction between ligand and receptor and hydrogen bond lengths were analyzed using LigPlot + and protein ligand interaction profiler server https://plip-tool.biotec.tu-dresden.de/plip-web/plip/index. 32
Validation of the docking method
For the validation of docking tool, a decoy set of ligands was used along with the active ligands. For decoy dataset generation, the co-crystal ligand (PDB ID: 1REV) was used. The physicochemical properties of co-crystal that is, molecular weight, number of hydrogen bond acceptors, number of hydrogen bond donors and LogP were used for decoy dataset generation in ChEMBL database. After generation of decoy dataset, all the ligands were prepared by MGL tool for docking. Autodock was used to dock all the ligands, that is, actives and decoys to the specific site of protein. 36
Molecular dynamic simulation
Ligand-protein complexes that displayed better docking poses were subjected to molecular dynamic (MD) simulation. Molecular dynamics simulation was performed for 100 nanoseconds using Desmond-Maestro module 2020, a Package of Schrödinger LLC. 37 The initial stage of protein and ligand complexes for molecular dynamics simulation were obtained from the docking studies. The protein–ligand complex was preprocessed using Protein Preparation Wizard or Maestro, which also included optimization and minimization of complexes. All systems were prepared by the System Builder tool.
The docked complex was first submerged in Transferable Intermolecular Interaction Potential 3 Points (TIP3 P) water model in an orthorhombic shape. 38 The optimized potentials for the liquid simulations (OPLS) - 2005 force field was used in the simulation and for energy calculation. The models were made neutral by adding counter ions where needed. To mimic the physiological conditions, 0.15 M salt (NaCl) was added. The MD simulation was performed under thermodynamically stable conditions.
The NPT ensemble with 300 K temperature and 1 atm pressure was select for complete simulation. The models were relaxed before the simulation. The trajectories of each complex were saved after every 100 ps (0.1 ns) for analysis, and the stability of simulations was evaluated by calculating the root mean square deviation (RMSD) of the protein and ligand over time. In addition, each complex was subjected to specific parameters such as root mean square fluctuation (RMSF), radius of gyration, conformational modification of ligands and intermolecular interactions to analyze the level of structural changes.
Free energy binding calculation
To estimate and compare the binding affinity, the ligand binding energy of the phytochemicals was calculated using the molecular mechanics-generalized born surface area (MMGBSA) module in the Schrodinger Suite 2014
39
,
40
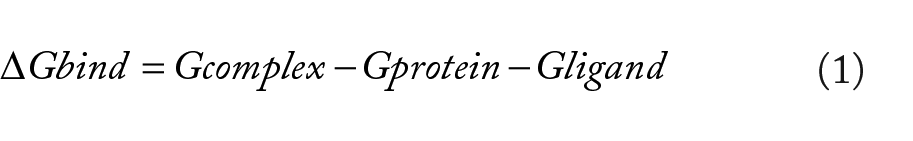
(Archontis, 2012; Ylilauri & Pentikäinen, 2013). Binding free energy was averaged over 1000 snapshots extracted from the 100 ns trajectory. The binding free energy ∆
Results and Discussions
Validation of the docking method
The docking was validated by the area under curve (AUC) graph and the early enrichment factor (E.F) at 1% and 20%. The AUC value for the docking was 0.7040 while the E.F value at 1% and 20% was 2.38 and 2.48 respectively. The AUC values indicate that the docking tool picks the active compounds and rank them better than decoy compounds. Which means that the tool gives 70% true positive results. There were a total 15 active ligands and the E.F at 1% shows that there were 8 ligands in top 1% results. From the results of this step, it can be concluded that docking tools is validated. 36 The AUC graph is shown in Figure S1 in Supplementary.
Molecular docking analysis
Our computational docking study revealed that 10 of the docked compounds had a greater binding efficiency ranging from -6.9 to -7.48 kcal/mol which is much better as compared to the positive control drugs. The binding energies of FDA-approved drugs ranged from -5.63 to -6.85 kcal/mol. Table 1 summarizes the docking results for the phytochemicals and FDA-approved antiretroviral drugs.
Molecular docking analysis of phytochemicals isolated from Croton dichogamus against HIV-1 reverse transcriptase (PDB: 1REV).
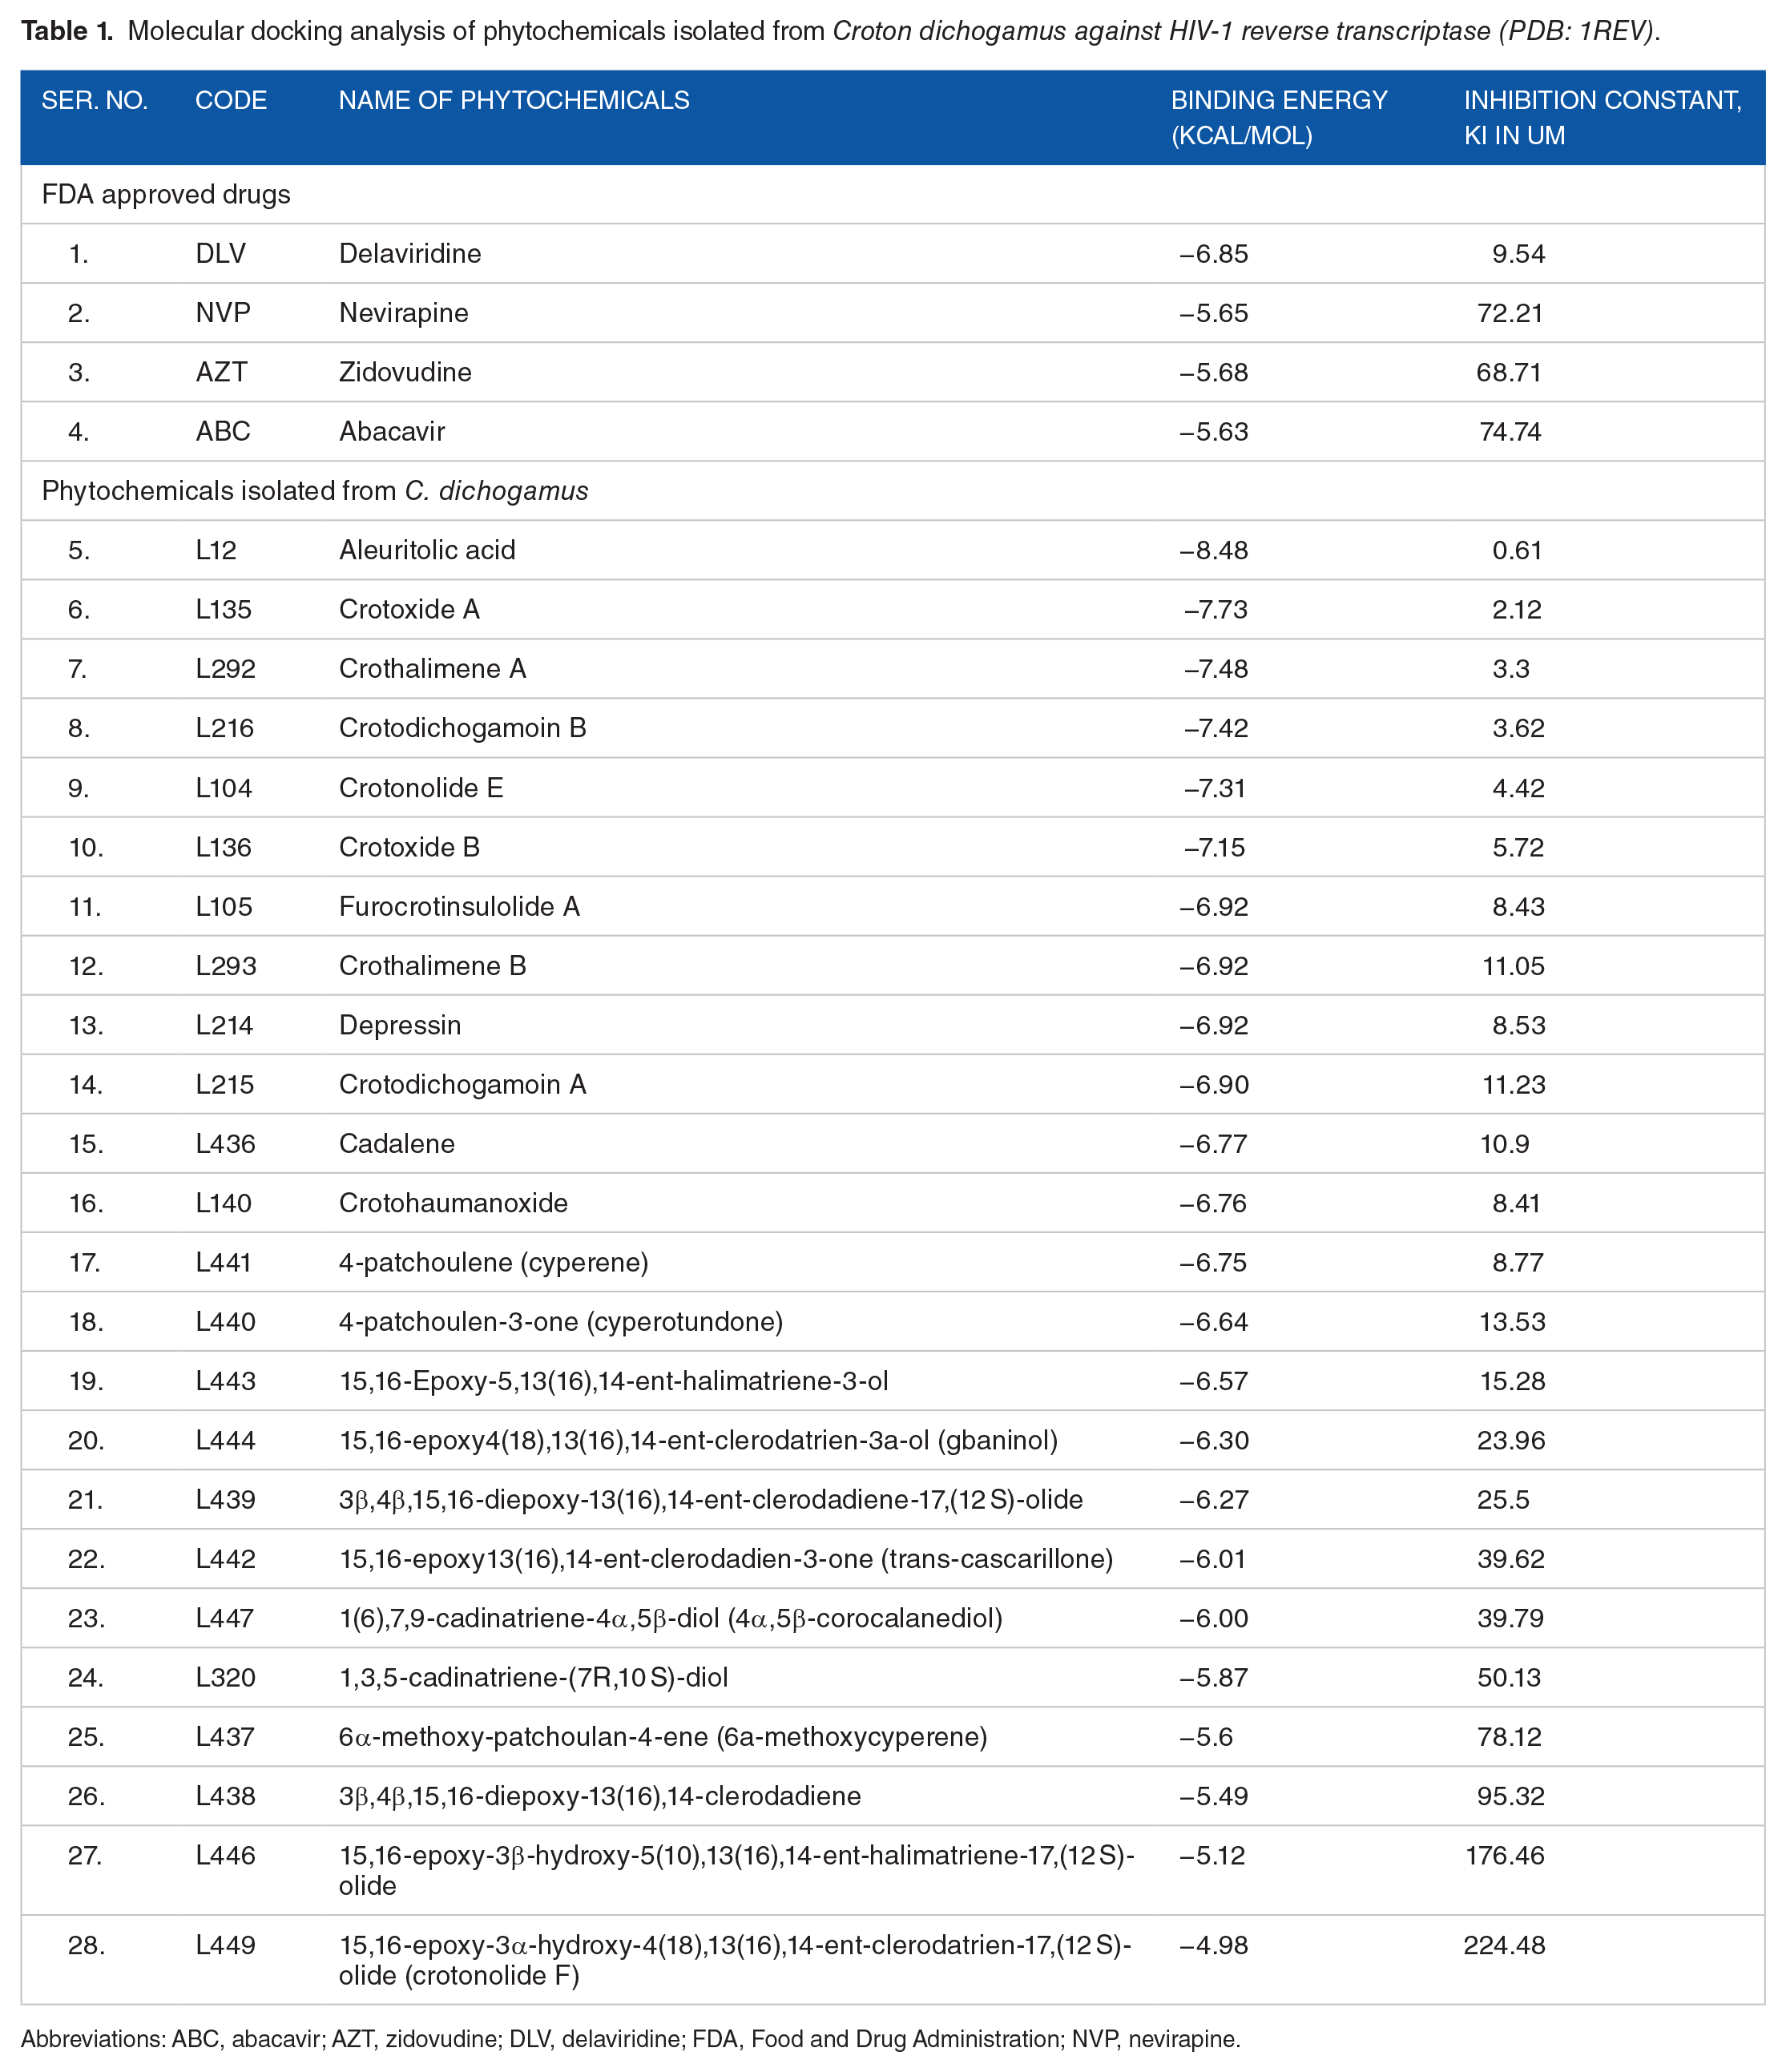
Abbreviations: ABC, abacavir; AZT, zidovudine; DLV, delaviridine; FDA, Food and Drug Administration; NVP, nevirapine.
Aleuritolic acid (L12), had the best binding conformation with the reverse transcriptase enzyme with a binding energy of -8.48 kcal/mol followed by Crotoxide A (L135), Crothalimene A (L292) and Crotodichogamoin B (L216) with -7.73, -7.48, -7.42 kcal/mol respectively (Table 1). The binding efficiency of the top 10 phytochemicals was greater than the binding efficiency of the FDA approved drugs delaviridine (-6.85 kcal/mol), zidovudine (-5.68 kcal/mol), nevirapine (-5.65 kcal/mol) and abacavir (-5.63 kcal/mol) which confirms that these phytochemicals might have potential reverse transcriptase inhibitory activity.
Molecular dynamic simulation
Binding free energy
As molecular docking only measures the geometric fit of ligands at the active site of a protein in static conditions, molecular dynamics simulations were run for 100 ns to allow for the ligands to become “comfortable” within an enzyme’s binding site, to assess the binding free energy of the system. The more negative the values, the better the binding free energy between the enzyme (HIV-1 RT 1REV) and the ligands.
The binding free energy (∆
Binding free energy for phytochemical compounds from C. dichogamus and FDA approved drugs to HIV-RT 1REV.

Abbreviations: ABC, abacavir; AZT, zidovudine; DLV, delaviridine; FDA, Food and Drug Administration; NVP, nevirapine.
From our MMGBSA calculations it is possible to note that electrostatic (∆
It was also interesting to note that although compounds crotonolide E, crotodichogamoin B and crotoxide B demonstrated relatively high docking scores, binding free energy calculations for these systems indicated dissimilar results. This validates the need for molecular dynamic simulations, which may allow for a compound to become “comfortable” within an enzyme’s binding site.
Structural analysis of the most optimal phytochemical-HIV RT complexes
To further establish the mechanistic inhibitory characteristics of the top ten selected phytochemical compounds with antiviral activity against HIV1-RT and to better understand the complex stability and backbone fluctuation, Root Mean Square Deviation (RMSD), Root Mean Square Fluctuation (RMSF), Radius of Gyration (RoG) and ligand interaction plots were assessed as previously described by previous studies.38,41,42
The Root Mean Square Deviation (RMSD) of the protein backbone was calculated to check the stability of structure during the simulation period. Figure 1 depicts the RMSD plot for the four phytochemical compounds and the FDA approved drugs. In this study, RMSD values for the C-alpha atoms of the structures were determined. The RMSD of each complex was compared to protein RMSD and the RMSD values of the four FDA approved drugs. Deviation in a range of 1-2 Å between the RMSD of the protein alone and RMSD of the complex is considered as acceptable and stable. RMSD measures protein stability as the simulation progresses.
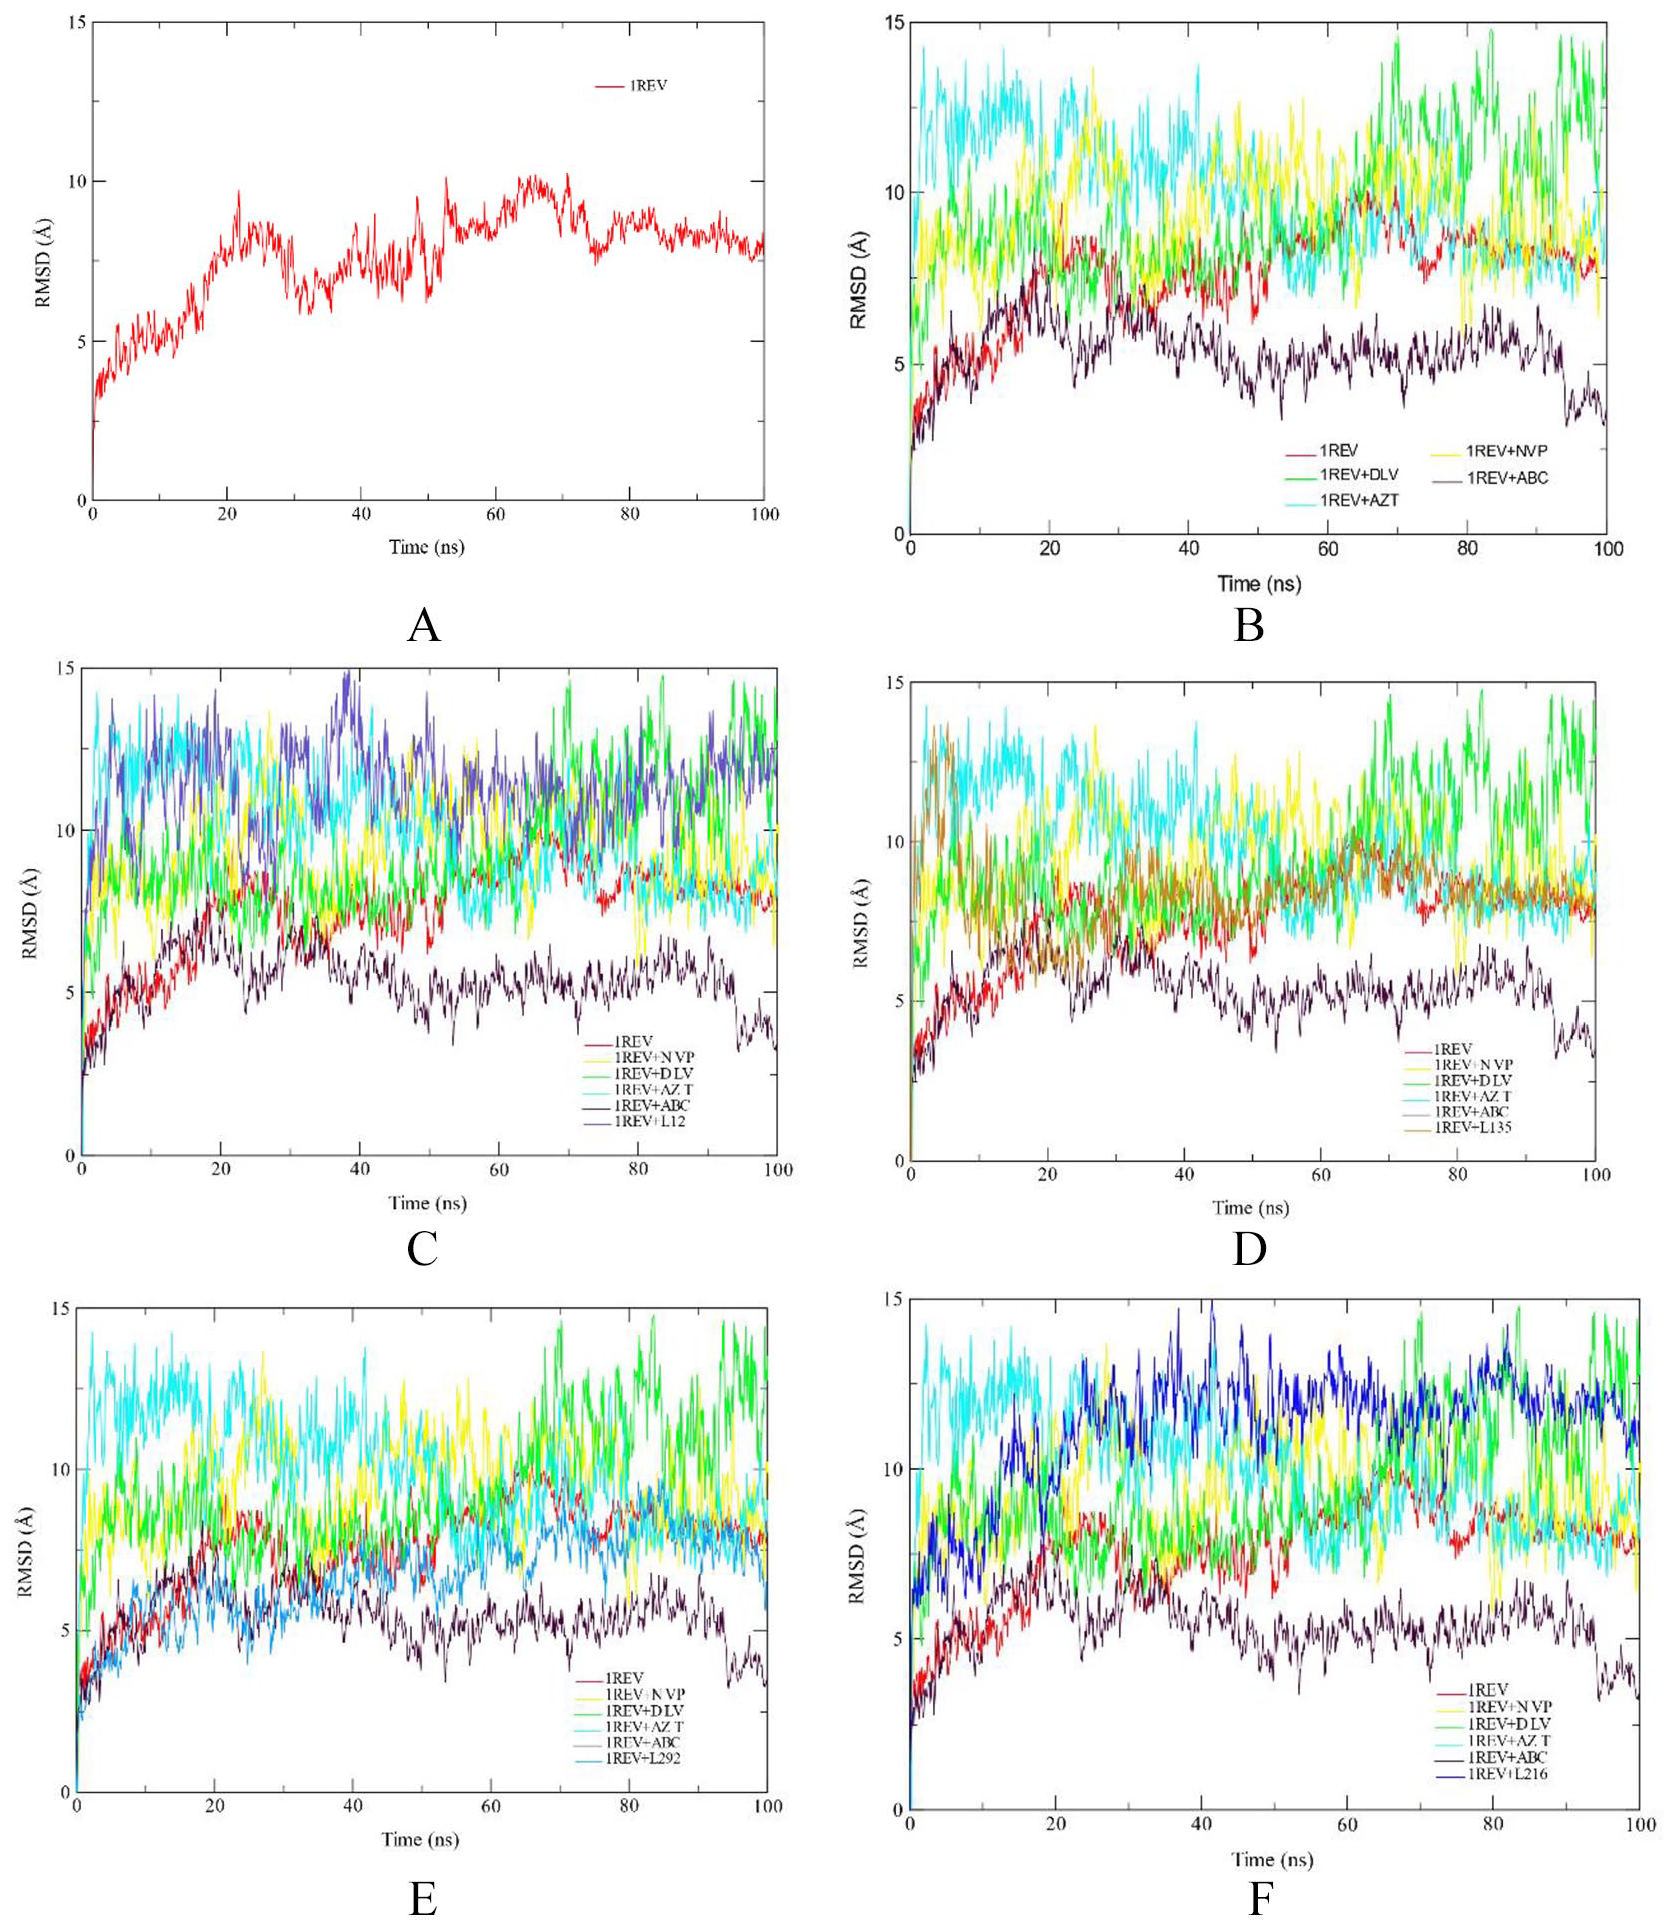
RMSD profile of protein backbone atoms of HIV1-RT 1REV (A), FDA approved antiretreoviral drugs delaviridine-DLV, Nevirapine NVP, Zidovudine AZT and Abacavir ABC drugs (B), Aleuritolic acid, L12 (C); Crotoxide A, L135 (D); Crothalimene A, L292 (E); Crotodichogamoin B, L216 (F), calculated over the course of 100 ns molecular dynamic simulation.
The first 30 ns of the simulation of Crotohalimene A (L292), Crotodichogamoin B (L216) and Aleuritolic acid (L12) showed instability of the enzyme, but from 30 to 100 ns of simulation the enzyme was stable. The RMSD plots of Aleuritolic acid (L12) and Crotodichogamoin B (L216) with average values of 6.75 ± 0.03 Å and 6.72 ± 0.03 Å respectively are similar to the RMSD of nevirapine (6.71 ± 0.03 Å). This indicates the same enzyme stability between the phytochemical compounds and the FDA-approved drugs. Similarly, the RMSD plots of Crotohalimene A (L292) and Depressin (L214) with average values of 8.85 ± 0.06 Å and 7.09 ± 0.04 Å, respectively are related to the RMSD of the apo-enzyme 1REV (7.52 ± 0.05 Å) (reverse transcriptase enzyme without ligand), which indicates the same stability between the phytochemical compounds and the apo-enzyme.
The calculated RMSD between the phytochemical compounds aleuritolic acid (L12), crotoxide A (L135), crothalimene (L292), crotohaumanoxide (L140) and crotodichogamoin B (L216) is within 0.1 nm (1 Å) as compared with the protein HIV-RT (1REV), and the control drugs nevirapine, etravirine and delaviridine indicating only a very small change in the ligands position during the simulation period. This will tell us that these ligands were well stabilized in the protein binding site during the period of simulation, which will infer a more likely similar stability in biological system.
For a drug to bring about an agonistic or antagonistic effect to a protein it should first be stable within the protein. Achieving a given response by a drug requires that the drug stabilize specific conformational states of the receptor and thus specific conformational states in the protein binding pocket. So measuring RMSD of a drug candidate and comparing it with reference drugs is important to determine the stability of the drug within the protein. Therefore, the lower RMSD is, the better the model will be in comparison to the target structure.
The Root Mean Square Fluctuation (RMSF) was calculated to check the flexibility of amino acids residues during simulation. The RMSF values monitor the fluctuation of each amino acid residue as they interact with the ligand throughout a trajectory. The RMSF values of the phytochemicals were compared to the RMSF of the four FDA approved drugs.
Figure 2A Shows the RMSF plot of reference (1REV). The amino acid residues that showed low RMSF values remained rigid during simulation and the residues with higher RMSF values showed fluctuations during simulation. RMSF plot shows a minor fluctuation in the region of ~ 11 to 26 amino acids. There are major fluctuations seen in the regions of ~ 30 to 50, 70 to 80, 120 to 140, 230 to 270, 280 to 300. It showed that these amino acids residues were present on the cytoplasmic side of C terminal helix. The plot showed fluctuations at some positions ignoring the C-terminal helix while remaining protein showed less fluctuations.
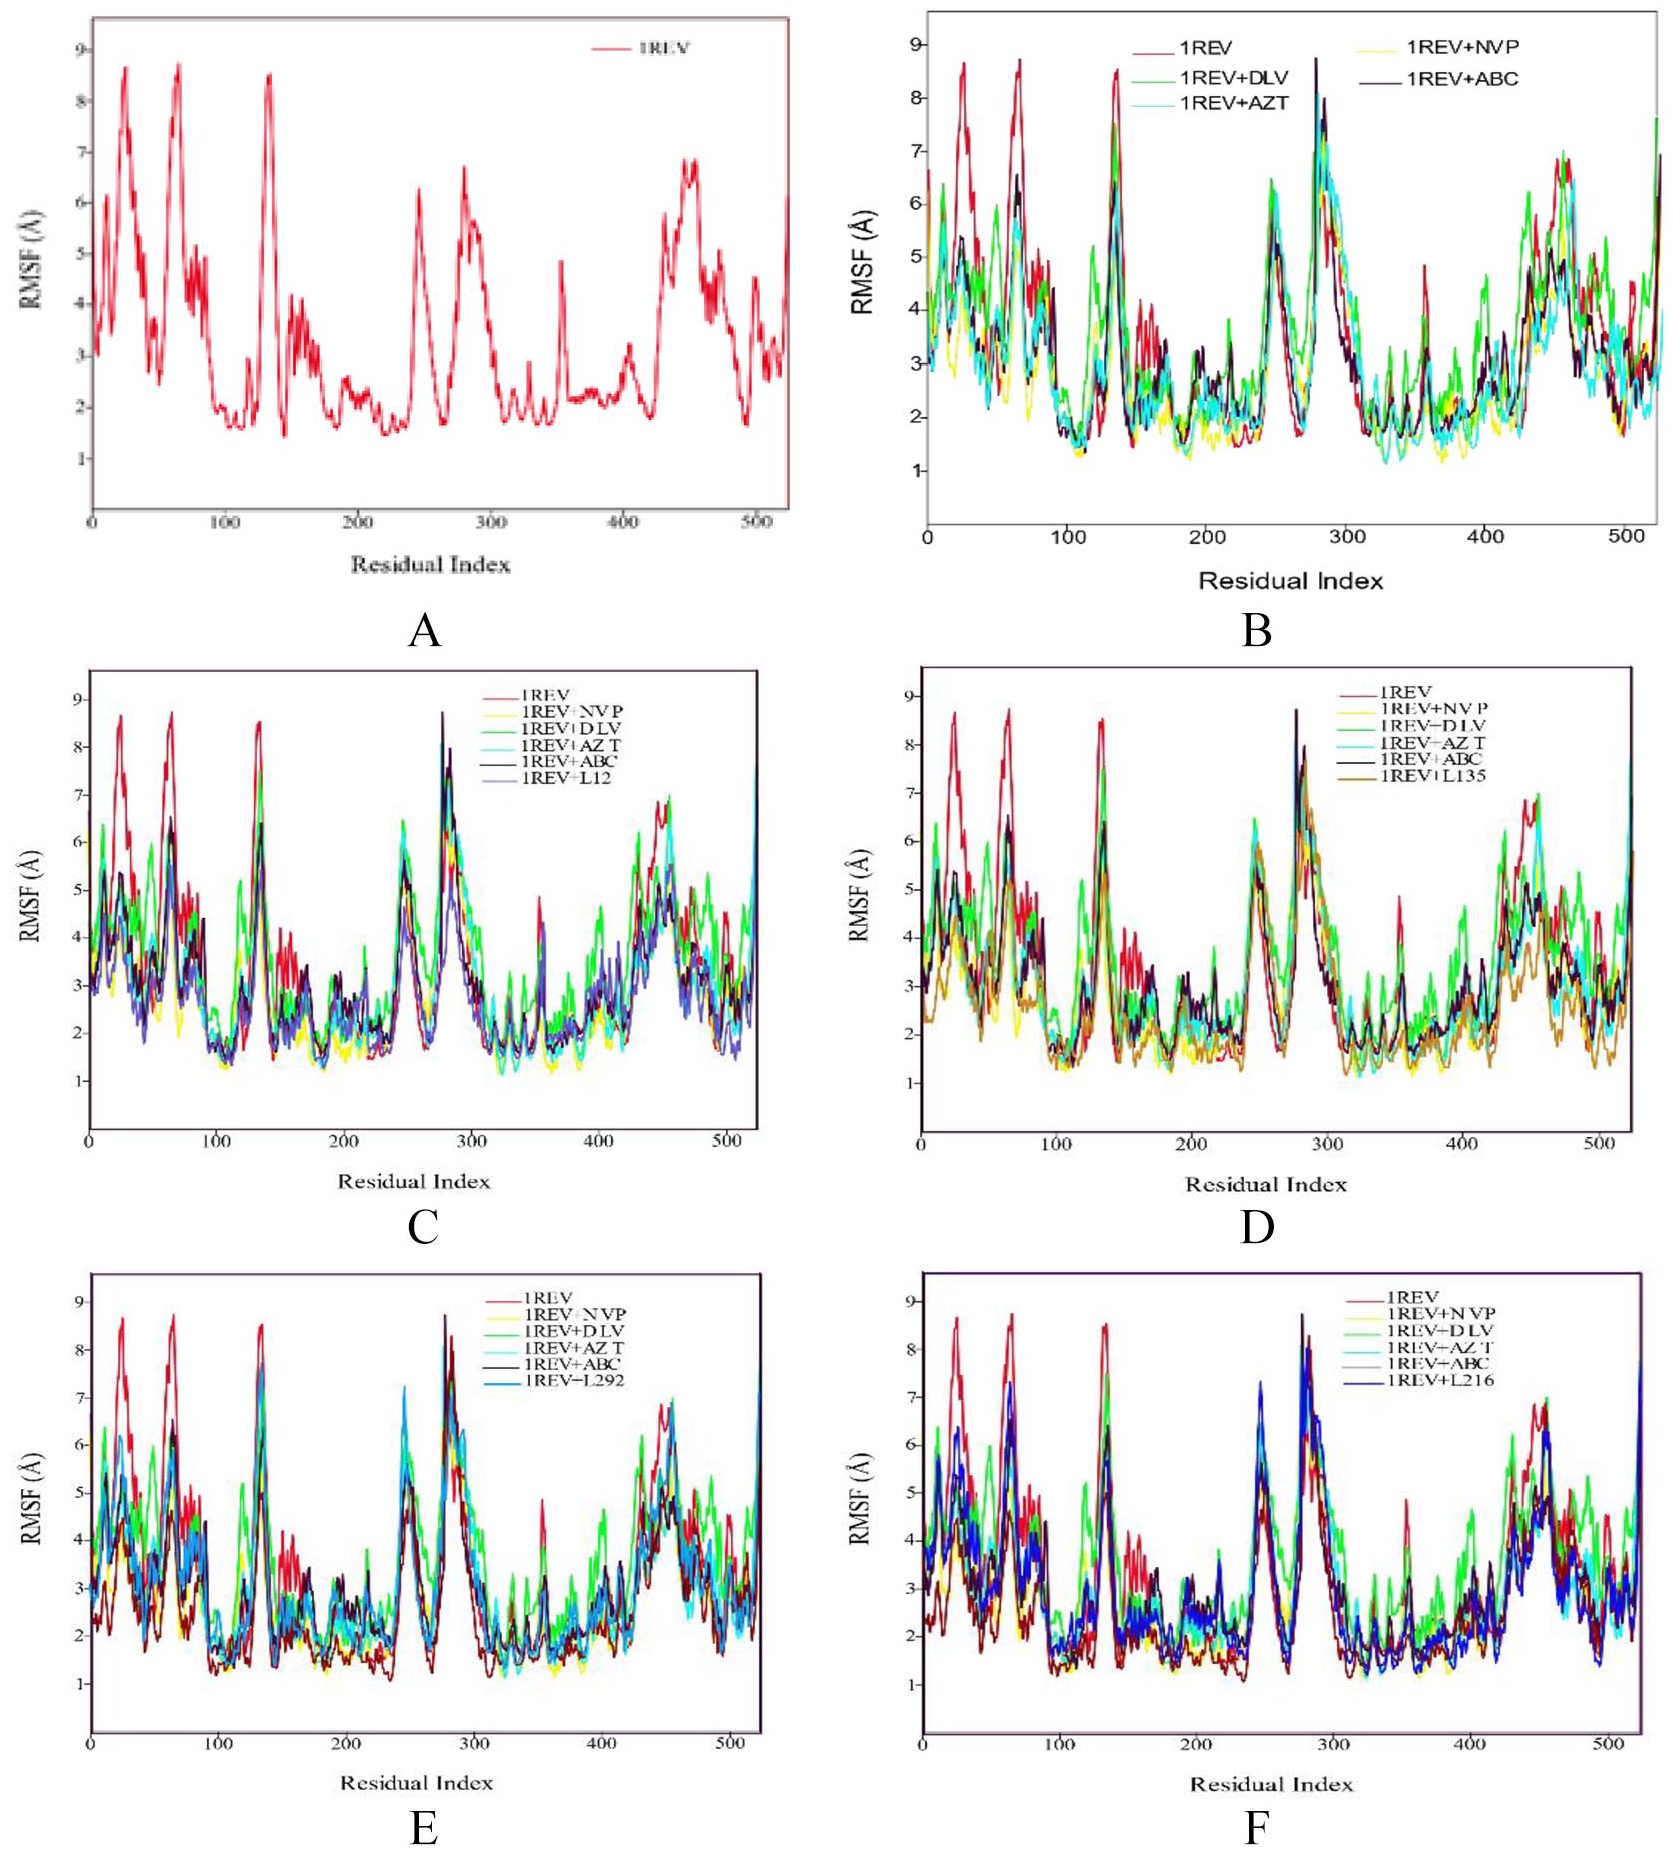
RMSF profile of protein backbone atoms of HIV1-RT 1REV (A), FDA approved antiretreoviral drugs delaviridine-DLV, Nevirapine NVP, Zidovudine AZT and Abacavir ABC drugs (B), Aleuritolic acid, L12 (C); Crotoxide A, L135 (D); Crothalimene A, L292 (E); Crotodichogamoin B, L216 (F), calculated over the course of 100 ns molecular dynamic simulation.
Figure 2B shows the RMSF plots of controls, that is, DLV, AZT, NVP, and ABC. This plot shows that the amino acid residues of protein behaved like reference 1REV during simulation. All the fluctuations are same as reference. A minor difference in the loop region (11 to 26 and 70 to 80) was observed. The overall plots showed similar trends. As shown in Figure 2C, RMSF plot of 1REV + L12 complex shows a similar trend like NVP control.
As depicted in Figure 2, the RMSF plot of 1REV + L135 showed that the amino acid residues have same trend in fluctuations as the control ABC, while 1REV + L292 and 1REV + L216 complexes showed related RMSF plot to NVP. RMSF is useful for characterizing local changes along the protein chain. On RMSF graphs, peaks indicate areas of the protein that fluctuate the most during the simulation.
The radius of gyration was calculated to examine the compactness of system. The high value of RoG shows the unfolding events during simulation. Figure 3A shows the RoG plot of reference (1REV). From the plot, it can be observed that the system remained compact till ~ 5 ns and then it showed distortion till 10 ns and then it gained stability. Protein showed some unfolding events during ~ 30 to 35 ns, 41 to 44 ns, but it was compact during remaining time. From the plot, it can be observed that, besides for some time, the protein remained compacted during 100 ns long simulation.
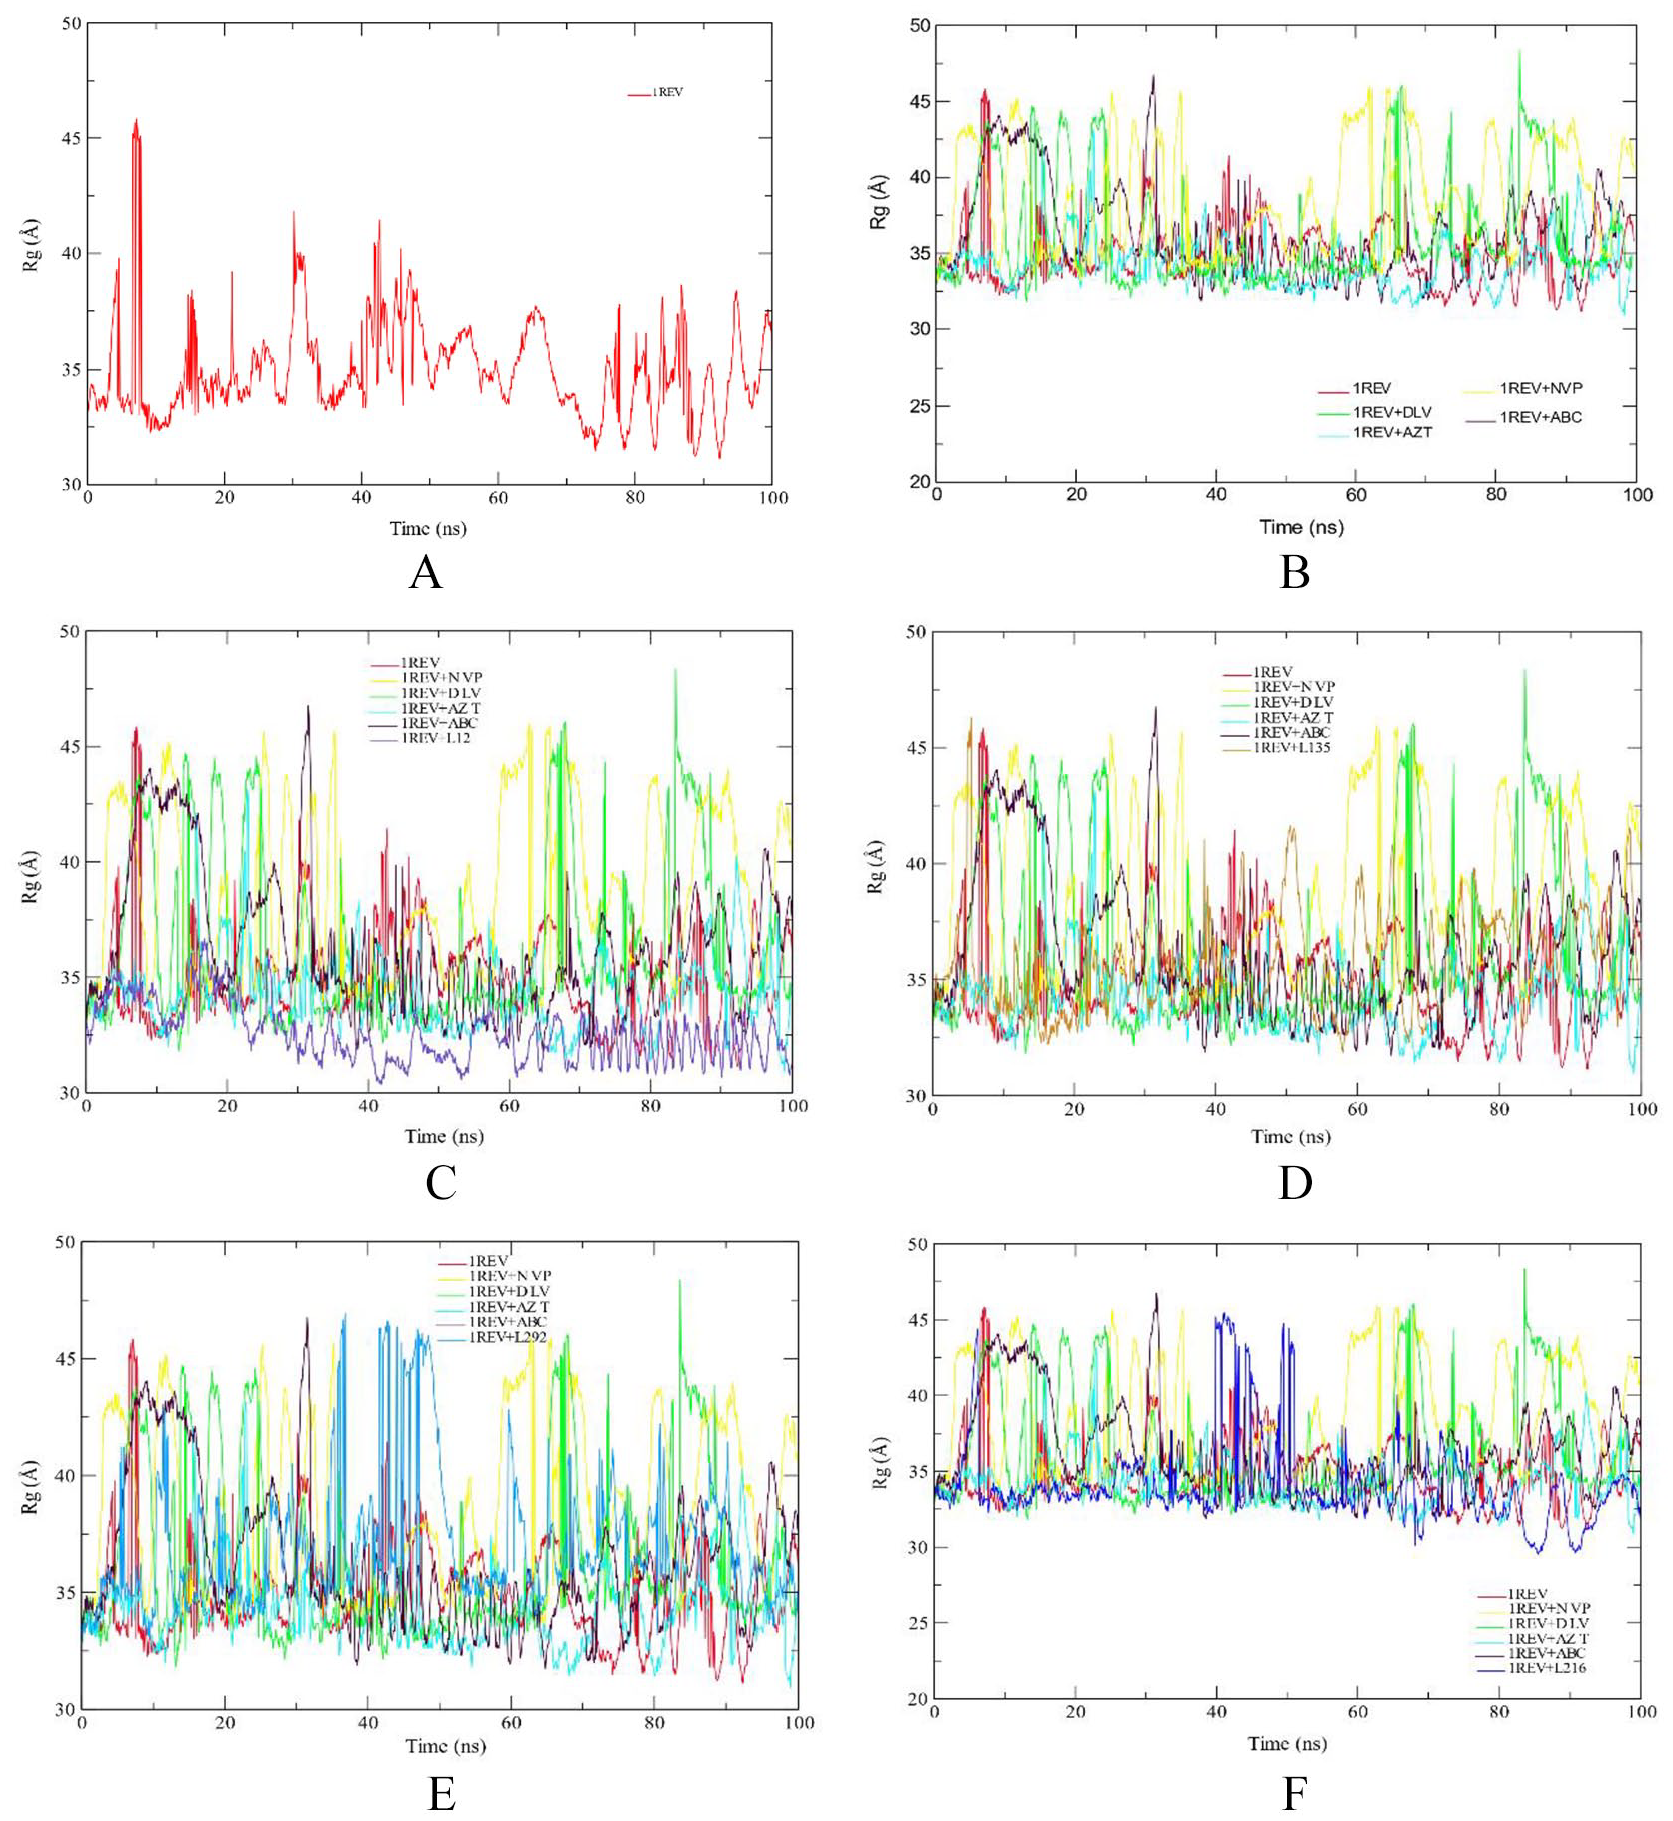
RoG profile of protein backbone atoms of HIV1-RT 1REV (A), FDA approved antiretreoviral drugs delaviridine-DLV, Nevirapine NVP, Zidovudine AZT and Abacavir ABC drugs (B), Aleuritolic acid, L12 (C); Crotoxide A, L135 (D); Crothalimene A, L292 (E); Crotodichogamoin B, L216 (F), calculated over the course of 100 ns molecular dynamic simulation.
The RoG values of crotodichogamoin B, L216 (34.19 Å), furocrotinsulolide A, L105 (34.12 Å) show similarity with average RoG values with zidovudine (34.29 Å) and the reverse transcriptase enzyme (34.97 Å). The RoG values of crothalimene B, L293 (39.57 Å), crothalimene A, L292 (37.03 Å), and crotohaumanoxide, L140 (37.83 Å) show similarity with the RoG of Nevirapine, NVP (38.45 Å).
Similarly, the RoG values of Crotonolide E, L104 (33.83 Å) and Cadalene, L436 (33.65 Å) show related RoG values with zidovudine (34.29 Å) while the RoG values of Crotoxide B, L136 (36.52 Å) and Crotoxide A, L135 (35.76 Å) is related with the RoG value of Delaviridine (36.42 Å) (Figure 3).
If a protein is stably folded, it will likely maintain a relatively steady value of RoG. If a protein unfolds, its RoG will change over time. The RoG is used to assess the overall dimensions and stabilities of the enzyme-ligand complex and is a function of the mass-weighted RMS distances of atoms from the center of mass.
Ligand-RT interaction with different amino acids
Active site prediction using MetaPocket 2.0 revealed presence of 35 amino acid residues in the ligand binding pocket of 1REV. To gain insight on the binding modes of studied phytochemicals as per the molecular docking results, visual poses inspection analysis was performed for the top 10 phytochemicals which exhibited highest binding energy in the active site pocket of the HIV-RT (PDBID:
The interactions of phytochemicals with key residues of HIV-1 reverse transcriptase demonstrated that the ligands interact with most of residues of the hydrophobic pocket as shown in Table S1 in Supplementary. Most of the residues involved on the hydrophobic interaction include ASN 265, GLU 378, GLY 352, HIS 96, ILE 382, SER 268, TRP 266.
In silico binding studies suggest that inhibitors that undergo hydrogen bonding with the main chain backbone of Lys101, LYS 350, LYS 353 and pi-pi interaction with the aromatic side chain of Trp229 improves the inhibitor selectivity for RT and thus helps in further drug design attempts to obtain potent phytochemical compounds or their derivatives. 43
Our results also demonstrate that most of the ligands formed hydrogen bonds with at least one key residue of the enzyme, the most represented are ARG 355, ARG 356, ARG 358, GLN 269, ILE 94, LEU 92, LYS 350, LYS 353, LYS 374, TYR 232 and the distances of hydrogen bonds vary between 2 Å and 4 Å.
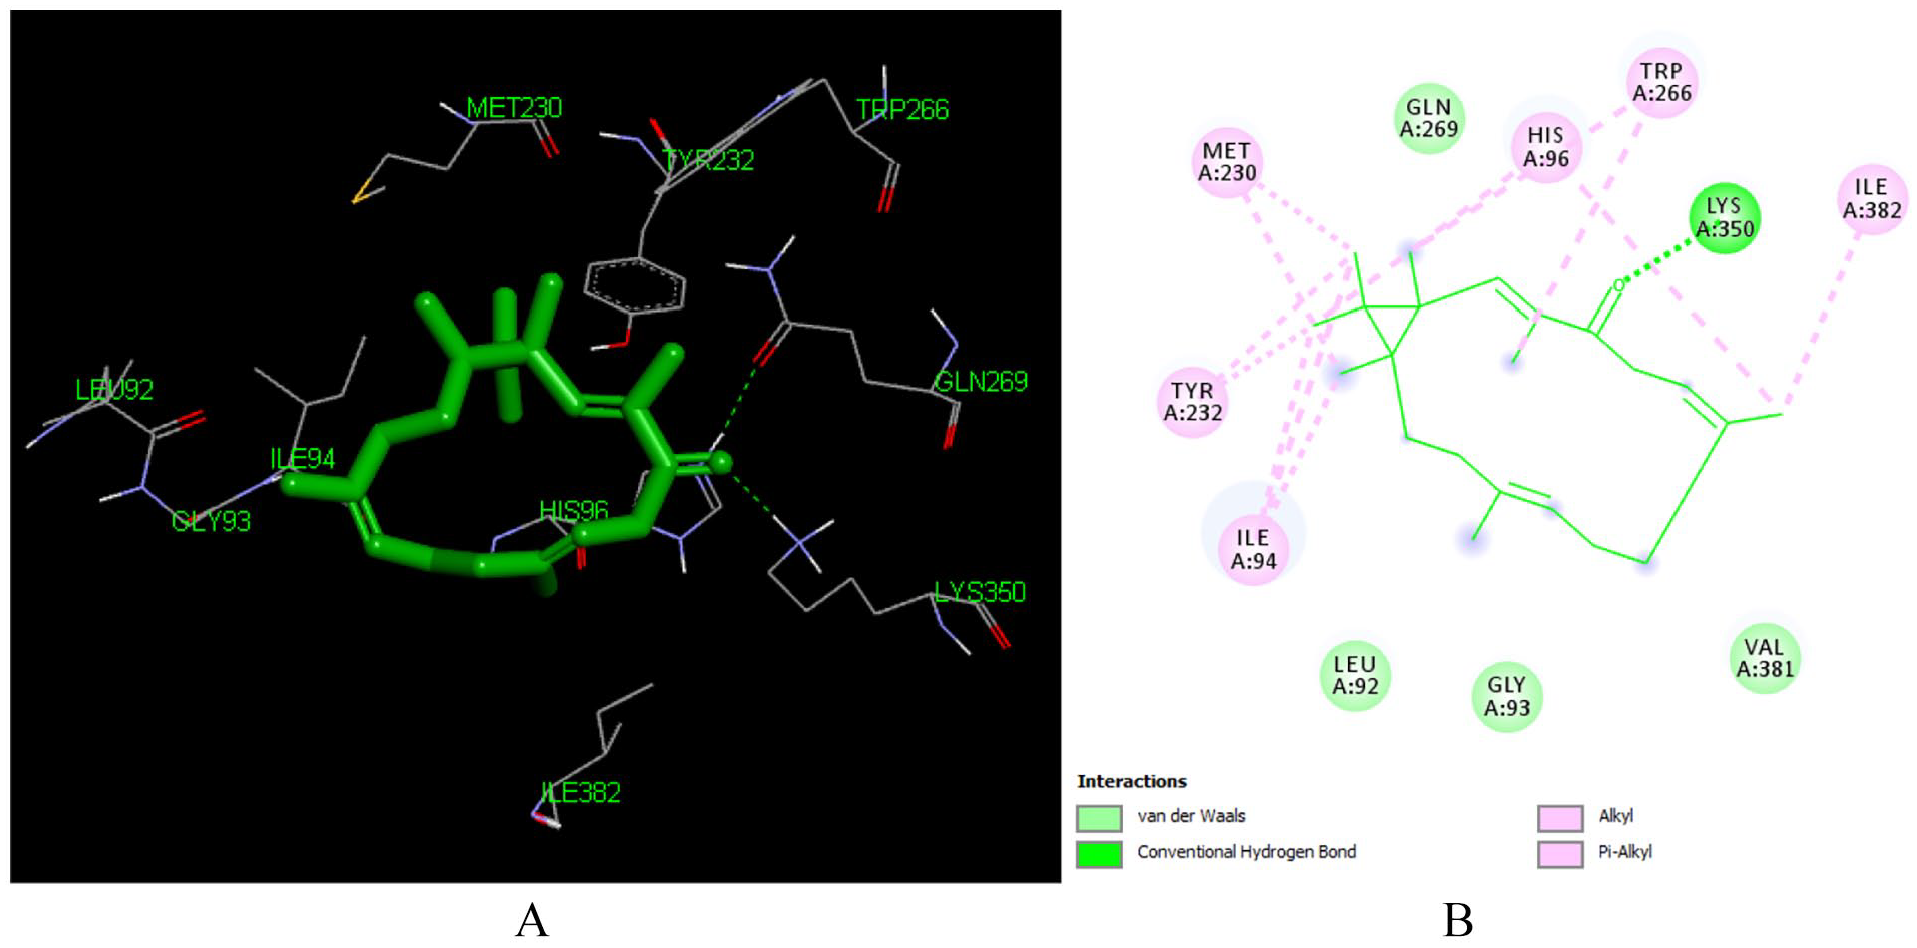
Interaction of aleuritolic acid (L12)
Aleuritolic acid (L12) is a pentacyclic triterpenoid isolated from the stem bark of C. megalocarpus, 44 C. dichogamus, C. psudopulchellus and C. oligandrus, 10 C. urucurana 45 and Jatropha isabellei. 46 Previous studies have proven anti-inflammatory, 47 antifilarial, 48 anti-HIV, 49 antinociceptive 50 and antioxidant 46 activity of aleuritolic acid its derivative acetyl aleuritolic acid.
Aleuritolic acid forms strong binding to the receptor with an estimated free binding energy of -8.48 kcal/mol and Ki of 0.61 uM making it superior in binding efficiency as compared to all docked compounds including the FDA-approved drugs.
This high binding energy of aleuritolic acid in the binding site is attributed to the Pi-alkyl interactions with ILE 382 and VAL 382, Pi-Sigma interactions with HIS 96 which involves charge transfer and helps in intercalating the compound in the binding site of the receptor (1REV) as shown in Figure 4. Furthermore, it displayed hydrophobic interactions with residues in the active binding site including – ASN 265, GLN 269, GLU 378, GLY 352, HIS 96, ILE 94, LYS 350, LYS 353, LYS 374, PRO 95, SER 268, TYR 232, TYR 339. Similar interacting amino acids were reported previously by Singh et al, 51 Seal et al. 52
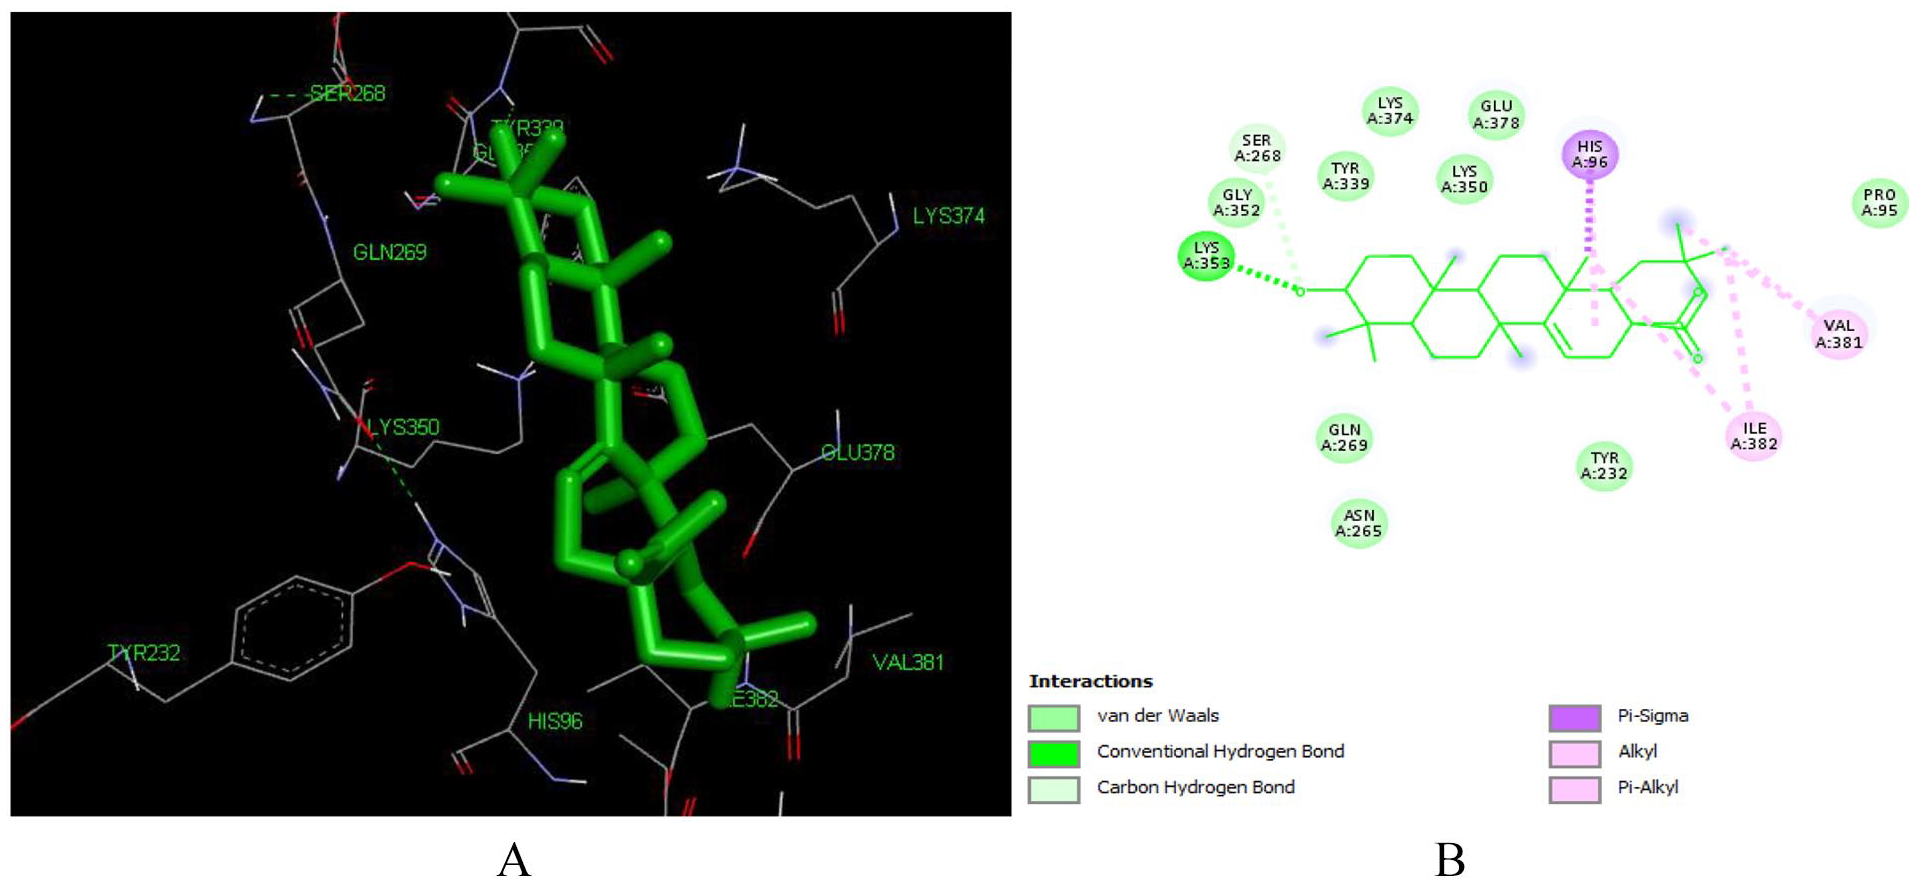
Docked poses of Aleuritolic acid (L12) with the active site region of reverse transcriptase (PDB ID: 1REV) enzyme (binding energy -8.48 kcal/mol) (A) 3D Aleuritolic acid with surrounding amino acids of 1REV; (B) 2D view of interaction type of Aleuritolic acid with surrounding amino acids of 1REV.
Aleuritolic acid forms two hydrogen bonds with LYS353 with an interatomic distance of 2.77 Å and 3.62 Å. The hydroxyl group at position 1 and the carboxyl acid moiety at the 11th position have a role in forming these hydrogen bonds. The in-silico predicted inhibition constant (Ki) value of aleuritolic acid was 0.61 uM (Table 1). Inhibition constant value is the half-maximum inhibition of an enzyme by a chemical compound and is used to estimate the potential of substrate/inhibitor in enhancing/inhibiting the biological and function of enzymes. 53 Compounds with an inhibition constant less than 100 mM are considered to be potential inhibitors whereas inhibition constant greater than 100 mM are non-potent inhibitors. 54 Based on this, aleuritolic acid could be a potential potent inhibitor of reverse transcriptase enzyme.
Interaction of crotoxide A (L135) and crotoxide B (L136)
Crotoxide A (L135) is a crotofolane-type diterpenoid isolated from leaves of C. dichogamus. 55 The compound has a very good docking pose with the reverse transcriptase enzyme (PDB: 1REV) with a binding energy of -7.73 kcal/mol and inhibitory constant of 2.11 μM making it the second most active compound to inhibit the enzyme. As depicted in Figure 5, corotoxide interacts with the following amino acid residues of the enzyme LEU 92, HIS 96, VAL 381, ILE 382, GLY 93, PRO 95, ILE 94, ILE 94. It forms two hydrogen bonding with ILE 94 (2.01 Å and 3.01 Å) and His 96 (3.05 Å). It also forms Pi-alkyl bond with VAL 381, PRO 95 and ILE 382, these interactions are playing a crucial role in the recognition of ligand by protein. 56
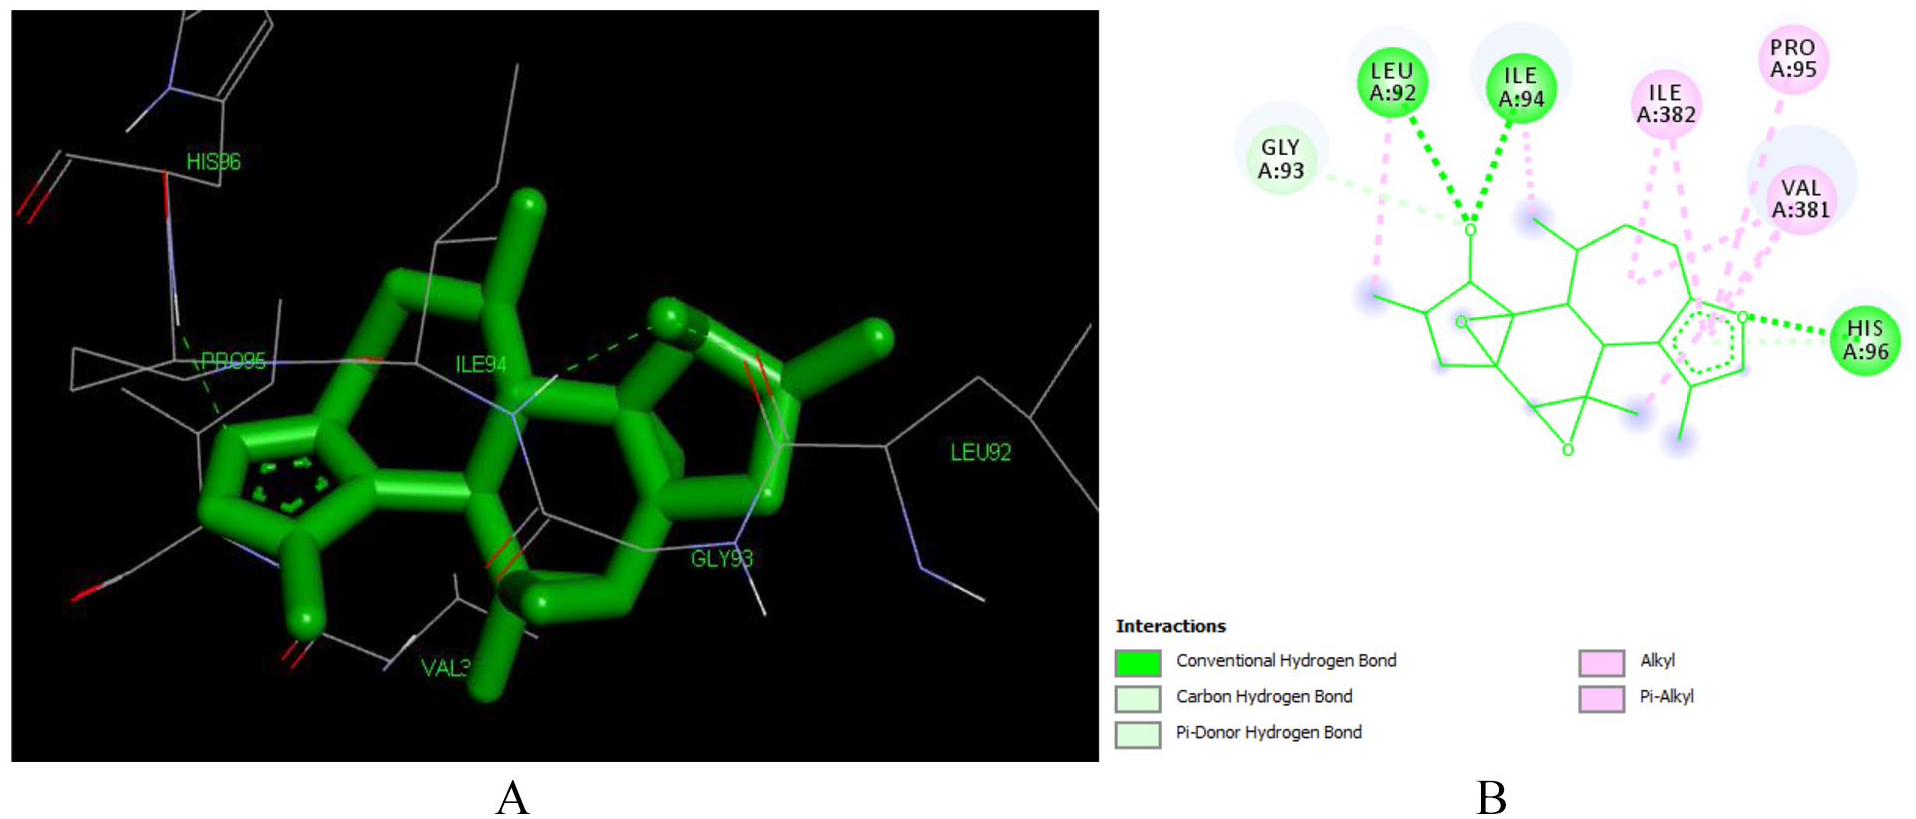
Docked poses of Crotoxide A (L135) with the active site region of reverse transcriptase (PDB ID: 1REV) enzyme (binding energy -7.73 kcal/mol) (A) 3D Crotoxide A (L135) with surrounding amino acids of 1REV; (B) 2D view of interaction type of Crotoxide A (L135) with surrounding amino acids of 1REV.
The furan ring is responsible for formation of the hydrogen bonding with HIS 96 and for the formation of Pi-Alkyl bond with ILE 382, PRO 95 and VAL382. The hydroxyl group at position 12 is responsible for the formation of hydrogen bonding with LEU 92 and ILE 94 (Table S1 in Supplementary).
From structure activity relationship of Crotoxide A and B, as shown in Figure 6, substitution of C-12 hydroxyl group by acetyl group like in the case of Crotoxide B will reduce the binding efficiency (binding energy -7.15 kcal/mol) of the ligand to the receptor. Hence Crotoxide A was ranked the second while Crotoxide B (L136) was ranked as the sixth most active compound to inhibit reverse transcriptase enzyme (PDB ID: 1REV) as shown in Table 1.
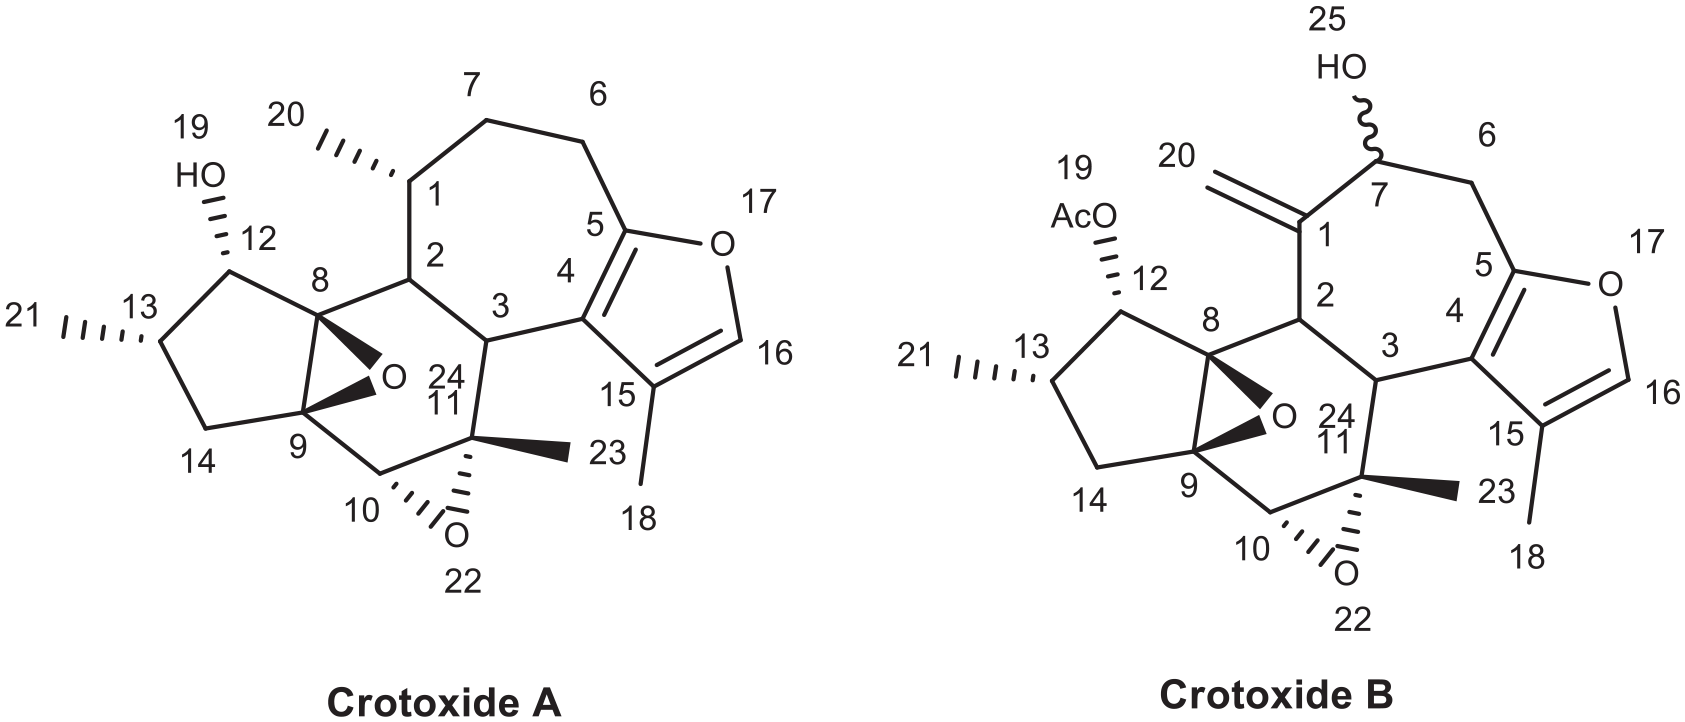
Chemical structure of Crotoxide A (L135) and Crotoxide B (L136).
Crotoxide B (L136) forms 7 hydrogen bonds with LYS 353, LYS 374 (3.43 Å), ALA 355, TYR 339 (2.79 Å), ASN 265 (2.87 Å), LYS 374 (3.43 Å) (Figure 7). The acetyl moiety at C-12, the hydroxyl group at C-7, and the furan ring has played crucial role in the hydrogen bond formation. This implies that Crotoxide B can be a potential hit compound that can inhibit reverse transcriptase enzyme.
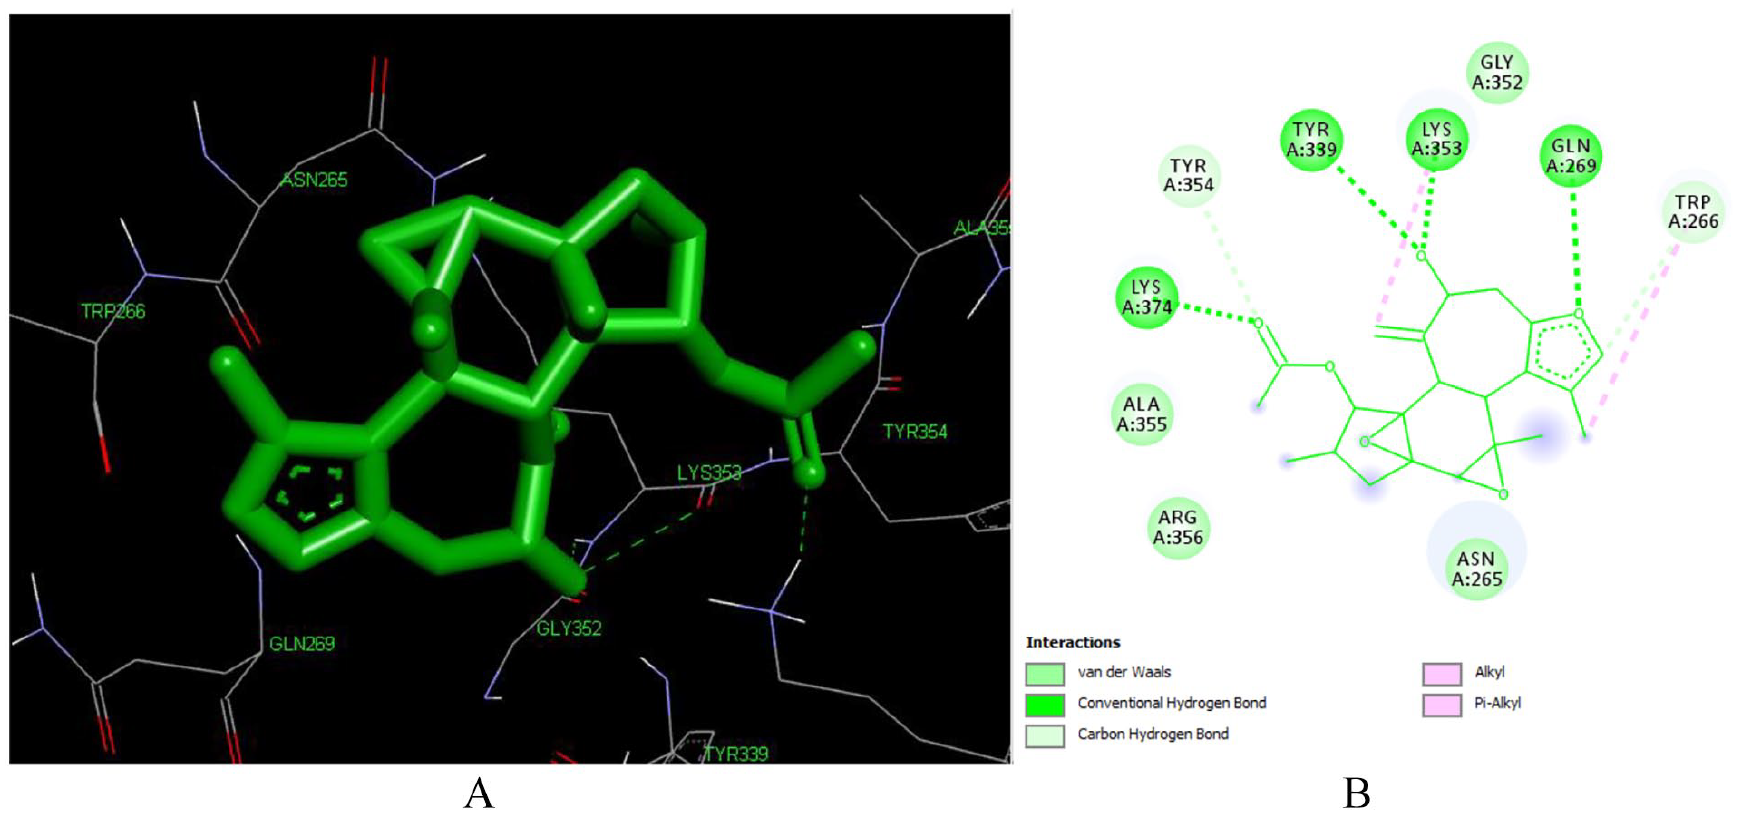
Docked poses of Crotoxide B (L136) with the active site region of reverse transcriptase (PDB ID: 1REV) enzyme (binding energy -7.15 kcal/mol) (A) 3D Crotoxide B (L136) with surrounding amino acids of 1REV; (B) 2D view of interaction type of Crotoxide A (L136) with surrounding amino acids of 1REV.
Interaction of crothalimene A (L292) and crothalimene B (L293)
Crothalimene A (L292) is a halimene type diterpenoid isolated from C. dichogamus. 10 It binds to the reverse transcriptase enzyme (PDB ID: 1REV) satisfactorily with a binding energy of -7.48 kcal/mol and Ki of 3.3 μM making it the third most active drug with the ability to inhibit the enzyme. As depicted in Figure 8, crothalimene A (L292) forms two hydrogen bonds with Ile 382 (2.31 Å) and Tyr 232 (2.69 Å). The hydrogen acceptor groups at position number 2 and 17 are responsible for formation of these hydrogen bonds. It also forms Pi-alkyl interactions with HIS 96, ILE 94, VAL 381, and PRO95 which is important for conformational stability of the compound and also for recognition of ligand by protein. 56 It also displayed a number of hydrophobic contacts with 10 amino acid residues HIS 96 (3.30 Å), VAL 381 (3.56 Å), ILE 382 (3.60 Å), ILE 94 (2.94 Å), ILE 382 (2.31 Å), HIS 96 (5.29 Å), TYR 232 (2.69 Å), PRO 95, LEU 92, GLY 93. The naphthalene moiety could be responsible for these hydrophobic contacts.
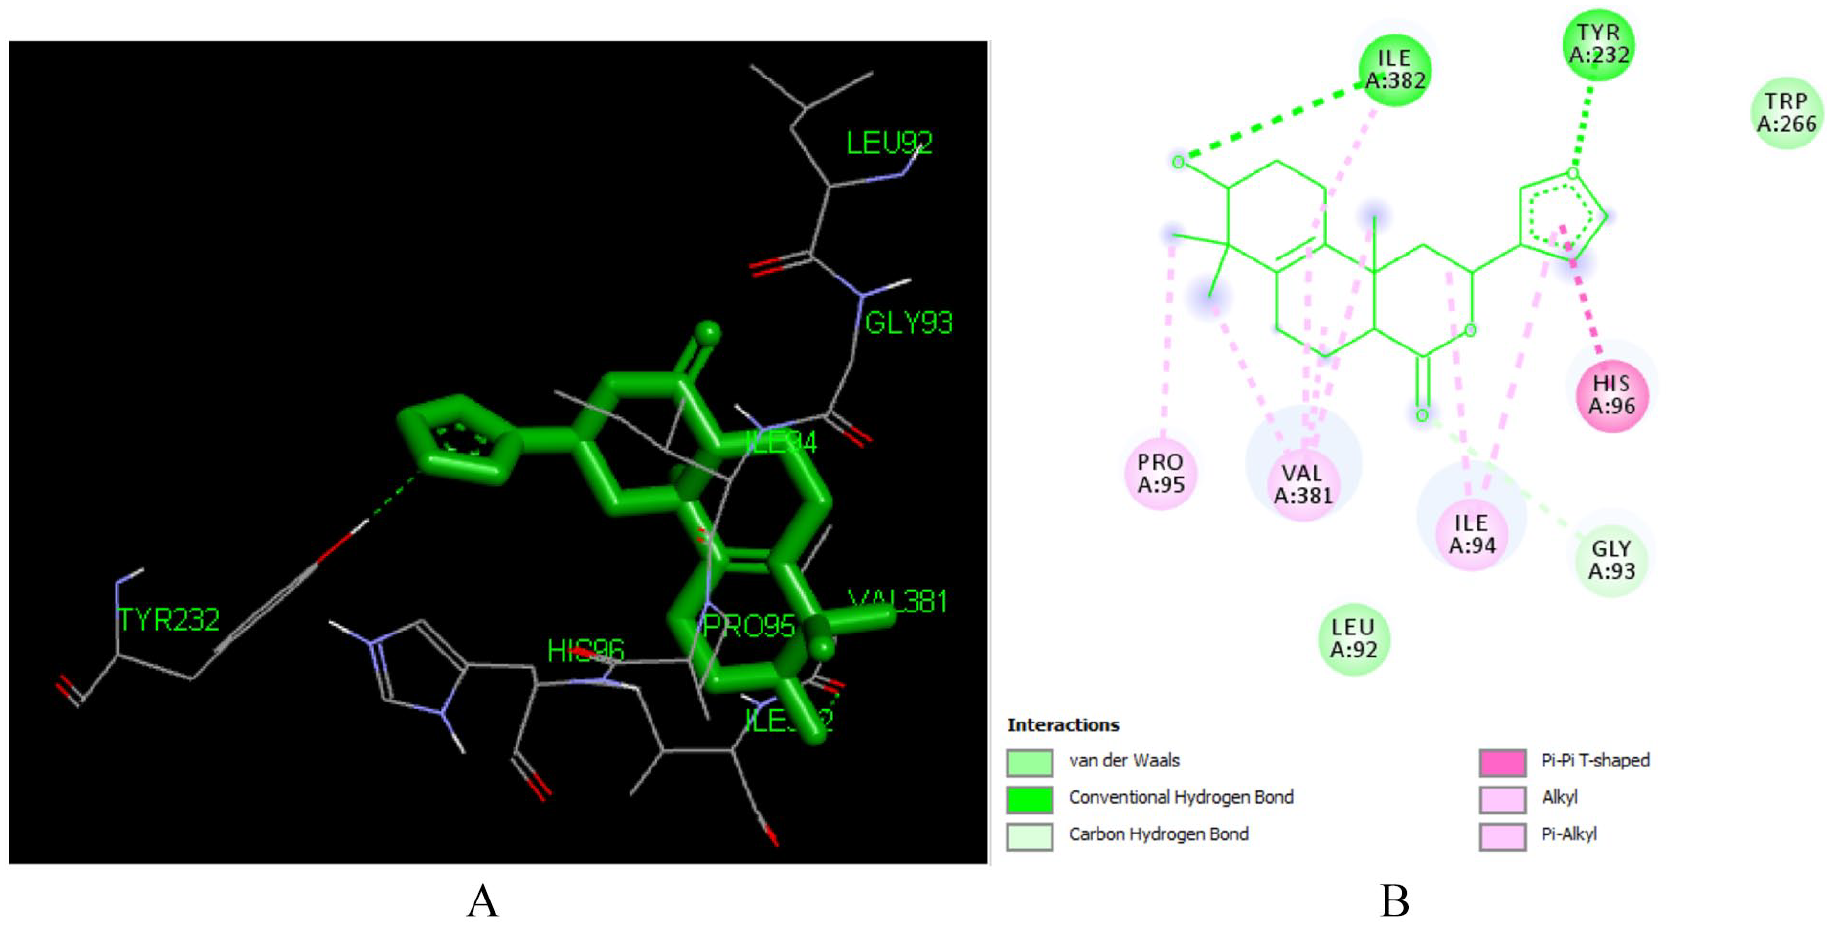
Docked poses of Crothalimene A (L292) with the active site region of reverse transcriptase (PDB ID: 1REV) enzyme (binding energy -7.48 kcal/mol) (A) 3D Crothalimene A (L292) with surrounding amino acids of 1REV; (B) 2D view of interaction type of Crothalimene A (L292) with surrounding amino acids of 1REV.
Crotohalmane A (L292) and crothalimene B (L293) have related chemical structures as depicted in Figure 9. Their structural difference lies in the presence of additional tetrahydro 4 H pyran-2-one ring in the structure of Crothalimene. The tetrahydro 4 H pyran-2-one ring has a role in forming strong binding in the receptor pocket. The structural difference has impacted the binding energy, inhibitory constant and the different bonds created between the compound and the amino acids within the active enzyme site. The binding energy and inhibition constant for crothalimene B was -6.92 kcal/mol and 11.92 μM, respectively.
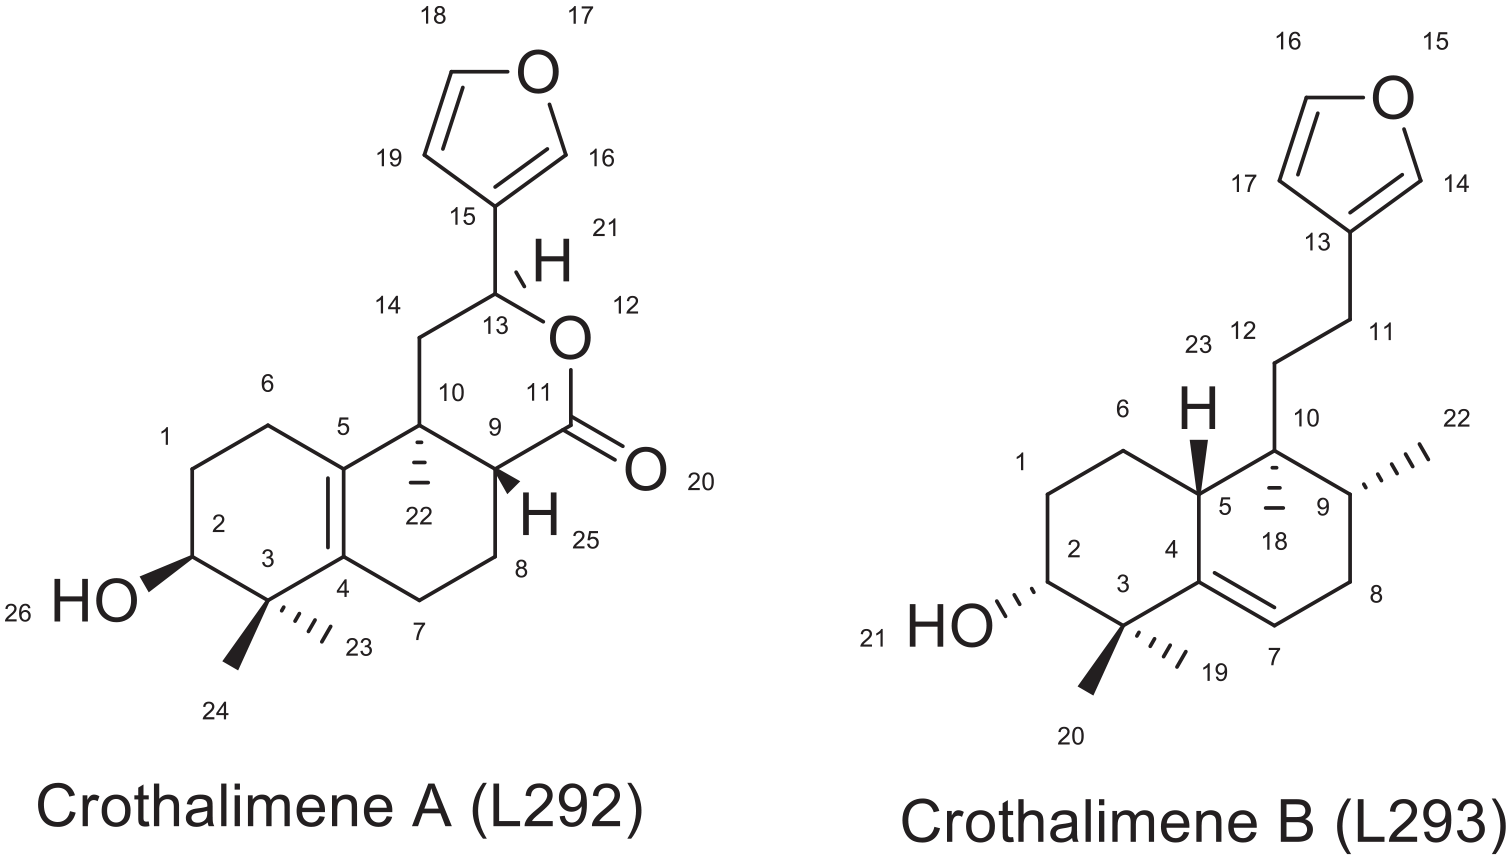
Structure of Crothalimene A and Crothalimene B.
Crothalimene B forms hydrophobic contacts with the following amino acids ILE 94, LYS 350, GLU 378, HIS 96, ILE 94, PRO 95, GLN 269, and TYR 232 in the active site of the reverse transcriptase (PDB ID: 1 REV). It also forms Pi-alkyl bonding with ILE 94, ILE 382 and VAL 381. The pyran and naphthalene rings are responsible for this binding and contribute for the stability of the conformation.
As depicted in Figures 8 and 10, C-2 of both compounds is involved in hydrogen bonding with ILE 382 and LYS 350 respectively for crothalimene A and B. The furan moiety in crothalimene B has no role in formation of the hydrogen bond but is engaged in the Pi-alkyl bonding with ILE 382 and VAL 381 which contributes for receptor fitting and stabilization.
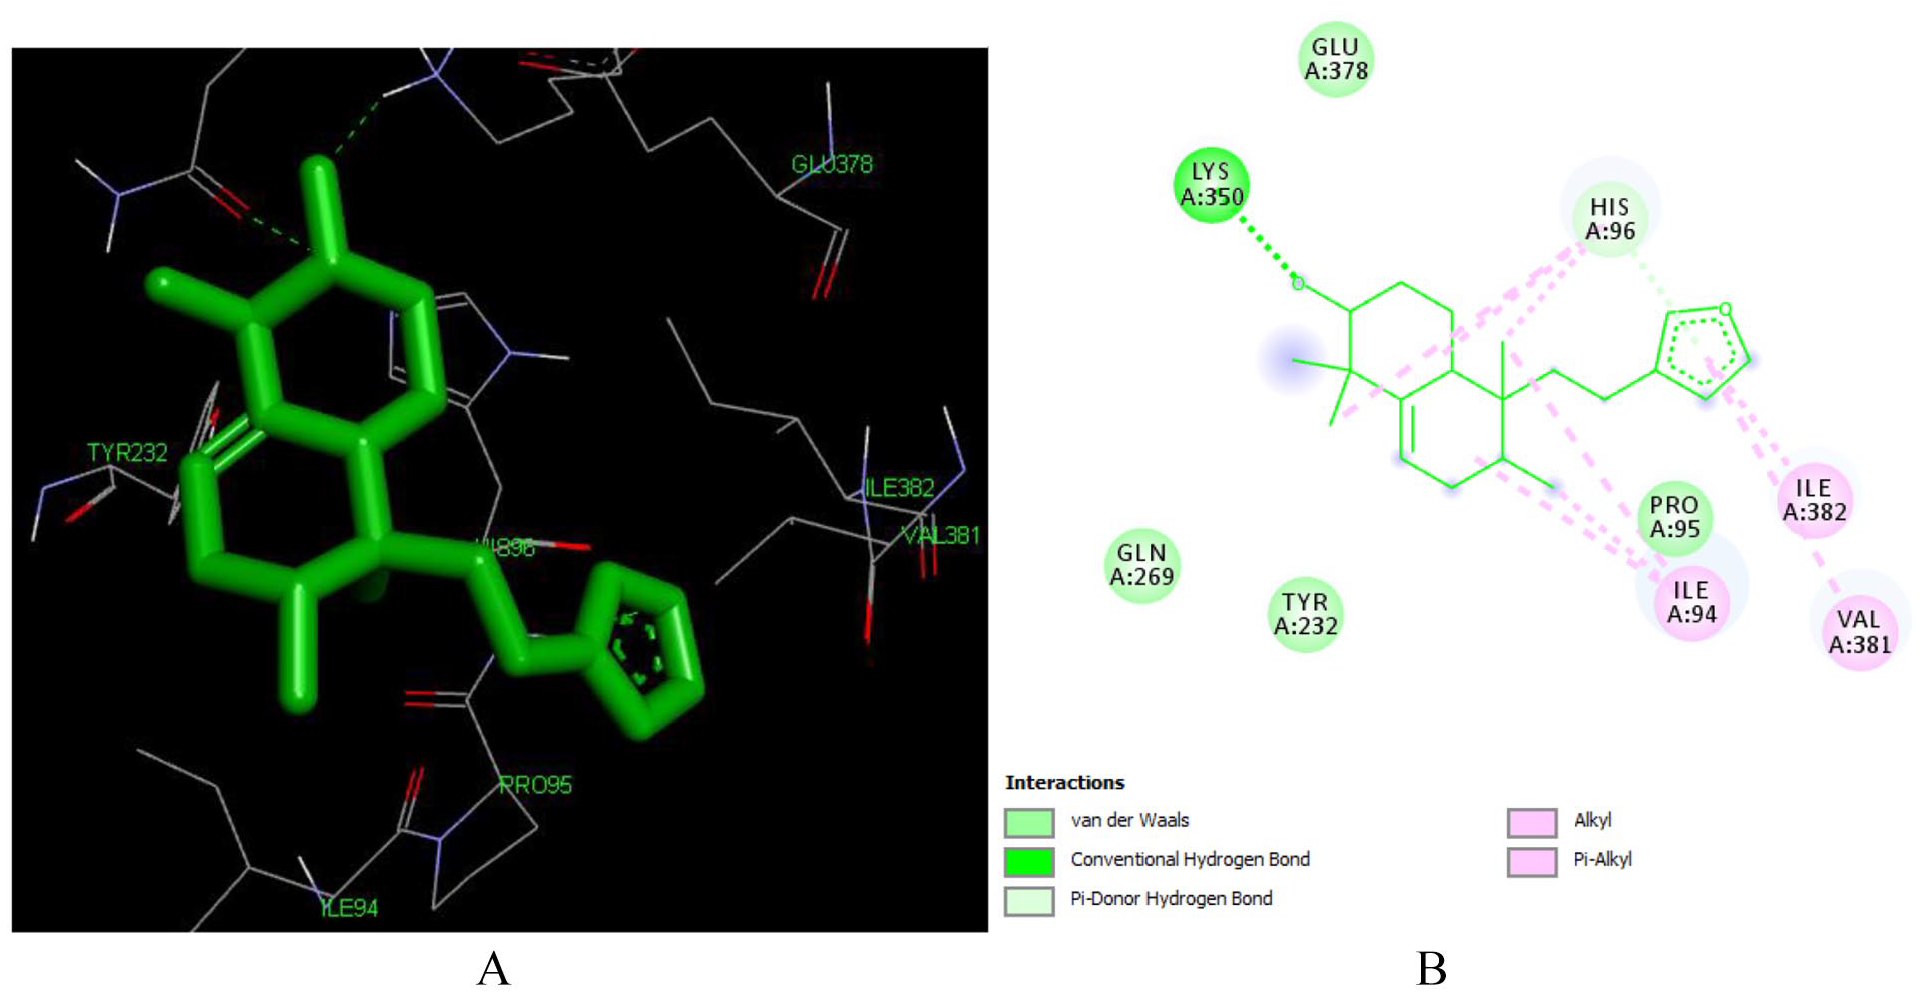
Docked poses of Crothalimene B (L293) with the active site region of reverse transcriptase (PDB ID: 1REV) enzyme (binding energy -7.48 kcal/mol) (A) 3D Crothalimene B (L293) with surrounding amino acids of 1REV; (B) 2D view of interaction type Crothalimene B (L293) with surrounding amino acids of 1REV.
Interaction of crotodichogamin A (L215) and crotodichogamoin B (L216)
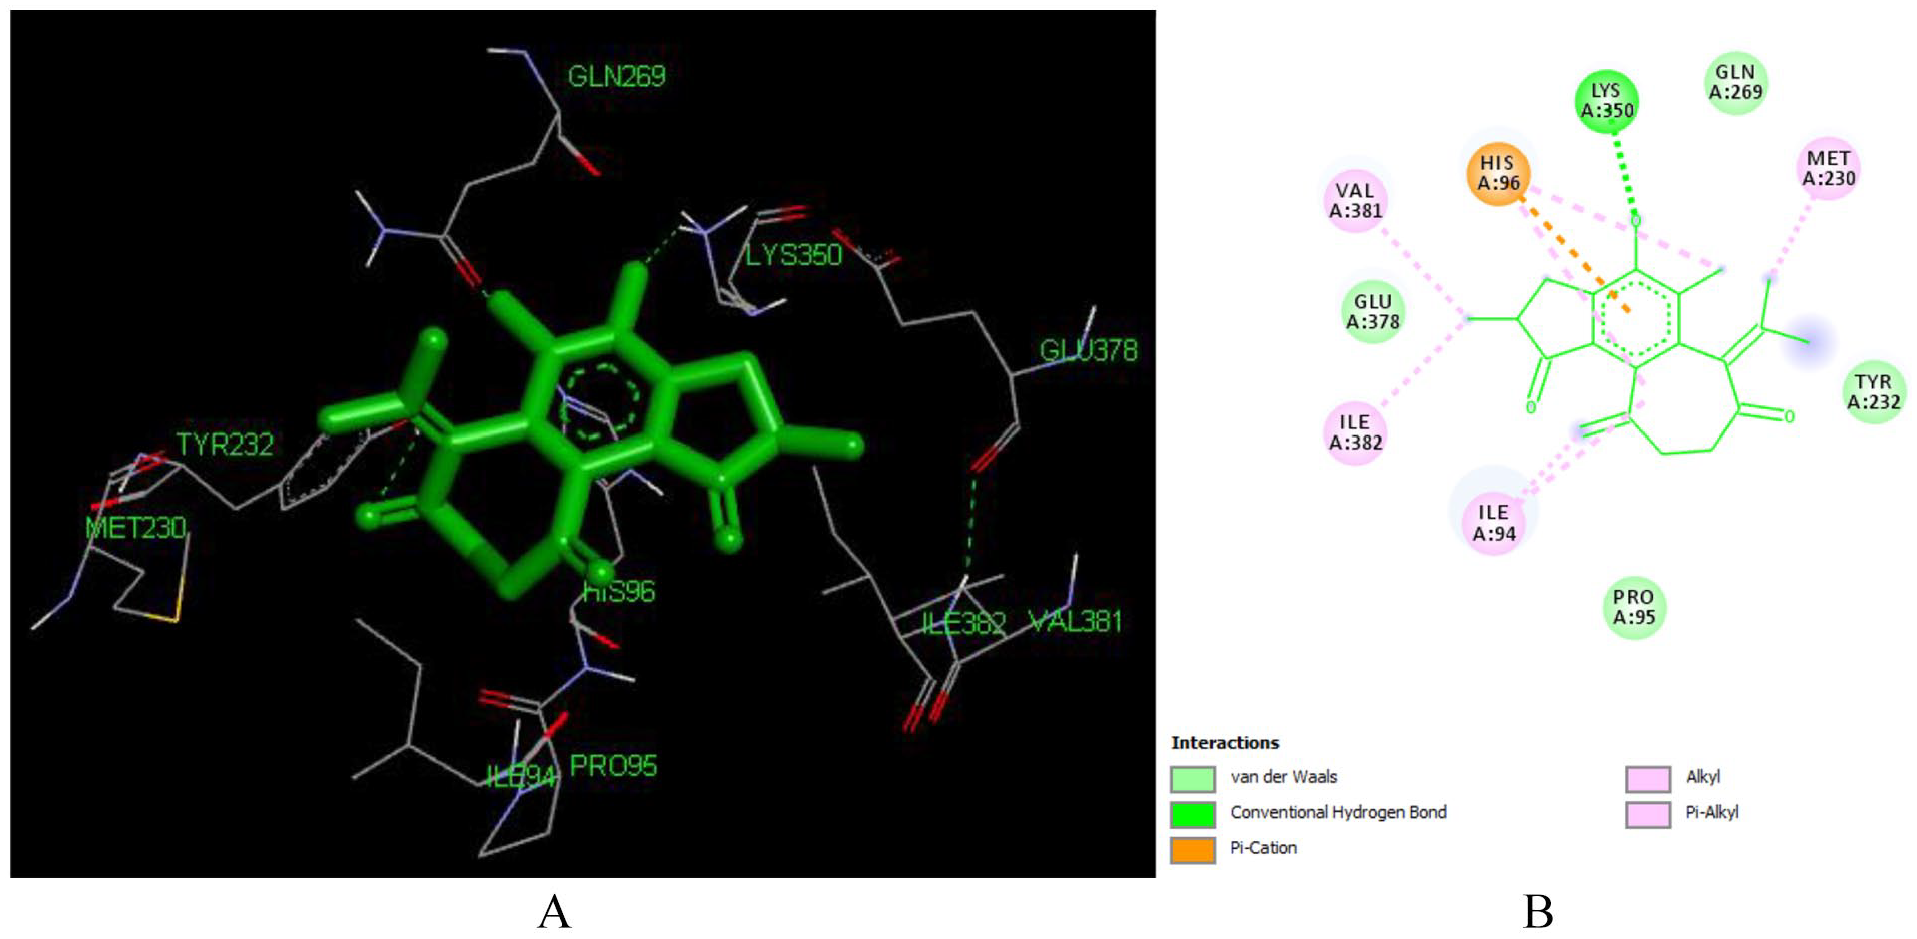
Docked poses of Crotodichogamoin B (L216) with the active site region of reverse transcriptase (PDB ID: 1REV) enzyme (binding energy -7.42 kcal/mol) (A) 3D Crotodichogamoin B (L216) with surrounding amino acids of 1REV; (B) 2D view of interaction type Crotodichogamoin B (L216) with surrounding amino acids of 1REV.
Crotodichogamin A (L215) has a lower binding efficiency as compared to crotodichogamin B. Its binding energy and inhibitor constant is -6.9 kcal/mol and 11.23 uM respectively ranking as the 10th active compound to inhibit the reverse transcriptase (PDB ID: 1REV) enzyme. As depicted in Figure 11, it forms 8 hydrophobic contacts with ILE 94, MET 230, TRP 266, GLN 269, GLU 378, LYS 350, HIS 96, and TYR 232 amino acids in the active site of the enzyme. It also forms hydrogen bonding with TYR 232 (1.78 Å), HIS 96 (4.34 Å) and LYS 350. Crotodichogamin A forms Pi-cation interaction with HIS 96 and Pi-alkyl interactions ILE 94, ILE 382, TRP 266.
The two epoxide moieties play a role in forming hydrogen bond with Tyr 232, while the furan ring is engaged in hydrogen bonding with LYS 350, and formation of HIS 96. As shown in Figure 12, the difference in binding energy among crotodichogamin A and B could be attributed to the presence of cycloheptane ring in crotodichogamin B which increases its hydrophobicity and receptor affinity which is displayed by the pi-alkyl bond formed with ILE 94 and MET230
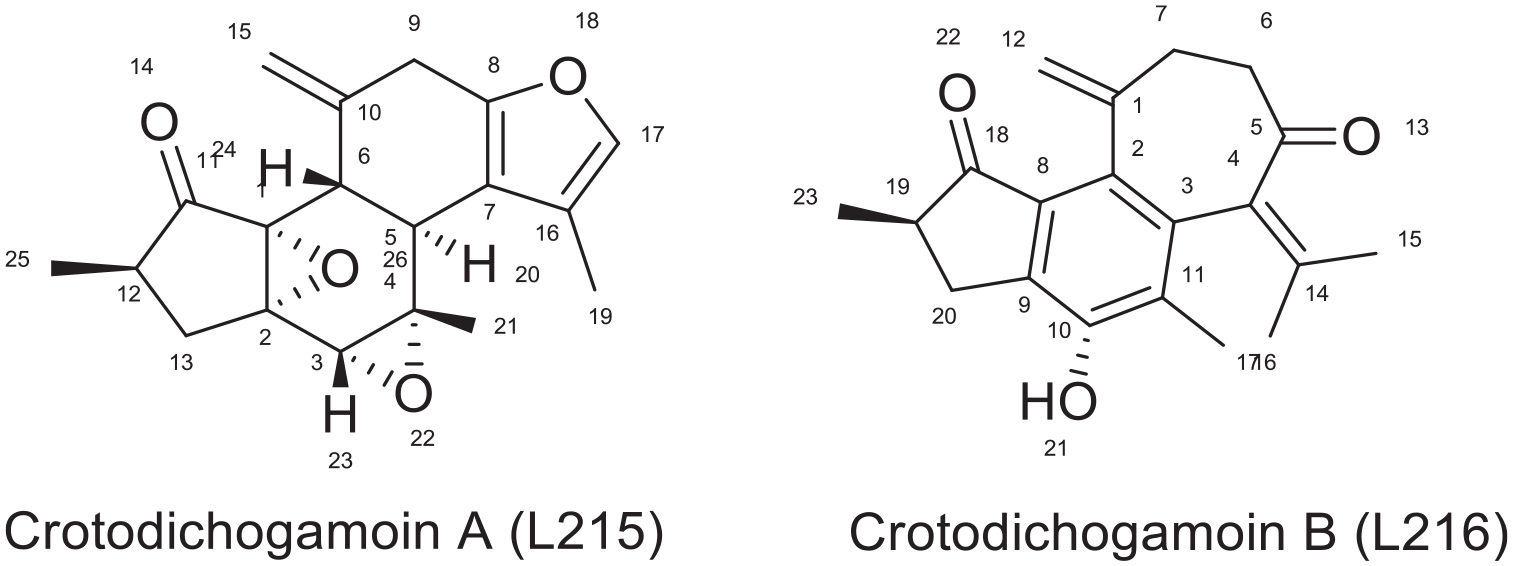
Chemical structures of Crotodichogamin A and B.
Interaction of crotonolide E (L104) with reverse transcriptase enzyme (PDB ID: 1REV)
Crotonolide E (L104) is a clerodane type diterpenoid isolated from the roots of C. dichogamus and C. megalocarpus.49,57 As visualized in Figure 13, it forms six hydrophobic contacts ILE 94 (3.29 Å), ILE 94 (3.52 Å), HIS 96 (2.94 Å), TRP 266 (3.82 Å), PRO 95, GLU 378, and one hydrogen bond with TYR 232 (2.79 Å). The compound also forms Pi-alkyl bond with TRP 266, ILE 382, PRO 95. Crotonolide E has free binding energy of -7.31 kcal/mol and inhibition constant of 4.42 μM with reverse transcriptase (PDB ID: 1REV) enzyme.
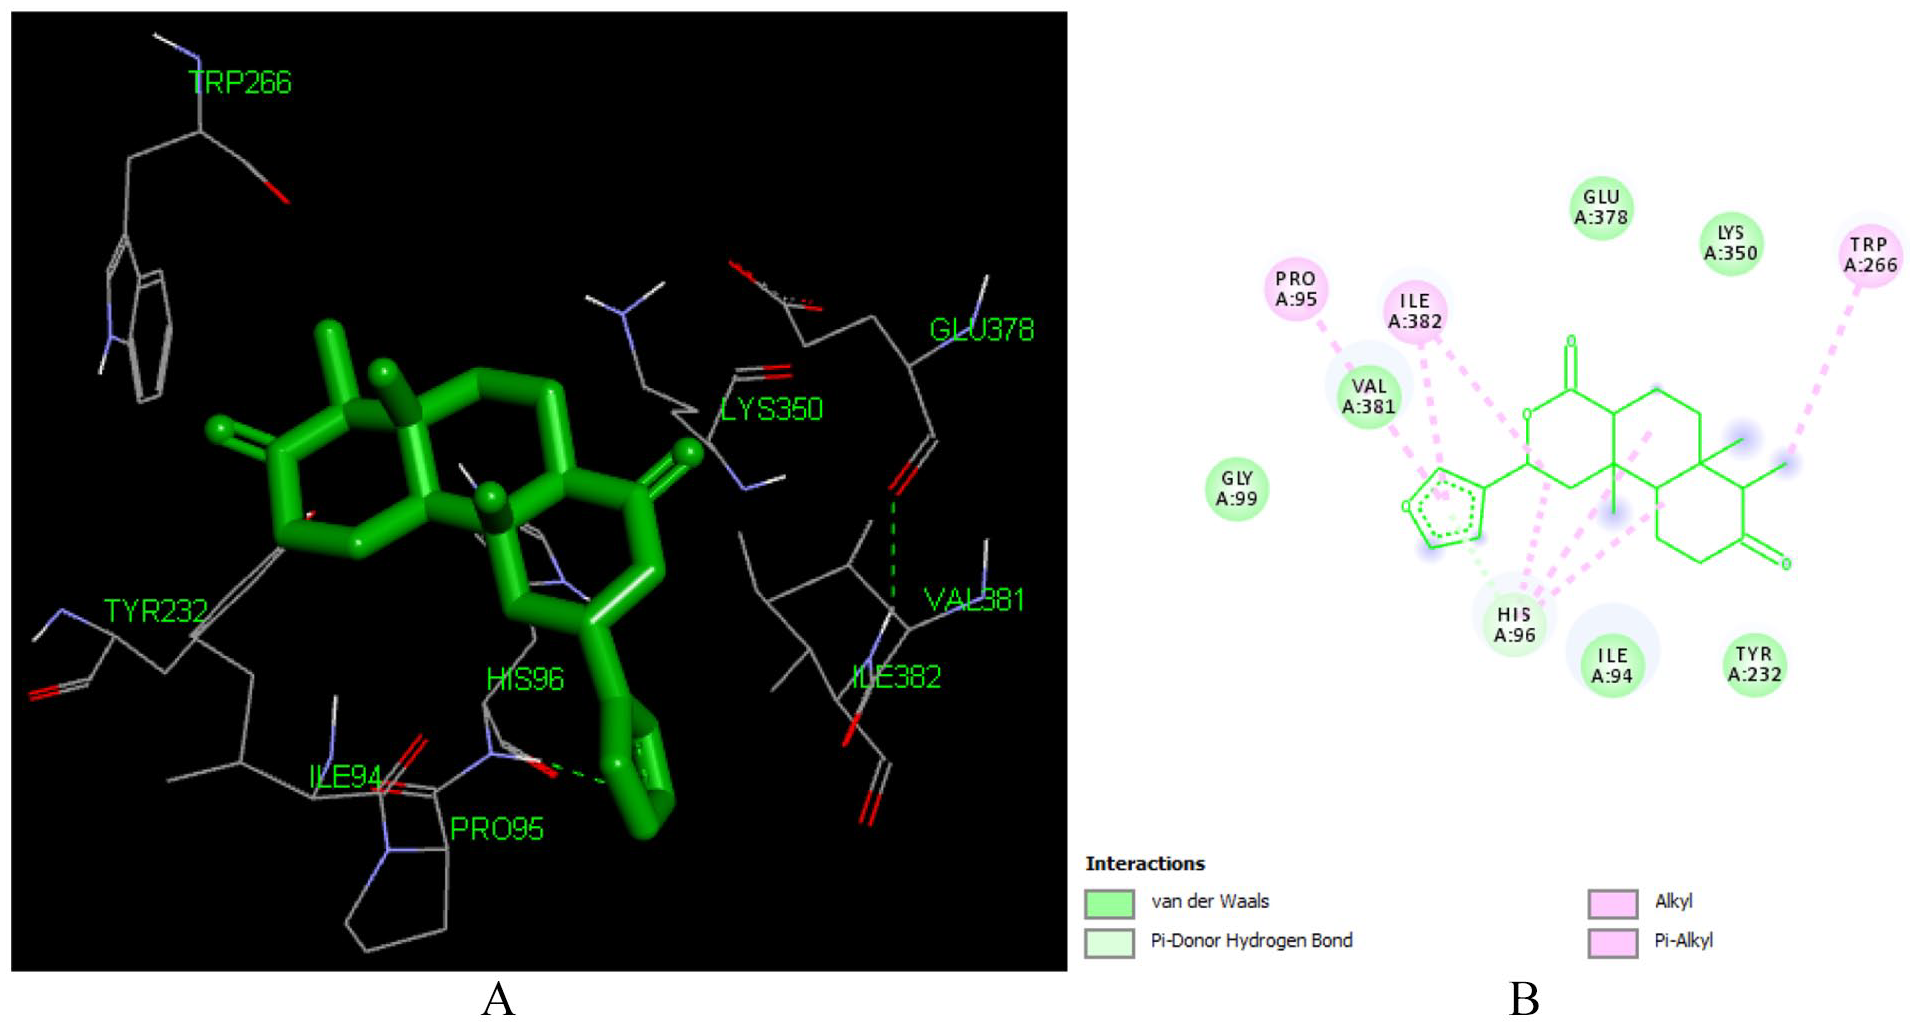
Docked poses of Crotonolide E (L104) with the active site region of reverse transcriptase (PDB ID: 1REV) enzyme (binding energy −7.31 kcal/mol) (A) 3D Crotonolide E (L104) with surrounding amino acids of 1REV; (B) 2D view of interaction type Crotonolide E (L104) with surrounding amino acids of 1REV.
Interaction of furocrotinsulolide A (L105) with reverse transcriptase enzyme (PDB ID: 1REV)
Furocrotinsulolide A (L 105) is a clerodane type diterpenoid isolated from the roots of C. dichogamus, C. megalocarpus and C. insularis.57,58 It forms hydrogen bonding with LYS 353 (1.94 Å), LYS 353 (2.65 Å), LYS 374 (1.95 Å) in the active site of the enzyme. The hydroxyl groups in C-2 and C-3 are responsible for the formation of the hydrogen bond. Our computations studies indicated that the binding energy of Furocrotinsulolide A with the receptor is -6.92 kcal/mol (Figure 14).
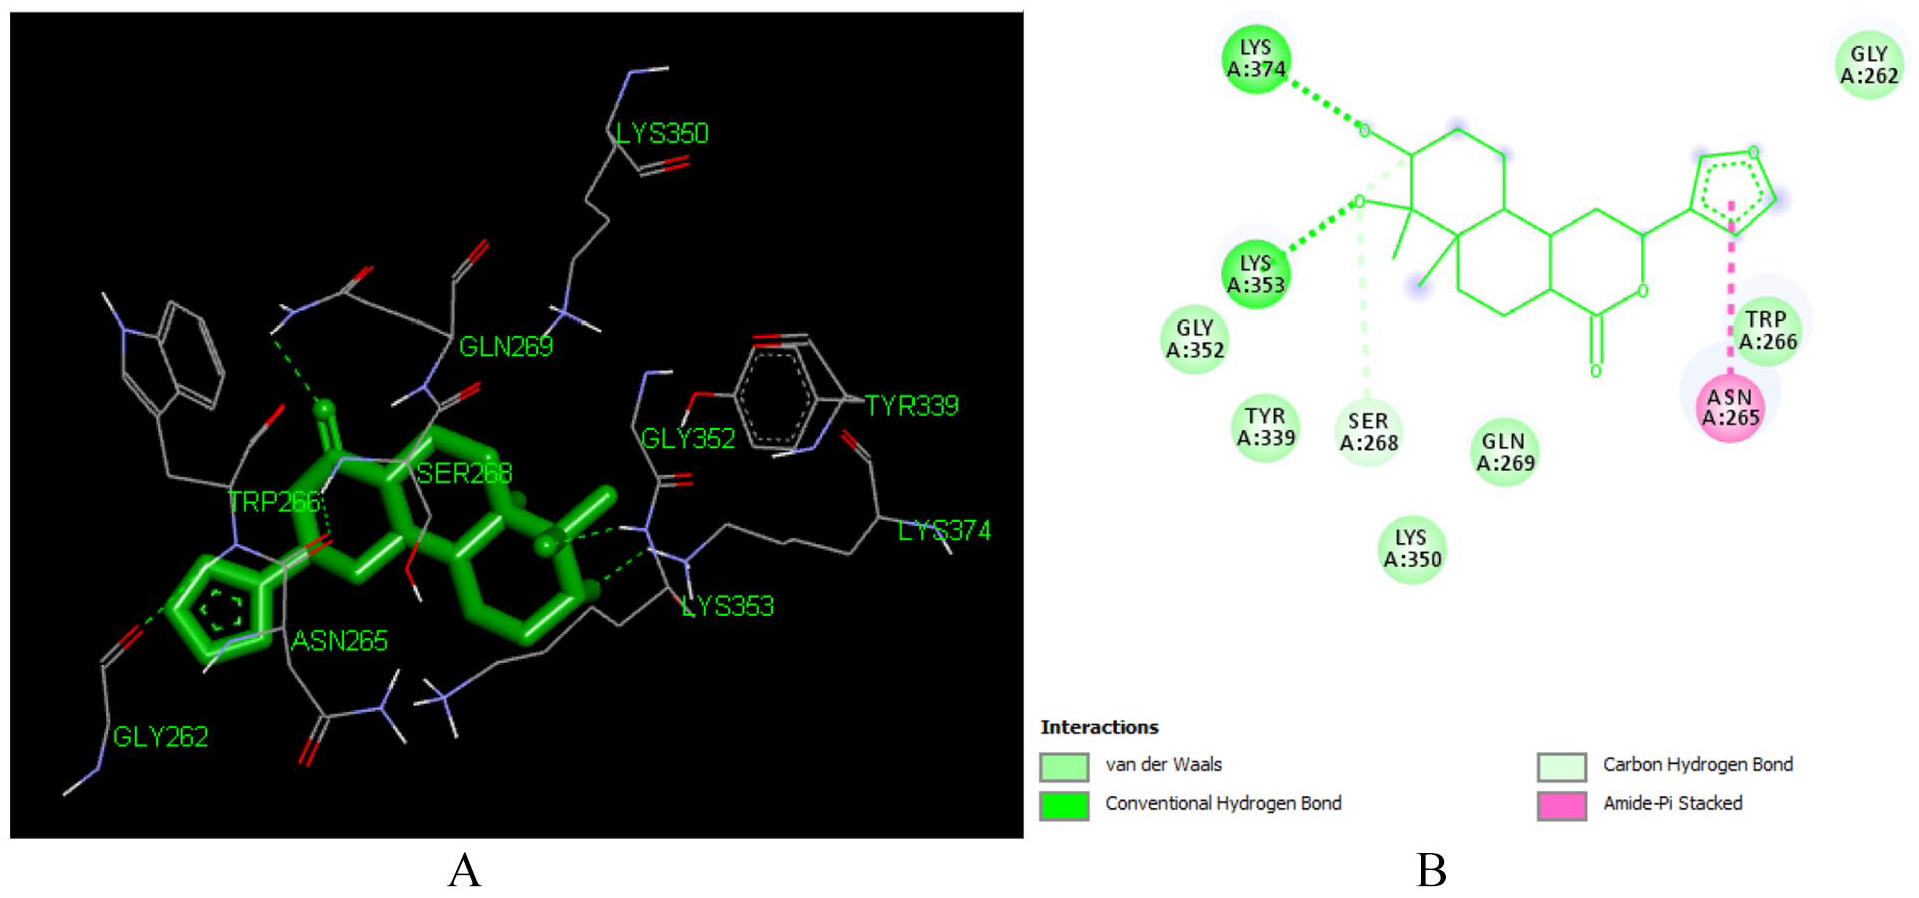
Docked poses of Furocrotinsulolide A (L105) with the active site region of reverse transcriptase (PDB ID: 1REV) enzyme (binding energy −6.92 kcal/mol) (A) 3D Furocrotinsulolide A (L105) with surrounding amino acids of 1REV; (B) 2D view of interaction type Furocrotinsulolide A (L105) with surrounding amino acids of 1REV.
Interaction of depressin (L214) with reverse transcriptase enzyme (PDB ID: 1REV)
Depressin (L214) is Caspian diterpenoid isolated from roots of C. dichogamus.10,59 It forms good docking pose with the reverse transcriptase (PDB ID: 1REV) at free binding energy of -6.92 kcal/ml and inhibition constant of 8.53 μM. This interaction was supported by hydrophobic interactions with ILE 94 (3.26 Å), ILE 94 (3.10 Å), HIS 96 (3.22 Å, TYR 232 (3.43 Å), TRP 266, GLN 269, MET 230 found in the active site of the enzyme. It also forms hydrogen bonding with LYS 350 (2.58 Å), HIS 96 (3.15 Å). The carbonyl group at C-13 (Figure 15) is responsible for the formation of hydrogen bond with Lys 350.
Docked poses of Depressin (L214) with the active site region of reverse transcriptase (PDB ID: 1REV) enzyme (binding energy −6.92 kcal/mol) (A) 3D Depressin (L214) with surrounding amino acids of 1REV; (B) 2D view of interaction type Depressin (L214) with surrounding amino acids of 1REV.
In silico pharmacokinetic ADMET prediction
The phytochemical compounds investigated fulfill the Lipinski rule of drug likeness and have acceptable molecular weight and solubility profile except aleuritolic acid (L12) and Depressin (L214) which had logP value of 6.06 and 7.31, respectively, Table S2 in Supplementary. The polar surface area of the phytochemical compounds was predicted to be less than 100 indicating that these compounds had good oral absorption or membrane permeability. 60 Among the FDA-approved drugs RPV and NVP were predicted to have good absorption while the other drugs had displayed strong polarity. Generally, drugs with smaller PSA are more easily absorbed.61,62
The phytochemical compounds and the FDA-approved drugs were predicted as having ideal lipophilicity (AlogP98 [WLOGP] ⩽ 5) except aleuritolic acid (L12) and depressin (L214) that display poor lipophilicity, AlogP98 (WLOGP) > 5. 63 With regard to intestinal absorption (human), absorbance of less than 30% is considered to be poorly absorbed. The phytochemical compounds and the FDA-approved drugs were predicted to have good absorption. Gastrointestinal (GIT) absorption is significant for the maintenance of optimal drug levels in the systemic circulation. For drugs or potential compounds to reach their target, they must be absorbed from the GIT and enter the systemic circulation in enough amount or quantities. 64 Highly absorbed drugs from the GIT will easily attain optimal concentration and exert a pharmacological effect at its target site.
With regard to skin permeability, the log Kp > -2.5, the compound is considered to be relatively low skin permeability. 63 Crothalimene B (L293) and depressin (L215) had predicted low skin permeability, while the other phytochemical compounds and ARV drugs were predicted to have high skin permeability. Skin permeability is a significant consideration for many consumer products efficacy, and of interest for the development of transdermal drug delivery. 65
As shown in Table 3, among the FDA approved antiretroviral drugs, DLV, RPV, ETV and ABC are predicted to be P-glycoprotein substrates. Similarly, the 10 phytochemical compounds isolated from C. dichogamus are predicted to be P-glycoprotein substrates, hence they may be actively exuded from cells by P-glycoprotein and while compounds L292, L216, L293, L2215 and L12 are predicted to be P-glycoprotein inhibitors. 65 Among the phytochemical compounds L12 and L214 were predicted to be pumped out of the cell by P-glycoprotein efflux pump. While L293, L216, L104, L292, L135, L215 and L105 were predicted to cross the BBB.
Predicted ADMET properties of phytochemical compounds isolated from C. dichogamus and FDA approved drugs.
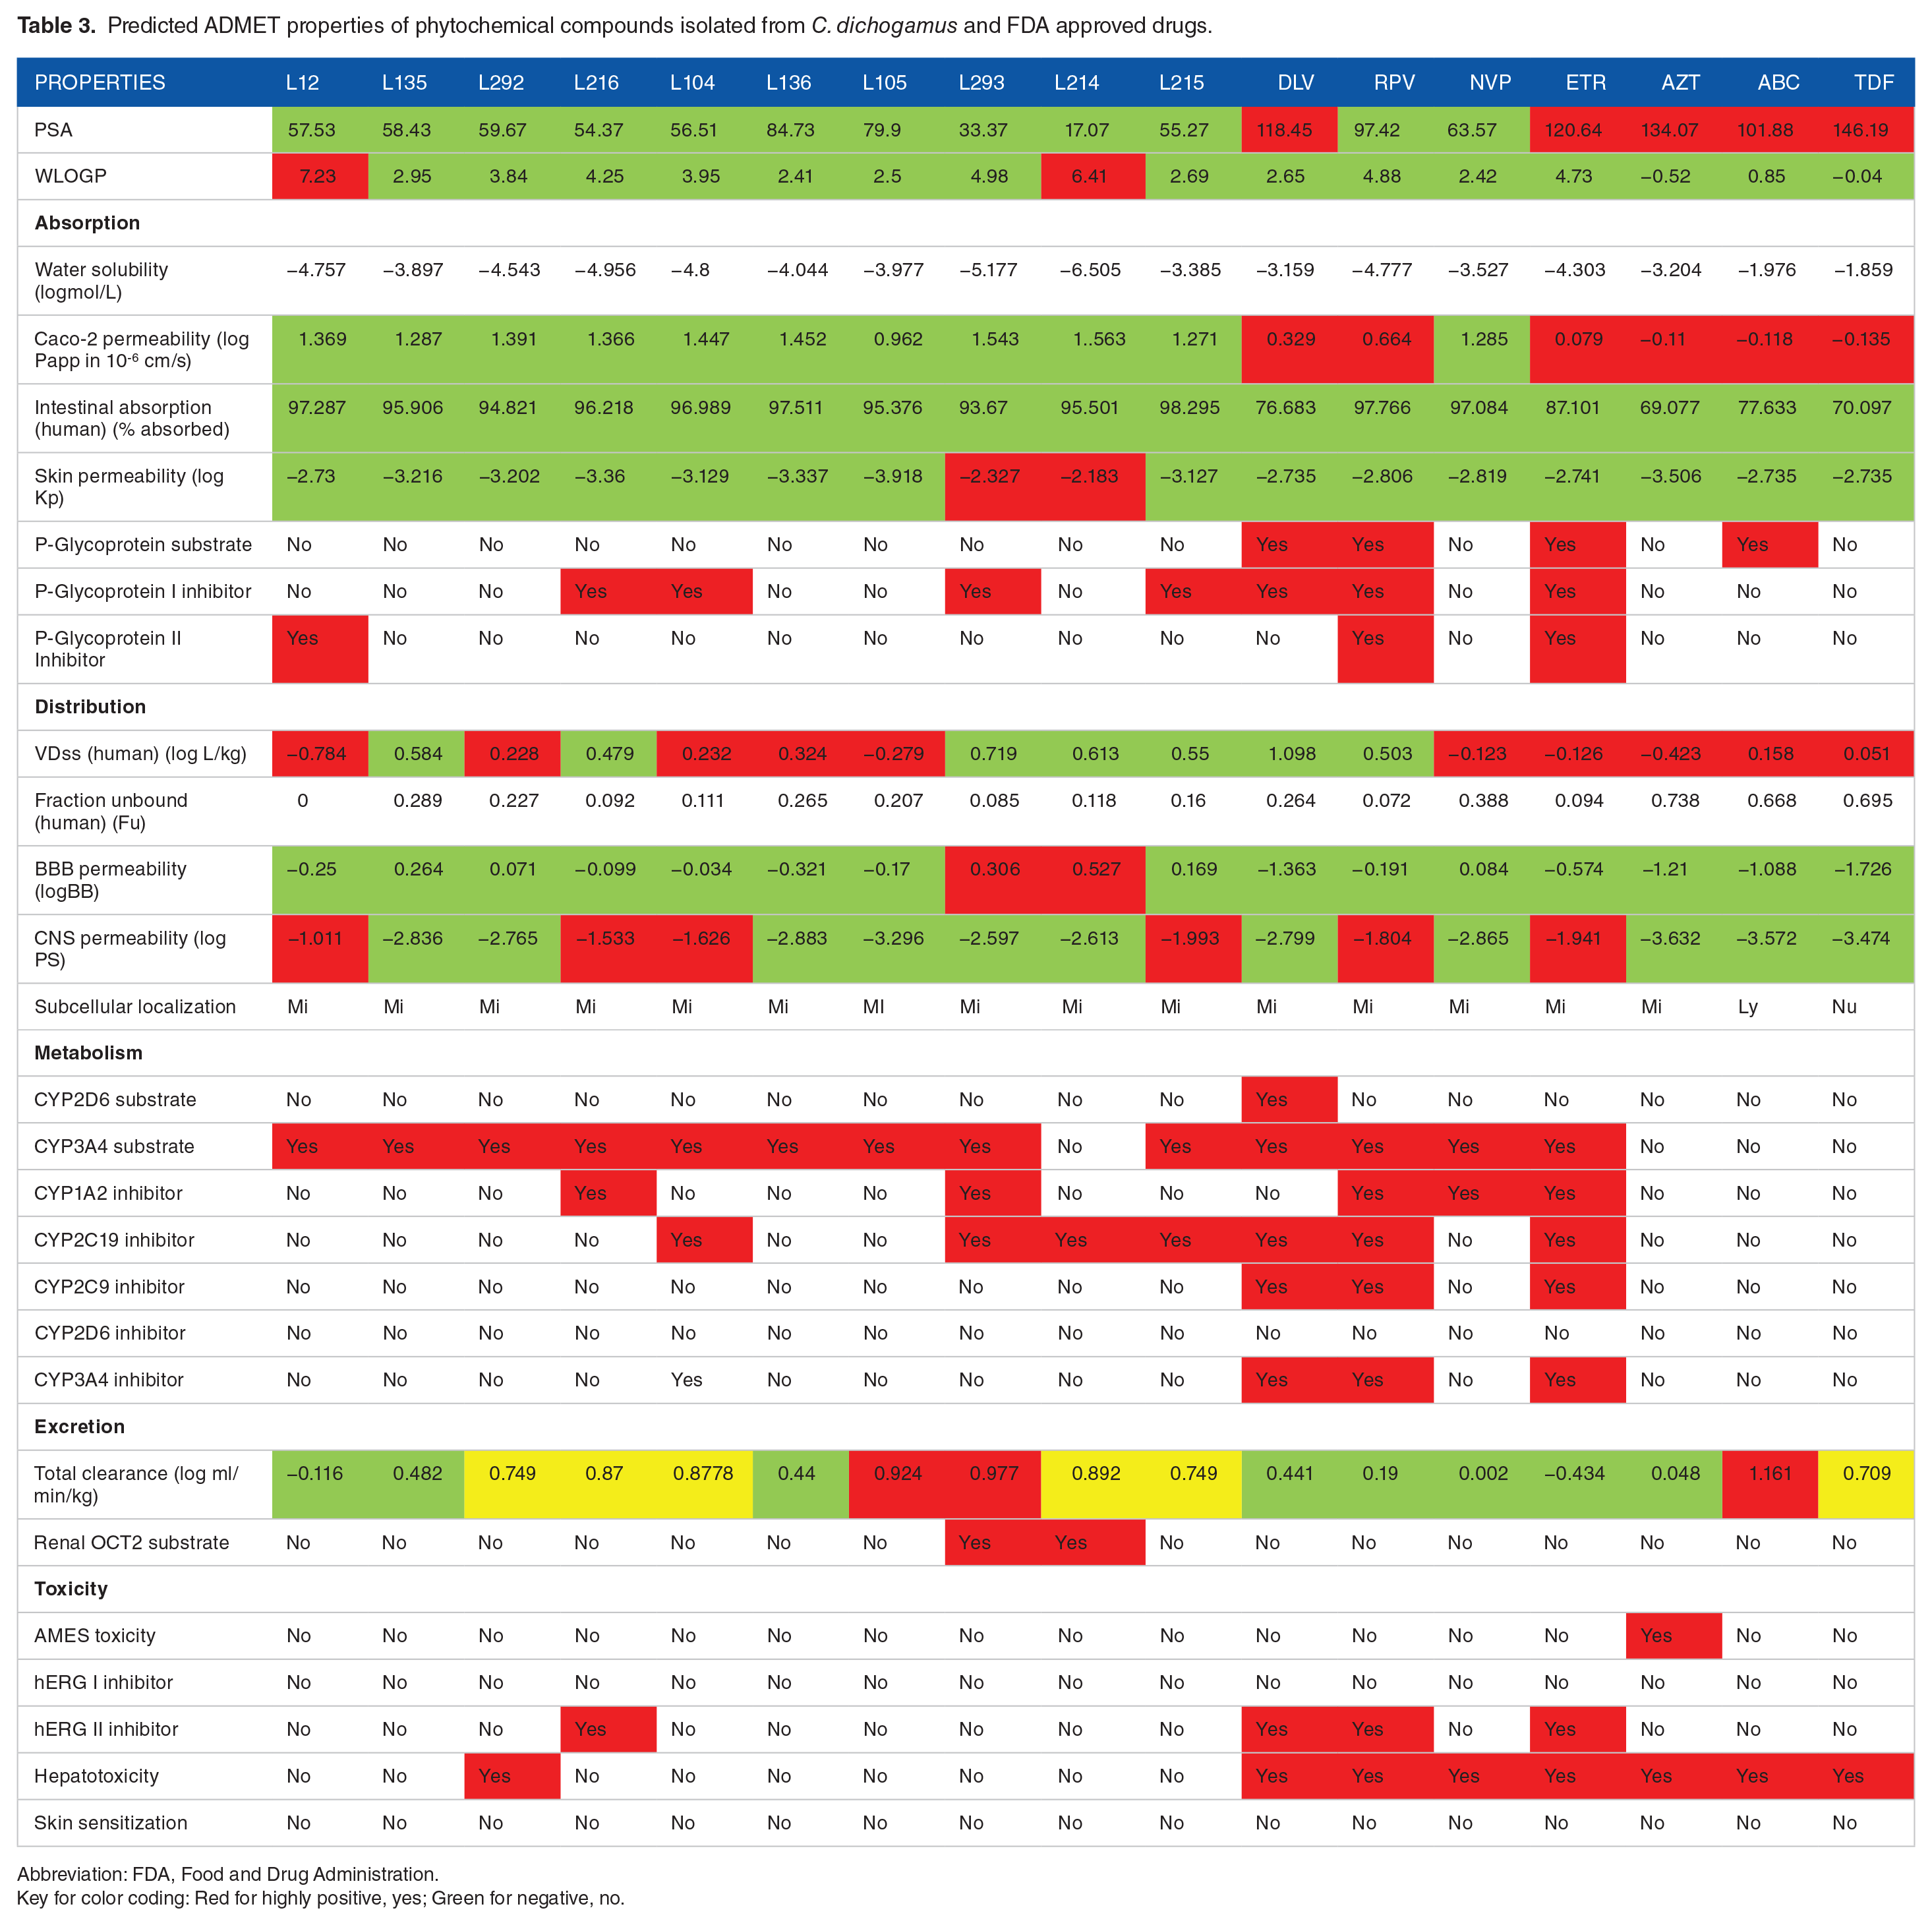
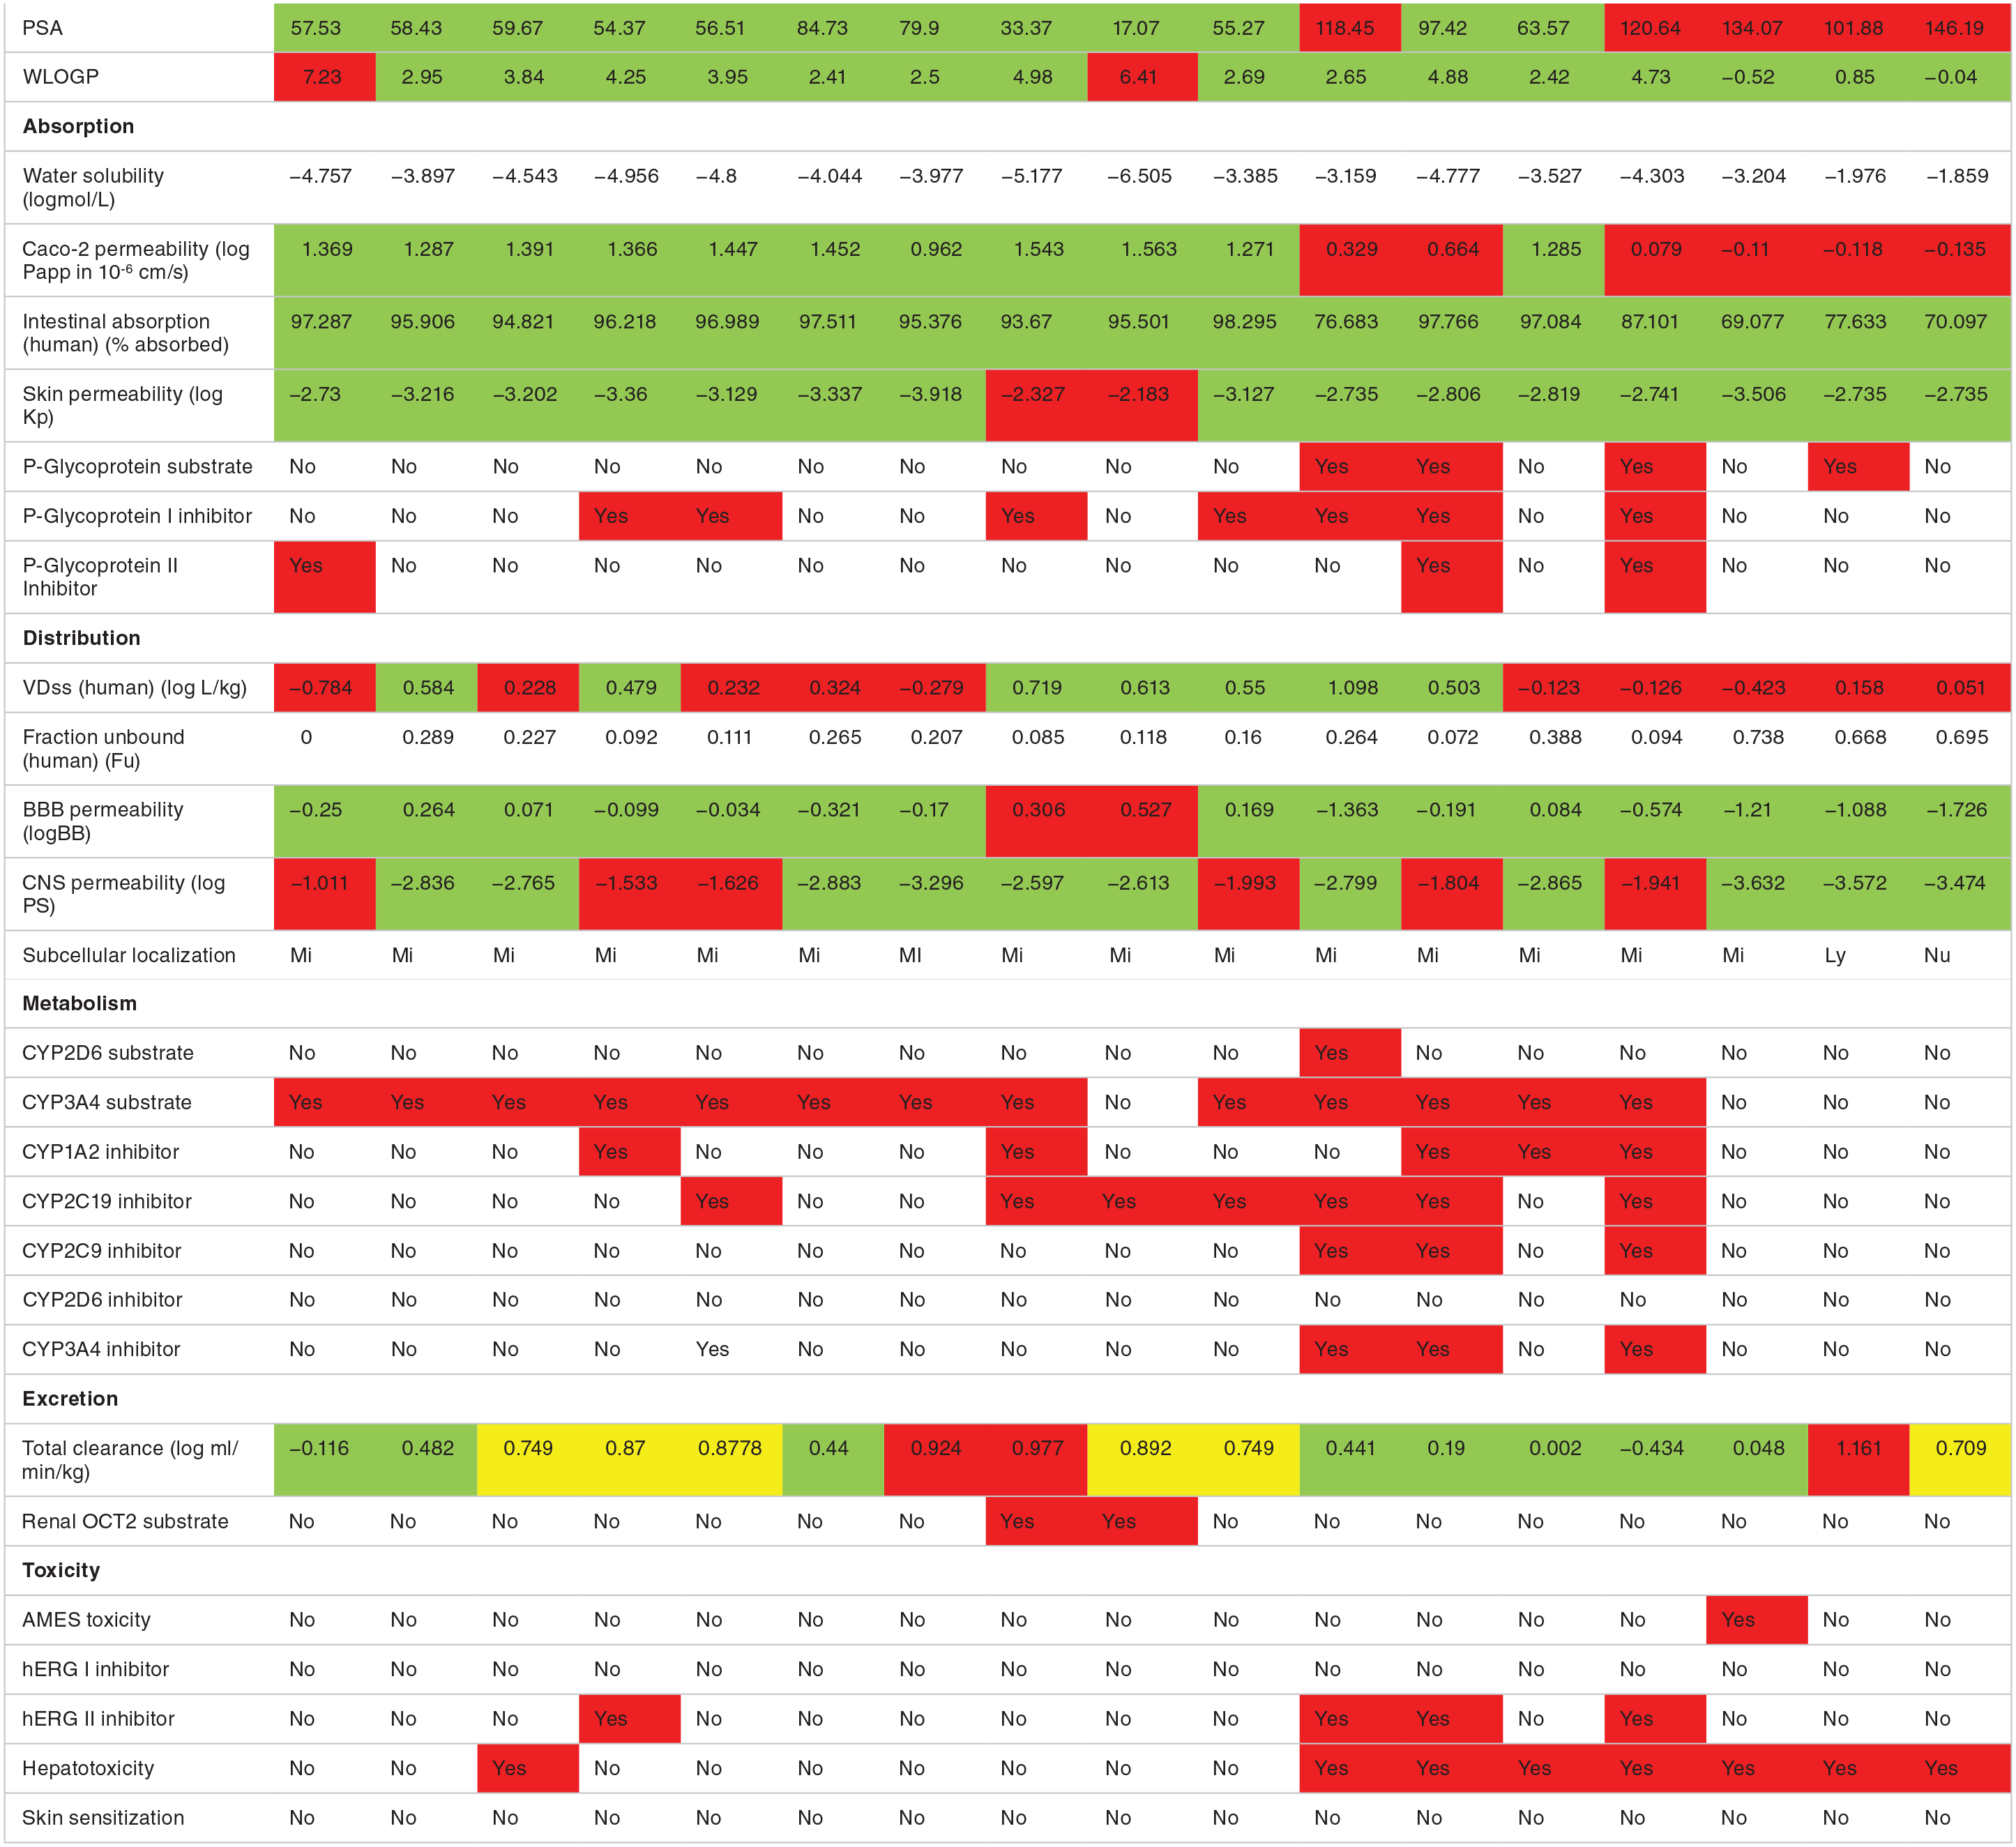
Abbreviation: FDA, Food and Drug Administration.
Key for color coding: Red for highly positive, yes; Green for negative, no.
The “Brain Or Intestinal Estimated permeation, (BOILED-Egg)” method was utilized as it computes the lipophilicity and polarity of small molecules. 66 As depicted in Figure 16, in the BOILED-Egg model, the white region represents the passive absorption of the GI tract, while the BBB penetration is represented by the yellow region (yolk) represents. The blue color indicator represents a molecule which is actively effluxed by P-glycoprotein (PGP+), whereas the red color indicator shows the nonsubstrate P-gp (PGP-). 67
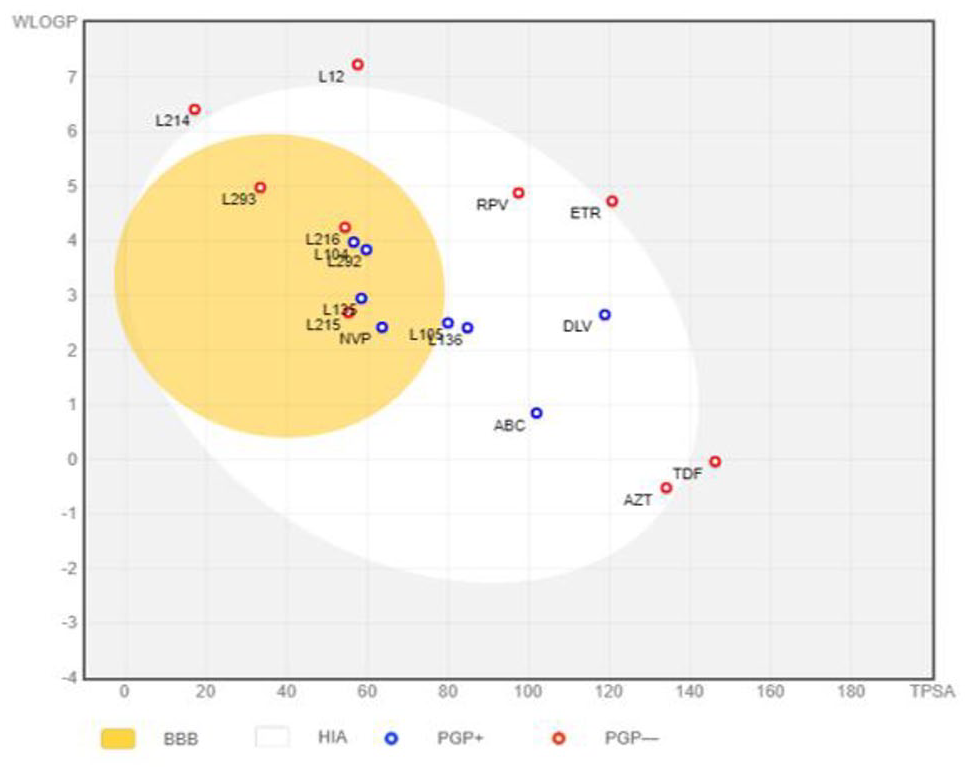
BOILED-Egg. Plot of 10 phytochemical compounds isolated from C. dichogamus and FDA approved antiretroviral drugs.
The results showed that the DLV and RPV have high predicted distribution volume (VDss), as compared to the other antiretroviral drugs. Among the phytochemical compounds L135, L216, L293, L214 and L215 were predicted to have high VDss. It was also noted that compounds with higher AlogP98/WLOGP values had high predicted VDss, a good example being L293 and RPV.
In addition, aleuritolic acid (L12), furocrotinsulolide A (L105), crotoxide B (L136), crotohaumanoxide (L140), depressin (L214) and cadalene (L4360) were predicted not to cross the BBB. Among the phytochemical compounds L293 and L214 were predicted to cross the BBB as determined by the logBB value > 0.3, while the other compounds were not predicted to cross the BBB.
Among the FDA approved drugs, delaviridine was predicted to be the only substrate for CYP2D6 enzyme, while all the other drugs were predicted to be substrates for CYP2D6 and CYP3A4 (except AZT, TDF and ABC), which is in agreement with previous reports by Gong et al. 68 Similarly, all the phytochemical compounds were predicted to be substrates for CYP3A4 (except depressin, L214), suggesting that these compounds may be metabolized in the liver. Crotonolide E (L104), crotohaimene B (L293), depressin (L214) and crotodichogamoin A (L215) were predicted to be CYP2C19 inhibitors.
Comparing the in silico PK results on CYP and P-gp, it was found out that crothalimene B (L293) and crotodichogamoin A (L215) are predicted to inhibit CYP2C19 and P-glycoprotein. The inhibition of CYP3A4 and P-gp by the phytochemical compounds could decrease the elimination and pumping of other antiretreoviral drugs from the systemic circulation and the cells respectively.
Drug clearance prediction shows that the total clearance of L105, L293 and ABC is the highest followed by L299, L216, L194, L214, L215 and TDF. In addition, L293 and L214 have shown to be renal OCT2 substrates. Renal organic cation transporter 2 is a renal uptake transporter that plays an important role in disposition and renal clearance of drugs and endogenous compounds. OCT2 substrates also have the potential for adverse interactions with co-administered OCT2 inhibitors. Assessing candidate’s potential to be transported by OCT2 provides useful information regarding not only its clearance but potential contraindication.
Drug clearance occurs primarily as a combination of hepatic clearance (metabolism in the liver and biliary clearance) and renal clearance (excretion via the kidneys). It is related to molecular weight, hydrophilicity and bioavailability of compounds, and is important for determining dosing rates to achieve steady state concentrations.
One of the main step in drug discovery is ensuring new drug candidates are safe to humans, animals, plants or the environment. Toxicity studies help in determining the harmful effect of drugs. Toxicity studies can be done in vivo, in vitro or in silico. Toxicity studies involving animals have a number of challenges with regard to time, ethical consideration and financial burden. Even though there are efforts to perform in vitro toxicity studies like cytotoxicity studies, these approaches are still costly and time consuming. In comparison to experimental approaches, computational methods of toxicity prediction are considered as fast, cheap and useful methods to analyze, simulate, visualize to predict the toxicity of chemicals. 69 Currently, many software and web servers can predict chemical toxicity before synthesis
AMES test formulated by Bruce Ames is a recognized in vitro assay that uses bacteria, Salmonella typhimurium, to test whether a given compound is mutagenic and therefore may act as a carcinogen. 70 A positive test indicates that the compound is mutagenic and therefore may act as a carcinogen. It predicts whether a given compound is likely to be Ames positive and hence mutagenic. In our study it is only zidovudine that was found to be Ames positive, which is in agreement with, 71 who reported “template-switch mutagensis” by zidovudine, through its action as a chain terminator during DNA replication. In silico prediction tools for AMES mutagenicity (Salmonella typhimurium reverse mutation assay) represent a cost-effective high throughput approach for the prioritization of compounds before experimental testing.72,73
Crotodichogamoin B (L216) and three FDA approved drugs (DLV, RPV and ETR) were predicted to inhibit hERG. Inhibition of the potassium channels encoded by the hERG (human ether-a-go-go gene) are the principal causes for the development of acquired long QT syndrome leading to fatal ventricular arrhythmia. Inhibition of hERG channels has resulted in withdrawal of many substances from the pharmaceutical market.
All the FDA approved drugs studied have predicted hepatotoxicity, which is in agreement with previous reports and clinical findings as liver toxicity is one of the most relevant adverse effects of antiretroviral therapy.74,75 Among the phytochemicals crothalimene A (L292) have predicted hepatotoxicity.
All the phytochemical compounds and FDA approved drugs have not shown skin sensitization and predicted toxicity. Skin sensitization is a potential adverse effect for dermal applied products. The evaluation of whether a product, which may have encountered the skin can induce allergic contact dermatitis is an important safety concern.
Physicochemical properties associated with chemical compounds that have good oral bioavailability, low toxicity and optimum values of physicochemical properties are key parameters for the anti-HIV drug discovery.
Conclusions
In the present study binding mechanism of a phytochemical compounds isolated from C. dichogamus in the active site of HIV-1 RT have been elucidated using molecular docking and molecular dynamics simulation studies. Based on our results, we obtained five potential inhibitors of HIV-1 RT, including aleuritolic acid, crotoxide A, Crothalimene A, crotodichogamoin B, and crotonolide E with respective binding energy of -8.48 (Ki = 0.61 μM), -7.73 (Ki = 2.11 μM), -7.48 (Ki = 3.3 μM), -7.42 (Ki = 3.62 μM), -7.31 (Ki = 4.42 μM). These compounds have shown high binding energy as compared to standard FDA approved antiretreoviral drugs. Our computational studies have also shown that these phytochemicals form hydrophobic interactions with ASN 265, GLU 378, GLY 352, HIS 96, ILE 382, SER 268, TRP 266, hydrogen bonding with ARG 355, ARG 356, ARG 358, GLN 269, ILE 94, LEU 92, LYS 350, LYS 353, LYS 374, TYR 232 amino acids in the active site of the enzyme. Thus, we report these top 5 phytochemicals as potentially potent, selective, orally bioavailable, and nontoxic leads based on the ADMET screening and effective binding analysis in the active site of the reverse transcriptase (PDBID: 1REV) for further consideration. The experimental validation of the results should be warranted in future studies.
Supplemental Material
sj-docx-1-bbi-10.1177_11779322221125605 – Supplemental material for Molecular Docking, Validation, Dynamics Simulations, and Pharmacokinetic Prediction of Phytochemicals Isolated From Croton dichogamus Against the HIV-1 Reverse Transcriptase
Supplemental material, sj-docx-1-bbi-10.1177_11779322221125605 for Molecular Docking, Validation, Dynamics Simulations, and Pharmacokinetic Prediction of Phytochemicals Isolated From Croton dichogamus Against the HIV-1 Reverse Transcriptase by Ermias Mergia Terefe and Arabinda Ghosh in Bioinformatics and Biology Insights
Footnotes
Acknowledgements
We sincerely thank the United States International University-Africa, University of Nairobi and Kenya Medical Research institute for their support toward the successful completion of the research work.
Funding:
The author(s) received no financial support for the research, authorship, and/or publication of this article.
Declaration of Conflicting Interests:
The author(s) declared no potential conflicts of interest with respect to the research, authorship, and/or publication of this article.
Author Contributions
Authors’ contributed in the conceptualization, methodology, investigation, data analysis and write-up of the manuscript.
Supplemental Material
Supplemental material for this article is available online.
References
Supplementary Material
Please find the following supplemental material available below.
For Open Access articles published under a Creative Commons License, all supplemental material carries the same license as the article it is associated with.
For non-Open Access articles published, all supplemental material carries a non-exclusive license, and permission requests for re-use of supplemental material or any part of supplemental material shall be sent directly to the copyright owner as specified in the copyright notice associated with the article.