
Abstract
Background and objective:
The primary cilium is a small protrusion found on most mammalian cells. It acts as a cellular antenna, being involved in various cell signaling pathways. The length of the primary cilium affects its function. To study the impact of physical or chemical stimuli on cilia, their lengths must be determined easily and reproducibly.
Methods:
We have developed and evaluated an open-source R package called detectCilia to detect and measure primary cilia automatically. As a case study to demonstrate the capability of our tool, we compared the influence of 4 different cell culture media compositions on the lengths of primary cilia in human chondrocytes. These media compositions include (1) insulin-transferrin-selenium (ITS); (2) ITS and dexamethasone (Dexa); (3) ITS, Dexa, insulin-like growth factor 1 (IGF-1), and transforming growth factor beta 1 (TGF-β1); and (4) fetal bovine serum (FBS).
Results:
The assessment of detectCilia included a comparison with 2 similar tools: ACDC (Automated Cilia Detection in Cells) and CiliaQ. Several differences and advantages of our package make it a valuable addition to these tools. In the case study, we have observed variations in the ciliary lengths associated with using different media compositions.
Conclusions:
We conclude that detectCilia can automatically and reproducibly detect and measure primary cilia in confocal microscopy images with low false-positive rates without requiring extensive user interaction.
Introduction
The primary cilium is a specialized structure that extends from the cell surface like a solitary hair. In contrast to motile cilia of epithelial cells, primary cilia do not have a central pair of single microtubules, which makes them immotile. This single microtubule-based structure is present in most mammalian cell types found in connective tissues (eg, chondrocytes), epidermis, reproductive organs, and stem cells.1,2 For a long time, the primary cilium was considered a rudimentary structure without any function in multicellular organisms. 3
Since the early 2000s, the primary cilium has gained more attention in research as it is involved in various signaling pathways and homeostasis, and can be associated with cancer development. 4 The importance of the primary cilium is also evident when abnormalities are present, which may cause various diseases and developmental disorders: the so-called ciliopathies. 5 Specific receptors and ion channels in the cilia membrane influence various signaling pathways responsible for development, such as Notch, Wnt, and Hedgehog, or the coupling of mechanical or chemical stimuli including growth factors.6 -11 These regulate differentiation, migration, and cell growth during development and adulthood.
It is known that many ciliopathies are associated with altered cilia lengths. 12 The length of the cilium is controlled by various proteins and mechanisms such as vesicle transfer and remodeling of the actin cytoskeleton. 13 In particular, stimulation with growth factors and the associated ligand binding to the specific receptors can influence cilia length. 14 Longer cilia may induce a greater influx of calcium ions (eg, by mechanical stimuli) because less force is required to bend the cilium. 15 In addition, the elongation also increases the volume of the cilium, which is associated with concentration modifications of ions, proteins, and signal molecules, leading to biological responses. 16 Other factors that influence the cilium length include chondrogenic dedifferentiation processes during expansion, 17 the concentration of metal ions such as cobalt that can result from corrosion processes of implants, 18 or autophagy processes. 19
Primary cilia are also important for cartilage health. 20 In chondrocytes, primary cilia are predominantly located in deep ciliary pockets and have lengths of about 1 μm to 3 μm (in the z-stack projection), so they generally do not extend from the cell surface.17,21 -24 In comparison, the ciliary length in osteoblasts is up to 4 µm. 25
As the primary cilium appears to be involved in different key signaling pathways and diseases, the ability to investigate this structure efficiently and reproducibly is vital to identify mechanisms associated with this distinctive structure. The determination of cilia lengths and also the number of cilia is of interest for tissue engineering approaches or therapeutic strategies. Until now, manual image analysis approaches have predominated, although these are time-consuming, user-biased, and error-prone, and the results are difficult to compare due to the individual’s interpretation of a cilium. Of 24 publications (for this overview, we examined all publications referenced in this publication [excluding reviews and tool papers] and added the first 10 results of a Web of Science search [”primary cilium” AND ”length” {Topic} and 2012-2022 {Year Published}, NOT Document Types: Review Article]), authors of 21 of these publications manually detected and measured primary cilia,8,14,15,17,18,23,24,26 -39 one 21 used software to achieve this task (semi-)automatically and two25,40 have not stated how this was done. However, we believe it was done manually because no tool was mentioned.
These studies required high-resolution imaging techniques because the primary cilium is only a few micrometers long. The ability of an imaging system to resolve these details is described by the optical resolution. It depends on the point spread function (PSF), which is the 3-dimensional representation of a single point of light imaged by a microscope.
41
In confocal microscopy, the PSF is influenced by the numerical aperture of the objective lens, the immersion medium used, the emission and excitation wavelengths, and the pinhole diameter. Using the Houston criterion,
42
the theoretical limits of the optical resolution of a confocal microscope are given by the lateral full-width half-maximum
To improve the reproducible analysis of cilia, we have developed an open-source R 44 package coined detectCilia. It focuses on automatic counting and 2-dimensional (2D)/3-dimensional (3D) measurement of primary cilia lengths in confocal microscopy images. We are using R because it is highly accepted in the scientific community, and the usage of this data science ecosystem is still increasing. 45 The tool was tested with the results of an in vitro study of human chondrocytes cultured in different cell culture media on collagen-coated glass surfaces. First, we used 7 test images to evaluate detectCilia by comparing its results with manual detection and length measurements performed by 3 raters as well as with 2 existing cilia detection tools: ACDC 46 and CiliaQ. 47 Second, the R package, ACDC, and CiliaQ detected and measured the cilia in all acquired microscopy images to analyze the effect of cell culture medium composition on ciliary length. We thoroughly compared the results of all 3 tools.
Materials and Methods
Cell culture
For investigating the influence of the cell culture medium composition on the lengths of primary cilia, human nondegenerative chondrocytes from a 30-year-old male donor (NHAC-kn, CC-2550; LONZA, Walkersville Inc., Walkersville, Maryland) were used. These chondrocytes were seeded in passage 4 with a density of 28 000 cells∕cm2 on collagen-coated glass coverslips (GG-15-Collagen; Neuvitro Corporation, Camas, WA, USA). The cells were cultivated in 12-well plates (Thermo Fisher Scientific Inc., Waltham, Maryland) under hypoxic conditions at 37°C, 5% CO2, and 5% O2 with different media compositions for 3 days.
The basal medium consisted of Dulbecco’s Modified Eagle Medium (Gibco) including high glucose (GlutaMAX), sodium pyruvate supplements (Thermo Fisher Scientific Inc.), as well as 1% penicillin/streptomycin (Pen/Strep; Thermo Fisher Scientific Inc.), 1% amphotericin B (Biochrom GmbH, Berlin, Germany), and 50 µg/mL ascorbic acid (Sigma-Aldrich, Merck KGaA, Darmstadt, Germany). Different supplements were added to this basal medium to investigate the influence of different culture media on ciliary length, creating 4 groups:
ITS: 1% insulin-transferrin-selenium (ITS+ Premix; BD Biosciences, Franklin Lakes, New Jersey);
ITS with Dexa: 1% insulin-transferrin-selenium (ITS+) and 100 nM dexamethasone (Sigma-Aldrich);
ITS with Dexa + IGF-1 + TGF-β1: 1% insulin-transferrin-selenium (ITS +), 100 nM dexamethasone, 50 ng/mL insulin-like growth factor (IGF)-1 (R&D Systems, Minneapolis, Minnesota), and 50 ng/mL transforming growth factor (TGF)-β1 (Peprotec, Hamburg, Germany);
FBS: 10% fetal bovine serum (FBS; Pan Biotech, Aidenbach, Germany).
In the case study, the experiments of groups 1 and 4 were performed once
Immunocytochemistry
After 3 days of cultivation in the different media compositions, the chondrocytes were washed once with phosphate-buffered saline (PBS; Biochrom GmbH) and fixed for 10 minutes at room temperature (RT) with 4% paraformaldehyde (ROTI Histofix; Carl Roth GmbH + Co. KG, Karlsruhe, Germany). After fixation, cells were washed again and permeabilized with 0.2% Triton-X100 (Merck, Darmstadt, Germany) for 10 minutes. For blocking the unspecific binding sites, cell-seeded coverslips were incubated with bovine serum albumin (Sigma-Aldrich) with a concentration of 5% in PBS for 1 hour at RT after another washing step with PBS. To stain the primary cilium, cells were incubated with anti-acetylated ∝-tubulin (6-11B-1) (RRID: AB_628409) labeled with Alexa Fluor 647 (sc-23950 AF647; Santa Cruz Biotechnology, Dallas, Texas) diluted 1:200 in PBS at 4°C overnight. In addition, the actin cytoskeleton was stained with Acti-stain 488 Fluorescent Phalloidin (Cytoskeleton, Inc., Denver, Colorado) diluted 1:140 in PBS for 30 minutes at RT. Afterward, cells were washed 3 times with PBS, and the coverslips were fixed with Fluoroshield (Sigma-Aldrich) containing
Image acquisition
Three-dimensional fluorescence images of stained cells were acquired with a ZEISS ELYRA LSM 780 confocal laser scanning microscope (CLSM; Carl Zeiss AG, Oberkochen, Germany). Images were recorded using a Plan-Apochromat
Image analysis: manual detection and measurement of the lengths of cilia
Images acquired with the CLSM and saved in the CZI format were processed and interpreted in Fiji 48 (Fiji is just ImageJ) (ImageJ v1.53c). Strictly speaking, the length of anti-acetylated α-tubulin was measured and used as a proxy for the cilium length. Before detecting and measuring the cilia, the brightness and contrast were adjusted using the automatic brightness/contrast adjustment function of Fiji. Afterward, the cilia were identified and numbered in a projection of the z-stack (using the maximum intensity method). Depending on the specificity of the staining, other objects, such as membranous or mitotic structures or other fixation artifacts, were sometimes visible and had to be neglected. Therefore, a researcher labeling the cilia (manual rater) needed to differentiate between actual cilia and other objects by looking at typical features of primary cilia: brightness, length, and uniqueness per cell. Still, some images prohibited a clear identification of all (non-)cilia (see Supplemental Figure S3 for 2 examples).
Next, the horizontal lengths of the detected cilia were determined in the z-stack projection using the line tool, trying to find the maximum extension of each cilium using a straight line. Finally, the lowest and highest z-stack layers, which belong to a cilium, were found.
With these measurements, the vertical length
Image analysis: using the R package detectCilia
The developed R package detectCilia (v0.8.4) will be introduced in section “R package detectCilia.” In Listing 1, the main function to use this R package is shown. We used predefined (default) parameter values, such as the colors of the cilia and nuclei, and let the tool calculate missing values, such as thresholds, depending on the properties of an image. The R script to work with detectCilia and reproduce the results of this publication is found on GitHub (https://github.com/SFB-ELAINE/SI_lengthOfPrimaryCilia/).
Listing 1: R function call for automatically detecting and measuring all cilia in the image file "test.czi".
For every medium composition, we have acquired several z-stack image files:
ITS: 6 files
ITS with Dexa: 12 files
ITS with Dexa, IGF, TGF: 13 files
FBS: 5 files
All detectCilia results have been manually checked. Of 797 found ciliary objects in total, 29 false positives were removed because we could not identify them as primary cilia and 26 were removed during the data analysis because they touched a
We have used 7 images from Group 2 (ITS with Dexa) for the evaluation of our tool (see section “Comparison of manual and automatic cilia detection and measurements”). These images
Image analysis: using ACDC (Automated Cilia Detection in Cells)
We have used the software for Automated Cilia Detection in Cells (ACDC) v0.93 46 to automatically detect and measure cilia in the z-stack projections of the microscopy images. Before this Matlab tool could be used, the images needed to be converted because ACDC detects cilia in the green channel. (We applied a red fluorescent dye to label the cilia.) For this, all images were converted to TIF files, using the maximum intensity z-stack projection and switching the information of the red and green channels such that the cilia may be detected in the green channel using the function convertCziToTif from our R package readCzi (https://github.com/SFB-ELAINE/readCzi) (v0.4.1). The function for image and channel conversion is shown in Listing 2.
Listing 2: R function call to convert a CZI file to TIF and change color layers of the image file “test.czi.”
The ACDC requires 5 parameter values to detect and measure cilia automatically. To find the best combination, we analyzed the first image from each sample stack (8 images in total). We used the following parameter values: Kernel length:
Image analysis: using CiliaQ
CiliaQ 47 constitutes a 3-step workflow based on 3 ImageJ plugins: (1) CiliaQ Preparator (v0.1.2) prepares the images for segmentation and segments the images into cilia and background; (2) CiliaQ Editor (v0.0.3) allows manual corrections of the segmentation; and (3) CiliaQ (v0.1.7) automatically reconstructs the cilia, quantifies them, and visualizes the results.
In the case study, we used the original 3D CZI files as well as the same 2D TIF images as for ACDC. Before we could use the plugin, the 2D images had to be converted to RGB stacks in ImageJ (Image → Type → RGB Stack). Next, CiliaQ Preparator was used for segmentation, applying the default parameter values everywhere except for the channel number: 2, segmentation method: “triangle,” and segmentation style: “Set intensities above thresholds to maximum possible intensity value.” Finally, the segmented images were analyzed using CiliaQ with the following parameter values: Calibration [unit / pixel] = 0.219647, Voxel depth
Statistics
When comparing different experimental groups, we first tested for normal distributions of the cilia lengths using the Shapiro-Wilk test. The null hypothesis of a normal distribution was not rejected when
Results and Discussion
First, we present the developed R package. Then, we compare detectCilia with ACDC and CiliaQ and evaluate the package using simulated cilia and the test images of the case study. Finally, we show and discuss the impact of different media compositions on the lengths of primary cilia of human chondrocytes.
R package detectCilia
We have developed an open-source R package called detectCilia (the package is found on GitHub: https://github.com/SFB-ELAINE/detectCilia) to automatically detect and measure cilia in (confocal) fluorescence microscopy images. It can work with either TIF or CZI (Zeiss) files. The latter is preferred because exported TIF files may have been manipulated (eg, changed brightness/contrast) and may lack important metadata. Functions to work with image data from other confocal fluorescence microscopy manufacturers (eg, ND2 [Nikon], LIF [Leica], or OIF [Olympus]) will be included in the future.
detectCilia imports and uses the following packages: BiocManager, 49 devtools, 50 reticulate, 51 and dplyr. 52 BiocManager is used to install the R package EBImage; 53 devtools is used to install our own package readCzi 54 that is currently available on GitHub; and reticulate is used to install the Python library czifile 55 needed to read CZI files. Details on the complete functionality of the R package are found in section “R package detectCilia” of the Supplemental Material. In general, the main function of the package, detectCilia(), is a 4-step process, described in the following and visualized in Figure 1.

Default workflow of detectCilia. 1. Image preparation: The original microscopy files are imported, and, if applicable, a maximum intensity z-stack projection is calculated. 2. Nuclei detection: The stained nuclei are segmented and counted using the mean area of a nucleus as an input parameter. 3. Cilia detection: Cilia are detected in the z-stack projection and every z-stack layer using the ratio of possible cilia pixels. Here, a primary cilium’s (expected) area is needed as an input parameter. 4. Cilia measurement: The information on all cilia (eg, lengths and heights) is collected, and the total lengths are calculated. The results are saved in a CSV file. (The images shown are sections of
1. Image preparation: The file (either in CZI or TIF format) is imported into R as a 3D or 4D array (x, y, (z), and color channel). Next, a z-stack projection is calculated. We have compared the average and maximum intensity projection methods and decided to use the latter by default because it is more reliable, especially when, otherwise, averaging many z-stack layers would lead to a low signal-to-noise ratio.
2. Nuclei detection: We apply different methods from the EBImage package to find, label, and count nuclei (ie, thresh(), opening(), fillHull(), bwlabel()).
3. Cilia detection: First, the thresholds for finding cilia in the z-stack projection and in every layer are calculated if these are not passed as arguments to the function. The thresholds are calculated by looking at the
4. Cilia measurement: For every image, a CSV file with each cilium’s length and height measurement and the calculated total length is saved (cf. Figure 2). Furthermore, a CSV containing the number of identified nuclei and a CSV file containing the passed function arguments are saved. In addition, TIFs containing the labeled nuclei and cilia are created.

Determination of the ciliary length. Our R package detectCilia uses the maximum extension of the z-stack projection for calculating the horizontal length. The vertical length is calculated by counting the number of z-stack layers where parts of a cilium can be seen. This number is multiplied by the spacing of the layers. The total length is calculated using Pythagoras’ theorem.
A few assumptions have been made to automatically calculate parameter values for the detection step, which are used when the user does not enter specific detection parameter values. We assume that
Every cell contains 1 nucleus and, at most, 1 primary cilium.
The projected area of a cilium (z-stack projection) is between 1 µm × 0.25 µm and 5 µm × 1 µm.
The nucleus area is in the order 15 µm × 15 µm.
These assumptions are used in the calculation of the threshold values for detecting cilia in the z-stack projection (threshold_find) and for connecting cilium points of other z-stack layers to the found cilia (threshold_connect) if the thresholds are not explicitly given by the user. The calculated thresholds depend on the ratio of (possible) cilia pixels. For this, the number of nuclei (and thus cells) in an image is needed. The ratio is then used to determine the thresholds by calculating the corresponding quantile of the pixel intensity distribution. The exact calculations are found in section “Input parameters of the main function detectCilia()” of the Supplemental Material.
Comparison of detectCilia with the similar cilia measurement tools ACDC and CiliaQ
Before we evaluate the R package, we compare it with the currently available tools for detecting and measuring cilia: ACDC 46 and CiliaQ. 47 Similarities and differences between the tools are summarized in Table 1.
Similarities and differences between detectCilia, ACDC, and CiliaQ.
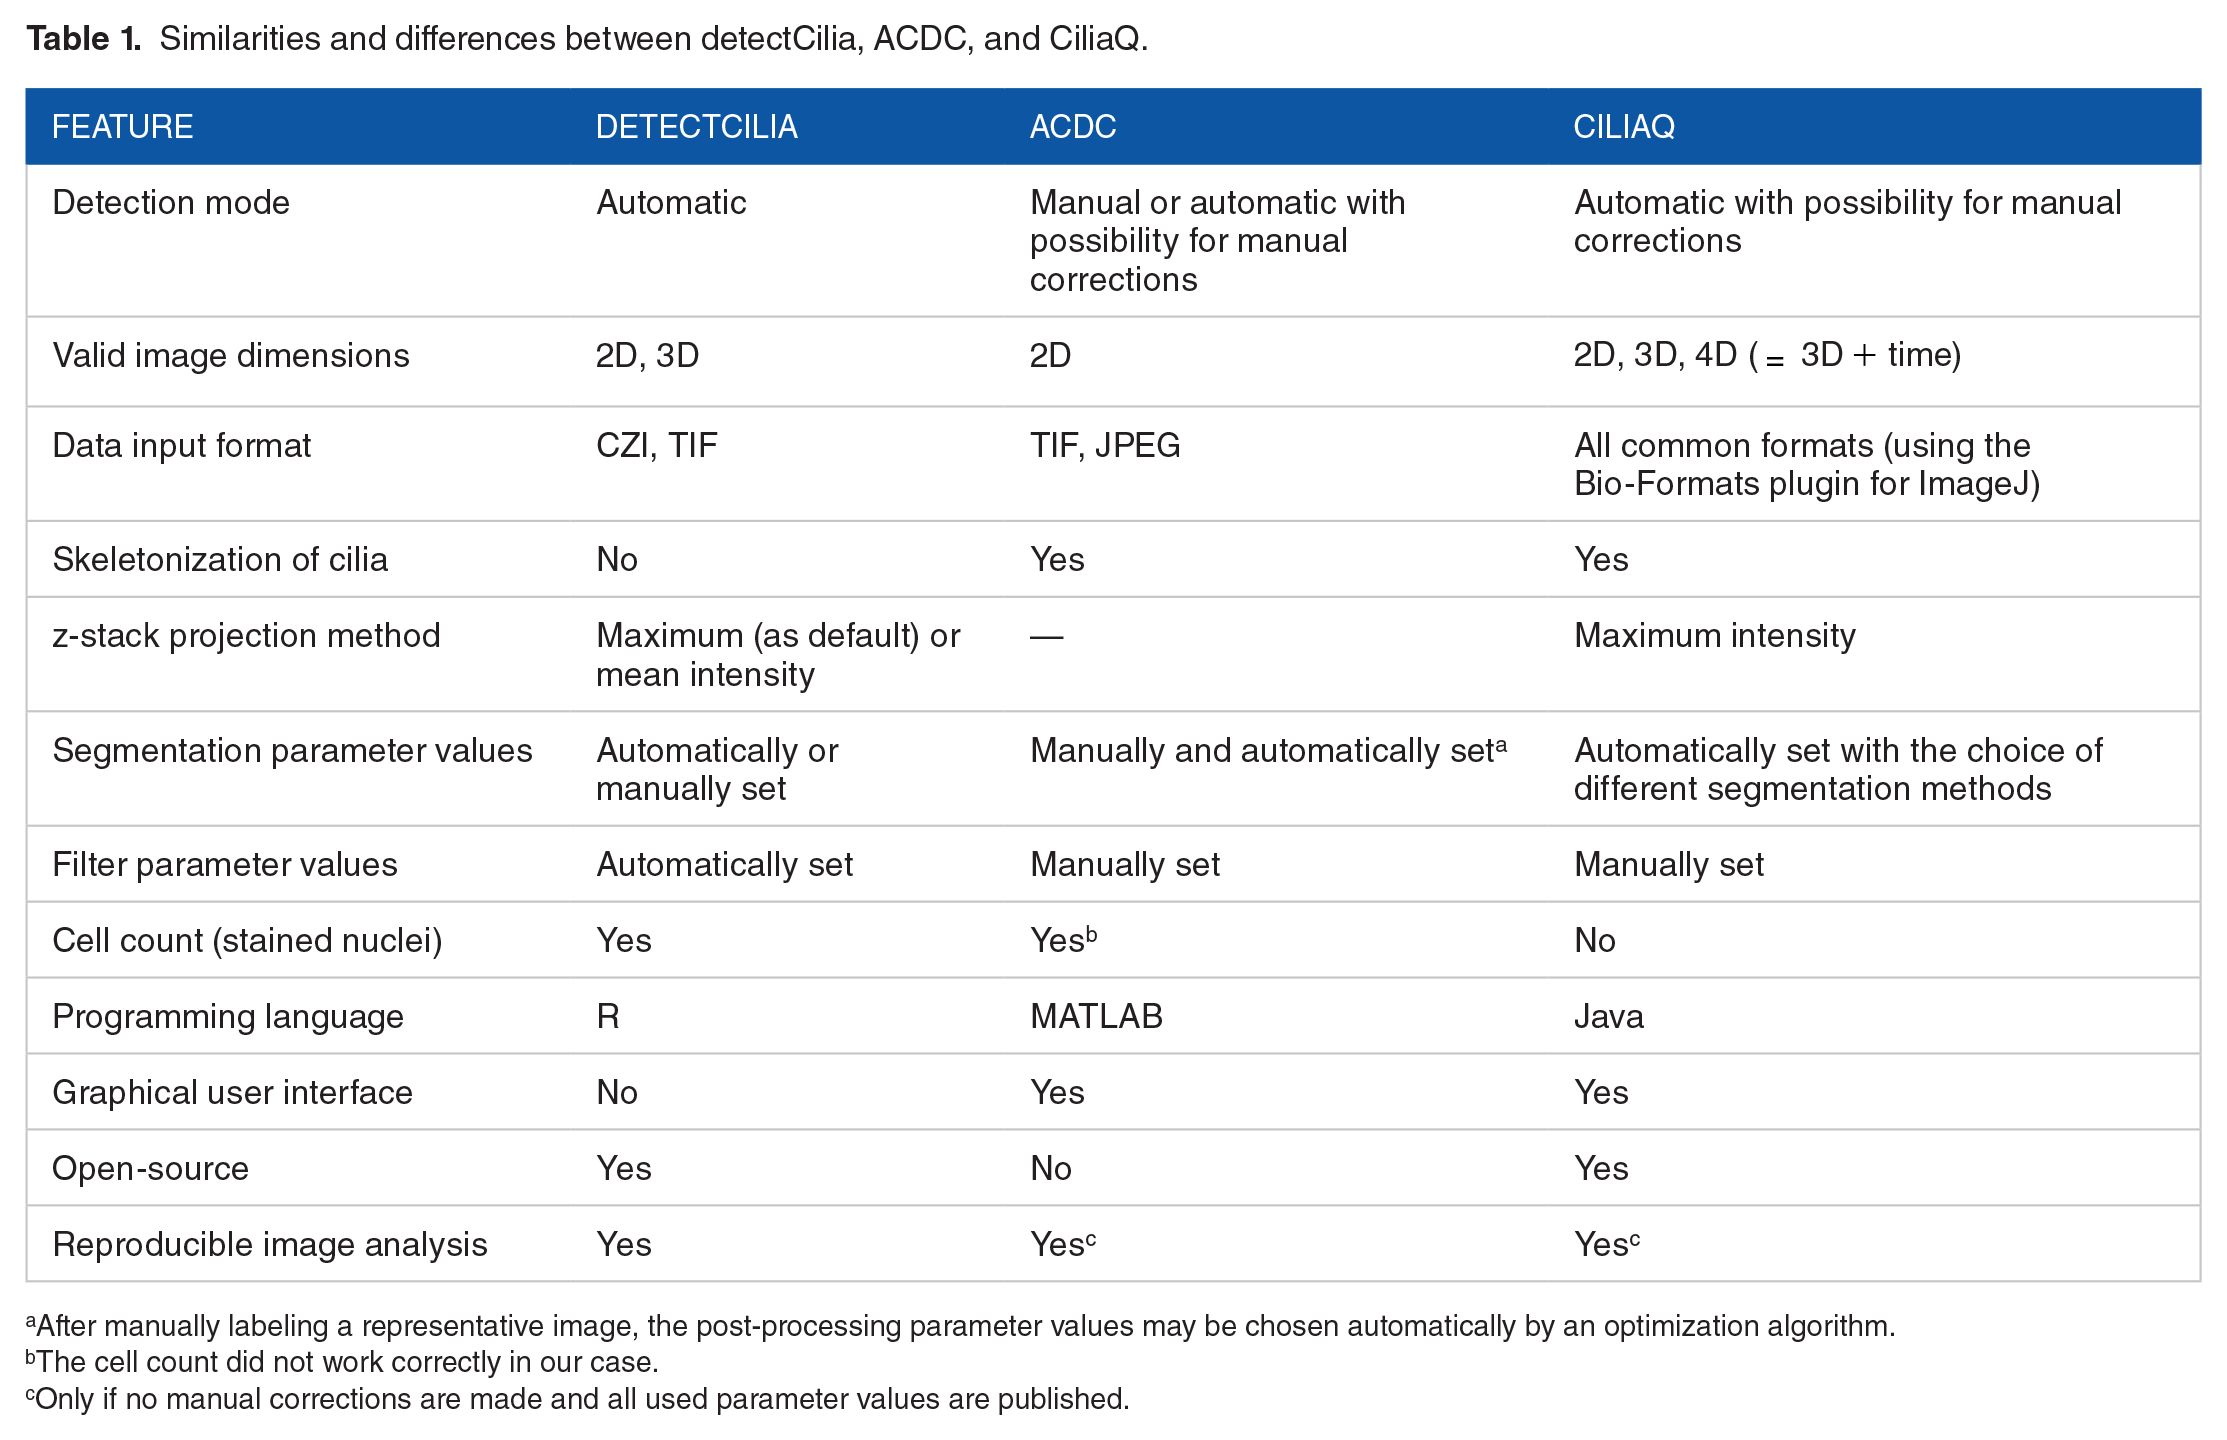
After manually labeling a representative image, the post-processing parameter values may be chosen automatically by an optimization algorithm.
The cell count did not work correctly in our case.
Only if no manual corrections are made and all used parameter values are published.
Although each tool is written in another programming language (ACDC in MATLAB, CiliaQ in Java, and detectCilia in R), the 3 tools use similar methods to detect and measure cilia. They all apply segmentation algorithms using (adaptive) thresholds and some cleaning methods to differentiate between true-positive cilia and false-positive cilia. However, the tools differ in various ways when looking at the details.
The detection of cilia in detectCilia is wholly automated without the requirement of changing default parameter values, although the user may specify all values explicitly. The segmentation thresholds in detectCilia depend upon the number of found nuclei, as 1 primary cilium per cell may occur. Users of CiliaQ may choose among different segmentation methods based on threshold methods implemented in ImageJ, which leads to different results for both the number and length of cilia. The ACDC permits the user to change the parameter length kernel, which influences the number and size of the segmented objects. We observed that a higher length kernel value led to the detection of many short nonciliary objects. Both ACDC and CiliaQ need specific parameter values for filtering the results. These 2 tools also allow manual corrections of the segmented cilia.
detectCilia does not skeletonize the found cilia, thus ignoring possible curvatures and branches of the detected ciliary objects. Instead, it calculates the longest distance of any 2 pixels belonging to the same object in the
Another difference is the usage of open-source software, which enhances transparency, fosters reproducibility, and facilitates its application. Only CiliaQ and detectCilia are open source. Furthermore, ACDC is constrained to 2D images, making estimating the total length difficult. In addition, it uses the same post-processing segmentation parameter values for all images of a set, which requires the same quality for all images.
Some of these differences lead to different degrees of reproducibility because ACDC and CiliaQ will produce reproducible results only when all input parameter values are manually recorded, and no manual corrections are done. Although initially detectCilia might appear less intuitive without a GUI than the other 2 tools, it ensures reproducible results by explicitly recording all (default or manual) input parameter values.
The efficacy of the 3 tools can best be tested with simulated cilia. As ACDC can only work with 2D data, we let the tools determine the horizontal length of a simulated cilium convolved with a 2D Gaussian kernel (Gaussian filter/Gaussian blur), mimicking a microscope’s PSF (see Introduction). The measured lengths depending on the Gaussian filter standard deviations are seen in Figure 3. A Gaussian function has an FWHM of

Simulated cilia with a length of 10 pixels and a width and height of 3 pixels with added Gaussian blur were measured by all 3 tools. (A) and (B) show the results of the horizontal length measurements. In (A), the cilia with added Gaussian blur were detected and measured individually (1 cilium per image). In (B), the images with the blurred cilia were combined; therefore, one image containing all cilia (except for the cilium with an added blur of σ = 5 pixels) was used for detection and measurement. (The cilium number divided by 10 corresponds to the Gaussian blur standard deviation in pixels used for that particular cilium.) The results of CiliaQ are identical for both approaches. (C) Images of the z-stack projection of the simulated cilium with Gaussian blur standard deviation values
When the 50 cilia with Gaussian blur standard deviation values from 0.0 to 4.9 pixels were combined in one image (cf. Supplemental Figure S10), the tools produced slightly different results, as seen in Figure 3B. The results of CiliaQ were identical to the isolated cilia detection. The horizontal lengths determined by ACDC and detectCilia were similar, although detectCilia disregarded all cilia blurred with
The impact of the orientation of a cilium in 3D on the length measurements was also examined. As seen in section “3D length measurement of a c-shaped simulated cilium” of the Supplemental Material, the measured lengths of a c-shaped simulated cilium are similar to the calculated lengths. However, deviations of up to 2 pixels (about 20%) can occur depending on the specific orientation. These discrepancies are primarily attributable to rounding effects in the calculation of voxel positions during the rotation of the cilium.
To estimate the effectiveness of the tools, we compared the detection and measurement results from ACDC, CiliaQ, detectCilia of the 7 test images of the case study (

Results of automatic and manual detection and measurement of cilia in the 7 test images from the ITS with Dexa group. (A) Horizontal length (in pixels) measured in z-stack projection by all 3 tools and 3 raters. (The size of one pixel in
Comparison of manual and automatic cilia detection and measurements
We have used the images
The length of each cilium was manually determined by 3 independent raters (m1, m2, m3) and automatically by the 3 tools. (Rater m3 has used the detected cilia of m2 to measure lengths.) The results are shown in Figure 4. The individual lengths of every detected cilium are presented in Supplemental Figures S4 and S5.
As seen in Figure 4A, the median horizontal lengths of the z-stack projections differ by 0 to 5 pixels between automatic (gray boxes) and manual measurements (white boxes). The median values within the manual detection group differ by 0 to 2 pixels. The largest deviation between manual and automatic results is seen for detectCilia in images 3 and 5. detectCilia occasionally underestimates the length of a cilium when it is darker than most other cilia in an image.
The vertical length measurements also show disagreement among the raters, as shown in Figure 4B. detectCilia accounts for 0 to 2 fewer z-stack layers. The height results could not be compared with the results of CiliaQ as the tool does not save the z-stack layers of a cilium.
As a consequence, the median values of the total lengths are slightly smaller for the detectCilia results compared with the manual measurements, as seen in Figure 4C. On the contrary, CiliaQ has determined the total cilia lengths to be larger compared with the results of the manual raters. Most likely, this is because CiliaQ skeletonizes found cilia and, therefore, incorporates curvatures of cilia which are primarily present in
When a cilium extends for approximately 12 pixels, a deviation by 2 pixels already imposes a large error. Therefore, one could try to minimize the error by using a higher digital resolution. However, a higher sampling rate (lower pixel size) by using a larger frame size, zoom factor, or magnification will not necessarily lead to better results in total because it is not the magnification or frame size that influences the resolving power of the system. 41 As seen in the Introduction, the optical resolution of a microscope depends on the PSF.
With our data of the cilium channel
Case study: influence of medium composition on the cilium length
Human chondrocytes were cultured in different cell culture media to analyze the influence of the medium composition on the lengths of primary cilia. Figure 5 shows the cilia lengths determined by detectCilia depending on the used cell culture medium. The results are summarized in Table 2. Significant differences in the cilia lengths could be observed. Cartilage cells in basal medium with ITS and with or without dexamethasone possessed the longest cilia with a total length of about (3.8 ± 0.1) µm. Significantly shorter cilia were detected in cells cultured in basal medium containing additional ITS, dexamethasone, and the growth factors IGF-1 and TGF-β1 ([3.34 ± 0.08] µm) and in medium containing FBS ([3.18 ± 0.10] µm).
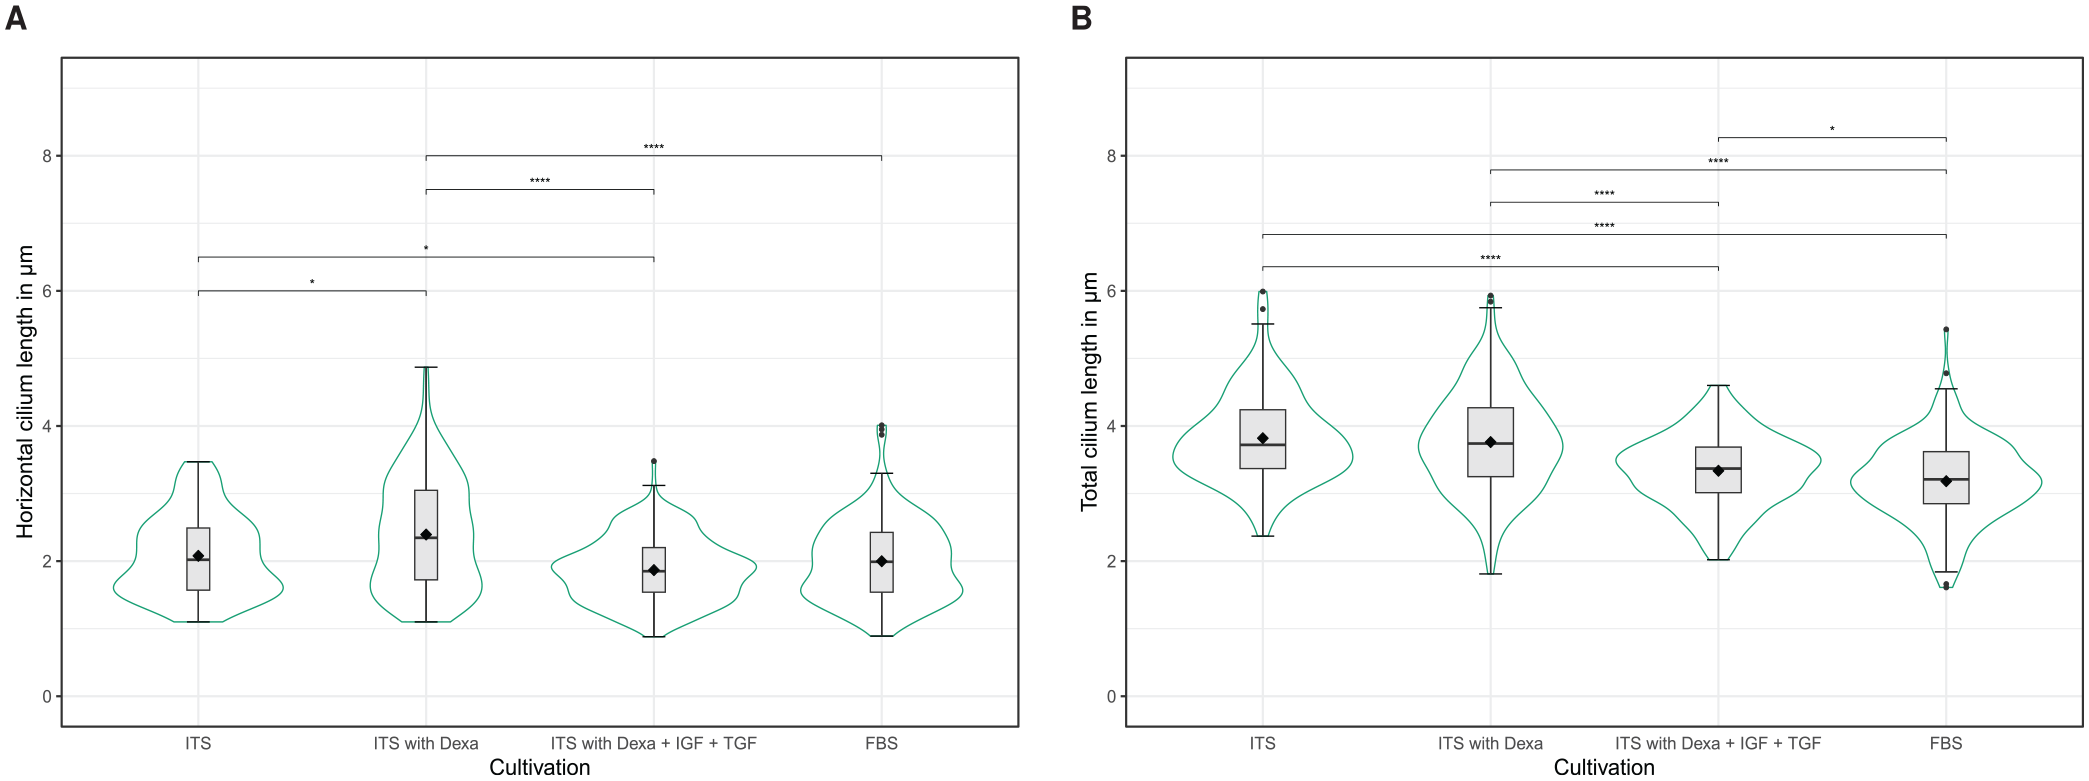
Length of primary cilia measured by detectCilia depending on the media compositions. (A) Horizontal lengths from z-stack projections, (B) total lengths. Box-and-whisker plots, mean values (black diamonds), and violin plots are shown.
Results of the automated detection of primary cilia in 36 images by detectCilia.

The number of used images per group
Interestingly, the number of cells found in the FBS group was about 2 times higher than in the 3 other groups (50 cells instead of 25 cells per image). This shows that FBS has led to enhanced proliferation, which is expected because FBS contains different growth factors and many other compounds that support proliferation.
As seen in Table 3, the assumptions required by detectCilia to automatically detect cilia (see section “R package detectCilia”) were also met. The mean nucleus area was in the order of 15 µm × 15 µm and between 65% and 84% of the cells had primary cilia that were stained and detected.
Comparison of assumptions required by detectCilia and detection results.

The assumptions were nucleus area in the order of 15 μm × 15 μm, cilia projection area between 0.5 μm2 and 5 μm2, and (at most) 1 cilium per cell. Note that cilia touching a z border were included in this table.
We have also evaluated all case study images with the 2 other tools. The measured horizontal cilia lengths determined by the 3 tools are shown in Figure 6A. In all groups, ACDC measured primary cilia to be about 0.5 µm longer than those measured by detectCilia. The results of the horizontal length measurement between detectCilia and CiliaQ were only different in the ITS with Dexa group, which is consistent with our observations from the 7 test images being from the same group. Still, the differences between the experimental groups are similar for all 3 analysis tools (see Supplemental Figure S13 for the manually corrected results and Supplemental Figure S14 for the uncorrected results). The measured total cilia lengths determined by the 2 capable tools are shown in Figure 6B. The ITS with Dexa group stands out again.

Number of detected primary cilia and (A) horizontal lengths as measured by detectCilia, ACDC, and CiliaQ as well as (B) total lengths as measured by detectCilia and CiliaQ depending on the media compositions. Note that cilia detected by detectCilia touching a z border were removed here. Box-and-whisker plots, mean values (blue diamonds), and individual cilia lengths are shown.
Whether the results of ACDC or CiliaQ are closer to the true cilia length cannot be said because the authors of CiliaQ have not compared the results of the tool with manual length measurements but used their tool to correct/edit the cilia masks manually. Similarly, the authors of ACDC have used ACDC for manual detection and measurement. However, it is unclear whether the detected ridge was corrected when necessary.
Another observation was that the number of detected cilia differed between the 3 tools. The concrete results are shown in Table 4. One can observe that detectCilia had the best detection rate for the images of the case studies.
Number of found cilia depending on the tool.

Aut. corresponds to the number of automatically determined cilia by the specific tool. FP stands for the number of false positives, and FN the number of false-negative cilia.
detectCilia found the total lengths of the primary cilia to be between 3 µm and 4 µm. Kunova Bosakova et al 14 observed 3D cilia lengths of human fibroblasts of more than 2 µm, which were elongated after treatment with FGF-2 in a time-dependent manner to more than 3 µm. The exact mode of finding the lengths was not described, but we assume that the authors have fitted a straight line in the tool View5D by Rainer Heintzmann. When just looking at the horizontal lengths (determined in the z-stack projections) as seen in Figure 6A, we obtain results similar to those by Wann and Knight, 24 who found a mean primary cilium length of about 2 µm in chondrocytes. In another study, McGlashan et al 26 reported that the lengths of primary cilia of human chondrocytes ranged from 1.1 µm to 1.5 µm depending on the zonal location within the cartilage tissue.
In the case study, we observed the longest primary cilia in cells cultivated with ITS alone or ITS with dexamethasone. The results of detectCilia showed that the administration of IGF-1 and TGF-β1 to the cell culture medium resulted in a shortening of the cilia compared with ITS with or without the addition of dexamethasone. As it is known that primary chondrocytes in monolayer cell cultures tend to dedifferentiate and thus change toward a fibroblastic phenotype,60 -64 this could explain the different lengths of the primary cilia. In our previous work, we demonstrated that the redifferentiation of human dedifferentiated cartilage cells can be induced by IGF-1 and TGF-β1.62,65,66
In particular, the addition of TGF-β1 could have an impact on the shortening of the cilium length due to the accumulation of receptors at the base of the cilia. A study with human fibroblast cell cultures showed that TGF-β receptors accumulated at the cilia base regions, which were enriched with SMAD4 after ligand stimulation. 10 As a result, the receptors were internalized by endocytosis at the ciliary pocket to activate SMAD2/3. Consequently, this led to a shortening of cilia and a reduction of ciliated cells. 67
In contrast, stimulation with IGF-1 induces the differentiation of human mesenchymal stem cells into adipocytes via an elongation of the primary cilia, which is associated with the recruitment of IGF-1 receptors to the cilia. 29 Dalbay et al 29 stated that an increase in cilia length may be related to the addition of dexamethasone to the differentiation media, which was confirmed by the studies of Forcioli-Conti et al. 30 However, the absence of TGF-β3 in the chondrogenic differentiation medium also increased the ciliary length, whereas the addition of insulin decreased it. 29
The cell culture study showed a decrease in length when FBS, which naturally contains different growth factors, was added to the cultivation medium. 68 Presumably, the large number of undefined factors in FBS might lead to a significant shortening, proving that the concentration and interaction of growth factors have a decisive influence on the fine-tuning of cilia length and the resulting tissue-specific differentiation capacity of the cells.
Conclusions
Primary cilia are involved in various key cell signaling pathways. Alterations in cilium length or incidence can be correlated with the cell type (also regarding [de]differentiation) or ciliopathies. As the length of the primary cilium determines its flexibility and influences its sensitivity to extracellular physical or chemical cues, it is necessary to measure this structure as accurately and as reproducible as possible. As often done, manual evaluation is very time-consuming and not reproducible because human perception differs from person to person, leading to varying results.
Therefore, we have developed the open-source R package detectCilia to detect and measure primary cilia automatically. In contrast to other tools such as ACDC or CiliaQ, the R package does not rely on custom input parameter values but uses metadata of the microscopy image as well as the number of nuclei, which are also detected if stained and distinguishable, to determine threshold parameters. In addition, the possibility of manually changing the input parameter values still exists, which makes detectCilia suitable for detecting any small, distinct objects in confocal microscopy images.
We have tested the R package with straight and curved simulated cilia and compared the results with the 2 cilia detection tools, ACDC and CiliaQ. The length measurements obtained with detectCilia were, in principle, more reliable than those of the other 2 tools in 2D and 3D. In addition, we have used 7 confocal microscopy images of human chondrocytes cultured on collagen-coated glass surfaces in a medium containing ITS with dexamethasone to compare the approaches. Primary cilia were detected and measured manually and with the 3 tools. The results achieved with detectCilia, ACDC, and CiliaQ were in good agreement with the manual measurements. However, detectCilia tended to underestimate the cilium length for some images, and CiliaQ appeared to overestimate the total lengths of cilia. These results show that detectCilia works best when the cilia staining is homogeneous. To reduce the impact of inhomogeneities in the image, we plan to include contextual regions in which cilia are detected independently in the future. In addition, even though we have found that neglecting curvatures of cilia does not distort the length measurements, we plan to include a skeletonization feature to get yet another possibility to determine the cilium length.
In the case study, we intended to analyze the influence of cell culture medium composition on the lengths of primary cilia. Culturing the cells with ITS and with or without dexamethasone led to the longest primary cilia. Adding growth factors or FBS to the medium reduced their lengths. This was true when considering the result of detectCilia. CiliaQ showed a substantial increase in cilium length in the medium containing ITS and dexamethasone and a decrease only in the FBS group. Contrary to this, ACDC found a decrease in the horizontal cilium length only when the growth factors were added to the medium. Strikingly, the false-positive rate was much higher for ACDC and CiliaQ compared with detectCilia when considering the cilia detection results of all case study images. As the results of all 3 tools do not exactly match and the sample size is too small, we cannot say which tool deviates the least from the true cilia lengths. Therefore, we may only conclude that incubating with growth factors (serum-free or included in FBS) may shorten primary cilia of human nondegenerative chondrocytes within 3 days of cultivation. In the future, we will use more samples from different donors to investigate whether our findings are generalizable.
As detectCilia led to good and easily reproducible results even if the signal-to-noise ratio was low (cf. Supplemental Figure S3), we find it to be a reliable tool. Still, face validation should be done for all tools to at least exclude nonciliary objects (false positives). In conclusion, detectCilia offers a good opportunity to detect and measure primary cilia automatically and could be used in further studies to examine mechanisms of this structure or to derive specific stimulation parameters (eg, for the regeneration of cartilage tissue).
Supplemental Material
sj-pdf-1-bbi-10.1177_11779322241280431 – Supplemental material for detectCilia: An R Package for Automated Detection and Length Measurement of Primary Cilia
Supplemental material, sj-pdf-1-bbi-10.1177_11779322241280431 for detectCilia: An R Package for Automated Detection and Length Measurement of Primary Cilia by Kai Budde-Sagert, Simone Krueger, Clemens Sehlke, Heiko Lemcke, Anika Jonitz-Heincke, Robert David, Rainer Bader and Adelinde M Uhrmacher in Bioinformatics and Biology Insights
Footnotes
Author Contributions
Declaration of conflicting interests:
The author(s) declared no potential conflicts of interest with respect to the research, authorship, and/or publication of this article.
Funding:
The author(s) disclosed receipt of the following financial support for the research, authorship, and/or publication of this article: This research was supported by the Deutsche Forschungsgemeinschaft (DFG, German Research Foundation) (grant no. SFB 1270/1&2—299150580: KB-S, SK, CS).
Data Availability
The developed R package detectCilia is available on GitHub (https://github.com/SFB-ELAINE/detectCilia).
69
All main microscopy image files can be found in Zenodo.
70
In addition, the microscopy image files used in section “Impact of the pixel size on detectCilia results” of the Supplemental Material can also be found in Zenodo.
71
The R script to reproduce the results of this publication is found in another GitHub repository (![]() ). The analysis workflow utilizes the following R packages (or package collections): coin (v1.4-2),
72
devEMF (v4.1-2),
73
EnvStats (v2.7.0),
74
ggbeeswarm (v0.7.1),
75
ggpubr (v0.5.0),
76
rquery (v1.4.9),
77
rstatix (v0.7.1),
78
scales (v1.2.1),
79
and tidyverse (v1.3.2).
80
). The analysis workflow utilizes the following R packages (or package collections): coin (v1.4-2),
72
devEMF (v4.1-2),
73
EnvStats (v2.7.0),
74
ggbeeswarm (v0.7.1),
75
ggpubr (v0.5.0),
76
rquery (v1.4.9),
77
rstatix (v0.7.1),
78
scales (v1.2.1),
79
and tidyverse (v1.3.2).
80
Supplemental Material
Supplemental material for this article is available online.
References
Supplementary Material
Please find the following supplemental material available below.
For Open Access articles published under a Creative Commons License, all supplemental material carries the same license as the article it is associated with.
For non-Open Access articles published, all supplemental material carries a non-exclusive license, and permission requests for re-use of supplemental material or any part of supplemental material shall be sent directly to the copyright owner as specified in the copyright notice associated with the article.