
Abstract
Plasmodium falciparum Apicomplexan Apetala 2 Invasion (PfAP2-I) transcription factor (TF) is a protein that regulates the expression of a subset of gene families involved in P. falciparum red blood cell (RBC) invasion. Inhibiting PfAP2-I TF with small molecules represents a potential new antimalarial therapeutic target to combat drug resistance, which this study aims to achieve. The 3D model structure of PfAP2-I was predicted ab initio using ROBETTA prediction tool and was validated using Save server 6.0 and MolProbity. Computed Atlas of Surface Topography of proteins (CASTp) 3.0 was used to predict the active sites of the PfAP2-I modeled structure. Pharmacophore modeling of the control ligand and PfAP2-I modeled structure was carried out using the Pharmit server to obtain several compounds used for molecular docking analysis. Molecular docking and postdocking studies were conducted using AutoDock vina and Discovery studio. The designed ligands’ toxicity predictions and in silico drug-likeness were performed using the SwissADME predictor and OSIRIS Property Explorer. The modeled protein structure from the ROBETTA showed a validation result of 96.827 for ERRAT, 90.2% of the amino acid residues in the most favored region for the Ramachandran plot, and MolProbity score of 1.30 in the 98th percentile. Five (5) best hit compounds from molecular docking analysis were selected based on their binding affinity (between −8.9 and −11.7 Kcal/mol) to the active site of PfAP2-I and were considered for postdocking studies. For the absorption, distribution, metabolism, elimination, and toxicity (ADMET) properties, compound MCULE-7146940834 had the highest drug score (0.63) and drug-likeness (6.76). MCULE-7146940834 maintained a stable conformation within the flexible protein’s active site during simulation. The good, estimated binding energies, drug-likeness, drug score, and molecular dynamics simulation interaction observed for MCULE-7146940834 against PfAP2-I show that MCULE-7146940834 can be considered a lead candidate for PfAP2-I inhibition. Experimental validations should be carried out to ascertain the efficacy of these predicted best hit compounds.
Keywords
Background
Despite tremendous advances in understanding malaria epidemiology and the availability of several therapeutic options, malaria remains one of the leading global causes of death, with children accounting for a large proportion of those affected. 1 Many antimalarial drugs have been produced over the years, but resistance has been observed against most, including chloroquine, pyrimethamine, and proguanil. 2 Recent treatment failures with artemisinin-based combination therapy (ACT) have raised concerns about the loss of the highly effective treatment currently available to treat malaria. 3 The licensed antimalarial drug’s poor efficacy, combined with the spread of antimalarial drug resistance, necessitates the development of an innovative strategy to identify novel antimalarial compounds. 4
In silico techniques have been successful and have become powerful tools in the search to cure diseases, 5 reducing the use of animal models in pharmacological research, assisting in the rational design of novel and safe drug candidates, and repositioning marketed drugs. 6 They are vital in identifying viable therapeutic candidates at a low cost and time by using sophisticated computers and information technology to speed up drug discovery, lead optimization, drug development, and design. 7 In silico methods such as molecular dynamics (MD) simulations, molecular docking, drug-likeness prediction, and ADMET (absorption, distribution, metabolism, elimination, and toxicity) studies are used to screen candidate drugs/molecules from various databases/libraries. 7 These in silico methods have been proposed to recognize and select therapeutic relevant targets, study the molecular basis of drug-receptor complexes interactions, structurally characterize ligand-binding sites on biological targets, design de novo target-specific compound libraries, predict target protein structure, identify hit compounds by ligand- and structure-based virtual screening, estimate binding free energy between a ligand and receptor, and optimize high-affinity ligands. 8
The idea of targeting transcription and transcription factors (TFs) for drug therapy was long considered a “Sisyphean task,” but recent work in drug discovery has shown the direct modulation of TF function by small molecules.9-11 Transcription factors are proteins that bind to DNA sequences and control the stream of genetic information from DNA to mRNA. 12 Transcription factors, along with other proteins in a complex, control P. falciparum gene expression by promoting (activator) or blocking (repressor) the recruitment of RNA polymerase to specific genes during the intra-erythrocytic development cycle (IDC) in the red blood cells (RBCs).13,14 In antimalarial drug design, TFs as drug targets have enormous potential to be drug resistance free because targeting TFs affects many genes instead of one gene for enzymatic site-based drugs. 11 One of such essential TFs found across the different Plasmodium spp is the Apetala 2—Invasion (AP2-I) TF (a member of the Apicomplexan Apetala 2 (ApiAP2) TF). P. falciparum Apetala 2—Invasion (PfAP2-I) TF is a 183 kDa protein located on chromosome 10 of the Plasmodium genome whose primary function is to regulate RBC invasion genes. 15 P. falciparum Apetala 2—Invasion also targets promoters of nucleosome- and chromatin-related genes, cell-cycle-related genes, and genes associated with vesicle transport and host-cell remodeling.14,16 It contains 3 AP2 domains, and only the third AP2 domain is essential for regulating a subset of genes involved in RBC Invasion15,16 (Campbell et al 15 ; PfAP2-I is associated with several chromatin-associated proteins, including the Plasmodium bromodomain protein 1 (PfBDP1)), and that complex formation is related to transcriptional regulation. P. falciparum Apetala 2—Invasion represents a potential new antimalarial therapeutic target as a critical regulator of RBC invasion. 17 It is essential to study and understand its functioning and determine drugs that can inhibit its activity for disrupting the parasite cycle in the human host and for designing effective therapies that can augment the efficacies of existing antimalarials. This study aims to identify small molecules with inhibitory potential against AP2-I regulatory action in P. falciparum.
Methods
PfAP2-I structure prediction
The structure of PfAP2-I was modeled ab initio because there is a lack of experimentally validated structure for PfAP2-I in the Protein Data Bank (PDB) 18 as well as the UniProt database (UniProtKB). 19 The protein ID of the target (PfAP2-I 3D7 strain) was retrieved from the National Center for Biotechnology Information (NCBI) with the accession number P3D7_1007700. Afterward, the protein ID was submitted to the SWISS-MODEL web server 20 to develop a homology model with sufficient query sequence coverage and sequence identity. The confident match to a protein of known structure was below 40%, so comparative modeling of PfAP2-I could not be done. P. falciparum Apetala 2—Invasion was then synthesized on both the I-TASSER server (http://zhanglab.dcmb.med.umich.edu/I-TASSER) 21 and ROBETTA Baker server (http://robetta.bakerlab.org) 22 using RoseTTAFold. RoseTTAFold is the default option that uses a deep learning-based modeling method. This method outperforms every other way for protein structure modeling on the ROBETTA Baker server. The most reliable three-dimensional (3D) structure was selected based on the confidence value. The confidence values are usually between 0.00 (bad) and 1.00 (good), and the higher the number, the higher the reliability of the predicted structure. The AlphaFold-predicted structure of PfAP2-I is available on UniProt (www.beta.uniprot.org/uniprotkb/Q8IJW6/entry) and was compared with the predicted structure results from the I-TASSER server and ROBETTA Baker server.
Structure validation of modeled protein
PROCHECK23,24 and ERRAT 25 on UCLA-DOE LAB—SAVES v6.0 was used to check for the quality of the modeled 3D structure of PfAP2-I generated on the I-TASSER and ROBETTA Baker Laboratory. The .pdb file format of the modeled PfAP2-I was uploaded on the UCLA-DOE LAB—SAVES v6.0 site to obtain the overall quality factor from ERRAT and Ramachandran plot statistics from PROCHECK. The overall quality factor of a protein structure is expressed as the percentage of protein for which the calculated error value falls below the 95% rejection limit. Good high-resolution structures usually produce values around 95% or higher. 26
The Ramachandran plot is used to access a modeled protein’s quality or an experimental structure. The Ramachandran plot statistics provide information on the total number of amino acid residues found in the favorable, allowed, and disallowed regions. 24 The prioritized PfAP2-I 3D modeled structure from the ROBETTA Baker server and I-TASSER structure prediction and the AlphaFold-predicted structure of PfAP2-I retrieved from UniProt were subjected to further structure validation using MolProbity 27 to determine the quality of prediction.
Active site prediction of AP2-I modeled structure
The active sites of modeled PfAP2-I 3D7 structure were predicted using the Computed Atlas of Surface Topography of proteins (CASTp) 3.0 28 and ConCavity. 29 The CASTp is an online service for identifying, defining, and quantifying certain geometric and topological features of protein structures such as surface pockets, interior cavities, and cross-channels. 30 ConCavity is an online service used for predicting protein-ligand-binding sites by combining evolutionary sequence conservation and 3D structure and works based on a confidentiality score (C-score). C-score is a confidence score of the predicted binding site. C-score values range from 0 to 1, where a higher score indicates a more reliable prediction. The modeled AP2-I 3D structure was submitted on the server in .pdb format. The necessary amino acids for binding interactions predicted by the 2 servers were compared to determine the similarity between the 2 predicted active sites.
Pharmacophore-based virtual screening
Pharmacophore-based virtual screening was designed using Pharmit server. 31 Pharmit server is a collection of built-in databases such as Molprot, ChEMBL, ZINC, and PubChem. It contains millions of chemical compounds that can be used to screen drug-like compounds against a given protein. 32 The Pharmit server is based on a pharmacophore model using the AutoDock Vina scoring function. 33 A control ligand (3 W7 from the COACH server) was selected for screening, 34 and both the modeled protein and control ligand were loaded into the Pharmit Server. The pharmacophore model was built using 6 features (Supplementary Table 1). The Pharmit filters hit screening for the pharmacophore modeling were set using the Lipinski rule of 5 and Veber’s rule to minimize the results significantly and obtain the best possible inhibitors out of millions of drug-like compounds (Supplementary Table 1).
Protein and ligand preparation for molecular docking analysis
The modeled protein structure was defined as a receptor, while the complexed ligands were removed using Chimera software. 35 Furthermore, the protein was prepared by computing Gasteiger charges, adding polar hydrogens, and merging the nonpolar hydrogens using AutoDockTools 4.2.6. 36 In addition, OpenBabel software 37 was used to convert the .pdb files to the AutoDock docking format (.pdbqt), which was further used for the docking simulation.
Molecular docking analysis
Molecular docking of compounds against the active sites of PfAP2-I was carried out using AutoDock Vina, an accessible graphical user interface (GUI) for the AutoDock 4.2 program. 38 The grid box was constructed using 80, 80, and 80 pointing in the x, y, and z directions, respectively, with a grid point spacing of 0.375 A. The center grid box was set at –29.495, 57.365, and 45.252 A around the amino acid residues in the active site of PfAP2-I. Five (5) hits were then generated and ranked according to their binding affinities to verify the ligand-binding sites and postdocking analysis of the hit compounds was conducted using Discovery studio. 39
In silico drug-likeness and toxicity predictions
The in-silico drug-likeness and toxicity predictions of the designed ligands were carried out using the SwissADME predictor 40 and OSIRIS Property Explorer. 41 SwissADME predictor provides information on the physicochemical properties, lipophilicity, water solubility, pharmacokinetics, drug-likeness, and medicinal chemistry of the compounds. 42 OSIRIS Property Explorer program, on the other hand, provides information on a compound’s toxicity and determines parameters such as molecular weight, consensus lipophilicity (cLogP), total polar surface area (TPSA), solubility, drug-likeness, drug score, as well as the mutagenic, tumorigenic, irritant, and reproductive risks. 43 Drug-likeness is a criterion for determining if a pharmacological substance possesses the characteristics of an orally active drug. 44 The Lipinski rule of 5 is an established concept based on drug-likeness. The law states that for a compound to exhibit drug-likeness and to avoid poor absorption or permeation, the combination must not possess more than 5 H-bond donors, more than 10 H-bond acceptors, molecular weight must not be greater than 500, and the calculated LogP (cLogP) must not be greater than 5. 45 Another parameter used to select compounds as drug candidates are drug score. A high drug score value signifies a high probability of the compound being considered a drug candidate. 46
Molecular dynamic simulation of the best hit compound
Molecular Operating Environment (MOE) 2019.01 software simulation module was used to carry out the molecular dynamic simulation of the best hit compound.47,48 The protein and protein-ligand complex were protonated, the energy was minimized, and the AMBER 10: EHT force-field was parameterized at various times to get the stable conformer of the protein-ligand complex in an R-Field implicit solvation system. 48 The simulations required 3 steps. The initial step requires the molecular system to be heated to 310 K (37°C), followed by a 100-picosecond equilibration step at 310 K (37°C). The trajectory of the molecular system was then generated using the Nose–Poincare–Andersen (NPA) algorithm at 310 K for 1000 picoseconds (the time step of each simulation was set to 0.02 picoseconds). Visual molecular dynamics (VDM) software and Bio3D on the Galaxy Europe platform were used for visualizations and data processing. Principal components analysis (PCA) was used to model the system’s key dynamics. 49 The simulation data set was reduced to a few essential components that define the directions with the most variance. The critical structural variants within the ensemble of protein structures were captured by ordering the principal components as eigenvectors based on the variance. The fraction of variance attributed to each principal component was visualized using an eigenvalue rank plot. The structural clustering based on the principal derived components, and residue-wise loadings were then used to determine how much each residue contributed to the first 2 principal components.
Results
PfAP2-I structure prediction
P. falciparum Apetala 2—Invasion structure prediction result from the I-TASSER server shows 4 predicted models. The models were predicted based on C-score, Exp. TM-Score, Exp.RMSD, No. of decoys, and Cluster density, and the result for each model are shown in Supplementary Table 2. P. falciparum Apetala 2—Invasion structure prediction result from the ROBETTA Baker server showed 5 predicted models using RoseTTAFold, and model 1 (1) (Figure 1A) was prioritized based on its highest C-score. The AlphaFold-predicted structure of PfAP2-I was retrieved from UniProt (www.beta.uniprot.org/uniprotkb/Q8IJW6/entry) (Figure 1B). These 3 predicted structures from the I-TASSER server, ROBETTA Baker server, and AlphaFold were subjected to structure validation to determine the best-predicted structure.

3D modeled structure of PfAP2-I TF from (A) ROBETTA Baker server and (B) AlphaFold-predicted structure of PfAP2-I TF from UniProt.
Structure validation of modeled proteins
P. falciparum Apetala 2—Invasion 3D structure from the I-TASSER server and ROBETTA Baker server were validated using ERRAT and PROCHECK on UCLA-DOE LAB—SAVES v6.0. Model 1 from the ROBETTA Baker server showed the best result after validation. ERRAT value for model 1 from the ROBETTA Baker server was 96.827. Good resolution values are usually around 95% or higher (Figure 2). The Ramachandran plot statistics of model 1 from ROBETTA Baker server showed 90.2% of its residues in the most favored regions, 8.5% of its residues in additional allowed regions, 0.4% of its residues in the generously allowed regions, and 0.9% of its residues in disallowed regions of the Ramachandran plot. A good quality model is expected to have 90% of its residues in the most favored region (Figure 3). Model 1 from the ROBETTA Baker server and the AlphaFold-predicted structure of PfAP2-I were subjected to further structure validation using MolProbity (www.molprobity.manchester.ac.uk). The predicted structure from the ROBETTA Baker server showed a better result than the AlphaFold-predicted structure of PfAP2-I (Tables 1 and 2 and Supplementary Table 3).
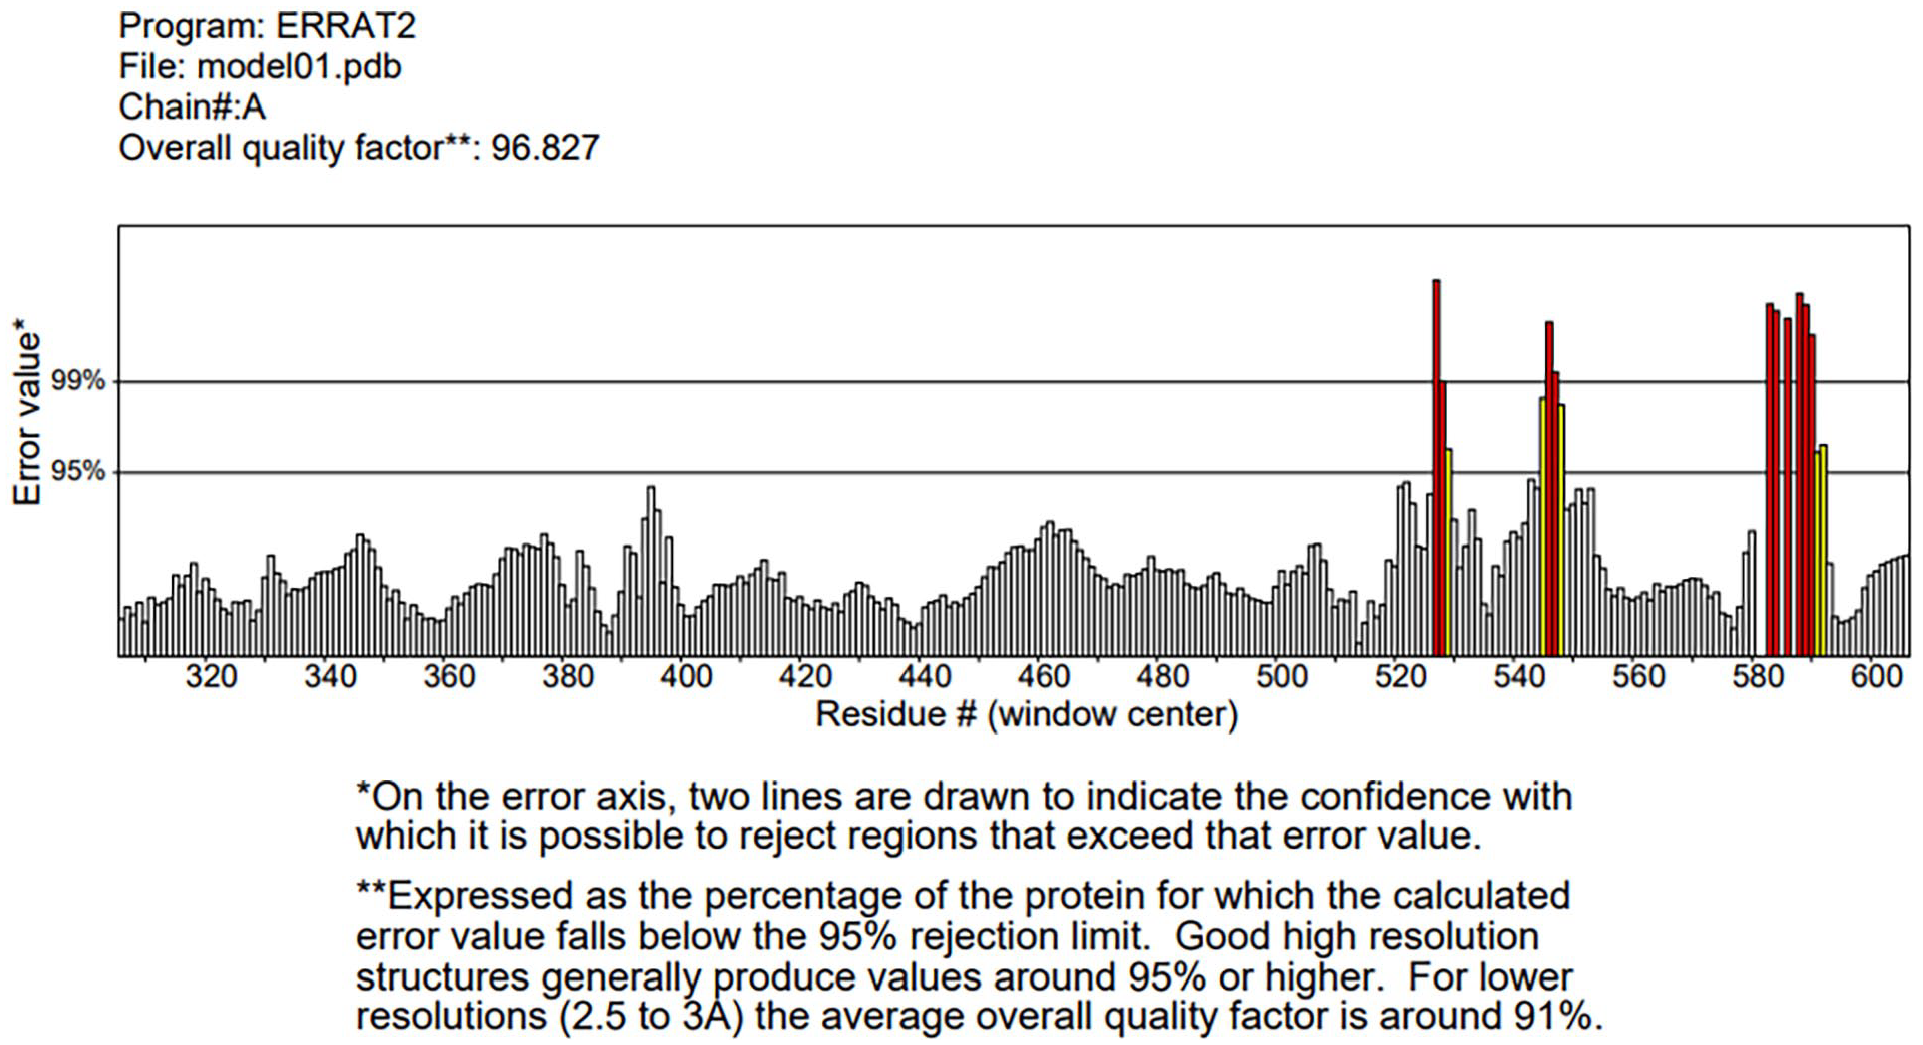
ERRAT structure validation value of PfAP2-I-modeled structure.

Ramachandran plot statistic validation of PfAP2-I-modeled structure.
Summary statistics of MolProbity structure validation analysis output for PfAP2-I RoseTTAFold-predicted structure from Robetta Baker server.

Abbreviation: PfAP2-I, P. falciparum Apicomplexan Apetala 2 Invasion.
In the 2 column results, the left column gives the raw count, right column gives the percentage.
The green region signifies good, the yellow region signifies caution and the red region signifies warning.
100th percentile is the best among structures of comparable resolution; 0th percentile is the worst.
MolProbity score combines the clashscore, rotamer, and Ramachandran evaluations into a single score, normalized to be on the same scale as X-ray resolution.
Summary statistics of MolProbity structure validation analysis output for PfAP2-I AlphaFold-predicted structure.

Abbreviation: PfAP2-I, P. falciparum Apicomplexan Apetala 2 Invasion.
In the 2 column results, the left column gives the raw count, and the right column gives the percentage.
The green region signifies good, the yellow region signifies caution and the red region signifies warning.
100th percentile is the best among structures of comparable resolution; the 0th percentile is the worst.
MolProbity score combines the clashscore, rotamer, and Ramachandran evaluations into a single score, normalized to be on the same scale as X-ray resolution.
Active site prediction of AP2-I-modeled structure
Using CASTp 3.0 active site prediction tool, a total of 102 pockets were generated, and pocket ID 1 with an area (SA) of 15 407.119 and a volume (SA) of 13 411.050 (Figure 4) was selected as the preferred active site for the docking analysis. The amino acid residues in pocket ID 1 are listed in Supplementary Table 4.
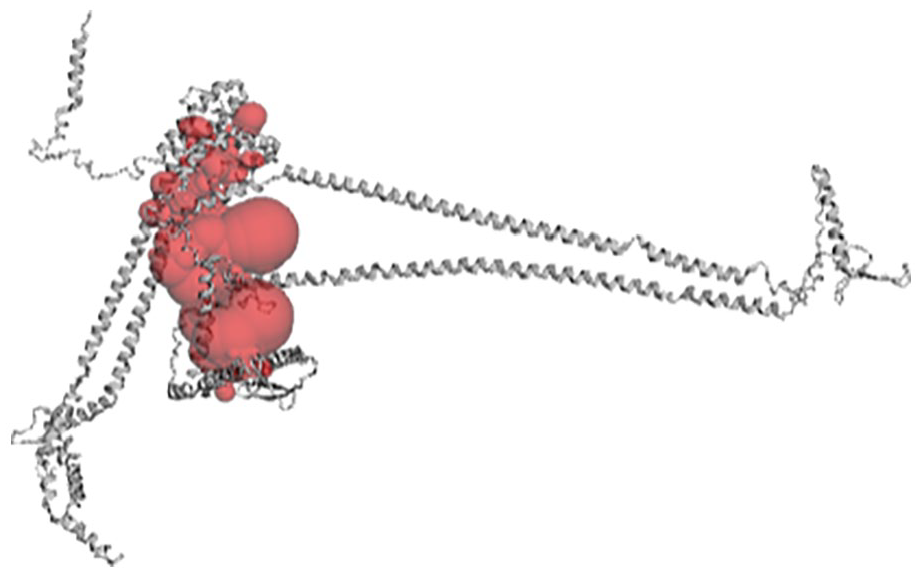
The binding pocket of 3D structure PfAP2-I as computed by CASTp 3.0.
Pharmacophore-based virtual screening and molecular docking analysis
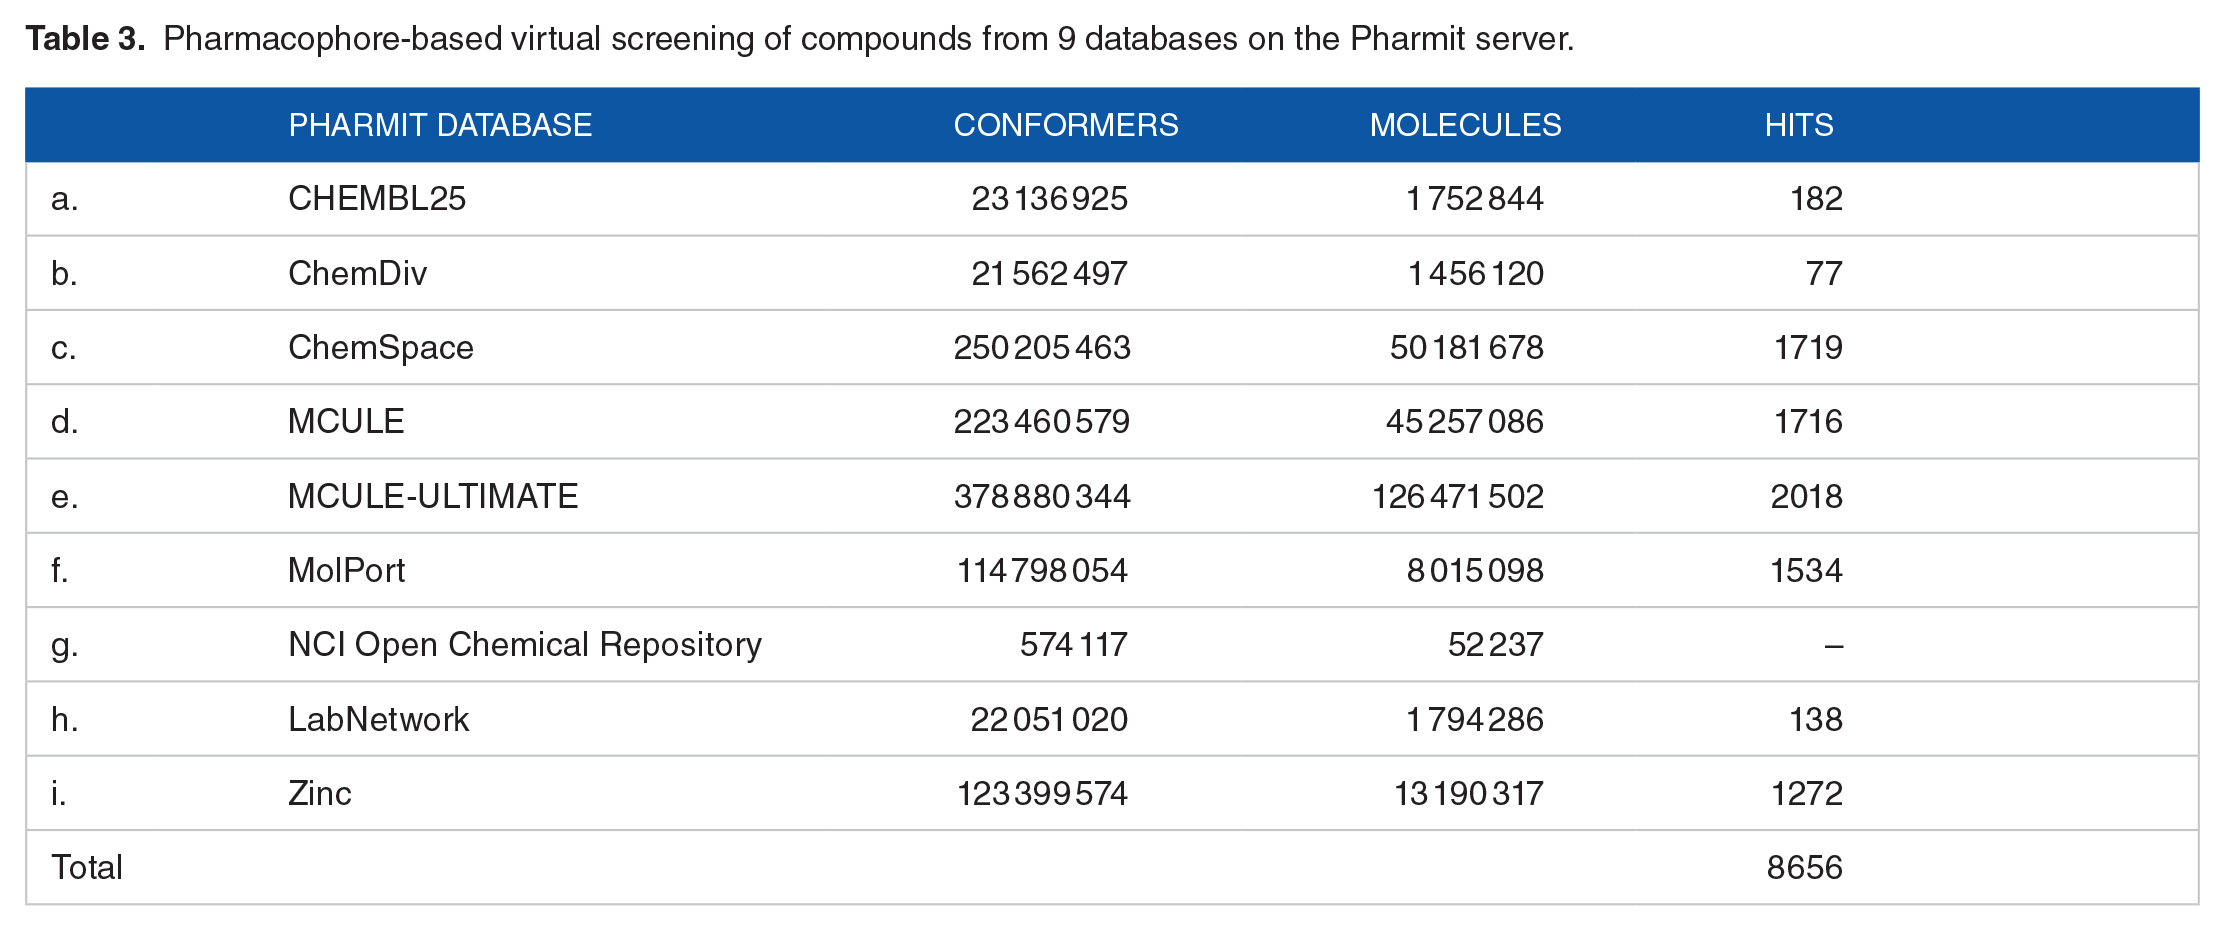
Hit screening of drug-like compounds from 9 databases (Chemble, ChemDiv, ChemSpace, MCULE, MCULE-ULTIMATE, MolPort, NCI open repository, Lab Network, Zinc) on the Pharmit Server Engine gave a total of 8115 drug-like compounds (Table 3) that were used for the docking analysis including the reference compound (CHEMBL3359262) and the standard drug (chloroquine). Five (5) compounds were identified based on the high-ranked auto-dock score from the docking analysis (Table 4). The chemical structure and IUPAC name of the 5 selected hit compounds against the PfAP2-I active site are shown in Table 5.
Pharmacophore-based virtual screening of compounds from 9 databases on the Pharmit server.
Five selected hit compounds from the Pharmit server ranked based on the auto-dock score against PfAP2-I active site.
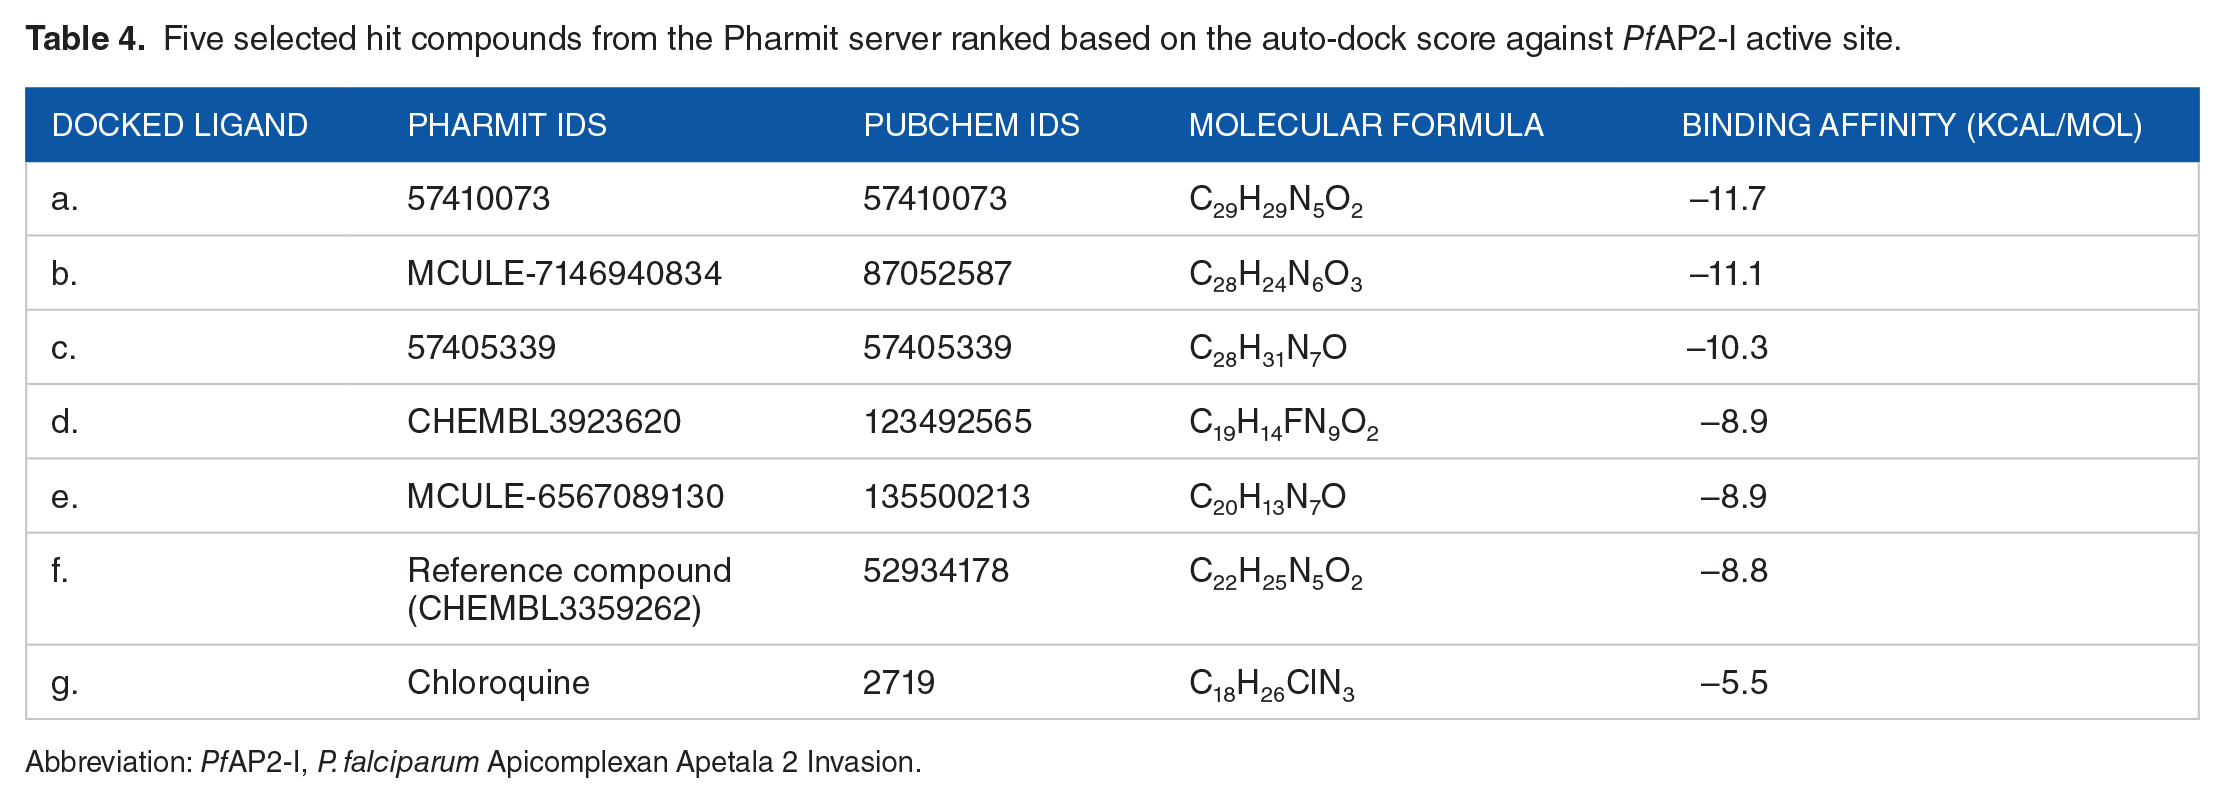
Abbreviation: PfAP2-I, P. falciparum Apicomplexan Apetala 2 Invasion.
The Pharmit ID, PubChem ID, Chemical structure, and Compound name of the 5 selected hit compounds against PfAP2-I active site.

Abbreviation: PfAP2-I, P. falciparum Apicomplexan Apetala 2 Invasion.
Post-docking analysis
The 5 selected hit compounds from the molecular docking were subjected to postdocking analysis using Discovery studio. The 2D and 3D model interaction between the compounds and PfAP2-I are shown in Figure 5.

2D and 3D model interactions between the 5 selected hit compounds and PfAP2-I using Discovery studio. The nature of protein-ligand interactions is shown with different color legends: (A) 57410073, (B) MCULE-7146940834, (C) 57405339, (D) CHEMBL3923620, and (E) MCULE-6567089130.
In silico drug-likeness and toxicity predictions
Absorption, distribution, metabolism, elimination, and toxicity screening and toxicity testing results of the hit compounds including that of the reference compound (CHEMBL3359262) and standard drug (chloroquine) are shown in Tables 6 and 7, while their oral bioavailability radar are shown in Figure 6.
SwissADME prediction of ADME properties of 6 compounds in comparison with chloroquin.

Abbreviations: ADME, absorption, distribution, metabolism, elimination; BBB, Blood-Brain Barrier; cLogP, consensus lipophilicity; GI, gastrointestinal; NHA, hydrogen bond acceptors; NHD, hydrogen bond donors; NRB, numbers of rotatable bond.
OSIRIS property explorer prediction of physicochemical properties and toxicity risks of 6 compounds in comparison with chloroquine.

Abbreviation: TPSA, total polar surface area.

Oral bioavailability radar of the 6 best hits vis-à-vis the reference compound and chloroquine using SwissADME prediction: (A) 57410073, (B) MCULE-7146940834, (C) 57405339, (D) CHEMBL3923620, and (E) MCULE-6567089130. The colored zone is the suitable physicochemical space for oral bioavailability. LIPO(Lipophilicity): –0.7 < XLOGP3 < 5.0, SIZE: 150 g/mol < MW < 500 g/mol, POLAR(Polarity): 20 Å2 < TPSA < 130 Å2, INSOLU(Insolubility): –6 < Log S (ESOL) < 0, INSATU (Insaturation): 0.25 < Fraction Csp3 < 1, FLEX (Flexibility): 0 < Number of rotatable bonds < 9.
Molecular dynamic simulation of the lead compound
The molecular dynamic simulation results of the lead compound MCULE-7146940834 are represented in Figures 7 and 8. The root mean square deviation (RMSD) plot, the RMSD histogram, and the Root Mean Square fluctuation (RMSF) plot are all shown in Figure 7. A stable fluctuation between 0.020 and 0.035 Å after an initial rise from 0.00 Å was observed for the RMSD (Figure 7A). Oscillations around positions 400, 920, and 1020 were observed for the RMSF (Figure 7B). The PCA plot, PCA cluster plot, and Principal components 1 (PC1) on RMSF are shown in Figure 8. PC2 versus PC1, PC2 versus PC3, and PC3 versus PC1 graphs, an eigenvalue rank plot (a and b), and the result of residue-wise loadings are included in the PCA plot and the PCA cluster plot. The cumulative variance is labeled for each data point in the eigenvalue plot. The first principal component (PC1) accounts for 8.75% of the overall variance, while the first 3 principal components account for 21.37% of the variance, according to the findings. Along the PC planes, a continuous color from blue to white to red was achieved (Figure 8A). Through the top 3 PC1, PC2, and PC3 spaces, the trajectory snapshots were divided into 2 different clusters of the hues black and red (Figure 8B). High peaks on residues 920 and 1020 can be seen in the results of residue-wise loadings for PC1 (black) and PC2 (blue) (Figure 8C).

(A) RMSD time series and histogram for the interaction between MCULE-7146940834 and the active site of PfAP2-I. (B) PfAP2-I RMSF (Å) plot against the residue position.

PCA results, comprising graphs of PC2 vs PC1, PC2 vs PC3, PC3 vs PC1, and an eigenvalue rank plot with the cumulative variance annotated for each data point. (A) PCA plots colored from blue to red in order of time; (B) PCA plots showing 2 different clusters colored black and red. (C) Residue-wise loadings for PC1 (black) and PC2 (blue).
Discussion
This study presents a predicted 3D structure of PfAP2-I (Figure 1) and molecular docking analysis to determine small molecule inhibitors against PfAP2-I TF. The result of the modeled protein structure from the ROBETTA server 22 was prioritized based on structure validation results of 96.827 for ERRAT (Figure 2), 90.2% of the amino acid residues in the most favored region for the Ramachandran plot statistics 24 (Figure 3), and MolProbity score of 1.30 in the 98th percentile as well as a clashscore of 1.93 in the 99th percentile 27 (Tables 1 and 2). Pocket ID 1 (Figure 4) was selected as the preferred active site for the docking analysis. Molecular docking analysis of 8656 compounds generated from pharmacophore-based virtual screening of drug-like compounds from 9 databases (Chemble, ChemDiv, ChemSpace, MCULE, MCULE-ULTIMATE, MolPort, NCI open repository, Lab Network, Zinc) on the Pharmit Server Engine was carried out to determine the inhibitory potential of small molecules against PfAP2-I TF 33 (Table 3). These compounds were used to prepare the ligand library and screened against the prepared 3D modeled structure of PfAP2-I. Five (5) drug-like compounds were identified based on the docking analysis’s highest-ranked auto-dock score. They had lower binding energies when compared to the reference compound (CHEMBL3359262) and the standard drug (chloroquine), with binding energies of –8.8 and –5.5 Kcal/mol, respectively (Table 4). The chemical structure and IUPAC name of the 5 selected hit compounds against PfAP2-I active site are shown in Table 5. Postdocking analysis using discovery studio shows the 2D and 3D model interaction between the 5 selected hit compounds and PfAP2-I active sites (Figure 5).
Absorption, distribution, metabolism, elimination, and toxicity screening of the 5 drug-like compounds was based on bioavailability radar parameters, lipophilicity, water solubility, pharmacokinetics, drug-likeness, and medicinal chemistry. The oral bioavailability radar summarily describes the degree of drug-likeness of a molecule first using 6 properties (lipophilicity, size, polarity, insolubility, saturation, and flexibility) 42 (Figure 6). For each of the properties, the pink area represents the physicochemical space with an optimal range of lipophilicity (XLOGP3) between –0.7 and +5.0, size (molecular weight) between 150 and 500 g/mol, polarity (TPSA) between 20 and 130 Å2, solubility (log S) not more than 6, saturation not less than 0.25 and flexibility, not more than 9 rotatable bonds. 42 MCULE-7146940834, 57410073, and 57405339 fell within the physicochemical space for all 6 properties and can be said to be orally bioavailable. CHEMBL3923620 and MCULE-6567089130 had a deviation in the degree of saturation outside the physicochemical space.
Tables 6 and 7 showed that all the compounds were within the minimum and maximum acceptable range. The 5 compounds had molecular weights of less than 500 g/mol, implying that when these compounds are administered as drugs, they are likely to be absorbed and reach the site of action. The numbers of rotatable bond (NRB), hydrogen bond acceptors (NHA), and hydrogen bond donors (NHD) in the 6 compounds (Table 6) follow Lipinski’s rule of 5. 46
Lipophilicity is an essential property in drug discovery as it is an indicator of pharmacodynamics, pharmacokinetics, and molecular toxicity. 50 Multiple predictors (iLOGP, XLOGP3, WLOGP, MLOGP, and SILICOS-IT) were used to generate a consensus estimation of lipophilicity to increase the prediction accuracy. Consensus LogP values of less than 5 were found in all substances, including chloroquine, indicating good absorption, and penetration across cell membranes. 50
The solubility of a molecule greatly facilitates major drug development activities, especially the ease of handling and drug formulation. It is a significant property influencing the absorption and delivery of sufficient active ingredients in a small volume of pharmaceutical therapy. 51 Four compounds (MCULE-7146940834, 57410073, MCULE-6567089130, and 57405339) were moderately soluble in water with LogS (ESOL) values ranging from –5.42 to –4.60, while one (CHEMBL3923620) of the compounds was soluble in water with a –3.41 LogS (ESOL) value.
Pharmacokinetic properties such as gastrointestinal (GI) absorption, blood-brain barrier (BBB), and CYP 450 enzymes can be used to evaluate individual ADME behavior of small molecules. It has been suggested that CYP can process small molecules synergistically to improve the protection of tissues and organisms. 52 It is estimated that 50% to 90% of therapeutic molecules are substrates of 5 major isoforms (CYP1A2, CYP2C19, CYP2 C9, CYP2D6, and CYP3A4). 53 All 5 compounds have a high GI absorption and cannot cross the BBB. Four compounds are suitable inhibitors of CYP450 enzymes, while 2 are not (Table 6).
The selected compounds’ physicochemical properties and toxicity risks were analyzed using Osiris property explorer. 54 The drug-likeness, drug score, mutagenic tumorigenic, irritant, and reproductive properties were examined. Drug-likeness may be defined as a complex balance of molecular properties and structural features that determine whether a particular molecule is like the known drugs. A positive value for drug-likeness means that the molecule contains predominantly fragments frequently present in commercial drugs. 54 Three compounds, MCULE-7146940834, 57410073, and MCULE-6567089130, had positive values for the drug-likeness property.
The drug score (ds) is a contribution calculated directly from parameters of the partition coefficient (cLogP), solubility (clogS), molecular weight (Mol. Wt), drug-likeness, and toxicity risk within one good practical value. 55 The higher the drug score, the better the chance to be a drug candidate. The drug score values 1.0, 0.8, and 0.6 are associated with no risk, medium risk, and high risk. Among the 6 compounds, MCULE-7146940834 had the highest drug score value of 0.63 (more elevated than chloroquine of 0.25), fell within the medium-risk range, and may be used as a drug molecule. The drug score values of 4 compounds (MCULE-7146940834, 57410073, MCULE-6567089130, and 57405339) with a range of 0.26 to 0.63 were more significant than that of chloroquine (0.25). Only one compound (CHEMBL3923620) was below that of chloroquine with a value of 0.14. CHEMBL3923620 possessed medium-risk mutagenic, low-risk tumorigenic, high-risk irritant, and low reproductive toxicity risks. Compound 57410073 showed low-risk mutagenic, high-risk tumorigenic, low-risk irritant, and low reproductive toxicity risks. All other compounds (MCULE-7146940834, 154861216, MCULE-6567089130, and 57405339) had low-risk mutagenic, low-risk tumorigenic, low-risk irritant, and low-risk reproductive toxicity risks.
Molecular dynamics simulation was used to investigate the stability of the binding conformation and binding mode of the interactions between the lead compound, MCULE-7146940834 and PfAP2-I active site residues. 56 Throughout the simulation period, the stability and conformation of the protein and ligand were checked using RMSD and RMSF. The PCA was used to determine the correlation between statistically meaningful conformations (significant global motions) collected during trajectory. 49 MCULE-7146940834 was stable with a single binding mode in the protein’s active site, as indicated by the RMSD result (Figure 7A). The RMSD varies between 0.020 and 0.035, meaning that no substantial conformational changes occurred during the simulation phase, as evidenced by the histogram (Figure 7A). Significant shifts in the RMSF occur around positions 400, 920, and 1020, which correlate to the protein’s surface’s flexible loop sections (Figure 7B). The first 3 principal components account for 21.37% of the overall variance, according to the eigenvalue rank plot (Figure 8A and B). The first principal component (PC1) accounts for 8.7% of the variance. The PCA analysis indicated a conformational shift in the protein backbone, which was grouped into 2 coordinate clusters in black (first cluster) and red (second cluster) using simple clustering in the principal component subspace. This is consistent with the results of residue-wise loadings (Figure 8C) and RMSF (Figure 7B), which showed significant changes around residues 920 and 1020. The ability of MCULE-7146940834 to achieve and maintain a stable conformation within the flexible protein’s active site during simulation indicates the complex’s stability, which is a crucial benefit for its inhibitory capability against PfAP2-I.
Conclusion
The good, estimated binding energies, drug-likeness, and drug score values observed for the MCULE-7146940834 against PfAP2-I active site as well as the stable binding reliability by complex MD simulation from this study indicate that compound MCULE-7146940834 is a potential candidate for PfAP2-I inhibition. Further preclinical experimental validations should be carried out to ascertain the efficacy of these predicted best hits.
Supplemental Material
sj-docx-1-bbi-10.1177_11779322221149616 – Supplemental material for In silico Structure Prediction, Molecular Docking, and Dynamic Simulation of Plasmodium falciparum AP2-I Transcription Factor
Supplemental material, sj-docx-1-bbi-10.1177_11779322221149616 for In silico Structure Prediction, Molecular Docking, and Dynamic Simulation of Plasmodium falciparum AP2-I Transcription Factor by David O Oladejo, Gbolahan O Oduselu, Titilope M Dokunmu, Itunuoluwa Isewon, Jelili Oyelade, Esther Okafor, Emeka EJ Iweala and Ezekiel Adebiyi in Bioinformatics and Biology Insights
Footnotes
Acknowledgements
Not applicable.
Funding:
The author(s) disclosed receipt of the following financial support for the research, authorship, and/or publication of this article: This study received research funding from Covenant Applied Informatics and Communication Africa Center of Excellence (CApIC-ACE) under the World Bank Africa Center of Excellence (ACE Impact) project.
Declaration of conflicting interests:
The author(s) declared no potential conflicts of interest with respect to the research, authorship, and/or publication of this article.
Author Contributions
All authors contributed significantly to the study: EA and DO design and led the study. GO, TD, II, EO, JO, and EEJI participated in the conduct and analysis, and EA, EEJI, GO, and TD participated in the final manuscript’s conduct, review, and correction. All authors read and approved the final manuscript.
Ethics Approval and Consent to Participate
Not applicable.
Consent to Publish
All authors read and agreed to publish this study.
Availability of Data and Materials
The supplementary data relevant to this study is provided.
Supplemental Material
Supplemental material for this article is available online.
References
Supplementary Material
Please find the following supplemental material available below.
For Open Access articles published under a Creative Commons License, all supplemental material carries the same license as the article it is associated with.
For non-Open Access articles published, all supplemental material carries a non-exclusive license, and permission requests for re-use of supplemental material or any part of supplemental material shall be sent directly to the copyright owner as specified in the copyright notice associated with the article.