
Abstract
Pan-genome is defined as the set of orthologous and unique genes of a specific group of organisms. The pan-genome is composed by the core genome, accessory genome, and species- or strain-specific genes. The pan-genome is considered open or closed based on the alpha value of the Heap law. In an open pan-genome, the number of gene families will continuously increase with the addition of new genomes to the analysis, while in a closed pan-genome, the number of gene families will not increase considerably. The first step of a pan-genome analysis is the homogenization of genome annotation. The same software should be used to annotate genomes, such as GeneMark or RAST. Subsequently, several software are used to calculate the pan-genome such as BPGA, GET_HOMOLOGUES, PGAP, among others. This review presents all these initial steps for those who want to perform a pan-genome analysis, explaining key concepts of the area. Furthermore, we present the pan-genomic analysis of 9 bacterial species. These are the species with the highest number of genomes deposited in GenBank. We also show the influence of the identity and coverage parameters on the prediction of orthologous and paralogous genes. Finally, we cite the perspectives of several research areas where pan-genome analysis can be used to answer important issues.
Introduction
Pan-genome was a term coined by Tettelin et al 1 to describe the gene content of several strains of Streptococcus agalactiae. The pan-genome is divided into core genome, dispensable or accessory genome, and singleton genes (ie, species-specific genes). Fifteen years after the publication of Tettelin’s article, the number of genomes sequenced and available in databases have grown exponentially surpassing 30 000 complete and draft genomes in 2020 (https://gold.jgi.doe.gov/statistics). The evolution of sequencing technologies from classic chain termination method to fourth-generation sequencing, based on a massively parallel analysis, has been facilitating cost reduction over the years. 2 However, in many countries, the sequencing value still exceeds the prediction of USD 1000 per genome. 3 Despite criticisms about the use of draft genomes in pan-genome analysis, several new software have been developed to improve the assembly of these draft genomes. 4 For example, Escherichia coli has 15 275 genomes in scaffold or contigs available in GenBank (https://www.ncbi.nlm.nih.gov/genome/genomes/167) and their use for pan-genome studies is considered limited.
A search in PubMed database using the words “pan genome” or “pan-genome” returns a total of 494 works published in the last 5 years (2015 to date). This number tends to increase because the results of pan-genome analyses are becoming more accurate. Zeng et al 5 used a new pan-genome reverse vaccinology approach and found 121 cell surface-exposed proteins belonging to the core genome of Leptospira interrogans. These proteins proved to be highly antigenic and widely distributed in the species. Thus, these proteins are potential candidates for vaccine development. Pan-genome analysis was also applied to the discovery of antiphage defense systems, 6 in RNAseq analysis, 7 and evolutionary studies of adaptation to different hosts. 8
In this review, we present the main concepts and software used for the analysis of prokaryotic pan-genomes. First, introduction to basic concepts is presented followed by an up-to-date description of the most recent software for pan-genome analysis. We also present a pan-genome analysis of the 9 bacterial species with the highest number of genomes deposited in GenBank.
Basic Concepts
Pan-genome structure
The sequence of a single genome does not reflect the entire genetic variability of a bacterial species. Complex analysis such as evolutionary genomics and molecular pathogenesis require a large number of sequenced genomes.1,9 Fortunately, the constant evolution of sequencing technologies has been allowing the reduction of sequencing time and cost. Consequently, an exponential increase in the number of genomes available in the databases has been observed. New research fields have emerged such as comparative genomics, whose principle is to compare the genetic content of several taxonomically related microorganisms. 10 For example, in the pre-genomic era, 2 strains were classified in the same species if they presented 70% DNA-DNA reassociation. 11 In the post-genomic era, several other methods can be applied to evaluate taxonomic relationships such as average nucleotide identity (ANI). 12 A broader discussion about the concept of bacterial species will be accomplished later. Recently, the tree of life was updated based on the comparative analysis of a large number of bacterial genomes. 13
A pan-genome is determined through comparative genomic analyses. A pan-genome consists in the set of non-redundant gene families belonging to a taxonomically related group of organisms. The pan-genome is divided into 3 subgroups as demonstrated in Figure 1. Core genome is the set of genes shared by all analyzed microorganisms. Most of these genes are involved in vital roles for bacterial survival.1,14,15 However, genes of the core genome may also be involved in pathogenicity and virulence in some bacterial species.16,17 Accessory or dispensable genome is composed by the set of genes that are present in 2 or more genomes but not all. 18 Singleton genes such as species- or strain-specific genes are those present in only one genome. Usually, accessory and singleton genes are acquired by horizontal gene transfer (HGT) or evolved due to mutations in pre-existing genes. They are commonly related to a specific metabolism, virulence, antibiotic resistance mechanism, or other environmental adaptation. 19 A pan-genome is classified as open or closed depending on the probability of detecting new gene families as new genomes are added into the analysis. In an open pan-genome, the number of gene families will continuously increase with the addition of new genomes to the analysis. In contrast, in a closed pan-genome, the number of gene families will not increase considerably.

Venn diagram representing the subgroups of a pan-genome. Each set represents the gene families detected in a genome. The intersection of these sets represents the core genome. The number of gene families in the core genome corresponds to the size of the intersection. The fraction of genes corresponding to the core genome in an open pan-genome (A) is smaller than in a closed pan-genome (B). In contrast, the fraction of genes corresponding to the accessory genome in an open pan-genome (A) is higher than in a closed pan-genome (B).
Genomic plasticity and the accessory genome
The flexible portion of the pan-genome (accessory and strain-specific genes) is the main genetic component responsible for the adaptation of a bacterial population to different environmental stresses. In this context, it is important to distinguish the terms genomic plasticity and accessory genome. Genomic plasticity is used to describe the mobile genetic elements (MGEs) and hypervariable regions that transform the genome into a dynamic molecule. Therefore, it is a concept used to discuss the genetic variability of a single or multiple genome without necessarily making use of a pan-genomic approach. Accessory genome is the set of genes that, after a pan-genomic analysis, are present in 2 or more genomes but not all. Thus, it comprises the variable portion of a pan-genome. In some cases, MGEs and hypervariable regions comprise most of the accessory genome. 20 In strains of Bacillus amyloliquefaciens, most gene clusters for the production of secondary metabolites are present in the accessory genome of the species. 21
Orthologous and paralogous genes
Most comparative genomic analyses begin by identifying the homologous characteristics between 2 or more prokaryotic genomes. These homologies range from large chromosomal segments to genes or even point mutations. In a pan-genome analysis, the genes are the main characteristics evaluated. From an evolutionary perspective, a gene is classified as homologous or analogous. Homologous genes are those originated from a common ancestor, whereas the analogous genes evolved independently through convergent evolution. In both cases, they will present the same function but in different organisms. About 15% of the genes of a bacterium are acquired through HGT. 22 Thus, it is difficult to apply the concept of analogous genes in the Bacteria domain.
A pan-genomic analysis searches for homologous genes within the set of analyzed genomes. These homologous genes are divided into orthologous and paralogous genes. 23 Orthologous genes diverged via evolutionary speciation. Paralogous genes diverged via gene duplication. Thus, orthologous genes are those shared by 2 or more bacteria and have equivalent biological function. It is worth noting that orthologous genes tend to be more conserved than paralogous genes. 24 In contrast, paralogous genes commonly undergo several mutations after their duplication leading to a change in their biological function. 25
As pan-genomic analysis is based on sequence homology, some parameters such as coverage and identity must be carefully chosen. These parameters will strongly influence in the detection of orthologous genes. To demonstrate this issue, we calculated the pan-genome of E coli using different coverage and identity values. Thirty genomes were randomly downloaded from GenBank. Five analyses were performed starting from 50% coverage and 50% identity up to 90% coverage and 90% identity (Figure 2). The size of the pan-genome and core genome as well as the alpha value of the Heap’s law changed significantly (Figure 2). The pan-genome increased from 13 000 to about 18 000 gene families. The alpha value decreased from 0.68 to 0.58.

Pan-genome, core genome, and alpha value for each one of the five analyses performed using 30 genomes of E coli randomly downloaded from GenBank. In a more stringent analysis (high values of coverage and identity), the trend is the increase of the pan-genome size and the decrease of the alpha value. C indicates coverage; I, identity.
High values of coverage and identity lead to overestimation of the pan-genome size and may separate groups of orthologous genes. The opposite is also true. Low values of coverage and identity lead to the clustering of non-orthologous genes. One way to determine the best values for these parameters is checking the clustering of known orthologous genes in such a way that they will serve as an internal control during the analysis. Other characteristics that should be taken into consideration include the genomic plasticity and the taxonomic level of the microorganisms being compared.
Some software allows the user to modify other parameters that also strongly influence the results of the analysis. For example, GET_HOMOLOGUES 26 offers the possibility to use DIAMOND algorithm instead of BLAST to perform the alignment. This software also allows user to choose the algorithm used for bidirectional search of best hits, between COGtriangle and orthoMCL. A broader discussion about the types of orthology analysis used by each software will be further presented.
Pan-genomic concept of bacterial species
In 1942, Ernst Mayr proposed a species concept that is widely used for eukaryotes: “species are groups of interbreeding natural populations that are reproductively isolated from the other such groups.” The microbial world, basically composed by microorganisms that reproduce asexually, is therefore one of the great bottlenecks of the species concept proposed by Mayr. Bacteria are able to exchange genetic material through HGT.
Nevertheless, taxonomy and systematics are extremely important for basic analysis in microbiology. Species is the fundamental taxonomic unit and in the absence of a concept that encompasses all living beings, new ideas were presented or re-discussed. 27 The Bergey’s Manual of Systematics of Archaea and Bacteria has a broader concept of species: “a distinct group of strains that have certain distinguishing features and that generally bear a close resemblance to one another in the more essential features of organization.” Due to the emergence of modern (or molecular) microbiology that is based on the genetic analysis of cultivable or uncultivable strains, the concept of bacterial species is becoming increasingly divergent from the concept of Mayr and clearer than the concept provided by the Bergey’s manual. Currently, bacteria with >70% DNA-DNA hybridization and >97% 16S rRNA sequence identity are classified in the same species. 28 Even so, taxonomic classification of environmental bacteria is a bottleneck. The overwhelming majority of free-living microorganisms are uncultivable, which makes the hybridization analysis of complete DNA molecules unfeasible. To circumvent this bias, environmental microbiologists began to use the Operational Taxonomic Unit (OTU) definition to replace the biological species concept in microbial ecology analyses. 29
One of the most recent concepts of bacterial species was proposed by Bobay and Ochman. 30 They proposed that bacterial strains should be classified in the same species if they present an intra-group rate of gene flow higher than the rate between that group and any other strains. HGT is the main mechanism responsible for the spread of these genes within the bacterial population. HGT also allows exchange of genetic material between taxonomically distinct bacterial populations but on a smaller scale. 30 A hypothesis presented by Baumdicker et al 31 supports the concept proposed by Bobay and Ochman. 30 Baumdicker et al 31 argue that in the microbial world, individual bacterial cells maintain compact genomes whereas a higher number of genes exists at the population level. This idea was called the distributed genome hypothesis. The distributed genome of a group of bacteria can be accessed by calculating its pan-genome. The most recent methods used to characterize a pan-genome will be described in a later section.
Moldovan and Gelfand 32 proposed a new method for defining bacterial species using pan-genome data. The pan-genome can be represented by a gene frequency spectrum G(k) that correlates the number of orthologous genes groups (OGGs) containing genes from exactly k genomes. When the chart of the G(k) function presents a U-like shape, it is said that this set of genomes is homogeneous (Figure 3). 32 Moldovan and Gelfand then proposed that a population of isolates should be classified in the same species if they obey 3 criteria:
(a) Must be monophyletic in a sequence-based tree;
(b) Should be composed of a homogeneous set of genomes;
(c) Should be the maximal set of strains satisfying conditions a and b.

G(k) function for 2 sets of genomes. (A) A U-like shape chart indicates that the genomes analyzed belong to strains of the same species. (B) Internal peaks (highlighted in dark blue) suggest that the genomes belong to different species.
Ecological perspective and the pan-selectome hypothesis
Theoretically, a bacterial species whose population is highly clonal (closed pan-genome) is more successful in colonizing stable environments such as the human or animal tissues. In contrast, free-living microorganisms have a greater gene variability to adapt to different environmental conditions. The coagulase-negative staphylococci Staphylococcus lugdunensis is an example of commensal bacteria with closed pan-genome. 33 However, several other analyses demonstrated that this theory is not a rule.34,35 The genome of the oncogenic Helicobacter pylori appears to be quite different depending on the geographical location of the isolate. 34 It is worth noting that Lapierre and Gogarten 18 demonstrated that the whole bacteria domain appears to have an open pan-genome. Therefore, it is difficult to define whether closed pan-genomes are true evidence of species with limited gene frequency or if they are only artifacts from analysis with a limited number of genomes.
The maintenance of gene frequency in a pan-genome has been subject of several studies. Rodriguez-Valera et al 36 raised the hypothesis that the pan-genome of a bacterial population is maintained and equalized by phage predation. Phages are more abundant than bacteria in several environments. 37 Many works analyze the relationship between microbial communities and abiotic factors. However, bacteria also need to adapt to biotic factors such as phage predation. A bacterial population under constant phage predation is also under constant modulation of its gene content. This process is called pan-selectome, and the pan-genome is a snapshot of the gene frequency in a given population under constant phage predation. 36 Subsequently, Rodriguez-Valera et al 36 postulated that this pan-selectome is the evolutionary unit of selection in the microbial world (therefore, at the genomic level the unit of selection is the pan-genome).
Bioinformatic Tools
The first step in a pan-genomic analysis is the homogenization of the genome annotation followed by gene clustering based in gene orthology and, finally, the curve fitting (Figure 4). In addition, some software performs phylogeny analyses based on core genome and single-nucleotide polymorphism (SNP) calling. The homogenization of the annotation avoids the wrong classification of core genes into the shared subset and shared genes assigned to singletons. It should be performed using genome annotation software like RAST 38 and Prokka. 39 Alternatively, the researcher may use refseq-annotated genomes from NCBI 40 or gene prediction using software such as FGENES 41 and GeneMark, 42 as long as the methodology is the same for all genomes being analyzed.

Flow diagram representing the main steps in a pan-genomic analysis. Each process (represented by blocks) can be performed by different methods. Table 1 details the methods used by different software. COG indicates Clusters of Orthologous Groups of proteins; KEGG, Kyoto Encyclopedia of Genes and Genomes.
The clustering analysis is normally achieved by first performing an all-vs-all bidirectional BLAST analysis followed by the use of an orthology identification software, such as OrthoMCL 43 and Orthofinder. 44 Orthofinder is capable of eliminating gene length bias in orthogroup detection. Emms and Kelly 44 showed that Orthofinder performed 25% better than OrthoMCL. Another strategy is to use the results from BLAST to define the orthology directly from the size of the alignment and the identity of the sequence alignment, by setting a threshold for both. Also, a strategy described by Lerat performs the orthology identification by means of the score rate value (SRV), a normalization of the bit score from blast analyses. Afterward, as previously described, genes that are present in all strains are assigned to core genome, whereas genes that are shared by more than 2 but not all strains are assigned to shared genome and unique genes, that are only present in one strain, are assigned to singletons. 45
The complete table with all the orthologous genes may then be used for pan-genome, core genome, and singletons development analyses, which will fit the specific curve generated from permutations of all genomes in all positions. Normally, the software performs curve fitting of the pan-genome using Heaps law or Power Law, whereas the curve fitting of shared genome and singletons are performed by means of exponential regression decay. The formula for the Heaps Law is
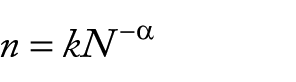
where n is the number of genes, N is the number of genomes, and k and α are constants defined to fit the formula, whereas the formula for least square fit of the exponential regression decay is represented by

where n is the number of genes, x is the number of genomes, e is Euler number, and k, τ, and tgθ are constants defined to fit the formula. 46
Interestingly, the α value is representative of the openness or closeness of the pan-genome, where an α lower than 1 is representative of an open pan-genome and an α higher than 1 is representative of a closed pan-genome. Also, tgθ represents the number of genes that will be found in the core genome after genome stabilization, whereas in singleton analysis, it represents the number of genes that will be added to the analysis for each newly added genome. 47
BPGA 48 software uses USEARCH, 49 CD-HIT, 50 and OrthoMCL 43 software for the orthology analyses and power-law regression and exponential curve fit for the pan-genome and core genome developments (Table 1), respectively. It also implements other relevant analyses such as core/pan/MLST (Multi Locus Sequence Typing) phylogeny, subset analysis, and KEGG 51 & COG 52 mapping. EDGAR, 53 on the other hand, uses SRV analyses for the orthology identification followed by Heaps law and exponential curve fitting of pan-genome and core genome development analyses, respectively. The website also plots venn diagrams, allows the analyses of subgroups of genomes, and exports multiple sequence alignments for phylogeny analyses.
Main software used for pan-genomic analysis and their respective algorithms.

Not mentioned in manuscript.
Pan-genome analysis of intergenic regions.
GET_HOMOLOGUES 26 uses bidirectional best-hit, COGtriangles 26 or OrthoMCL 43 for orthology analyses and performs pan-genome and core development analyses using the script plot_pancore_matrix.pl. The software also generates high-quality graphics, computes pan-genome trees, and performs syntenic cluster analyses. Pandelos 54 uses a dictionary-based method for orthology analyses and introduces a measure based on K-mer multiplicity and computation of Jaccard similarity. Panseq 55 uses MUMmer 56 and BLASTn 57 for the orthology analyses and it exports the accessory genome and binary presence/absence data, and core genome and SNPs for phylogeny analyses. PanX 58 uses Diamond 59 and MCL 60 for the Orthology analysis and it displays an alignment, a phylogenetic tree for each gene cluster, besides mapping mutation and inferring gain and loss of genes on the core genome phylogeny. It also has introduced a divide-and-conquer strategy for large datasets, by clustering small batches of genomes and combining different batches.
PGAP 61 uses Inparanoid, MultiParanoid, and Gene Family for the orthology assignment and Heap law and power law for the pan-genome and core genome developments. PGAP 61 is based in 5 modules: cluster, pan-genome, genetic variation, species evolution, and function enrichment analyses. PANWeb 62 and PGAWeb 63 are graphical interfaces for the use of PGAP.
PGAT 64 uses BLASTp for Orthology analysis with a sequence alignment of >80% and sequence identity >91% to 92%. PGAT 47 also allows comparison of sequence polymorphisms, multigenome display of regions surrounding a query gene, comparisons of metabolic pathways, and manual community annotation. Roary 65 uses CD-HIT, 49 BLAST, 57 and MCL 60 for the orthology analyses. Roary 65 runs in thousands of genomes in pan-genome analyses in standard desktops. Also, it uses the context provided by conserved gene neighborhood information for orthology analyses. Piggy 66 emulates Roary, 65 but for intergenic regions (Table 1).
Pan-Genome Assessment of 9 Bacterial Species
Pan-genomic analyses become more accurate the greater the number of genomes used. Thus, the 9 bacterial species with the higher number of complete sequenced genomes were selected in GenBank and their pan-genomes were calculated using PGAP v.1.2.0. 61 Fifty genomes of each species were used, totaling 450 genomes analyzed (Table 2). The gene annotation was normalized submitting all fasta files of each genome to the RAST 38 server. The PGAP 61 parameters were 50% identity, 60% coverage, and an e-value of 0.00001. E coli is a bacterium found in the microbiome of warm-blooded animals and in environmental habitat. In our analysis, this species presented only 19% of its genes in the core genome (2290/11 714 gene families) (Table 2). Rasko et al (2008) 67 have previously performed an analysis with 17 genomes and found a pan-genome composed by 13 000 gene families. A large accessory genome is expected in E coli because this species is adapted to different habitat and this adaptation is directly related to the genome content. MGEs are the portions of a genome that significantly contributes to the diversity of gene families. Mobilome is the set of MGEs present in a genome. Plasmids and prophages are the main components of the mobilome in prokaryotes. The Shiga Toxin-producing E coli (STEC) has mobilome that comprises 19.8% of its genome. 68 This mobilome carries genes involved in virulence and resistance to antibiotics. 69
Genome, pan-genome, and core genome size of each species.
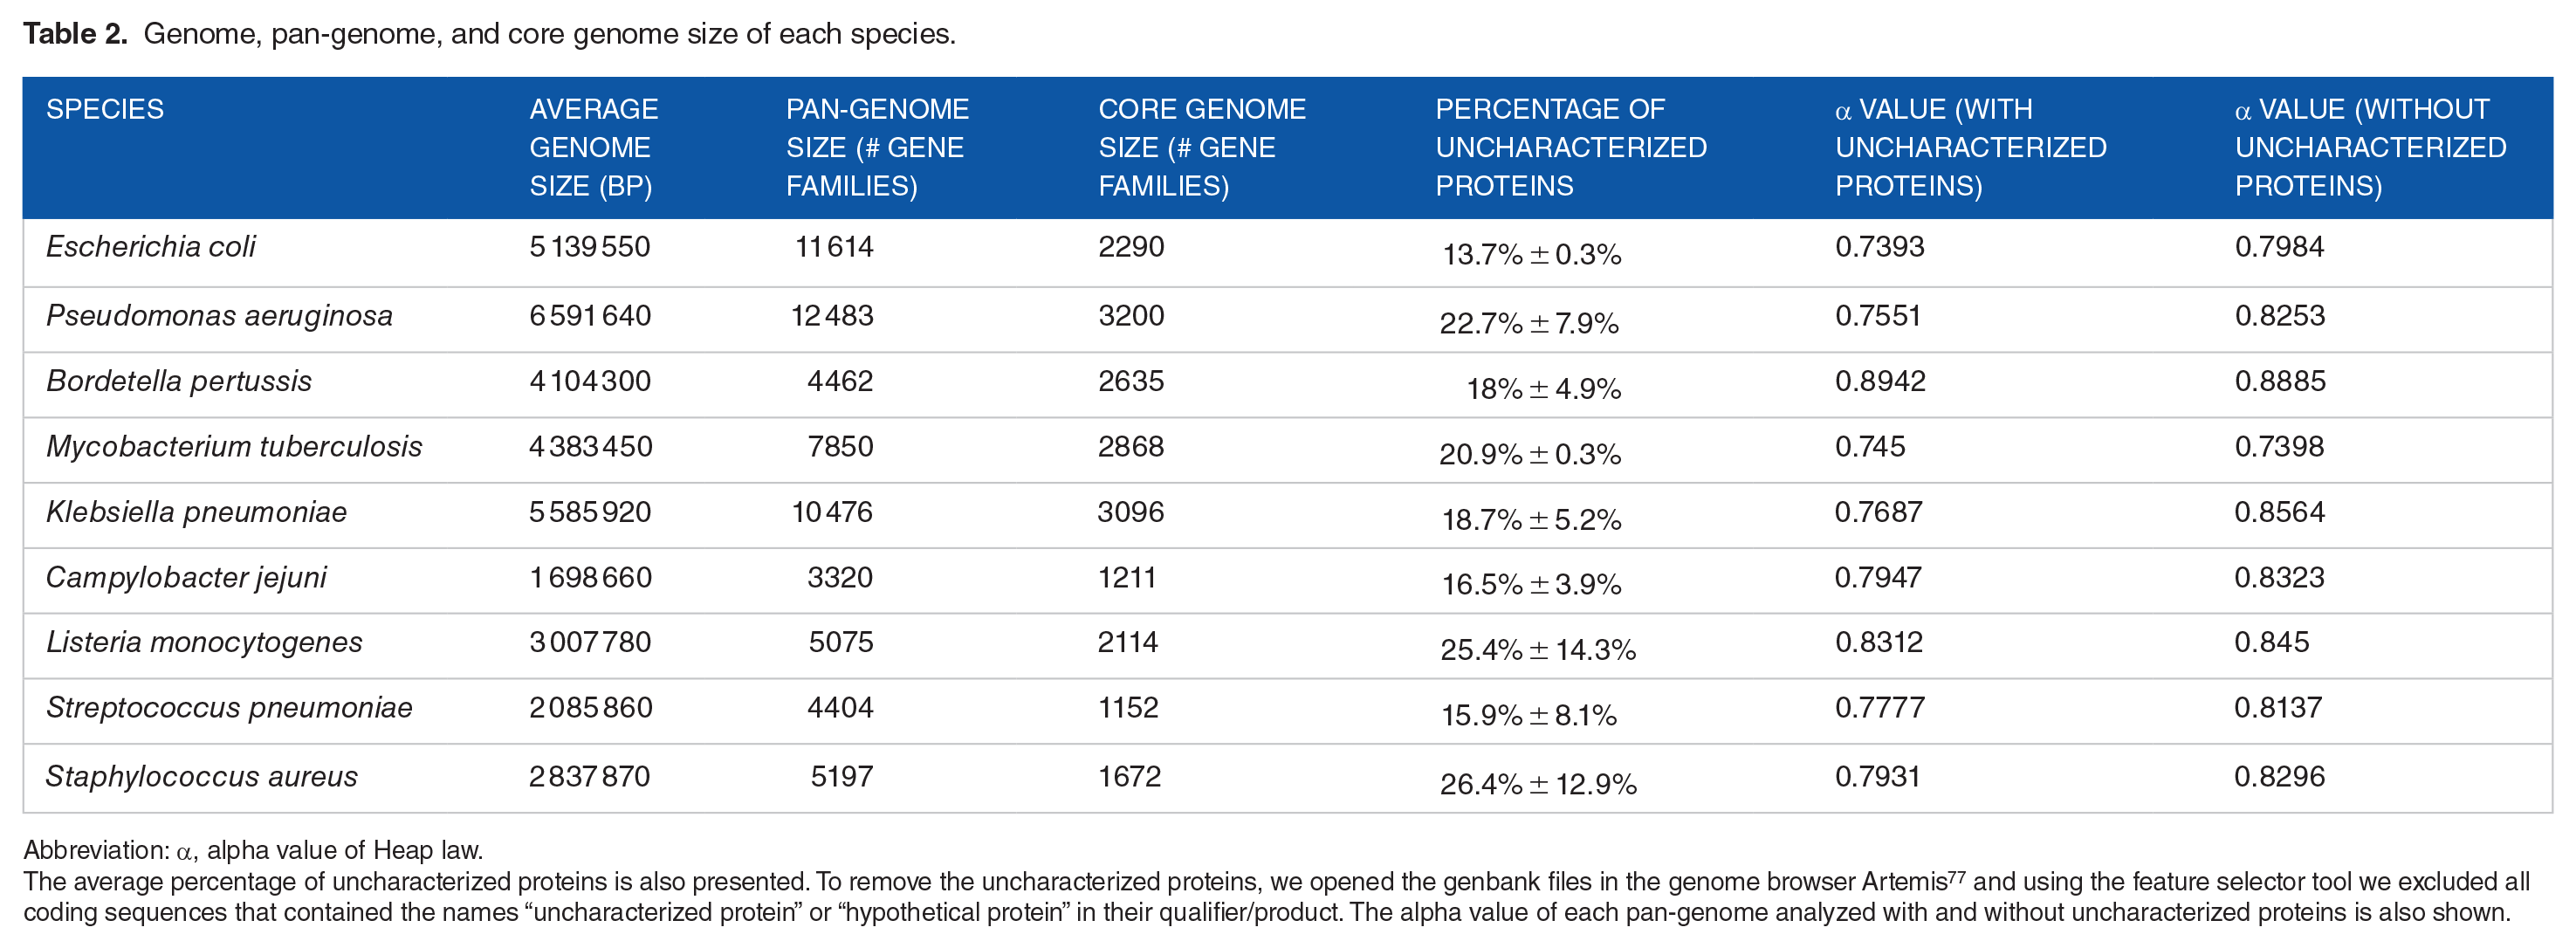
Abbreviation: α, alpha value of Heap law.
The average percentage of uncharacterized proteins is also presented. To remove the uncharacterized proteins, we opened the genbank files in the genome browser Artemis 77 and using the feature selector tool we excluded all coding sequences that contained the names “uncharacterized protein” or “hypothetical protein” in their qualifier/product. The alpha value of each pan-genome analyzed with and without uncharacterized proteins is also shown.
Staphylococcus aureus, Listeria monocytogenes, and Streptococcus pneumoniae presented a pan-genome size of 5197, 5075, and 4404, respectively (Table 2). A total of 32% (1672), 41% (2114), and 26% (1152) of the gene families were present in the core genome of S aureus, L monocytogenes, and S pneumoniae, respectively. All 3 species are considered human pathogens. They presented an open pan-genome (Table 2). Bosi et al 70 analyzed 64 strains of S aureus and found a pan- and core-genome composed of 7457 and 1441 gene families, respectively.
Mycobacterium tuberculosis is a human pathogen and one of the biggest global threats to public health. A previous study analyzed 36 genomes of M tuberculosis and found a pan-genome composed by 5765 gene families being 3679 belonging to the core genome. 71 These values were very different from our results. However, in both cases, the analysis indicated an open pan-genome which reinforces the idea that there is some exchange of genetic material among M tuberculosis strains. 71 Pseudomonas aeruginosa is considered a metabolically versatile species with the ability to adapt to different habitat. Several other studies have assessed the pan-genome of this species.17,72,73 Freschi et al 73 performed an analysis using 1311 genomes and observed that only 1% of the gene families were identified in the core genome. To the best of our knowledge, this is the smallest bacterial core genome described so far. We found a pan-genome containing 7850 gene families and a core genome corresponding to 36% of the entire pan-genome (Table 2). Comparing these results, the importance of evaluating a large number of genomes to achieve more accurate results in pan-genomic analysis becomes clear. Campylobacter jejuni presented the lowest number of gene families on its core genome (1211). This number represents 37% of the entire pan-genome that was characterized as open because the alpha value was lower than 1 (0.79) (Table 2). Campylobacter jejuni as well as Bordetella pertussis have a low number of published pan-genome analyses. However, they are pathogenic bacteria with the highest number of genomes available in databases. Tettelin et al 15 demonstrated that B pertussis have a closed pan-genome. In our analysis, B pertussis presented the highest alpha value; however, it was lower than 1. B pertussis also presented the highest core genome comprising 59% of the pan-genome (Table 2). Due to this low genomic plasticity, antibiotics and vaccines are quite effective against this species. 74
Today, a basic step in genomics is the prediction and annotation of coding sequences (CDS) using bioinformatics. The need for homogenization of genome annotation was discussed in a previous section. Several software that use different methods for prediction of CDS were developed such as Glimmer3, 75 Prodigal, 76 or GeneMarkS-2. 42 Prediction of false-positive genes is common. 42 Theoretically, in a pan-genome analysis, even a small rate of prediction error can change the results significantly due to the high number of genomes analyzed. False positives are commonly predicted as CDSs encoding uncharacterized proteins. We determined the average percentage of uncharacterized proteins in the genomes of the 9 species (Table 2). S aureus and L monocytogenes presented the highest number of uncharacterized proteins: 26.4% ± 12.9% and 25.4% ± 14.3%, respectively. The high value of standard deviation indicates that the genomes of some strains are better characterized than others (Table 2). We also calculated the pan-genome of those species removing the uncharacterized proteins from the genbank files. This process slightly altered the alpha value; however, all pan-genomes remained open (α > 1) (Table 2).
Applications and Future Perspectives
A pan-genomic analysis presents all the gene variability of a group of organisms. The set of genes shared among all organisms as well as species- or strain-specific genes are also extremely useful information. All of these data allow an improvement of time and technology in different areas of biology and bioinformatics.
Comparison of several bacterial genomes is a valuable aid for reverse vaccinology analysis. Reverse vaccinology was a pioneering method first applied to the serogroup B meningococci. 78 The method has greater advantages over classic approaches of vaccine development because it is less laborious, less costly, and more accurate in choosing a gene target. Several reverse vaccinology studies have now used pan-genome to determine the main targets for vaccine development.79,80
The host-pathogen interaction can be evaluated at the genomic level through genes that are responsible for processes such as adhesion, invasion, and toxin production. Therefore, a pan-genome analysis helps to define which virulence genes are shared among all pathogenic species, as well as which genes are specific to one isolate. This has direct implications for understanding the evolution of pathogenic species.
In addition to the examples cited above, pan-genomic analysis has been increasingly used to assist in the taxonomic classification of microorganisms, 81 to determine a set of molecular markers for phylogenomic analysis, 82 among other applications. Therefore, determining the pan-genome of a group of organisms is sometimes the initial step of a research. Several downstream analyses depend on a good prediction of the pan-genome. Thus, knowledge about the basic concepts and the correct choice of software, algorithms, and parameters are extremely important to the success of the research.
Footnotes
Funding:
The author(s) disclosed receipt of the following financial support for the research, authorship, and/or publication of this article: R.A.B. would like to thank Fundação Amazônia Paraense de Amparo a Estudos e Pesquisas (FAPESPA) for supporting the research (grant number 2155/2017), and Pró-Reitoria de Pesquisa e Pós-Graduação of Universidade Federal do Pará (Programa de Apoio à Publicação Qualificada – PAPQ 2020).
Declaration of conflicting interests:
The author(s) declared no potential conflicts of interest with respect to the research, authorship, and/or publication of this article.
Author Contributions
All authors contributed equally to the conception and writing of this manuscript. SSC performed the pan-genomic analysis.