
Abstract
Many human diseases including cancer are the result of perturbations to transcriptional regulatory networks that control context-specific expression of genes. A comparative approach across multiple cancer types is a powerful approach to illuminate the common and specific network features of this family of diseases. Recent efforts from The Cancer Genome Atlas (TCGA) have generated large collections of functional genomic data sets for multiple types of cancers. An emerging challenge is to devise computational approaches that systematically compare these genomic data sets across different cancer types that identify common and cancer-specific network components. We present a module- and network-based characterization of transcriptional patterns in six different cancers being studied in TCGA: breast, colon, rectal, kidney, ovarian, and endometrial. Our approach uses a recently developed regulatory network reconstruction algorithm, modular regulatory network learning with per gene information (MERLIN), within a stability selection framework to predict regulators for individual genes and gene modules. Our module-based analysis identifies a common theme of immune system processes in each cancer study, with modules statistically enriched for immune response processes as well as targets of key immune response regulators from the interferon regulatory factor (IRF) and signal transducer and activator of transcription (STAT) families. Comparison of the inferred regulatory networks from each cancer type identified a core regulatory network that included genes involved in chromatin remodeling, cell cycle, and immune response. Regulatory network hubs included genes with known roles in specific cancer types as well as genes with potentially novel roles in different cancer types. Overall, our integrated module and network analysis recapitulated known themes in cancer biology and additionally revealed novel regulatory hubs that suggest a complex interplay of immune response, cell cycle, and chromatin remodeling across multiple cancers.
Keywords
Introduction
Transcriptional regulatory networks are networks of regulatory proteins, such as transcription factors (TFs) and signaling proteins, and target genes that control the context-specific expression profiles of genes. Many human diseases, including cancer, are the result of perturbations to transcriptional regulatory networks. 1 Through advances in genomics and efforts of many consortia such as The Cancer Genome Atlas (TCGA) 2 and Encyclopedia of DNA Elements (ENCODE) Project, 3 we now have a comprehensive molecular characterization of dozens of cancers at the genomic, transcriptomic, and proteomic levels. However, a major challenge is the lack of systematic ways to compare multiple cancers that can provide deeper insight into the aberrant network patterns in disease cell types.
Network-based characterization 4 of complex diseases, including cancer, has been invaluable to integrate and interpret functional genomics data sets and identify new biomarkers that can be used to better classify patients into subtypes, and such approaches are much more powerful than approaches that examine a single gene5–10 at a time. However, most of these approaches have relied on known and curated pathways and single-reference interaction maps. Due to our limited understanding of regulator target relationships in mammalian systems, the role of transcriptional regulatory networks has not been examined as extensively as the role the protein–protein interaction networks has. On the other hand, module-based methods that characterize complex transcriptional programs using sets of genes that are coherently changing have been remarkably useful to identify cancer-specific signatures that are often correlated with clinical traits.10,11 Because these approaches have been applied to one cancer type in isolation, they cannot inform us of the regulatory network-level connections that are perturbed in multiple cancers. Recent approaches to pan-cancer studies enable comparisons of multiple cancers; however, these approaches have focused primarily on genomic sequence mutations. 7 Such methods have revealed that despite the heterogeneity in mutations across tumor samples, many of these mutations are in genes that represent a common pathway or process. For example, the approach by Ciriello et al. 7 performed a pan-cancer analysis by examining genomic alterations across 12 different cancers. It was found that cancers can be grouped into those driven by copy number variations and those driven by somatic mutations. Genes harboring these mutations were found to represent a few processes, including those associated with transcriptional regulation such as TFs and chromatin remodelers. 12
We recently developed a new approach, called modular regulatory network learning with per gene information (MERLIN). 13 This method reconstructs regulatory networks from expression data predicting regulators for individual genes as well as for sets of genes (modules), providing insight into the fine-grained gene-level and modular organization of transcriptional networks. In this paper, we describe a pan-disease network analysis approach of six different cancers: (1) breast invasive carcinoma (BRCA), (2) ovarian serous cystadenocarcinoma (OV), (3) lung squamous cell carcinoma (LUSC), (4) kidney renal clear cell carcinoma (KIRC), (5) colon adenocarcinoma (COAD), and (6) uterine corpus and endometrial carcinoma (UCEC). We computationally validated these regulatory networks by examining the inferred modules for statistical enrichment of curated pathways and processes. In addition, we tested these modules for enrichment of DNase I–filtered motif instances of sequence-specific TFs using DNase I footprints from the ENCODE consortium. 14 We performed gene-, module-, and pathway-level comparisons across different cancers to find the common and cancer-specific regulatory network components such as shared and common network hubs.
Our regulatory network-based characterization of these data identified several shared biological processes, including cell cycle and immune-related processes. The cancers are significantly different from each other at the regulatory network level, but share a common regulatory network that includes histones and regulators of the cell cycle and immune response. Network topology analysis revealed conserved and differentially wired network hubs among the cancers, several of which are highly mutated in different cancers. 12 Our regulatory network-based pan-cancer analysis provides a systematic approach for examining network-level differences and commonalities across multiple cancers that can provide insight into targeted therapies for these diseases.
Methods
Description of Data Sets
For each cancer analysis (BRCA, COAD, KIRC, LUSC, OV, and UCEC) the Level 3 (per-gene) sample data sets for the Agilent 244K microarray gene expression platform were obtained from the TCGA data portal (https://tcga-data.nci.nih.gov/tcga/). A corresponding data matrix with rows representing genes and columns representing patient samples was then generated for each cancer data set. These data values were Lowess-normalized, log 2-transformed ratio values comparing expression in the respective patient samples to measurements of the Stratagene Universal Human Reference. These data values were used verbatim in the input for the MERLIN analyses.
The genes selected for this analysis satisfied two criteria. The first criterion was to select genes that exhibited a fold-change of two or higher relative to the reference standard (meaning a log 2 ratio data value greater in magnitude than 1) for 5% of the data samples in all six cancer data sets. This criterion identified genes exhibiting the greatest variation in all cancers and provided 7212 genes as a base gene set. The second criterion was to include all genes covered in the National Cancer Institute (NCI) cancer pathways annotation, 15 regardless of the variability of expression for those genes across patient samples. This increased the selected gene set to 8499 genes, which was the set used for the analysis of all six cancer data sets. Of those 8499 genes, 1050 were known TFs and kinases as curated by Ravasi et al. 16 and Uniprot. 17
MERLIN and Stability Selection
To infer the regulatory program and module assignment for each cancer data set, we used a stability selection scheme. 18 For each cancer data set, we generated 50 subsamples by randomly selecting m/2 random patient samples, where m is the total number of samples in that data set. We ran the MERLIN algorithm on each respective subsample data set on the HTCondor computing grid (http://chtc.cs.wisc.edu), using the same parameter settings for each run. MERLIN takes three parameters as input, p to control for the network sparsity, r for controlling the network modularity, and finally, the parameter h that defines the partitioning of gene modules based on coexpression and the inferred regulatory network. For our analysis, the settings of these parameters were p = -5 for the sparsity, r = 4 for the modularity prior, and h = 0.6. These parameter settings were empirically determined to provide the best results on simulated data with known ground truths. 13 The input set of regulators to MERLIN for these subsample analyses was the above-mentioned list of 1050 curated16,17 regulatory genes identified within our chosen set of 8499 genes. We then combined the resulting networks and modules from the respective subsample analyses to generate a consensus network and consensus modules for each cancer type as we describe below.
Consensus Network
To define the consensus network for each cancer data set, we first calculated the frequency with which we observed each edge in the associated 50 subsample network results. The consensus network then consisted of the edges appearing in the subsample network results with a frequency higher than 0.3, which also corresponds to an false discovery rate (FDR) threshold if <0.1.
To calculate FDR values and validate the consensus network, we randomly shuffled the per-sample expression values for each gene within each cancer data set and generated 50 subsample data sets from these shuffled data in the same manner described above. We then applied MERLIN to these randomized subsets of the data with the same settings as were used for the actual data analysis. We then counted the number of edges, NR, that appeared with a frequency ≥t across all 50 shuffled subsample results, where t was a chosen threshold frequency. We calculate the FDR as a ratio of the number of edges with a frequency that was ≥t in the randomized results, NR, and the number of edges with frequency ≥t in the results from original data, NE, such that FDR = NR/NE. To select the appropriate frequency threshold, t, we tested different threshold values and calculated the resulting FDR statistics. We choose the threshold of t = 0.3 to maximize the number of edges in the consensus networks, while keeping the FDR value <0.1.
Consensus Clustering
The modules inferred by the MERLIN analysis of the respective sets of 50 subsamples were combined into consensus cluster sets for each separate cancer analysis. Consensus clustering determined modules of genes that were coclustered in multiple subsample cluster assignment sets with a certain frequency. We implemented this with a hierarchical, agglomerative consensus clustering method. With the module assignments generated for each of the 50 subsample data sets, we generated a similarity matrix S between all pairs of genes, where the value of element S(i,j) was the percentage of the time gene i and gene j were clustered together in the respective subsample clusterings. We applied hierarchical clustering on the similarity matrix and used a consensus frequency threshold, t, of 0.3 to define the partitioning of clusters. To select this threshold value, we considered t = 0.3, 0.4, 0.5, and 0.6. We selected a value for t that resulted in a reasonable numbers of modules with 10 or more genes, maximized the gene set covered by the selected module sets, and provided an acceptable FDR statistic for the resulting consensus modules for each cancer analysis. Here the FDR statistics were obtained in a similar way as for the consensus networks. Briefly, the FDR was defined as the ratio, FDR = PR/PE, where PR is the number of coclustered pairs of genes that appeared with a frequency ≥t in the shuffled subsampled data results and PE is the number of coclustered pairs of genes from the original data subsamples. The choice of threshold t = 0.3 resulted in FDR values for the consensus module sets that were <0.01 and module sets that covered ~20% of the total input set of 8499 genes, in the analysis of each cancer data set.
Finally, for each set of consensus modules, we then selected only those modules with 10 or more genes for pathway, motif, and other enrichment analyses. This approach defined high confidence modules of genes that are less sensitive to random noise than the direct results from the MERLIN program.
Pathway and Motif Enrichment
The consensus modules-obtained from each study were further analyzed for statistical enrichment of genes associated with specific biological processes and pathways annotated in KEGG, REACTOME gene sets,19–21 as well as NCI cancer pathway annotations. 15 To assess statistical enrichment, we used an FDR-corrected hyper-geometric test P-value for the overlap of genes between the curated gene set and the genes in a module. Lastly, we examined modules for statistical enrichments of genes associated with TF binding in evolutionary-conserved motif instances from MSigDB, 21 and open chromatin, measured by DNase I hypersensitivity assays and known binding motifs of TFs (see below).
DNase I-filtered Motif Enrichment
DNase I data for seven human cell lines were used to generate motif instances for sequence-specific TFs based on motif instance presence in the peak regions of DNase I hypersensitivity data sets. Publicly available DNase I peaks sets were obtained from Maurano et al. 14 and Thurman et al. 22 The selected data are for the H1 cell line and the following cancer cell lines: CACO2 and HCT116 (colon cancer), A549 (lung cancer), MCF7 (breast cancer), and finally the Ishikawa_E and Ishikawa_T (endometrial uterine cancer) cell lines. These cancer cell lines correspond to four of the cancers in our study of TCGA gene expression data, BRCA, COAD, LUSC, and UCEC. The DNase I data sets used here were all generated by Maurano et al. 14 , except the data for the uterine endometrial cancer cell lines, which were obtained from Thurman et al. 22
These DNase I data were processed as follows. The peak regions were used to generate DNA sequences for the open chromatin regions in each cell line, using the hg19 genome assembly. Known motif position weight matrices from the JASPAR 23 database and from Kheradpour and Kellis 24 were used to find TF-binding sites using the Find Individual Motif Occurrences (FIMO) algorithm. 25 Target gene sets were then defined for each TF using the following criteria. If a motif instance for a TF was found in a DNase I peak and that peak was within 2000 bp of the TSS of a gene, that gene was considered a target of the TF. In this way, we inferred 387,446 (Ishikawa_E) – 797,137 (H1) TF target gene edges for 199 TFs from the DNase I footprints of each cell line. The target gene sets of individual TFs in these DNase I accessibility networks were subsequently used to study the associations of these TFs with the genes in the consensus modules of the MERLIN analysis.
Cross-validation Study of the Consensus Networks
We used a five-fold cross-validation scheme to assess the expression predictive power of the consensus networks. For each cancer study, we took the consensus network, and for each target gene in that network, we predicted its expression profile using the expression of its regulators in the network. In this cross-validation scheme, we split the expression data into five test data sets. The training data set for each test set was the remaining four-fifths of the data. We then learned a regression model on each of the training data sets, and then for each gene we predicted its expression in the test samples. We computed the correlation of the predicted expression profile to the actual expression profile in the corresponding test data set. The average correlation from all five test data sets was taken as a measure of the predictive power of the consensus network for each target gene.
To assess the significance of the correlations of the true and predicted expression levels, we repeated the above cross-validation procedure for random networks. To generate a random network from a given consensus network, we took the in-degree, k, of each target gene, in that consensus network and added edges between that gene and k randomly selected regulators. For each of the cancer studies, we generated 10 random networks and repeated the five-fold cross-validation procedure with each random network. For each target gene, we then took the average of the correlation values estimated for each of the 10 random networks.
Network Comparison Analysis
To estimate the similarity of two networks, we calculated the number of edges that are present in both networks (common edges) and defined precision as the ratio of the number of common edges to the number of edges in the first network and defined recall as the ratio of the number of common edges to the number of edges in the second network. Using the precision and recall, we calculated F-score, defined as the harmonic mean of precision and recall. F-score of a pair of networks was calculated using only the edges between the common set of TFs and targets between two consensus networks.
Analysis of Hubs
We estimated the degree distribution of the regulators and selected the regulators that were ranked among the top 1% of the TFs sorted by degree. We found 53 such regulators and we called them hubs. We split these hubs into three categories: (1) Specific hubs: the regulators that are hubs in only one network; (2) Differential hubs: the regulators that are hubs in more than one network but their neighborhoods change between different networks; and (3) Common hubs: the regulators that are hubs in more than one network and their neighborhoods are similar in different networks.
To define the first category, we selected the regulators that were ranked in top 1% in at least one network, but were not ranked in top 10% in any other networks. To define the second and third categories, we analyzed the similarity of neighborhood of these regulators between pairs of networks. We defined the neighborhood of each regulator in each cancer data set as the targets of that regulator in the consensus regulatory network for that data set. For each pair of networks, we calculated the “Jaccard index”, which for a pair of sets is defined as the ratio between the size of the intersection and the size of the union of two sets. If the Jaccard index of a regulator is higher than 0.3 in at least one pair of networks, we added that regulator to the third category, otherwise we added that TF to second category.
Regulatory Hub and Pathway Association
To associate a regulatory hub with a pathway, we first identified the consensus modules containing target genes that a given regulatory hub was predicted by MERLIN to regulate. Next, we identified the NCI cancer pathways that each module was associated with in the enrichment analysis. A regulator was associated with a pathway P if it regulated a module m, and module m was enriched for the pathway P. To compare the regulator-pathway associations between a pair of inferred networks, we used an F-score measure of similarity between the regulator-pathway associations derived for each type of cancer.
Results
A Regulatory Module Network–based Characterization of Different Cancers
A transcriptional regulatory network specifies the connections between regulatory proteins and the genes that they target. There are two parts to describing the regulatory network: (1) the wiring of the network that specifies who regulates whom and (2) the parameters specifying how different sets of regulators interact to regulate the expression of a given gene. Computational regulatory network inference from genomewide expression levels is a popular approach to predict regulatory relationships between regulators and target genes.26–29 We recently developed a new network reconstruction method, MERLIN, 13 that uses a probabilistic graph prior to predict regulators for individual genes and modules. MERLIN combines the strengths of two popular network inference strategies, “per-gene”, which infers regulators for each gene individually, and “per-module”, which infers a common set of regulators for an entire module. Per-gene methods can predict precise regulatory programs of each gene but do not inform us of the modular organization of regulatory networks. Per-module methods can inform us of the modular organization of the regulatory network, but do not capture gene-specific regulatory information. MERLIN's graph structure–based algorithm imposes a module constraint that genes in the same module have similar, but not necessarily the same, sets of regulators. MERLIN takes as input genomewide expression patterns, an initial set of module assignments and candidate regulators, and gives as output an inferred regulatory network and module assignment for each gene. MERLIN outperforms state-of-the-art per-gene and per-module methods, successfully combining the strengths of both classes of methods. 13
In this paper, we applied MERLIN within a stability selection framework 18 that uses a subsampling-based approach to additionally provide confidence estimates for the inferred regulatory network structures and modules (see Methods). Briefly, we draw random subsamples of the data set (same number of genes, but different samples) and learn multiple MERLIN models (Fig. 1). Then a consensus network and consensus modules are obtained using the inferred networks and modules from each subsample (Methods).

Overview of using MERLIN with stability selection for pan-cancer module network analysis. Shown is a diagram presenting the pipeline for applying the MERLIN stability selection framework to N cancer gene expression data sets. For each cancer data set, multiple subsamples are generated. The MERLIN algorithm is then applied to each subsample data set to infer module assignments and regulatory networks. The individual modules and networks are combined to estimate a consensus network and consensus module set for each type of cancer. The selected consensus modules are analyzed for enrichment of curated gene sets for KEGG pathways, REACTOME annotations, NCI cancer signaling pathways, and DNase I–filtered targets of TFs. The consensus networks are analyzed based on network degree distributions and identifying unique and common regulatory edges.
We applied the MERLIN method within the stability selection framework to Level 3 Agilent G4502A micro-array expression data from TCGA for six cancers. These cancers are: (1) BRCA, (2) COAD, (3) KIRC, (4) LUSC, (5) OV, and (6) UCEC. These data were Lowess-normalized expression values with a log 2 ratio transformation taken relative to data taken for the Stratagene Universal Human Reference. Each input data set to MERLIN represented 7449 target and 1050 regulator genes, where the regulators were known TFs or signaling proteins such as kinases and phosphatases. All genes (regulatory and target genes) represented in each analysis had to satisfy one of two criteria: (1) a gene had to either vary in expression by a magnitude of 1 relative to the reference for 5% of the patient samples in each cancer data set or (2) a gene had to be annotated with a known role in NCI cancer pathways. 15
The application of MERLIN to these data within the stability selection framework identified between 9 (UCEC) and 55 (COAD) consensus modules in each cancer study (Fig. 2A). The modules each exhibited a unique but complex pattern of expression. In the majority of the modules, we found that samples can be grouped into induced and repressed patterns of expression of genes in a module. The maximum module size from each study ranged from 129 (UCEC) to 302 (KIRC) genes, as shown in Figure 2B. These module sets included on average ~20% of the genes (~7% [UCEC] to ~22% [BRCA]) selected in this work (see Methods), emphasizing the need to identify both module-level and gene-level regulatory network connections.

Summary of the MERLIN consensus module sizes and expression patterns. Shown here is a summary of the consensus module results for the six cancer data sets. (A) The size of the gene set covered by the consensus modules with at least 10 genes (i), and the largest module size (ii) is presented for the module set for each cancer. (B) Expression profiles of genes in selected consensus modules with 10 or more genes are shown in a red-blue color scale. The rows correspond to genes and the columns correspond to samples. The data values represented in the expression profiles are zero-meaned across all samples per gene. Each individual heat map is scaled to represent the relative number of genes and samples in each cancer study.
Pathway Analysis Reveals Immune-related Processes to be sHared among Different Cancers
To interpret our modules in the context of known pathways, we examined the consensus modules for enrichment of NCI cancer signaling pathways, 15 REACTOME pathways,30–32 Gene ontology processes, 33 and KEGG pathways. 19 On average, at an FDR <0.05 threshold, 56% of the consensus modules were enriched for one of the REACTOME annotation terms, 74% for a gene ontology process, 49% for an NCI cancer signaling pathway, 42% for an annotated KEGG pathway, and 53% of the modules were enriched for open chromatin (DNase I-accessible) targets of TFs (Fig. 3A).
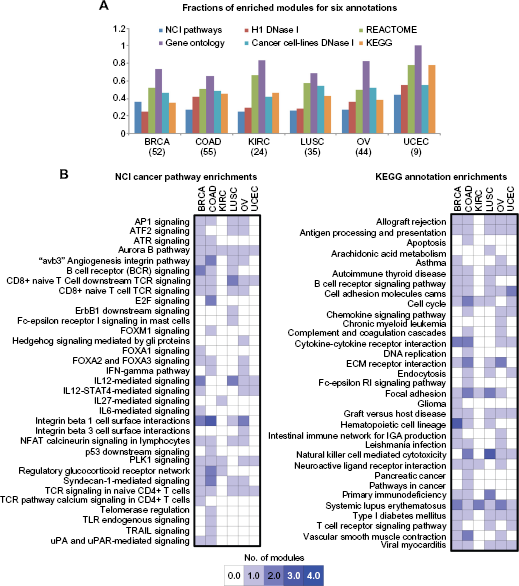
Summary of consensus module enrichments for NCI cancer pathway and KEGG annotations. (A) Shown are the fraction of modules from all six cancer data sets that are enriched for curated gene sets from Gene ontology (GO), KEGG, REACTOME, NCI cancer pathways, and DNase I motif accessibility networks for six cancer cell lines and the H1 embryonic stem cell line, respectively. The number of selected consensus modules with 10 or more genes in each study is listed below each cancer name. (B) Summary of enrichments from the NCI cancer pathway and KEGG annotations. The enrichments summarized here are selected with an FDR <0.001 and the number of annotated genes included 20% of the genes in the respective module. The plot shows the number of consensus modules from each cancer study on a scale of 0–4 modules.
A common theme that emerged from our module enrichment analysis was the association of immune system–related processes, such as interleukin (IL), cytokine, and T cell signaling pathways, with all six cancers (Fig. 3B, NCI pathways of TCR signaling in CD8+ and CD4+ T cells; Supplementary Fig. 1, REACTOME pathways of cytokine signaling, the immune system and the adaptive immune system). The genes in modules associated with the REACTOME immune system annotation also exhibited induced gene expression relative to genes in other modules, which indicates enhanced immune system activity in all six cancers (Supplementary Fig. 2). The KEGG annotation for systemic lupus erythematosus (Fig. 3B) was even associated with at least one consensus module from each cancer studied. These observations suggest that the represented cancers have a common feature of aberrant immune system function.
Our observation of the enhanced immune system activity is consistent with the findings of Apetoh et al. 34 , which showed that the effectiveness of anticancer therapy (such as chemotherapy and radiation treatment) depends on the response of the immune system, and additional studies that have implicated the immune system in cancer.35,36 Studies have also shown that in a state of inflammatory response (in which IL6 production is abundant) “cross-talk” between the IL6 and the signal transducer and activator of transcription (STAT) 3 signaling pathways leads to an overabundance of STAT3 expression. This is a mechanism that is potentially central to the genesis and proliferation of cancer.37,38 In considering these findings reported for the IL6 and STAT3 pathways,37,38 the presence of IL pathways in the module enrichment results of five of the six cancers may also be related to the observation of immune system activation.
Another conserved pathway found in all cancers studied is the Aurora B pathway. This pathway was associated with at least one consensus module from each cancer analysis, representing a common feature of all six of these cancers. The Aurora B kinase is associated with regulation of microtubule organization for chromosome movement, and the overexpression of it is associated with aneuploidy cells with aberrant chromosome numbers. 39 Although this pathway has been previously implicated in cancer, the finding that it is uniformly implicated in a pan-cancer context is noteworthy. Other common biological processes enriched in the consensus modules of all six cancer analyses were related to the cell cycle, including DNA replication, telomere maintenance, and packaging, as well as chromosome maintenance. These processes are associated with known hallmarks of cancer. 40
On the backdrop of shared immune response and cell cycle processes across cancers, we next examined the inferred modules for pathways and processes that are uniquely associated with each cancer type. In addition to immune response, the modules identified for OV were enriched for two integrin cell surface signaling pathways (Fig. 3B), implicating aberrant cell-cell communication in that specific disease. The p53, Toll-Like Receptor (TLR), TNF-related apoptosis-inducing ligand (TRAIL), E2F, and FOXM1 signaling pathways (Fig. 3B) were identified uniquely among the COAD analysis modules, and each of these pathways are known to regulate to cell cycle processes. The modules identified in the analysis of the KIRC data set were enriched for the fewest number of pathways of any of the six cancers (Fig. 3B). Those pathways that were identified in the KIRC results include the Aurora B, IL27, and the PLK1 signaling pathways. This finding for the KIRC module enrichments may suggest this cancer is associated with fewer known pathways than the other cancers or that there are many more pathways that are significantly perturbed in other cancers compared to KIRC. Overall these findings in the OV, COAD, and KIRC consensus module enrichments identify distinguishing features of these diseases, yet are still consistent with the general theme of immune system and cell cycle involvement in cancer.
Integration of Transcriptional Modules with DNase I Footprints Identifies Key Immune Response Regulators Associated with Multiple Cancers
We next focused on the enrichment of consensus modules for motif instances of sequence-specific TFs in cell line-specific DNase I footprints14,22 from six cancer cell lines and the H1 embryonic stem cell line (Supplementary Figs. 3 and 4, Methods). These six cancer cell lines were specifically selected to match the tissue of origin of the cancer. We found cell lines that matched four of the six cancers studied. While not perfect, this can provide insight into tissue-specific changes in regulatory networks that are associated uniquely with each cancer type. Among the consensus modules of each cancer analysis, 46% (BRCA)-58% (COAD) were enriched for DNase I–filtered targets of a TF (Fig. 3A). For all cancers, we found modules enriched for target genes of known regulators of immune response, such as the interferon regulatory factor (IRF; IRF1, IRF2, IRF3, IRF5, IRF7, IRF8, and IRF9) and STAT family of TFs (STAT1, STAT3, and STAT5B). Nevertheless, the modules for KIRC were less uniformly enriched for targets of these regulators than those of the other cancers. The IRF and STAT-enriched modules (Fig. 4) were also enriched for immune system processes, consistent with the common enrichment of immune-related processes.

Modules from different cancers associated with immune response processes and regulators. Shown here are example modules, one from each cancer studied, with significant associations with immune response processes and regulators. For each module, the expression profile of the target genes (right) and the associated regulators (left) are shown. Each module is examined for two types of support for regulatory relationships: the edges of target genes to inferred expression regulators from the MERLIN analysis (cyan) and curated TF-binding motifs from MSigDB (purple). Instances where a target gene is not annotated in a particular category are noted in gray. On the right, are shown three red-blue heat maps for each module. The topmost shows the zero-meaned profile of expression for target genes. The middle heat map shows the expression profiles of the inferred expression regulators from MERLIN. The bottom heat map shows the expression profiles of regulators with motif instances from MSigDB that are significantly enriched in the module.
STAT1 in particular has been associated with breast, 41 ovarian, 42 lung, 43 kidney, 44 and colon 45 cancers (BRCA, OV, LUSC, and COAD) (see www.genecards.com). 39,46 We additionally identified this regulator to be associated with uterine endometrial cancer (UCEC), an association that has already been suggested in the literature. 47 The IRF family of TFs relates generically to immune system function and has been connected to various leukemic conditions as well as ovarian, breast, endometrial, kidney, colon, and lung cancers. 46
Two other TFs appeared to have similarly conserved patterns of module enrichment across five or more cancers (Supplementary Fig. 3): Nuclear Transcription Factor Y - Alpha (NFYA) and TRIM63. NFYA has widely known associations39,46 with breast,48,49 colon, 50 and lung 51 cancer, and module enrichments for targets of the TF are found in the present analyses of each of these cancers. We also found target genes of NFYA to be enriched in modules identified for kidney, endometrial uterine, and ovarian cancer. There are, moreover, experimental studies implicating NFYA in ovarian, 52 kidney, 53 and uterine cancers. 54 The TRIM63 TF has a less established connection to cancer, leukemia being one noted exception, but it has particularly been implicated in viral and immune system–related diseases.39,46 Experimental work has demonstrated a role for this regulator in soft-tissue sarcoma. 55 Previous computational analysis has also implicated this gene in two soft-tissue cancers. 56 The enrichment results suggest a potentially novel role of TRIM63 in five of the cancers studied in this work (BRCA, COAD, LUSC, OV, and UCEC).
The DNase I–filtered binding enrichment results also demonstrated an association of several cancers (BRCA, KIRC, OV, and UCEC) with the RFX5 TF (Supplementary Fig. 3 and 4). RFX5 has little established association with cancers,39,46 but it does to several immunological disorders.39,57 The RFX TF complex – which includes RFX5 – is known to coordinate with NLRC5 to induce class I 58 major histocompatibility complex (MHC) gene expression and also to induce expression of class II 59 MHC genes. The MHC genes are a family of genes that mediate leukocyte interactions with other cells and which are generally integral to immune system function. 60 In the context of cancer, upregulation of class I MHC genes has been observed in renal carcinoma. 61 In contrast to that example, a novel mutation in RFX-AP (another member of the RFX complex) has been connected to the loss of expression for MHC class II genes in diffuse large–B-cell lymphoma, 62 which is also a known biomarker for decreased patient survival of that disease. 62
RFX1 and RFX4 are TFs that are related to the RFX complex and which are also known to control the expression of MHC class II genes.59,63 Enrichment for DNase I–filtered target genes of RFX1 and RFX4 were also found in modules from the BRCA, LUSC, OV, and UCEC analyses (Supplementary Figs. 3 and 4). In fact, splice variants of the RFX4 gene that are specifically associated with glioma cancer cells have been identified, 64 and RFX 1 has itself been identified as a tumor suppressor gene in glioblastoma. 65 Given the regulatory role of the RFX complex and related TFs in controlling MHC gene expression, these module enrichment results suggest the RFX regulators play an important role in immune-related processes in the context of cancer.
Another regulator to highlight in the context of the DNase I accessibility network enrichments is PBX3 (Supplementary Figs. 3 and 4), which was associated with modules from breast, kidney, ovarian, and endometrial uterine cancer analyses. This gene is widely associated with leukemia and the onset of that disease 66 and has also been implicated in gastric cancer. 67 Our results predict that PBX3 is likely also involved in BRCA, KIRC, OV, and UCEC.
Finally, we investigated the consensus modules for enrichments of TF target genes from the H1 embryonic stem cell line DNase I accessibility network (Supplementary Fig. 4), because several pluripotency regulators are also identified as oncogenes, such as MYC68,69 and KLF4. 70 In our module sets we found enrichments for targets of several master regulators of pluripotency, including MYC, NANOG, and KLF4 (Supplementary Fig. 4). In addition, we also found enrichment for targets of EP300, a transcriptional coactivator, in modules for BRCA, COAD, KIRC, OV, and UCEC. Mutations in the EP300 protein have been associated with several cancers, including colon and breast cancer. 71
Network-level comparison of Cancers Reveals a Core Shared Regulatory Network
We next examined the networks inferred in each of the cancer types to quantify the extent of shared and cancer-specific network components. At an FDR <0.1 threshold, each network had between 2,900 (UCEC) and 56,546 (OV) edges connecting 770 (UCEC) and 1495 (OV) regulators to 2163 (UCEC) and 8350 (OV) target genes (Fig. 5A, Methods). The smallest network corresponded to uterine and endometrial (UCEC) cancer and the largest network corresponded to COAD. We tested the predictive power of the network models with a cross-validation scheme (Methods). The distributions of correlation values of predicted and observed expression profiles for target genes were obtained for each study, and the median of the per-gene correlation values ranged from 0.63 (LUSC) to 0.73 (KIRC) (Supplementary Fig. 5). These results demonstrate that the consensus networks are highly predictive of expression levels of previously unseen experiments.
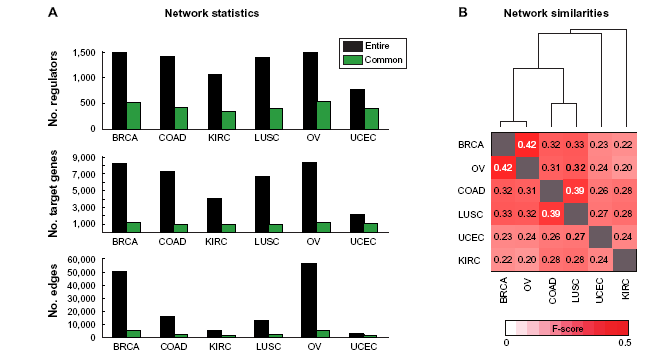
Statistics of consensus regulatory networks inferred in the six cancer data sets. (A) Shown are the number of regulators, targets, and edges in the consensus network of each cancer at a FDR <0.1, and in the network of edges between common regulators and common targets across all six cancer types. (B) shown are the F-score–based similarities of each pair of networks spanning the common regulators and targets of all cancers. The dendrogram shown here depicts which networks are most similar to each other. The height of the dendrogram is proportional to the distance (1 F-score) between each cancer.
A key question to address is to what extent the networks are similar across the cancers. The number of common nodes that were present in all cancer networks included 558 regulators and 1168 target genes, and spanned ~11 (OV) to 55% (UCEC) of the original inferred networks (Fig. 5A). We obtained the set of regulatory edges that were among these common sets of regulators and targets and assessed the similarity between networks for each pair of cancer using two measures (Methods): an F-score measure and the hyper-geometric test P-value to assess the significance of overlap of edge sets between each pair of networks. We found that the similarity among all pairs of networks was highly significant (hyper-geometric test P-value <10-100), and hence we focused on the F-score as this was a more sensitive measure for comparisons. Based on F-score, we find that each cancer network varies in similarity to other cancer networks and revealed both known and new relationships among these cancers. For example, as expected, we found that the breast cancer (BRCA) and the ovarian cancer (OV) network share the largest proportion of edges (F-score 0.44, Fig. 5B). The next greatest similarity was found between the networks for lung carcinoma (LUSC) and colon cancer (COAD) (F-score 0.39, Fig. 5B). In this network comparison, UCEC and the kidney renal carcinoma (KIRC) were indicated to be the most distinct among the six cancers, although some of these differences could be due to the smaller number of samples in the data sets for these two cancers.
To identify the biological processes and molecular pathways that are associated with these shared edges, we examined the MERLIN module assignments of the targets and regulators of the common network components. We found that these modules were enriched for immune-related processes as well as cell cycle, consistent with our previous observation from our module enrichment analysis that these are shared processes among the different cancers.
Finally, we examined the inferred networks to identify regulator target edges that were found in all types of cancer. We identified a conserved regulatory network that was common to all cancers connecting 75 regulatory proteins to 156 target genes (Fig. 6). This network involved TF proteins and signaling proteins from the histone complex (HIST1H2BB, HIST1H2BD, HIST1H2BE, and HIST1H2BG), chromosome stability (RAD51), cell cycle (BUB1B, CDC25C, PPP2R1A, PPP2R2A, and PTTG1 in addition to the histone complex), and immune-related processes (IFNG, NCKAP1L, PTPRC, and RIPK2). These regulators were enriched for functional interactions (Z-score 2.13) from the STRING database, 72 indicating a “cross-talk” between these processes. This common regulatory network represents a core set of processes that are likely perturbed in multiple cancers. Cell cycle aberrations have been known to be associated in cancers, while the roles of histones are emerging from recent cancer genomic studies. 7 The association of these processes with immune response processes in the conserved regulatory network is particularly striking.

The core regulatory network conserved in all six cancers. (A) Shown are the expression profiles of 75 regulatory genes that are common to the MERLIN-inferred network from the six cancer data sets. The data are zero-meaned across all samples from all six studies, where the color map is presented at the bottom of the figure. (B) Shown are known protein–protein interactions of these regulators from the STRING database. The shape of the node shows whether the regulator is a signaling protein or TF. The color of the node indicates the biological process (cell cycle, immune response, chromatin remodeling, chromosome stability) associated with each node. (C) Shown are the expression profiles of the 156 target genes that are common to the networks of each cancer study in the same way as in panel A.
Differential Network Analysis Reveals Conserved and Rewired Network Hubs in each Cancer Type
We next investigated the network topology to identify cancer-specific network components. The “out degree” distribution, defined as number of targets for any regulator, was highly nonuniform (Fig. 5C). For example, in the inferred regulatory network for BRCA, the average out degree was 33, but there were several regulators that connected many more target genes (eg, TRIM29, which connected 117 targets, and PPAPDC1A, which connected >200 target genes). We defined a “regulator hub” as a regulator with an out degree in the top 1% of all regulators in a network. Several of these hub regulators in the top 1% of one cancer network were also in the top 1% in another cancer network (eg, PTPRC was in the top 1% of OV, UCEC, COAD, and LUSC (Fig. 7). In all, there were 53 regulatory hubs identified across all six networks, and these included TFs and signaling proteins.
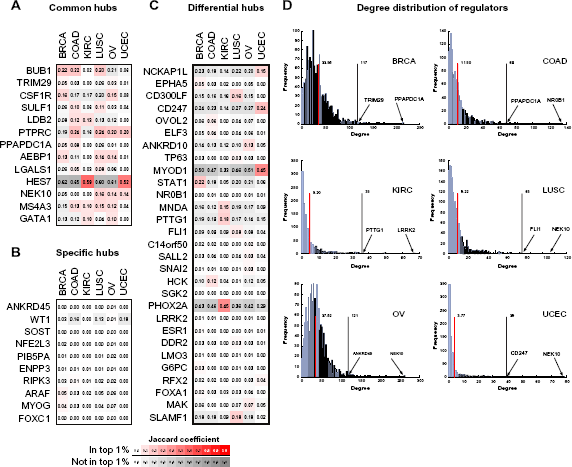
Common and differential regulatory network hubs. Shown are the Jaccard coefficients of different types of regulatory hubs from the consensus networks of each of the six cancers. Columns of each heatmap correspond to one of the cancers, and the rows correspond to a specific regulatory hub. The ith row and jth column show the average similarity of the edges of the ith hub from the jth cancer-specific network across all other cancer-specific networks. The white-red color map corresponds to the hub being present in the top 1% of an inferred cancer network (column). The white-gray color map is for regulators that are not in the top 1%. The plots presented are for (A) common hubs, (B) cancer-specific hubs and (C) differential hubs. (D) shown are the degree distributions of the out degree of regulators in the consensus networks of each cancer. The red line indicates the mean out degree, and black line shows the degree threshold for the top 1% hubs.
To systematically assess the extent to which these hubs were shared among the different cancer-specific regulatory networks, we grouped these hubs into three categories (Methods): (1) Common hubs: those that were connecting similar sets of targets between different cancers; (2) Differential hubs: those that were hubs in networks from two cancers but targeted different genes; and (3) Cancer-specific Hubs: those that were hubs in only one cancer network.
There were 13 common hubs, four of which were in the core regulatory network described in the previous section (Fig. 7A). These regulators included genes known to be involved in immune processes (PTPRC: T and B cell signaling, and CSF1R), cell cycle (NEK10, BUB1), and development (HES7, AEBP1), which is consistent with the shared enrichment of these processes across multiple cancers. Several of these genes have known roles in multiple types of cancers, such as NEK10 in breast cancer, 73 and BUB1 in colorectal cancer. 74 Additionally, CSF1R signaling has been implicated as important in successful radiation treatment of prostate cancer, 75 and AEBP1 has been identified in a biomarker signature for poor prognosis in ovarian cancer. 76 These genes might influence the cancerous state in different cancers through the same mechanisms.
The differential hubs constituted the largest proportion of the hubs (Fig. 7C). These 29 genes included LRRK2, ELF3, and FOXA1, which were also found to have among the largest number of somatic mutations in a recent comprehensive study of mutational distributions in 12 different cancers. 12 To examine whether these differential hubs were targeting different cancer signaling pathways in each cancer type, we associated each regulator with an NCI cancer signaling pathway by using the MERLIN-predicted regulators and pathway enrichments of a module (Methods). The extent of similarity of regulator-pathway associations between the differential hubs was significantly smaller than these associations between the common hubs (T-test P-value <1E-7), but also depended upon the specific type of cancer. For example, we found that the differential hubs targeted different pathways in OV, whereas the differential hubs targeted similar pathways in KIRC and LUSC. One interesting example was G6PC, which was in the top 1% of hubs in the BRCA network and in the top 10% of hubs in the COAD and OV networks. G6PC was found in an OV consensus cluster associated with FOXA signaling pathways, but was not found in the consensus clusters of BRCA, and COAD that were associated with FOXA signaling. Overall, these results suggest that the association of a hub to a pathway in any cancer type is complex and likely very specific to each cancer.
Finally, 11 regulators were identified as hubs exclusively in the regulatory network of a specific cancer (Fig. 7C). Several of these cancer-specific hubs have specific roles in the type of cancer that they were uniquely identified with. For example, NFE2L3, a hub in COAD, has been associated with colorectal cancer 37 and was also among one of the highly mutated cancer genes. 12 FOXC1, which was found to be a unique hub in the BRCA regulatory network, has been implicated as a prognostic biomarker for breast cancer. 77 Other regulators in this category included WT1, SOST, PIB5PA, and ENPP3, of which some have established roles in other types of cancer or other diseases. For example, PIB5PA is implicated in skin cancer, 78 WT1 in ovarian and other cancers,79,80 and SOST has been studied in connection to bone diseases.81,82 Overall, these results suggest that some of the cancer-specific hubs have known roles in the relevant cancer type, while hubs are associated with multiple disease states. A more detailed study of these hubs coupled with functional validation studies can reveal previously uncharacterized pathways for these cancer types.
Discussion
A major challenge in cancer genomics is to identify aberrations in molecular networks in different cancer types that can be therapeutically targeted. Different cancers with different tissues of origin might be driven by the same underlying mechanisms. With the efforts of consortia such as TCGA, we can now characterize different cancers on a genomewide scale. However, a challenge is the lack of computational methods that can effectively mine these data to find conserved and unique network components among many cancers. In this paper, we applied a regulatory module network-based approach. 13 To interpret the predicted regulatory networks, we developed and applied network-based measures to identify regulatory network components, such as modules and regulatory hubs that are associated with different types of cancers.
While the role of transcriptional regulators, such as TFs, chromatin remodelers and upstream signaling regulators in disease states is widely accepted, 1 a systematic analysis of the role of these genes in cancer in research is difficult due to the limited understanding of mammalian regulatory networks. To address this, we used a two-pronged approach: (1) using a recently developed regulatory network inference approach called MERLIN, that predicts regulators for individual genes and modules, we inferred regulatory networks for each of six cancer types and (2) performing a systematic comparison of modules and networks by integrating curated pathways from multiple sources such as Gene Ontology, KEGG, and REACTOME, as well as DNase I hypersensitivity footprints. Our analysis approach builds on the idea that both module- and network-based characterization of complex transcriptional programs are important and have been shown to be useful in studies of other complex systems, such as development 83 and immune responses. 84 Our analysis revealed several common and cancer-specific network components. Module-based analysis enabled us to describe gene expression across multiple tumor samples through a few major patterns of expression. We found that in almost all cancer types, there was an over-representation of immune-related processes, and importantly, these were induced. This suggests that the immune system is playing an active role in these cancer types. Our findings are particularly interesting with respect to the known role of the immune system in response to chemotherapy.34–36 The immune system in general plays an important role both in the ability of cancers to develop or not86–88 and in the success of therapeutic treatment of cancer. 89
Comparison of the networks across different cancer types identified a core regulatory network common to all cancers. This network included histone proteins, cell cycle regulators, as well as immune response regulators predicting a connection between these processes in the context of multiple cancers. The regulators of the core network were further enriched for functional interactions suggesting that the predicted signaling and TFs participate in common pathways to regulate downstream gene expression patterns in a single framework.
Using the inferred regulatory networks, we were able to identify regulatory hub nodes that had a disproportionately higher number of targeted genes than other regulators. Among the identified hubs, we found most were “differential hubs” that seemed to target a different set of genes in different cancers. Several of these differential hubs have already been implicated in specific cancer types or are among genes that tend to have the largest number of sequence mutations in cancers. 12 An interesting question is whether these differential hubs regulate genes in the same processes or whether they target different processes and pathways in different cancers. We examined this question using the available cancer signaling pathways and observed both of these scenarios. It is possible that the current set of curated pathways does not provide the necessary resolution to specifically identify pathways that are differentially modified. Moreover, despite the utility of curated gene sets and pathways, they are nevertheless incomplete. Thus, a next step would be to couple our observations with experiments that test the functional significance of some of our hubs in the context of different cancer cell lines and to identify the mechanisms by which these hubs act on their downstream genes.
Our work can be extended in several ways. We have thus far examined only gene expression data. Our approach can be applied to other functional data that are becoming increasingly available in cancer genomic studies, such as protein and phosphoprotein levels. Another direction for future work is the integration of small RNA molecules in these networks, in order to more comprehensively study both transcriptional and posttranscriptional levels of regulation that control cellular states. Finally, we have not integrated somatic mutations in our present analysis, and an important next step would be to test whether our modules are enriched for mutations in specific classes of genes.
In summary, we have described a regulatory module network-based pan-cancer analysis that enabled us to recover known aspects of cancer biology as well as predict novel regulators of cancer-specific transcriptional behavior. As more molecular data sets for many different cancer types become available, approaches such as ours can be used to identify common and unique vulnerabilities and can help prioritize network nodes for therapeutic interventions.
Author Contributions
Conceived and designed the experiments: SR. Analyzed the data: SK, AFS. Wrote the first draft of the manuscript: SR, SK. Contributed to the writing of the manuscript: SK, AFS, SR. Agree with manuscript results and conclusions: SK, AFS, SR. Jointly developed the structure and arguments for the paper: SR, SK. Made critical revisions and approved final version: SR, SK. All authors reviewed and approved of the final manuscript.