
Abstract
Background:
Gastric cancer is aggressive with poor prognosis due to high invasion and metastasis rates, a hallmark of cancer. The Snail family (SNAI1 and SNAI2) drives EMT, enabling epithelial cells to gain migratory and invasive traits.
Methods:
We used “limma” package to identify genes with differential expression between high and low levels of SNAI1/SNAI2 in TCGA stomach adenocarcinoma dataset, intersecting these with cancer invasion and metastasis genes obtained from 5 databases. Using Cox regression analysis, we developed a risk score model and created a nomogram incorporating clinical data. The model’s prognostic accuracy was validated with survival and ROC analyses in both TCGA and GEO datasets. Additionally, we performed WGCNA and constructed a ceRNA network to investigate gene interactions, and used CIBERSORT analysis to evaluate immune cell composition in the tumor microenvironment.
Results:
We developed 5 and 9 risk signatures and nomograms incorporating clinical data. Survival analysis showed high-risk patients had worse overall survival than low-risk patients. WGCNA identified a lightyellow module associated with SNAI1 and SNAI2 expressions, emphasizing extracellular matrix organization. CeRNA network analyses found 6 common hub genes linked to SNAI1 and SNAI2. Immune profiling showed that SNAI1 expression was related to 8 types of immune cells, while SNAI2 was connected to 6, indicating their roles in influencing the tumor microenvironment.
Conclusion:
This study highlights the significant prognostic impact of SNAI1 and SNAI2 in stomach adenocarcinoma, linking their high expression to poorer survival and aggressive tumor behavior, while also identifying potential therapeutic targets through comprehensive computational analysis.
Graphical Abstract

Introduction
Gastric cancer (GC), primarily adenocarcinoma, accounts for 90% to 95% of all stomach cancers and can be separated into cardia and non-cardia types.1,2 Ethnicity, food, and illnesses like Helicobacter pylori (H. pylori) and human papillomavirus (HPV) all affect its incidence.3-5 Gastric cancer was the fourth most common cause of cancer-related deaths worldwide in 2020 and the fifth most common type of cancer overall.6,7
Although the epithelial-mesenchymal transition (EMT) is essential for tissue repair and embryonic development, it can also accelerate the growth of GC tumors. In this biological process, epithelial cells acquire the migratory and invasive characteristics of mesenchymal cells while losing their polarity and cell-cell adhesion.8,9 Significant alterations occur in cells during EMT, such as the elevation of mesenchymal markers like vimentin and N-cadherin, which are controlled by transcription factors like SNAIL, TWIST, and ZEB, and the downregulation of epithelial markers, specifically E-cadherin. Increased tumor aggressiveness, metastasis, and resistance to treatment are linked to this process.10-12 Understanding the role of EMT in GC can provide deeper insights into tumor development and support the development of early diagnosis markers and targeted therapies. 13
EMT is intricately connected to the tumor immune microenvironment (TME), influencing and responding to changes in immune cell composition. EMT is linked to elevated levels of immunological checkpoints such as PD-L1 and immunosuppressive cells, specifically myeloid-derived suppressor cells. Snail, Zeb1, and Twist1 promote an invasive state in the carcinoma state by stimulating chemokine secretion, which attracts immunosuppressive cells. This creates a feedback loop that accelerates tumor progression and facilitates immune evasion.14-17 Innate immune cells, such as neutrophils and macrophages, can also promote or inhibit the formation of tumors.18,19 Designing treatments that increase anti-tumor immunity and enhance treatment results requires an understanding of the connection between EMT and the immunological landscape. 20
The Snail family, particularly Snail (SNAI1) and Slug (SNAI2), primarily contribute to mediating EMT. These zinc-finger transcription factors suppress the expression of epithelial markers while increasing mesenchymal characteristics by binding to E-box sites in target gene promoters. For example, in breast, gastric, colon, and hepatocellular carcinomas, aberrant activation of Snail and Slug is linked to enhanced tumor invasiveness and metastasis, as they facilitate the transition from immobile epithelial cells to motile mesenchymal cells.21-23 SNAI1 is strongly controlled at both transcriptional and post-translational levels by a variety of growth factors and cytokines, promotes resistance to apoptosis and drug resistance, and increases the transcription of certain genes involved in development and cancer. 24 Furthermore, SNAI2 regulates cell migration during embryogenesis and tumor cell invasion. Its expression is often linked to poor prognosis in various cancers, as it promotes EMT and enhances stem cell-like properties in tumor cells, contributing to resistance against therapies and increased proliferation in certain cancer types. 25
Small, noncoding RNA molecules known as microRNAs (miRNAs) bind to target messenger RNAs (mRNAs) and either break them down or stop them from translating, thereby regulating gene expression. The competing endogenous RNA (ceRNA) hypothesis suggests that RNAs with common miRNA binding sites can regulate each other’s expression by competing for these sites. RNA abundance, location, binding strength, and structure influence ceRNA activity, and disturbances in these factors can disrupt ceRNA networks, potentially leading to diseases, notably cancer.26-28 Certain long noncoding RNAs (lncRNAs) have the ability to increase the invasiveness of gastric cancer by upregulating the expression of transcription factors linked to EMT. Identifying prognosis-related ceRNA networks may progress diagnostic and therapeutic strategies for gastric cancer.29-31
The complex interplay between SNAI1 and SNAI2 gene expression patterns remains a compelling area of investigation in stomach adenocarcinoma (STAD) research. Drawing upon multi-faceted computational systems biology, we designed a multilayered analytical framework that integrates several computational methods to illuminate the molecular consequences of SNAI1 and SNAI2 expression changes by stratifying samples into high and low expression cohorts for both SNAI1 and SNAI2. Our methodology weaves together several analytical techniques: differential gene expression (DGE) profiling to identify key transcriptional changes, weighted gene co-expression network construction to unveil coordinated gene behavior patterns, competing endogenous RNA network analysis to map regulatory interactions, and CIBERSORT deconvolution to characterize immune cell type populations.
Methods and Materials
Data Sources and Processing
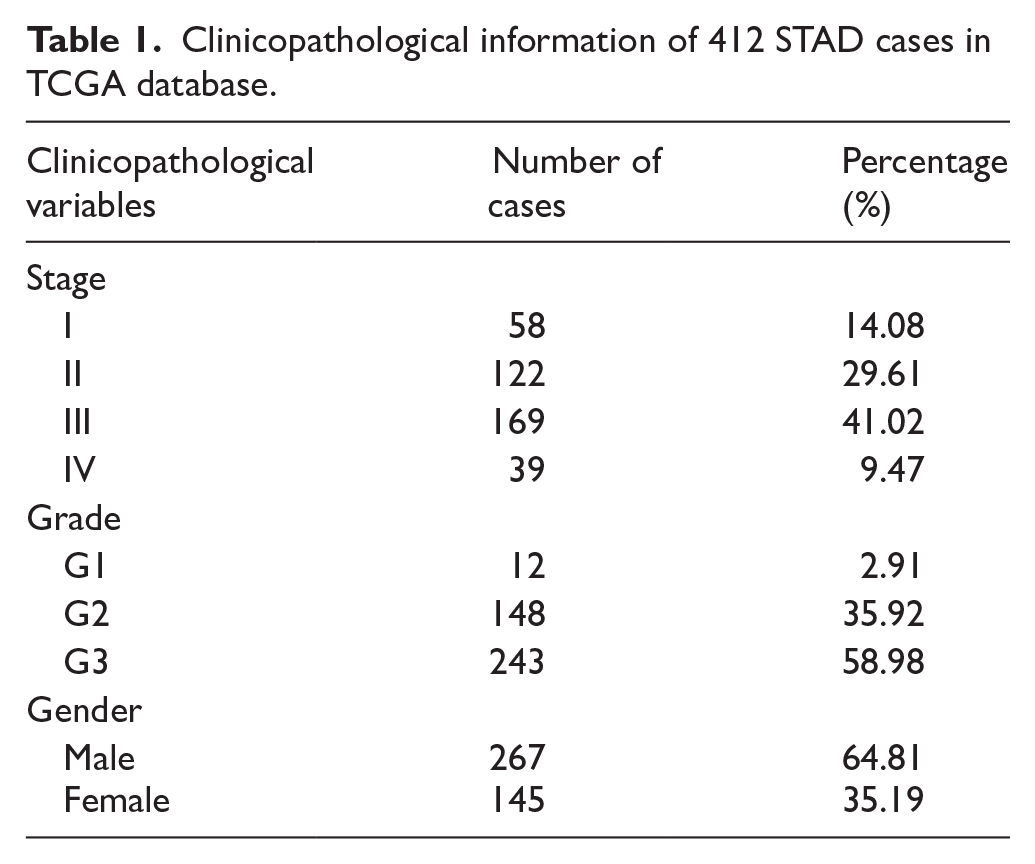
We obtained clinical data and Level 3 RNA sequencing data from the STAD cohort in The Cancer Genome Atlas (TCGA), which included 412 STAD cases (Table 1, Supplemental Table S1) and 36 normal samples. We normalized the gene expression data using the trimmed mean of M-values (TMM) method in the “edgeR” package, followed by the voom transformation in the “limma” package in R to ensure accurate comparison of expression levels. We sourced genes related to cancer invasion and metastasis from several established databases such as CancerSEA (single-cell functional state atlas), 32 CHG (cancer hallmark genes), 33 COSMIC (somatic mutation catalog), 34 GeneCards (comprehensive gene information), 35 and MSigDB (molecular signatures database). 36 In addition, we obtained microarray expression datasets GSE62254 and GSE15459 from the Gene Expression Omnibus (GEO) database, which included 300 and 200 gastric tumor samples, respectively. We calculated the mean expression levels of SNAI1 and SNAI2 from the 36 normal samples, which were used to stratify the 412 STAD samples into high and low expression groups. DGE analysis was subsequently conducted between these groups using the “limma” package, with an adjusted P-value cutoff of .05 to identify differentially expressed genes (DEGs).
Clinicopathological information of 412 STAD cases in TCGA database.
Creation of the Risk Score Model
We used the “Survival” package in R to perform univariate Cox regression analysis on genes that were common between the DEGs and the invasion and metastasis- related gene sets from the 5 databases. Next, we performed multivariate Cox regression analysis to identify genes that form the final risk signature. This risk signature underwent validation through Kaplan–Meier survival analysis, with patient risk scores calculated as the linear combination of gene expression levels (Exp) multiplied by their respective regression coefficients (β), as follows:

Patients were then divided into high-risk and low-risk groups based on the median risk score.
Risk Signature Assessment and Nomogram Development
Kaplan–Meier survival curves were used to evaluate overall survival disparities between high and low risk groups. To assess the predictive efficacy of the risk signature, we conducted time-dependent receiver operating characteristic (ROC) analyses using the “survival ROC” package in R. These analyses were performed on the TCGA training set and validated on the GEO datasets. Nomograms, integrating 5-gene and 9-gene signatures derived from multivariate Cox analyses, were constructed using the “rms” package. Further, risk scores and other clinical covariates from the TCGA dataset informed the construction of additional nomograms.
Gene Set Enrichment Analysis
We conducted Gene Set Enrichment Analysis (GSEA) to determine the differential enrichment of Kyoto Encyclopedia of Genes and Genomes (KEGG) pathways between high and low risk STAD groups. GSEA software (Java-based) facilitated this analysis, with the high and low risk groups delineated by the median risk scores.
Weighted Gene Co-expression Network Analysis (WGCNA)
WGCNA is a systems biology technique that characterizes gene correlation patterns across samples, identifies clusters of highly correlated genes (modules), and connects these clusters to external traits. It aids in network-based gene screening to discover potential biomarkers or therapeutic targets in diverse biological settings. 37 We used the “WGCNA” package in R to construct a scale-free co-expression network, where the network structure emphasizes strong correlations between gene pairs. We computed the variance of each gene in the preprocessed expression matrix, which was generated using the “limma” and “edgeR” packages with TCGA data. We selected genes with variance values above the third quartile threshold for further analysis. In order to incorporate 8635 genes out of 34 539 genes, the expression matrix was adjusted. These genes were then used as input for the WGCNA analysis. The process started with constructing a similarity matrix, which utilizes the absolute values of Pearson’s correlation coefficients between pairs of genes derived from expression data. We converted the similarity matrix into an adjacency matrix (aij) using a soft-thresholding power (β), emphasizing strong gene-gene connections and minimizes weaker correlations. The adjacency matrix was then transformed into a Topological Overlap Matrix (TOM), which measures how strongly genes are associated with one another. We performed hierarchical clustering on the TOM to group similar genes into network modules using the Dynamic TreeCut algorithm. The most representative genes, referred to as module eigengenes (MEs), were calculated as the first principal components, representing the overall gene expression levels within each module. We calculated module membership (MM) by determining the Pearson correlation between the expression profile of a gene and the ME, which represents the core expression pattern of the module. Additionally, gene significance (GS) was assessed to evaluate a gene’s relevance to other biological factors, with higher GS values indicating greater prognostic significance for patients. This systematic approach enables the construction and analysis of gene networks, providing valuable insights into gene interactions and their potential clinical implications. In addition, we performed enrichment analysis on genes in selected modules using the “enrichR” package.
Construction of the ceRNA Network
For the ceRNA network, we incorporated data on lncRNA-miRNA and mRNA-miRNA interactions from RNAInter 38 and miRTarBase 39 databases, respectively. We filtered these interactions based on DGE analysis results from the SNAI1 and SNAI2 high and low expression groups. We normalized the raw RNA-seq and miRNA-seq data from TCGA-STAD samples using the gdcVoomNormalization function in the GDCRNATools package, which was then used for ceRNA analysis. The gdcCEAnalysis function was used to construct ceRNA networks by integrating multiple analytical methods, including hypergeometric testing for shared miRNAs, Pearson correlation for lncRNA-mRNA associations and partial correlation analysis for network construction. This comprehensive approach allowed us to identify miRNAs correlated with both lncRNAs and mRNAs, pinpoint positively correlated lncRNA-mRNA pairs, and determine miRNAs with similar regulatory effects on lncRNAs and mRNAs. The resulting lncRNA-miRNA-mRNA interactions were visualized as a network using Cytoscape 3.10.1, providing a holistic view of the ceRNA landscape in STAD.
CIBERSORT Analysis
Cell-type Identification by Estimating Relative Subsets of RNA Transcripts (CIBERSORT), is a computational tool that analyzes the immune cell composition within the tumor microenvironment using gene expression data. It employs the LM22 gene signature, consisting 22 specific immune-related genes, to estimate the relative proportions of various immune cell types, including T cells, B cells, and macrophages. By using this technique, scientists can comprehend how these immune cells interact with tumor cells and affect the progression of cancer.40,41 We utilized CIBERSORT (available at http://cibersortx.stanford.edu), to analyze the immune cell composition of each sample based on TCGA transcripts per million (TPM) data for STAD. The analysis was conducted with 500 permutations. We included only samples with a CIBERSORT output P-value <.05 for further analyses. To evaluate the association between the 22 immune cell types and the SNAI1/SNAI2 high and low expression groups, we employed the Wilcoxon rank-sum test.
Results
Differential Gene Expression Analysis of SNAI1 and SNAI2 in STAD
A schematic diagram (Figure 1) illustrates the methods and findings of our study. The average expression levels of SNAI1 and SNAI2 in 36 normal STAD samples were 2.4 and 3.6, respectively. Among 412 cancer samples, 303 with SNAI1 expression levels exceeding 2.4 were classified as the high expression group, while the remaining 109 with levels below 2.4 were categorized as the low expression group. Similarly, 155 cancer samples with SNAI2 expression levels above 3.6 were categorized as the high expression group, where the 257 samples with lower expression were classified as the low expression group. Utilizing the limma package with an adjusted P-value threshold of <.05, we identified 9587 DEGs between the high and low SNAI1 expression groups and 13 592 DEGs between the high and low SNAI2 expression groups (Figure 2).
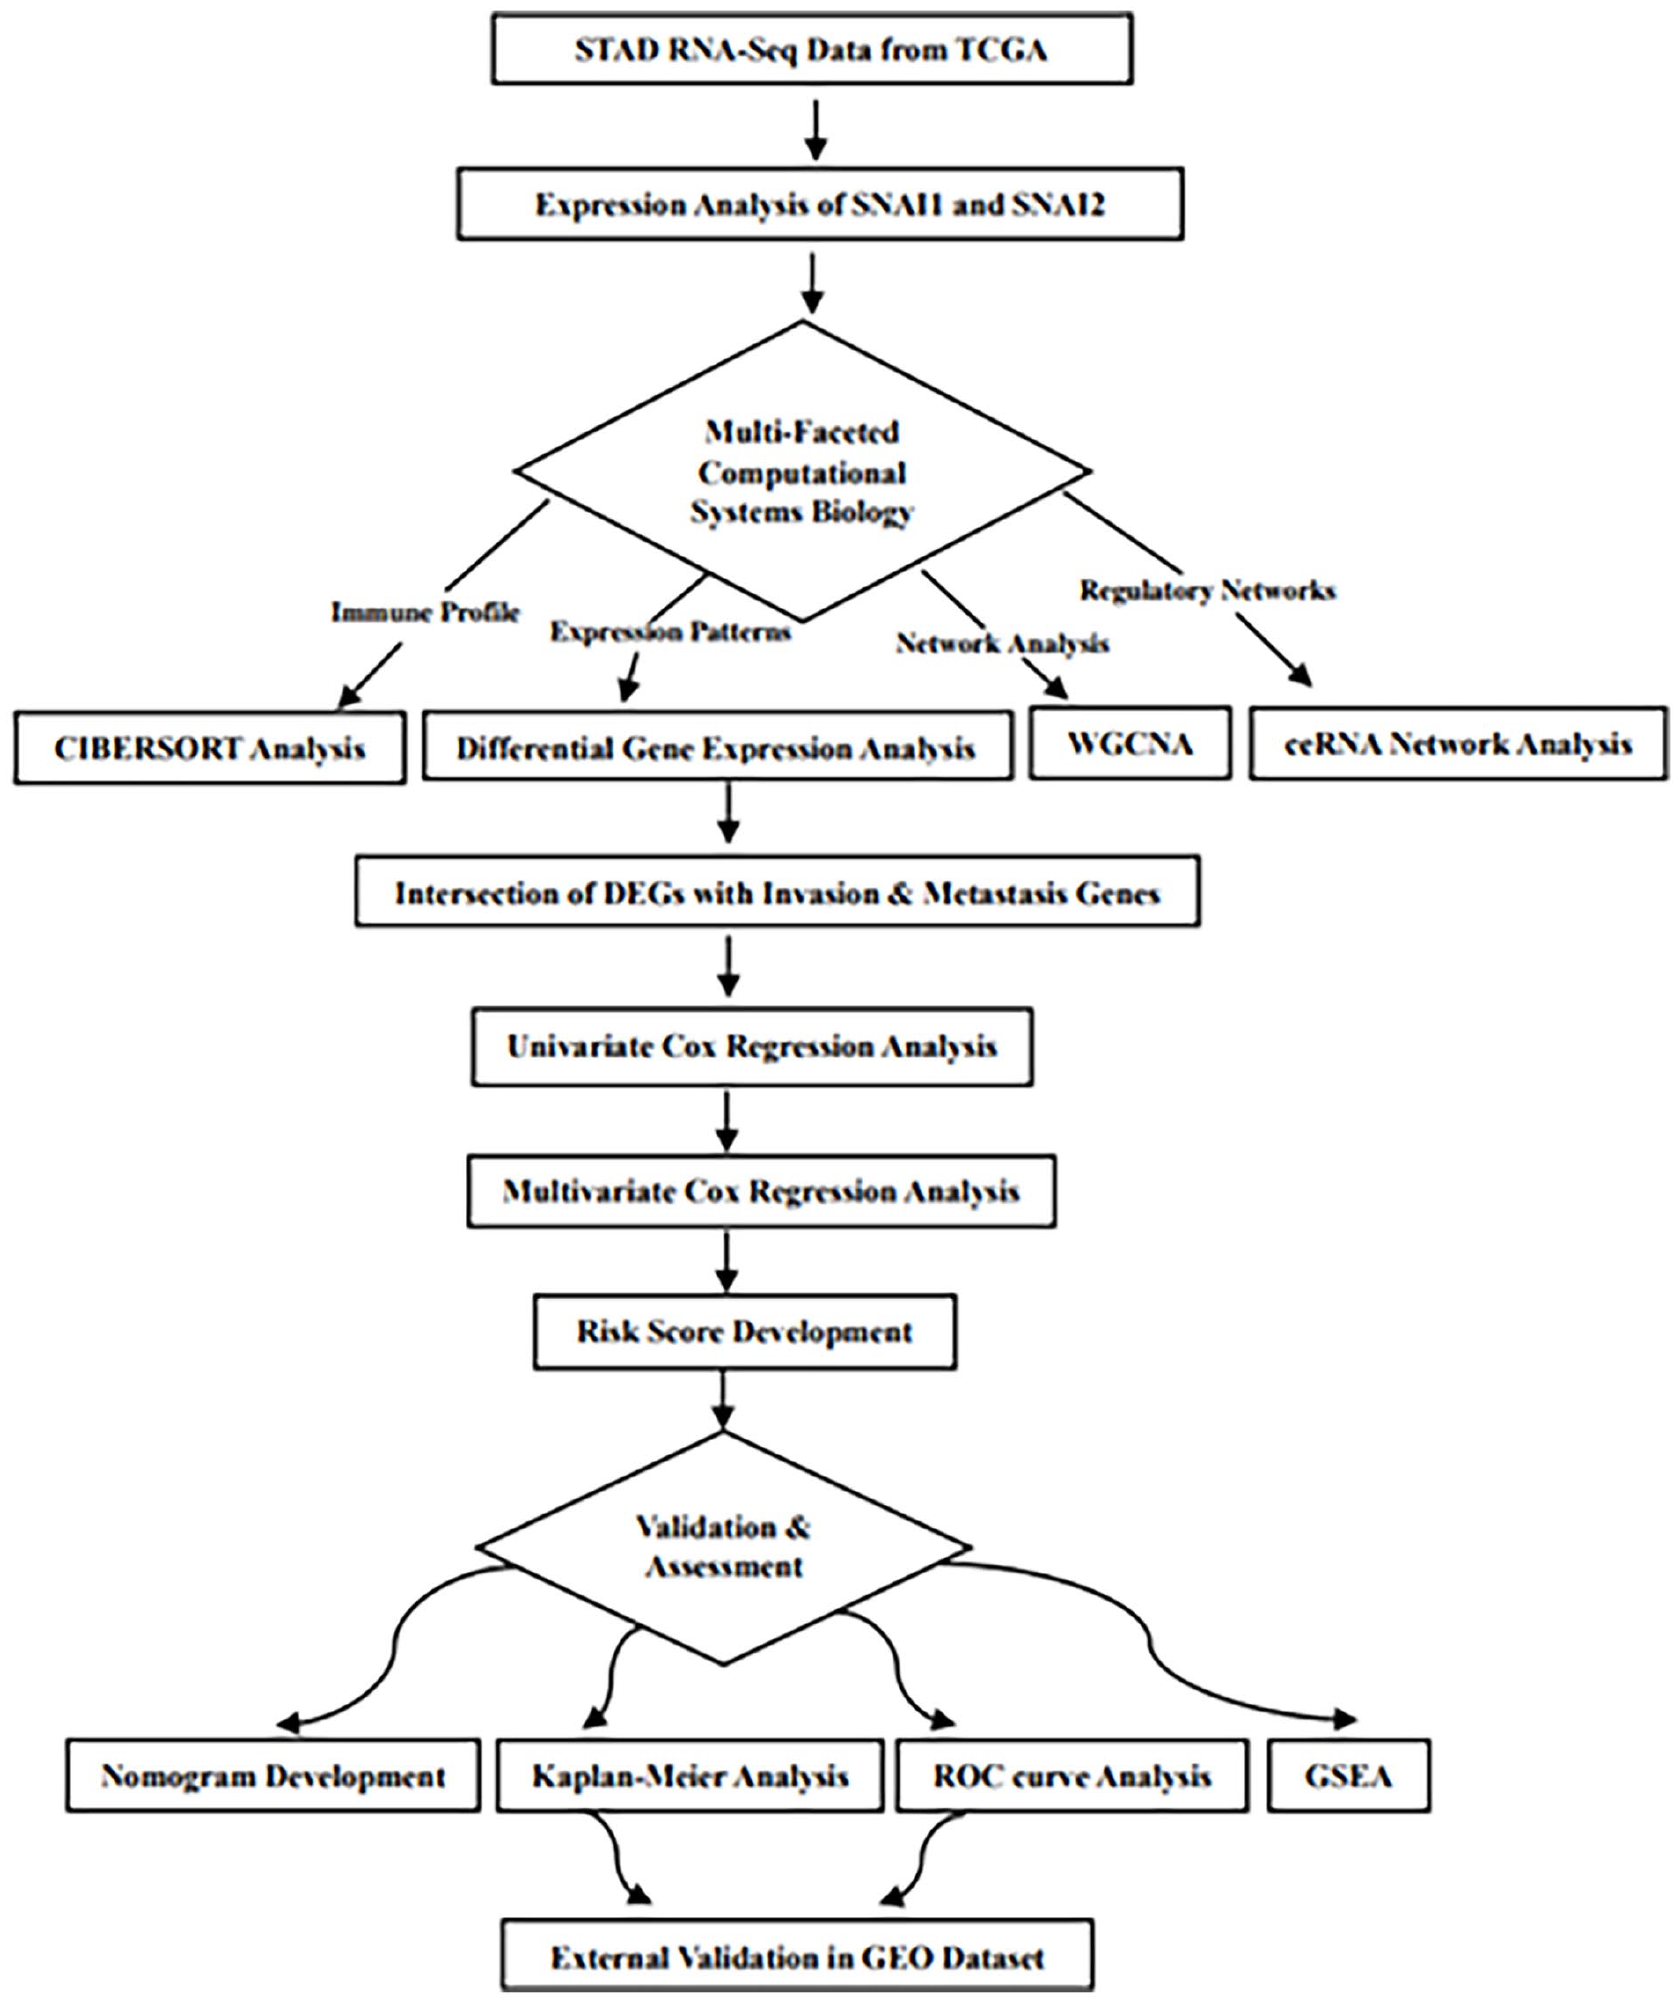
The comprehensive flow chart of the research process.
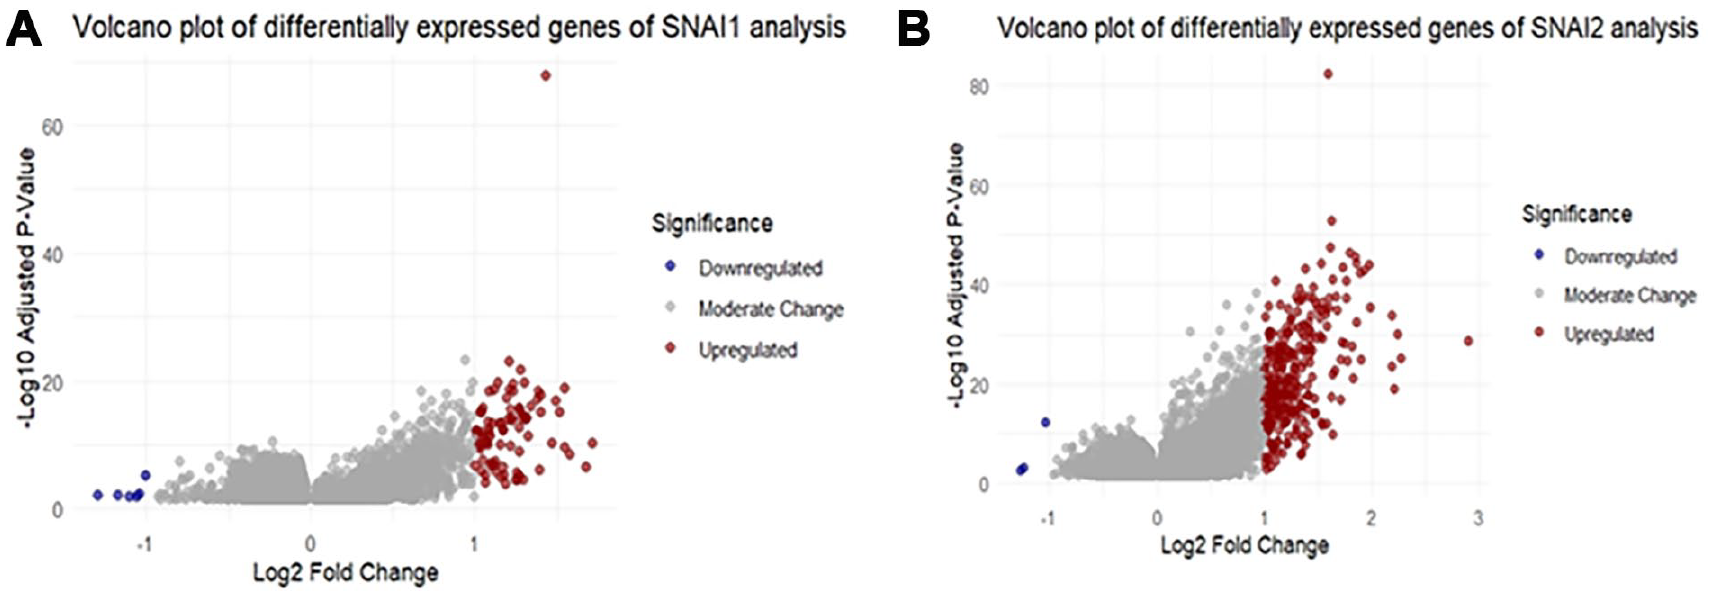
Volcano plots of differentially expressed genes of SNAI1 (A) and SNAI2 (B) analyses.
Identification of Prognostic Signature Genes
We identified a total of 2417 genes associated with invasion and metastasis from 5 databases. We discovered 786 genes for SNAI1 and 1124 genes for SNAI2 by intersecting these genes with 9587 SNAI1-related and 13 592 SNAI2-related DEGs. We performed univariate Cox regression analysis on these gene sets using data from 366 STAD patients with complete clinical information. This analysis produced 57 significant genes from the SNAI1 set and 71 significant genes from the SNAI2 set (P < .05; Supplemental Table S2). Subsequently, we conducted multivariate Cox regression analysis on the significant genes identified in the univariate analysis. For the SNAI1 set, 5 genes emerged as significant prognostic markers (P < .05; Table 2). The SNAI2 set also showed 9 genes that were significant prognostic markers (P < .05; Table 3).
Multivariate cox regression analysis of 5 significant genes of SNAI1 analyses.

Multivariate cox regression analysis of 9 significant genes of SNAI1 analyses.

Development and Evaluation of Prognostic Models
We employed multivariate Cox regression analysis (using the Survival package in R) to construct 2 risk signatures for predicting overall survival (OS) in STAD patients. The first signature consisted of 5 genes, while the second comprised 9 genes. Based on median risk scores, we stratified 366 STAD patients into high- and low-risk groups. The OS differences between the 2 risk groups were then assessed using Kaplan-Meier survival analysis, which revealed a significant difference between the groups. Additionally, ROC analysis was carried out to examine the ability of the risk signatures to predict overall survival in STAD patients. The sensitivity and specificity of the risk signatures in predicting OS were assessed using the area under the curve (AUC) values (Figure 3A and B). Furthermore, within the TCGA dataset, only the Kaplan-Meier survival analysis and AUC at 5 years for SNAI1 expression failed to reach statistical significance. We validated the prognostic value of the risk signatures using independent GEO datasets. Significant OS differences between the high- and low-risk categories in the validation cohorts were verified by repeating the Kaplan-Meier survival analysis. Additionally, ROC analysis of these validation datasets demonstrated high sensitivity and specificity for the risk signatures (Figure 3C and D).

Evaluation of risk signatures for predicting overall survival in STAD patients. (A) Left, Kaplan–Meier survival analysis of the high- and low-risk groups of SNAI1 analyses from TCGA. Right, AUC values from ROC analysis at 3 and 5 years. (B) Left, Kaplan–Meier survival analysis of the high- and low-risk groups of SNAI2 analyses from TCGA. Right, AUC values from ROC analysis at 3 and 5 years. (C) Similar to 2A from GEO. (D) Similar to 2B from GEO. (A) TCGA-SNAI1. (B) TCGA-SNAI2. (C) GEO-SNAI1. (D) GEO-SNAI2.
Nomogram Construction and Validation
We constructed nomograms based on multivariate Cox proportional hazards regression analyses using the “rms” package in R. The nomograms (Figure 4A and B) incorporated the 5-gene and 9-gene risk signatures to predict 3-year and 5-year survival probabilities in STAD patients. We also constructed nomograms that integrated the 5-gene and 9-gene signatures with clinical variables such as age, gender and cancer stage to predict 3-year and 5-year survival probabilities in STAD patients. The nomograms’ dependability was proved by the calibration curves, which showed a high degree of agreement between the actual and anticipated 3-year and 5-year survival probabilities (Figure 4C and D).

Nomograms for predicting 3-year and 5-year survival probabilities in STAD patients. (A) Left, nomogram incorporating the 5-gene signature derived from multivariate cox proportional hazards regression of SNAI1 analyses. Right, calibration curves of the nomogram for predicting 3-year or 5-year overall survival (OS). (B) Nomogram incorporating the 9-gene signature derived from multivariate cox proportional hazards regression of SNAI2 analyses. (C) Nomogram integrating risk score with additional clinical data of SNAI1 analyses. (D) Nomogram integrating risk score with additional clinical data of SNAI2 analyses.
Gene Set Enrichment Analysis
We ran the Kyoto Encyclopedia of Genes and Genomes (KEGG) pathway analysis on the differentially expressed genes between the high-risk and low-risk groups for SNAI1 and SNAI2. The analysis showed that the high-risk SNAI1 phenotype was significantly enriched in pathways related to proteasome, homologous recombination, and base excision repair (Figure 5). Alternatively, the high-risk SNAI2 phenotype was enriched in focal adhesion, TGF-beta signaling pathway, and cancer-related pathways (Figure 6).

GSEA analysis. (A) KEGG pathways of SNAI1 analyses indicate pathways including proteasome, homologous recombination and base excision repair. (B) Heatmap of GSEA analysis between high-risk and low-risk groups.

GSEA analysis. (A) KEGG pathways of SNAI2 analyses indicate pathways including focal adhesion, TGF beta signaling pathway and pathways in cancer. (B) Heatmap of GSEA analysis between high-risk and low-risk groups.
Weighted Gene Co-expression Network Analysis (WGCNA)
We analyzed metastasis characteristics from the Tumor, Node, Metastasis (TNM) classification system and SNAI1/SNAI2 expression levels (categorized as high and low) as external traits in the WGCNA analysis. The initial expression matrix comprised 412 tumor samples. After excluding samples with incomplete metastasis information, we refined the dataset to 391 samples. Of these, 391 samples and 8635 selected genes served as input for the WGCNA analysis. Using the average clustering method, we clustered the 391 samples and identified 2 outlier samples from the clustering tree, which were subsequently removed. Following outlier removal, we performed sample clustering again with updated information for subsequent WGCNA analyses (Figure 7A and B).

WGCNA analysis of metastasis characteristics and SNAI1/SNAI2 gene expression. (A) Dendrogram of samples and heat map of metastasis and SNAI1 expression traits. (B) Dendrogram of samples and heat map of metastasis and SNAI2 expression traits. (C) The soft threshold in the scale-free topology fitting of SNAI1 analyses. (D) The soft threshold in the scale-free topology fitting of SNAI2 analyses. (E) Correlation between module eigengenes and metastasis and SNAI1 expression traits. (F) Correlation between module eigengenes and metastasis and SNAI2 expression traits.
We established a scale-fee network and identified modules strongly correlated with SNAI1 and SNAI2 expression levels. The soft thresholding power was set to 3 for both SNAI1 and SNAI2 modules (Figure 7C and D). We determined the resulting modules, designating non-clustering modules as gray. The analysis identified 15 gene modules for both SNAI1 and SNAI2 analyses. Among these, ME-lightyellow demonstrated the strongest correlation with both SNAI1 (r = .57, P = 1e-34) and SNAI2 (r-.65, P = 3e-47) expression groups (Figure 7E and F). Gene Ontology (GO) enrichment analysis using the “enrichR” package revealed significant biological processes, notably extracellular matrix (ECM) organization (Figure 8).

GO enrichment analysis of lightyellow module genes of SNAI1 (A) and SNAI2 (B) analyses.
Construction and Analysis of ceRNA Networks
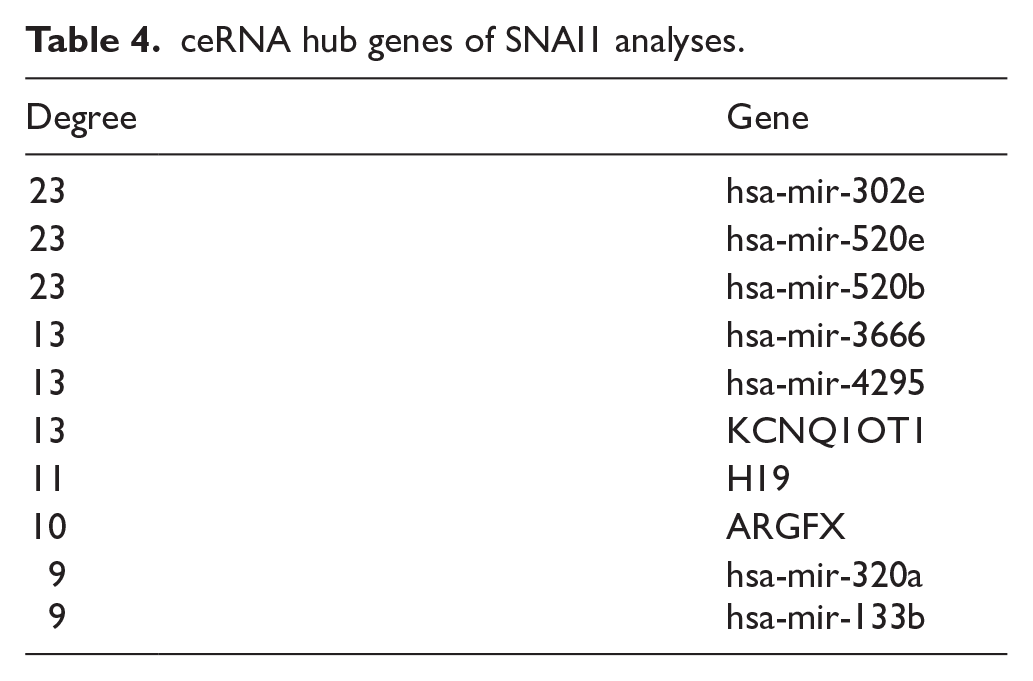
The DGE analysis of SNAI1 and SNAI2 expression groups identified 4025 and 5841 differentially expressed mRNAs, respectively. We filtered the mRNA-miRNA interactions from miRTarBase to retain only those corresponding to mRNAs identified as DEGs. Similarly, DGE analysis for SNAI1 and SNAI2 expression groups revealed 91 and 143 differentially expressed lncRNAs, respectively. We then filtered lncRNA-mRNA interactions from RNAInter to include only those related to the differentially expressed lncRNAs. We used these filtered interactions as input for the GDCRNATools package during the network analysis phase. The ceRNA network analysis (Supplemental Table S3) identified 223 edges and 118 nodes associated with SNAI1, while for SNAI2, 587 edges, and 255 nodes were identified (Supplemental Table S4). We visualized the ceRNA networks for SNAI1 and SNAI2 using these edges and nodes in Cytoscape (Figure 9A and B, Supplemental Figures S1 and S2). Further analysis of the networks using Cytoscape’s “Analyze Network” tool allowed us to identify the top 10 genes with the highest degree values, which we classified as hub genes (Tables 4 and 5).

ceRNA networks of SNAI1 (A) and SNAI2 (B) analyses.
ceRNA hub genes of SNAI1 analyses.
ceRNA hub genes of SNAI2 analyses.

Immune Cell Profile Association With SNAI1 and SNAI2 Expression
We analyzed 22 immune cell types defined in the LM22 signature matrix of CIBERSORTx across 412 tumor samples from TCGA, using TPM data as input (Supplemental Figure S3). CIBERSORTx analysis yielded significant results (P < .05) for 410 samples, which were retained for subsequent analyses. We implemented Wilcoxon rank sum tests to determine the relationship between immune cell composition and SNAI1/SNAI2 expression. For SNAI1, 8 immune cell types showed close relations (P < .05) to high or low expression levels: memory B cells, activated dendritic cells, M0 and M2 macrophages, activated and resting mast cells, neutrophils, and resting NK cells (Figure 10). For SNAI2, 6 immune cell types showed close relations to high or low expression levels (P < .05): M0, M1. and M2 macrophages, activated mast cells, neutrophils and CD8+ T cells (Figure 11). These findings imply that by modifying the quantity of particular immune cell types, SNAI1 and SNAI2 expression levels may modify the tumor immune microenvironment.

The significant relationship between 8 immune cells and high and low expression of SNAI1.

The significant relationship between 6 immune cells and high and low expression of SNAI2.
Discussion
Expression levels of SNAI1 and SNAI2 promote EMT, a critical process in cancer metastasis. Our goal in this work was to clarify the predictive relevance of SNAI1 and SNAI2 expression groups with high and low levels in STAD. Our findings indicate that elevated expressions of these genes are closely associated with poorer overall survival outcomes. To support these observations, we employed advanced analytical techniques that allowed us to assess risk and survival probabilities effectively.
We initiated our study with a detailed DGE analysis, revealing significant differences in SNAI1 and SNAI2 expression across patient cohorts. Cox regression analysis confirmed these findings and identified a gene signature linked to invasion and metastasis related genes that intersected with the DEGs of SNAI1 and SNAI2. We divided patients into groups with high and low risk by computing risk scores based on SNAI1 and SNAI2. Kaplan-Meier survival analysis showed that high-risk patients had significantly lower survival probabilities over time, highlighting the association between elevated SNAI1 and SNAI2 expressions and aggressive tumor behavior. We further validated the predictive capability of our model using time-dependent ROC curves, achieving high AUC values that demonstrate its effectiveness in distinguishing patient risk levels. The observed lack of statistical significance in the Kaplan-Meier survival analysis and the 5-year AUC for SNAI1 expression within the TCGA dataset warrants a detailed consideration of the inherent biases and characteristics intrinsic to the utilized data. The discrepancy in these specific analytical outcomes, when juxtaposed with findings from other datasets (eg, GEO), likely stems from fundamental differences in cancer sample composition. These variations may encompass disparities in patient demographics, the distribution of tumor stages, prior treatment regimens, all of which can exert a considerable influence on the observed relationships between gene expression and clinical endpoints. Furthermore, the intrinsic heterogeneity and plasticity of cancer, manifesting as inter- and intra-tumoral variability, represent a critical biological layer contributing to the divergence in analytical findings across distinct cohorts. Consequently, the unique molecular and clinical profiles represented within the TCGA dataset may not fully capture the spectrum of SNAI1′s prognostic relevance observed in other contexts. Future investigations employing meta-analytical approaches or integrated analyses across diverse datasets are warranted to disentangle the specific contributions of dataset-specific biases and the underlying biological variability in shaping the observed associations. Finally, to enhance clinical utility, we developed nomograms as practical tools for clinicians that combined these risk scores with other clinical factors including stage, age, and gender. The calibration plots illustrated a close alignment between predicted survival probabilities and actual observed outcomes, emphasizing the reliability of our nomogram in clinical practice.
Furthermore, we provided a comprehensive biological rationale for our findings by employing a range of sophisticated methodologies: WGCNA, ceRNA network analysis, and CIBERSORT. Each of them contributed uniquely to our understanding, collectively enhancing our insight into the complex underlying mechanisms at play. This multifaceted approach allowed us to delve deeper into the biological processes, offering a robust justification for the observed correlations (Summarized in Figure 12).

High expression levels of SNAI1 and SNAI2 are associated with increased risk, supported by specific biological pathways and immune cell interactions.
WGCNA is a robust systems biology technique that facilitates the identification of co-expressed gene modules and their associations with clinical traits. By integrating WGCNA into our study, we gained invaluable insights into the biological pathways linked to elevated expressions of SNAI1 and SNAI2. Through this analysis, the lightyellow module was strongly correlated with both SNAI1 and SNAI2. This module underscored critical biological processes, including ECM organization, the formation of external encapsulating structures, and collagen fibril organization, thereby illuminating the intricate mechanisms through which these genes may influence tumor behavior.
Our findings emphasize the crucial role of ECM organization and external encapsulating structures in EMT. The ECM, a complex network surrounding cells, provides structural support and biochemical signals necessary for cellular functions. During EMT, changes in ECM composition disrupt cell adhesion, enhancing cellular motility and allowing tumor cells to detach and invade surrounding tissues.42-44 The arrangement of collagen fibrils within the ECM is vital for its mechanical properties. Well-aligned collagen enhances the tensile strength and stiffness of ECM, supporting tissue structure and influencing cellular behaviors such as migration, proliferation, and differentiation in response to the mechanical characteristics of the matrix.45-47
Our multivariate Cox regression analysis further elucidated the connections between the lightyellow module and tumor behavior by identifying 3 shared genes SDC3, MMP11 and COL1A1 as potential biomarkers for poor prognosis in STAD. MMP11 is a member of the family of enzymes known as matrix metalloproteinases (MMPs), which break down elements of the extracellular matrix. MMP11 has been linked to the development of several malignancies, including gastric cancer, and is especially engaged in tissue remodeling. Increased tumor aggressiveness and metastasis are associated with its expression, which is frequently elevated in malignant tissues.48-50 COL1A1 which encodes type I collagen, the most abundant collagen in the human body, can influence the TME by modifying ECM composition and stiffness, which aids cancer cell migration along collagen tracks.51-57 SDC3, a cell surface proteoglycan, enhances cell adhesion and migration while interacting with growth factors in the ECM. This interaction promotes tumor progression by modulating the TME.58-60 Together, these findings reveal a regulatory network where SNAI1 and SNAI2, along with MMP11, COL1A1, and SDC3, promote EMT and enhance the invasive capacity of STAD cells. Targeting this network could effectively inhibit tumor invasion and metastasis, potentially improving therapeutic outcomes for STAD patients.
The ceRNA network also emerged as a crucial modulator in our analysis, particularly in its influence on EMT. Transcription factors SNAI1 and SNAI2 are essential for EMT by suppressing epithelial markers like E-cadherin and encouraging mesenchymal phenotypes. CeRNAs, particularly lncRNAs, function as molecular sponges for miRNAs that regulate SNAI1 and SNAI2. 61 For instance, lncRNA MALAT1 can sequester miRNAs, leading to increased SNAI1 and SNAI2 activity and facilitating cancer cell invasion. 62 Similarly, the miR-203/SNAI2 axis has shown relevance in various cancers, where miR-203 downregulation enables SNAI2-driven tumor progression. 27 This network is further involved in therapeutic resistance, as observed with miR-34 and miR-200 in colorectal cancer, highlighting potential targets to overcome resistance mechanisms. 63
The ceRNA network, which regulates gene expression by sequestering miRNAs, plays a crucial role in modulating immune cell functions and tumor-immune interactions in gastrointestinal cancers. In gastric cancer, ceRNAs influence the immune microenvironment, affecting cancer progression. 64 They regulate immune checkpoints like PD-L1, promote EMT, 65 modulate tumor-associated macrophages (TAMs) 66 and T-cell functions. 67 For instance, lncRNAs such as SNHG14 regulate PD-L1 and EMT,68,69 while MALAT1 influences TAM polarization 66 and T-cell exhaustion and infiltration. 70 These interactions highlight the potential of targeting ceRNA networks for therapeutic interventions in gastrointestinal cancers.
A number of miRNAs that were shared by the SNAI1 and SNAI2 networks were found by our ceRNA network study, including hsa-mir-520b, hsa-mir-520e, hsa-mir-4295, hsa-mir-3666, hsa-mir-320a, and hsa-mir-302e. These miRNAs may serve as regulatory nodes in the network, influencing (silencing) the expression of their target genes involved in invasion and metastasis. MiR-520b plays a significant role in regulating tumor growth across various cancers,71-82 primarily by targeting genes that influence cell proliferation and migration. It inhibits cancer stemness in head and neck cancer by targeting CD44. 83 MiR-520e controls the development of colorectal cancer cells via the Wnt/β-catenin pathway 84 and selectively targets Cyclin D1 in breast cancer.85,86 MiR-4295 promotes tumor growth by downregulating tumor suppressor genes like BTG1 and IRF1 in bladder cancer and osteosarcoma, respectively.87,88 Additionally, it contributes to gastric cancer progression by downregulating PTEN and is implicated in pancreatic ductal adenocarcinoma by decreasing Glypican-5 levels.89,90 MiR-3666 acts as a tumor suppressor in several cancers by inhibiting cell growth and invasion.91,92 In colorectal cancer, it is downregulated and may target SATB2. 93 The miR-320 family suppresses EMT and enhances apoptosis across multiple cancers. 94 MiR-320a specifically targets RAB14 to inhibit gastric cancer progression 95 and miR-302e influences colorectal cancer cell viability by inhibiting the JAK-STAT pathway. 96
Finally, the CIBERSORT analysis allowed us to evaluate the immune cell composition within the TME, revealing how high levels of SNAI1 and SNAI2 may modulate immune responses. We found significant correlations between these gene expressions and various immune cell types, notably an increase in M0 and M2 macrophages, activated mast cells, and neutrophils associated with high SNAI1 and SNAI2 levels. This indicates that these genes not only promote cancer progression through EMT but also influence the TME by affecting specific immune populations.97-99 M2 macrophages promote tumor growth and metastasis and are well-known for their immunosuppressive and tissue-remodeling functions. 100 Activated mast cells enhance angiogenesis and tumor progression, 101 while neutrophils contribute to inflammation, fostering a supportive environment for metastasis. 102 Integrating CIBERSORT analysis into our risk assessment model emphasizes the importance of understanding the immune landscape dynamics of tumor behavior and patient prognosis.
The interplay between genes SDC3, MMP11, COL1A1 and immune cell populations significantly influences cancer invasion and metastasis in gastrointestinal cancers such as STAD. SDC3 promotes ECM remodeling and recruits M2 macrophages, which secrete immunosuppressive cytokines. 59 MMP11 facilitates EMT and metastasis by interacting with SNAI1 and SNAI2 and promoting M2 macrophage differentiation.103-106 In addition to promoting the migration and invasion of cancer cells, COL1A1 is important in regulating the immunological response in the TME, especially affecting the actions of immune cells including T cells and macrophages.107,108 Understanding these interactions can provide insights into cancer progression and potential therapeutic strategies.
Conclusion
In conclusion, our study delineates the critical prognostic role of SNAI1 and SNAI2 in STAD. Elevated expression levels of these genes are closely tied to poorer survival outcomes, primarily through driving EMT and aggressiveness in tumor behavior. Through applying multi-faceted computational systems biology, we identified a robust gene signature linked to invasion and metastasis. We validated our findings using time-dependent ROC curves and developed a clinically applicable nomogram for risk assessment. Furthermore, we gained novel insights into the underlying biological and immune mechanisms in GC.
This multifaceted analytical approach not only advances our understanding of STAD progression but also identifies potential therapeutic targets for clinical intervention.
Supplemental Material
sj-docx-4-cix-10.1177_11769351251352892 – Supplemental material for Comprehensive Computational Assessment of SNAI1 and SNAI2 in Gastric Cancer: Linking EMT, Tumor Microenvironment, and Survival Outcomes
Supplemental material, sj-docx-4-cix-10.1177_11769351251352892 for Comprehensive Computational Assessment of SNAI1 and SNAI2 in Gastric Cancer: Linking EMT, Tumor Microenvironment, and Survival Outcomes by Maryam Kalantari-Dehaghi, Hasan Rahimi-Tamandegani and Modjtaba Emadi-Baygi in Cancer Informatics
Supplemental Material
sj-docx-5-cix-10.1177_11769351251352892 – Supplemental material for Comprehensive Computational Assessment of SNAI1 and SNAI2 in Gastric Cancer: Linking EMT, Tumor Microenvironment, and Survival Outcomes
Supplemental material, sj-docx-5-cix-10.1177_11769351251352892 for Comprehensive Computational Assessment of SNAI1 and SNAI2 in Gastric Cancer: Linking EMT, Tumor Microenvironment, and Survival Outcomes by Maryam Kalantari-Dehaghi, Hasan Rahimi-Tamandegani and Modjtaba Emadi-Baygi in Cancer Informatics
Supplemental Material
sj-docx-6-cix-10.1177_11769351251352892 – Supplemental material for Comprehensive Computational Assessment of SNAI1 and SNAI2 in Gastric Cancer: Linking EMT, Tumor Microenvironment, and Survival Outcomes
Supplemental material, sj-docx-6-cix-10.1177_11769351251352892 for Comprehensive Computational Assessment of SNAI1 and SNAI2 in Gastric Cancer: Linking EMT, Tumor Microenvironment, and Survival Outcomes by Maryam Kalantari-Dehaghi, Hasan Rahimi-Tamandegani and Modjtaba Emadi-Baygi in Cancer Informatics
Supplemental Material
sj-docx-7-cix-10.1177_11769351251352892 – Supplemental material for Comprehensive Computational Assessment of SNAI1 and SNAI2 in Gastric Cancer: Linking EMT, Tumor Microenvironment, and Survival Outcomes
Supplemental material, sj-docx-7-cix-10.1177_11769351251352892 for Comprehensive Computational Assessment of SNAI1 and SNAI2 in Gastric Cancer: Linking EMT, Tumor Microenvironment, and Survival Outcomes by Maryam Kalantari-Dehaghi, Hasan Rahimi-Tamandegani and Modjtaba Emadi-Baygi in Cancer Informatics
Supplemental Material
sj-pdf-1-cix-10.1177_11769351251352892 – Supplemental material for Comprehensive Computational Assessment of SNAI1 and SNAI2 in Gastric Cancer: Linking EMT, Tumor Microenvironment, and Survival Outcomes
Supplemental material, sj-pdf-1-cix-10.1177_11769351251352892 for Comprehensive Computational Assessment of SNAI1 and SNAI2 in Gastric Cancer: Linking EMT, Tumor Microenvironment, and Survival Outcomes by Maryam Kalantari-Dehaghi, Hasan Rahimi-Tamandegani and Modjtaba Emadi-Baygi in Cancer Informatics
Supplemental Material
sj-pdf-2-cix-10.1177_11769351251352892 – Supplemental material for Comprehensive Computational Assessment of SNAI1 and SNAI2 in Gastric Cancer: Linking EMT, Tumor Microenvironment, and Survival Outcomes
Supplemental material, sj-pdf-2-cix-10.1177_11769351251352892 for Comprehensive Computational Assessment of SNAI1 and SNAI2 in Gastric Cancer: Linking EMT, Tumor Microenvironment, and Survival Outcomes by Maryam Kalantari-Dehaghi, Hasan Rahimi-Tamandegani and Modjtaba Emadi-Baygi in Cancer Informatics
Supplemental Material
sj-pdf-3-cix-10.1177_11769351251352892 – Supplemental material for Comprehensive Computational Assessment of SNAI1 and SNAI2 in Gastric Cancer: Linking EMT, Tumor Microenvironment, and Survival Outcomes
Supplemental material, sj-pdf-3-cix-10.1177_11769351251352892 for Comprehensive Computational Assessment of SNAI1 and SNAI2 in Gastric Cancer: Linking EMT, Tumor Microenvironment, and Survival Outcomes by Maryam Kalantari-Dehaghi, Hasan Rahimi-Tamandegani and Modjtaba Emadi-Baygi in Cancer Informatics
Footnotes
Author Contributions
Maryam Kalantari-Dehaghi: Data curation, Formal analysis, Investigation, Methodology, Software, Validation, Visualization, Writing—original draft, and Writing—review and editing. Hasan Rahimi-Tamandegani: Data curation, Formal analysis, Investigation, Methodology, Project administration, Software, Validation, Writing—original draft, and Writing—review and editing. Modjtaba Emadi-Baygi: Conceptualization, Formal analysis, Funding acquisition, Investigation, Methodology, Project administration, Supervision, Validation, Writing—original draft, and Writing—review and editing.
Funding
The author(s) disclosed receipt of the following financial support for the research, authorship, and/or publication of this article: This work was supported in part by Shahrekord University [1403].
Declaration of Conflicting Interests
The author(s) declared no potential conflicts of interest with respect to the research, authorship, and/or publication of this article.
Supplemental Material
Supplemental material for this article is available online.
References
Supplementary Material
Please find the following supplemental material available below.
For Open Access articles published under a Creative Commons License, all supplemental material carries the same license as the article it is associated with.
For non-Open Access articles published, all supplemental material carries a non-exclusive license, and permission requests for re-use of supplemental material or any part of supplemental material shall be sent directly to the copyright owner as specified in the copyright notice associated with the article.