
Abstract
The size and scope of microarray experiments continue to increase. However, datasets generated on different platforms or at different centres contain biases. Improved techniques are needed to remove platform- and batch-specific biases. One experimental control is the replicate hybridization of a subset of samples at each site or on each platform to learn the relationship between the two platforms. To date, no algorithm exists to specifically use this type of control. LTR is a linear-modelling-based algorithm that learns the relationship between different microarray batches from replicate hybridizations. LTR was tested on a new benchmark dataset of 20 samples hybridized to different Affymetrix microarray platforms. Before LTR, the two platforms were significantly different; application of LTR removed this bias. LTR was tested with six separate data pre-processing algorithms, and its effectiveness was independent of the pre-processing algorithm. Sample-size experiments indicate that just three replicate hybridizations can significantly reduce bias. An R library implementing LTR is available.
Introduction
The profiling of mRNA abundances using microarray technologies has become a fundamental part of molecular biology, used to identify drug mechanisms, 1 measure mRNA metabolism, 2 predict clinical outcomes,.3,4 and discover new pathways..5,6 In parallel with these new applications, the technologies used have evolved significantly. The relative merits of different platforms7–9 and analytical techniques10 –13 remains controversial, and these debates have intensified with the continued development of technologies and algorithms.
One key technological development has been a dramatic increase in the density of oligonucleotides placed on a single glass substrate. This increased number of available probes has been used to create arrays that interrogate larger numbers of genes or splice-variants. For example one of the most popular microarray platforms is the human Affymetrix HG-U133A array, of which 24,306 records have been deposited in the GEO repository at NCBI at the time of writing. A superset array (HG-U133 Plus 2.0) and a version optimized for smaller sample volumes (HG-U133A 2.0) have subsequently been developed based on the original platform. These two new array platforms have been deposited 42,531 and 4,310 times into the GEO database, respectively. Thus, in total, three array platforms covering 22,277 identical genes have been hybridized at least 71,147 times.
There is therefore a frequent need to merge information across different versions of a microarray platform. Several approaches to solve this problem have been considered. Several groups have demonstrated that sequence-based matching of platform probes can improve reproducibility..14,15 These approaches are particularly applicable when different platforms represent a single gene, but using different oligonucleotides. Other groups have sought improved analytical techniques specialized for meta-analysis of microarray data.16–18
These techniques rely on statistical techniques to infer the relationship between different datasets. In many situations, such as large multi-institutional studies,.19,20 it is possible to have a subset of samples hybridized multiple times at different sites or on different platforms. Accordingly, to complement existing statistical methods, I describe here LTR, a computationally-efficient approach to merging multi-platform datasets based on linear-modeling. The algorithm is tested on a new dataset of 20 rat liver samples drawn from four rat strains and hybridized to two distinct Affymetrix microarray platforms. LTR significantly reduces platform bias as demonstrated by unsupervised machine-learning and statistical analyses. Further, I estimate the number of replicate samples required to reduce bias using permutation techniques.
Methods
Algorithm motivation
Animal-handling and microarray hybridization of these samples has been described elsewhere.
21
Briefly, four rat strains/lines were selected: Long-Evans (
Data pre-processing
Microarray data were divided according to array platform (RAE230A vs. RAE230-2) and separately pre-processed. Three common pre-processing algorithms were used: RMA, 25 MAS5, 26 and GCRMA. 27 For each algorithm, the summarization step was performed both with the default ProbeSet mappings and with an alternative Entrez Gene-based mapping. 14 The MAS5 and RMA algorithms were implemented in the affy package (vl.26.1) and the GCRMA algorithm in the gcrma package (V2.20.0) both of the BioConductor library for the R statistical environment (v2.11.1). MAS5 data were log2-transformed prior to model fitting.
LTR model
To determine the relationship between each ProbeSet on the RAE230-A and RAE230-2 arrays I employed a linear-modeling approach. I restricted ourselves to ProbeSets present on both array platforms and for each of these fitted to the identical samples the linear model Y230-2 = x0 + x1 Y230-A where Y230-2 is signal intensity for this ProbeSet on the RAE230-2 array and Y230-A is the signal intensity on the RAE230-A array. After fitting was performed using replicate hybridizations the coefficients (x0 and x1) were stored and used to calculate adjusted signal intensities for all RAE230-A arrays. Thus this procedure first calculates a linear transformation between RAE230-A signal-intensity space and RAE230-2 signal-intensity space based on replicate hybridizations. Next, all RAE230-A data is transformed into RAE230-2 space—including those samples with no replicate RAE230-2 hybridizations. R functions implementing model-fitting and application are provided as an R library in Supplementary Material.
Model testing
LTR was tested in three ways. First, unsupervised machine-learning (clustering) was employed before and after LTR normalization. The divisive hierarchical clustering algorithm DIANAwas used, as implemented in the cluster package (v1.12.0) for the R statistical environment (v2.8.1). Scaling was not performed, and Pearson's correlation was used as the distance metric. Second, a direct statistical analysis was used to compare heterogeneity of signal-intensities between platforms. Six biological replicates from the Han/Wistar rat-strain were available: four were hybridized to the RAE230-A platform only and two to the RAE230-2 platform only. Importantly none of these were replicate hybridizations, making them suitable for model-evaluation. Significantly differentially expressed ProbeSets between the two platforms were identified using ProbeSet-wise t-test analysis followed by a false-discovery rate adjustment for multiple-testing. 28 This analysis was repeated before and after scaling. Third, the stability of LTR to the number of replicate hybridizations was assessed by subset-analysis (ie, jack-knife sampling). There were eight replicate hybridizations; therefore all possible subsets containing two through seven hybridizations were extracted. The linear transformation from RAE230-A to RAE230-2 spaces was calculated for each subset and applied to the overall dataset. The number of differentially expressed ProbeSets between the two platforms was determined and boxplots of the distribution as a function of subset-size generated.
Data visualization
All visualization was done in the R statistical environment (v2.11.1) using the lattice (v0.18-8) and latticeExtra (v0.6–11) packages. Density plots employed a Gaussian kernel with default parameterizations.
Results
Algorithm motivation
Integration of microarray studies performed by different groups,16–18 on different platforms,.3,8,20,29 or at different times16,30–32 is a common challenge in bioinformatics. While several computational techniques have been developed, the most natural experimental control is to select a subset of samples that can be hybridized by both groups, on both platforms, or at both times. To exploit these replicate hybridizations it is necessary to use them to learn a relationship between the signal-intensity space of two experimental platforms or batches,

And this approach can be trivially extended to multiple experiments {

where
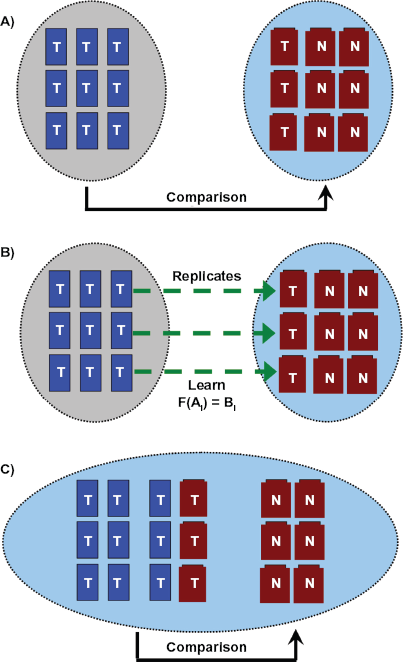
LTR is intended to facilitate the integration of different microarray datasets.
Description of test dataset
To test the LTR method, a new dataset was generated. In previous studies of rat liver
21
(and Boutros et al submitted) Affymetrix RAE230-A arrays had been used to profile four separate strains of rats. Two strains, Long-Evans(
Many approaches for pre-processing Affymetrix microarray data exist,25–27,33–35 and substantial disagreement remains regarding the optimal approach.33,36–39 To ensure that LTR performs well independently of the pre-processing technique selected, all analyses were repeated with data pre-processed by three of the most common algorithms: MAS5, 35 RMA, 25 and GCRMA. 27 Additionally, several groups have shown that sequence-based ProbeSet-remapping improves the concordance of individual microarray experiments..14,15,40 Therefore each of the three pre-processing algorithms was executed with both the standard Affymetrix mappings and with an alternative mapping that linked each 25 bp Probe to a unique Entrez Gene ID. 14 Thus in total the dataset was analyzed six different ways: two Probe-mappings, each with three separate pre-processing algorithms. LTR was applied to each of these six datasets.
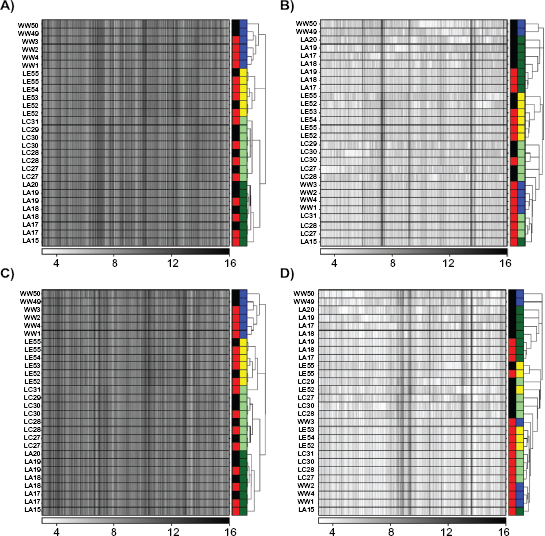
Pre-processing was performed separately for the RAE230-A and RAE230-2 arrays, and common ProbeSets were extracted and subjected to unsupervised machine-learning (Fig. 2 and Supplementary Fig. 1). Independent of the pre-processing algorithm or Probe-mapping used, samples hybridized to RAE230-2 arrays (labeled in black) clustered distinctly from samples hybridized to RAE230-A arrays (labeled in red). Within each platform, however, samples did cluster according to the strain of rat. Taken together, these data indicate that the dominant signal in the dataset is the platform of origin, but that a significant strain-signal is also present. From a graphical perspective, the goal of LTR is to remove the platform-bias and to allow animals from the same strain to cluster together. Note that MAS5, a single-array scaling algorithm believed to be useful in reducing batch-variability, still leaves very large batch-bias (black vs. red clusters, Figure 2B). These data were confirmed with multiple clustering algorithms (data not shown).

Data were pre-processed with either the RMA (
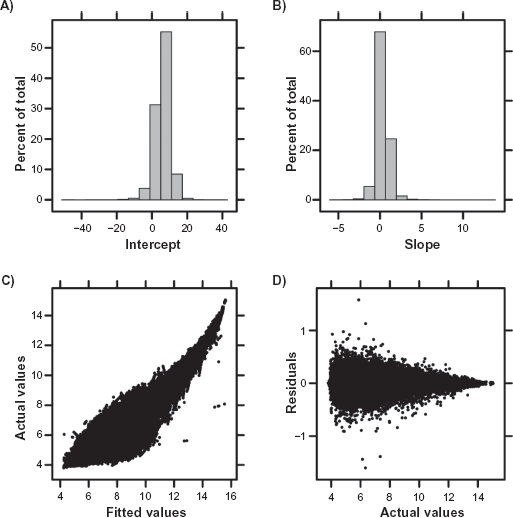
Characteristics of the linear-modelling fit
The LTR method was applied to the eight samples hybridized to both platforms. Both the intercept (Fig. 3A) and slope (Fig. 3B) have a large range, but are unimodally distributed around five (for intercept) and zero (for the slope). These values are imminently reasonable: an intercept of five reflects the background noise of the arrays used 41 and a slope of zero indicates that the average ProbeSet shows no platform bias. The transformed and untransformed RAE230-A values are highly correlated (Fig. 3C), further emphasizing that for the majority of ProbeSets the platform-bias is relatively small, but that severe exceptions exist. Given that RAE230-2 is a superset of RAE230-A, this is a sensible result. Further, the fits account for the majority of variation in the dataset, with residuals being inversely proportional to signal intensity and less than one log2 unit (Fig. 3D). These trends are broadly replicated for the other five combinations of pre-processing and sequence-mapping algorithms (Supplementary Figs. 2–6).
Following pre-processing using the RMA algorithm with default Probe-mappings, the LTR transform was fit to the eight samples hybridized to both RAE230-A and RAE230-2 arrays. The majority of Probesets had small intercepts (
To determine if the large platform-biases present in the raw data (Fig. 2) were removed by LTR, I performed unsupervised machine-learning on the LTR-transformed data. For all datasets, samples now clustered by strain (biology) rather than platform (Fig. 4 and Supplementary Fig. 7). In fact, replicate-hybridizations performed on different platforms now clustered together (ie, the two replicate hybridizations for sample LA17 are adjacent to one another in all heatmaps in Fig. 4). A few extreme outliers in the GCRMA-normalized data led to improved, but not-perfect strain-separation (compare Supplementary Figs. 1 and 7). The tendency of GCRMA-processing to yield many ProbeSets with invariant signal intensities appears to hinder the LTR method, and can be removed by introducing a data pre-filtering step. 41
Data were pre-processed with either the RMA (
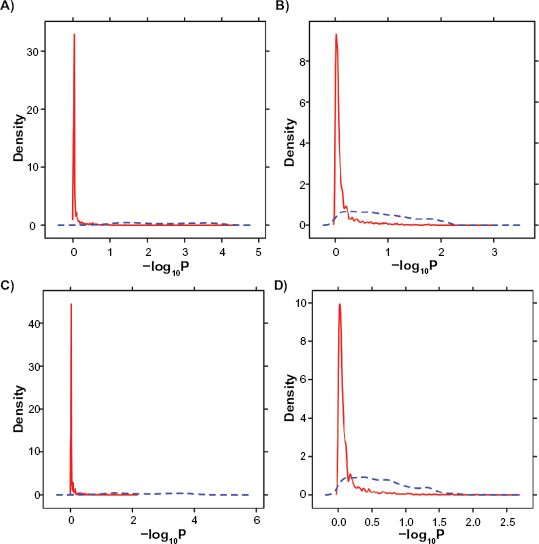
These unsupervised results show that LTR-transformation reduces platform-bias and improves biological homogeneity. However, because the samples used in model-fitting are included in clustering, unsupervised methods are non-conservative. Therefore, a rigorous statistical analysis was performed. Of the six H/W rats included in this study four are on RAE230-A arrays and two on RAE230-2 arrays. Because these animals are biological replicates we anticipate modest basal biological differences in their mRNA levels.
42
ProbeSet-wise
Data were pre-processed with either the RMA (
Both unsupervised and supervised techniques demonstrate that LTR removes platform-specific bias. However, in 8/20 samples in this dataset were subject to replicate hybridization. It would be a major financial advantage to reduce the number of replicate hybridizations necessary. Therefore, all possible jack-knife samples of 2–7 animals (of the eight with replicate hybridizations) were created. The LTR model was fit to each sampling and then applied to the entire dataset. A t-test analysis was used to compare the RAE230-A and RAE230-2 H/W samples (none of which were amongst the 8 replicate hybridizations). Boxplots of the number of differentially expressed genes are given in Figure 6 and Supplementary Figure 9. In the absence of LTR (0 duplicated samples) the majority of genes are differentially expressed. Application of LTR with just two replicated samples dramatically reduces platform bias. Addition of a third replicated sample was beneficial, but additional samples beyond that led to more modest improvements. These data indicate that LTR can remove the vast majority of inter-experiment bias based on only three replicate hybridizations, at least in this dataset.

Data were pre-processed with either the RMA (
Discussion
Biomedical research projects frequently extend across many years and multiple locations. Recent years have seen the rise of large, multi-centre microarray-based projects, such as a recent study of 442 lung adenocarcinomas at four independent sites. 19 In other cases it is necessary to integrate data from different platforms, such as a recent lung cancer study where 589 microarray profiles from 8 different studies (5 distinct platforms) were integrated. 3 In both these types of studies it is well-established that batch-effects can hinder the analysis..43,44
Linear Transformation of Replicates (LTR) is a simple algorithm for removing bias from platform-specific microarray experiments. Its uses replicate hybridizations of a small number of samples, which requires pre-planning. LTR works well with multiple pre-processing methods, and indeed could be used in combination with reference-normalization techniques to further reduce pre-processing variability. 45 LTR is also not a replacement for ProbeSet re-mappings,.14,15 but rather supplements them. LTR is tested here in a multi-platform integration study, but in theory could be used for any multi-batch array study if identically hybridized samples are available. However, it is likely that there will be greater noise in inter-platform studies, especially when the platforms are more dissimilar than the two versions of Affymetrix arrays used here.
The LTR technique can be extended in several ways. First, should a larger number of replicate hybridizations be available, non-linear fitting could be attempted. For example use of loess-smoothers might reduce bias further, although at the expense of requiring a larger number of samples. Second, the current implementation transforms signal-intensity at the level of a complete ProbeSet, representing an individual transcript or gene. It is possible, especially for superset arrays, to perform the LTR at the Probelevel, thereby allowing each individual sequence to have its own unique relationship between the two platforms or datasets. This approach would be computationally much more expensive, as there are ∼11 Probes per ProbeSet on Affymetrix arrays, but may reduce variability even further for array platforms that contain identical Probes.
The LTR model is limited in at least three ways. First, it is inherently linear. It is of possible that a nonlinear transformation will better capture platform-specific differences. However, in the case explored in depth here, a linear transform obviated essentially all bias (Fig. 6). Second, the model requires the existence of probe-wise relationships between the two groups. If there is no relationship at all, then a fit will still be forced despite the very high residuals and resulting noise. This makes it critical to evaluate residual plots (Fig. 3), and suggests that there may be a benefit to performing an iterative model-selection for each probe if sufficient replicate samples are available. Third, it is unclear if the linear relations learned between platforms in this experiment are fixed or if they need to be refitted for each experiment. It would be advantageous to groups around the world if hybridizations could be performed with a known subset of samples that are widely available—the four mixtures generated by the MAQC Consortium's Phase I project would be ideal candidates for human arrays. 20 It is unclear if the replicate samples used in LTR need to be substantially similar to the experimental samples for accurate model fitting. Currently no datasets with sufficiently diverse and numerous samples exist to evaluate this question. Based on preliminary studies it appears that absolutely identical samples are required for LTR-fitting, but these may not need to be highly similar to the remainder of the dataset.
As the number of microarrays deposited in public repositories grows, the development of appropriate techniques for integrating diverse datasets becomes increasingly important. The LTR technique described here provides a computational technique that greatly reduces inter-experimental variability and that should motivate the inclusion of replicate hybridizations across experiments where possible. When combined with reference-normalization methods and ProbeSet-remapping techniques LTR might facilitate the successful integration of microarray experiments.
Disclosures
This manuscript has been read and approved by the author. This paper is unique and not under consideration by any other publication and has not been published elsewhere. The author and peer reviewers report no conflicts of interest. The author confirms that they have permission to reproduce any copyrighted material.
Footnotes
Acknowledgements
The author thanks Hanbert Chen, Dr. Denise Mak, Dr. Mehrdad Shamsi, Dr. John Watson, Alexander Wu, and Rui Yan for their support and suggestions. Funding for this study was provided by a grant from the Canadian Institutes of Health Research to PCB and Dr. Allan B. Okey (MOP-57903). This study was conducted with the support of the Ontario Institute for Cancer Research to PCB through funding provided by the Government of Ontario. The funder played no role in the conduct of experiments, the decision to publish or the writing of this manuscript.