
Abstract
Objectives:
For prostate cancer (PCa), hundreds of risk variants have been identified. It remains unknown whether the polygenic risk score (PRS) that combines the effects of these variants is also a sufficiently informative metric with relevance to the molecular mechanisms of carcinogenesis in prostate. We aimed to understand the biological basis of PRS and racial disparities in the cancer.
Methods:
We performed a comprehensive analysis of the data generated (deposited in) by several genomic and/or transcriptomic projects (databases), including the GTEx, TCGA, 1000 Genomes, GEO and dbGap. PRS was constructed from 260 PCa risk variants that were identified by a recent trans-ancestry meta-analysis and contained in the GTEx dataset. The dosages of risk variants and the multi-ancestry effects on PCa incidence estimated by the meta-analysis were used in calculating individual PRS values.
Results:
The following novel results were obtained from our analyses. (1) In normal prostate samples from healthy European Americans (EAs), the expression levels of 540 genes (termed PRS genes) were associated with the PRS (P < .01). (2) Ubiquitin–proteasome system in high-PRS individuals’ prostates was more active than that in low-PRS individuals’ prostates. (3) Nine PRS genes play roles in the cancer progression-relevant parts, which are frequently hit by somatic mutations in PCa, of PI3K-Akt/RAS-MAPK/mTOR signaling pathways. (4) The expression profiles of the top significant PRS genes in tumor samples were capable of predicting malignant PCa relapse after prostatectomy. (5) The transcriptomic differences between African American and EA samples were incompatible with the patterns of the aforementioned associations between PRS and gene expression levels.
Conclusions:
This study provided unique insights into the relationship between PRS and the molecular mechanisms of carcinogenesis in prostate. The new findings, alongside the moderate but significant heritability of PCa susceptibility contributed by the risk variants, suggest the aptness and inaptness of PRS for explaining PCa and disparities.
Keywords
Introduction
Prostate cancer (PCa) susceptibility is a polygenic trait with moderate to high heritability and substantial racial disparity.1 -5 The disease prevalence in African Americans (AAs) is 1.5 times that in European Americans (EAs). 6 In the past 2 decades, over 400 PCa risk variants, most of which are single nucleotide polymorphism (SNP) variants, have been identified by regional linkage disequilibrium tests, genome-wide association studies (GWASs), and/or the meta-analysis of multiple GWAS datasets.7 -13 The marker sets consisting of all or a fraction of these variants demonstrated moderate predictive strength for PCa occurrence. The area under curve (AUC) of the receiver-operating characteristic analysis of the estimated risk values and actual cancer statuses of individuals was encouraging, up to 0.72 in EA cohorts. 12 The clinical utility of the genetic markers was implied by the observation that they could complement other predictors such as age and prostate specific antigen level in cancer screening.4,12
The polygenic risk score (PRS) that combined the effects of the identified risk variants proved to be compatible with the intra- and interpopulations stratification of PCa incidence rates.12,14 This result was robust for the statistical and genetic models used in the estimation and aggregation of the effects of risk alleles. 14 However, it remains unknown whether the PRS is also a sufficiently informative metric with relevance to the molecular mechanisms of carcinogenesis in prostate. To investigate these issues, we performed an integrative analysis of the data generated by (deposited in) several genomic and/or transcriptomic projects (databases), including the Genotype-Tissue Expression (GTEx, https://gtexportal.org/home/) and others. We hypothesized that the PRS related tumorigenic potential or property of prostate cells is, at least partially, determined by the expression level of cancer-relevant genes and the activity of crucial cancer pathways and regulatory gene networks.
This research could provide unique biological insight into the relationship between PRS and PCa biology, and disparities. It is also imperative for conceiving the potential biological mechanisms that bridge cancer susceptibility and polygenic inheritance. Progress in revealing the mechanisms could facilitate the identification of more risk SNPs from those that demonstrate moderately significant association with PCa occurrence.
Materials and Methods
Outline of data and analysis
Three representative GWAS datasets for prostate cancer were used to estimate the trait heritability contributed by the risk variants. The GTEx genotype and expression datasets were used to identify PRS genes, that is, the genes whose expression levels were associated with the polygenic risk score. The gene expression dataset of The Cancer Genome Atlas (https://www.cancer.gov/about-nci/organization/ccg/research/structural-genomics/tcga) prostate adenocarcinoma (TCGA-PRAD) project was used to identify a transcriptomic marker set from the top PRS genes for predicting the biochemical relapse (BCR) of malignant PCa after initial radical therapy. Five datasets deposited in the Gene Expression Omnibus (GEO, https://www.ncbi.nlm.nih.gov/geo/) were used to validate the prognostic expression marker set. The GTEx genotype dataset, TCGA genotype dataset and 1000 Genomes dataset (https://www.genome.gov/27528684/1000-genomes-project) were used to analyze the racial stratification of polygenic risk scores. The GTEx gene expression dataset was used to identify the differentially expressed genes between EA and AA prostate tissue.
Catalog of risk variants
The catalog of 269 risk variants for PCa occurrence was extracted from the Supplementary Information of a recent publication. 12 The multi-ancestry effect estimates (odds ratios) of the risk variants adopted here were estimated by the trans-ancestry meta-analysis of 142 GWAS datasets, which contained 107 247 PCa cases and 127 006 controls in total. Among the participants of those GWASs, the men with European ancestry were predominant. The PRS constructed using the multi-ancestry weights was demonstrated to be a robust predictor for PCa incidence in both European and African ancestry populations, with the performance being among the best PRS metrics.12,15,16
Data
GWAS datasets The datasets were generated by the Cancer Genetic Markers of Susceptibility (CGEMS), The Breast and Prostate Cancer Cohort Consortium (BPC3) and The Multiethnic Cohort Study (MEC) of prostate cancer.3,10,17,18 The CGEMS cohort was a fraction of the participants of the PLCO Cancer Screening Trial, a large randomized controlled trial. 19 These projects/experiments adopted the nested case-control design. Of MEC data, only African American (AA) samples were included in this study. The CGEM, BPC3 and MEC-AA cohorts contained 1157, 2578 and 2306 cases, and 1098, 4482 and 2463 controls, respectively. The genotypes of variants were respectively measured with the Illumina SNP arrays HumanHap300v1.1 and -250Sv1.0 (0.56 million SNPs), Human660W-Quad_v1_A (0.58 million SNPs), and Human1M-Duov3_B (1.15 million SNPs).
GTEx data The V8 release of the GTEx project contained the genomic and transcriptomic data generated with whole genome platforms such as whole genome sequencing and RNA-seq. 20 The digital gene expression levels were estimated with transcripts per million (TPM) values. The 866 subjects were shared by 35 partially overlapping tissue sets. The prostate set, in which the gene expression profiling of prostate specimens were measured, contained 189 EA males, 27 AA males and 6 Asian-ancestry males. Our study focused on the EA and AA samples. In particular, a working prostate subset consisting of 97 “physically healthy” males (87 EAs, 10 AAs) selected from the prostate set was used to analyze the associations between gene expression levels and genetic variables, that is, PRS and ancestry groups (races). The members of the working prostate subset were those who died from suicide or mechanical causes, such as blunt force trauma or gun shooting, or reasonably healthy men who unexpectedly died from natural causes, such as myocardial infarction, with a terminal phase estimated at <1 hour. The relevant information was found in the DTHHRDY (death classification based on the 4-point Hardy Scale) and DTHFUCOD (first underlying cause of death) columns of the phenotype table of the GTEx samples.
1000 Genomes data: The phase-3 release data (version 5a) of the project were used in this study.
TCGA genotype data: The prostate cancer patients’ genotypes were determined from blood specimens using the Affymetrix Genome-Wide Human SNP 6.0 Array, which contained 0.91 million SNP probes.
TCGA expression data The TCGA group performed RNA-Seq experiments on an Illumina HiSeq platform and estimated the gene expression levels with TPM values using an expectation maximization method and RSEM software. 21 Log2 transformation on this dataset was performed preceding our analysis.
GEO data The authors of GSE54460 22 performed RNA-Seq experiments with the Illumina HiSeq 2000 platform and estimated gene expression levels with fragments per kilobase million (FPKM) values. The authors of GSE84042 23 performed microarray experiments using the Affymetrix Human Gene 2.0 ST array and preprocessed expression intensities using the robust multichip average (RMA) algorithm 24 and log2 transformation. The authors of GSE21032 25 performed microarray experiments using Affymetrix Human Exon 1.0 ST Array and preprocessed expression intensities using RMA and quantile normalization. We performed log2 transformation on the downloaded dataset, which contained transcript expression levels. For a gene with 2 or more transcript IDs, we chose the one with the largest interquartile range (IQR) for expression levels across samples as the representative. The raw data of GSE70768 and GSE70769 were generated by the same authors using Illumina HumanHT-12 V4.0 Expression BeadChip. 26 We first downloaded the 2 matrices of the non-normalized expression levels of the 2 cohorts and removed the columns for the samples that would not be used in our analysis. Then, quantile normalization and log2 transformation were applied. For a gene with two or more probes, we chose the one with the largest IRQ for expression levels across samples in the GSE70768 cohort as the representative. Finally, we homogenized the 2 normalized expression matrices to have the same global 75% quantile.
A table summarizing the samples of the TCGA gene expression dataset and the GEO datasets can be found in our recent publication. 27 The TCGA, GSE54460, GSE84042, GSE21032, GSE70768 and GSE70768 cohorts contain 366, 95, 57, 89, 95 and 70 samples, respectively, and the corresponding BCR percentages are 13.6%, 53.7%, 24.6%, 28.1%, 20% and 62.9%.
Methods
PRS calculation. The multiplicative model was used to calculate PRS values.
28
For the ith test sample, the polygenic risk score was calculated by
Heritability estimation. The genetic data analysis software GCTA 1.91.729,30 was used to estimate the heritability (
PRS gene detection. A linear regression model (M-1) was used to detect the PRS genes whose expression levels were associated with PRS. The dependent variable was the log2 transformed expression level. The exploratory variables included PRS, age, TRICSHD and DCOD. DTRICSHD denoted the interval between actual (or presumed) death, or cross clamp application, and the start of the GTEx procedure. DCOD was a categorical variable we defined to indicate whether the individual died from natural causes.
Expression disparity detection. A linear regression model (M-2) was used to detect the genes whose expression levels were associated with race groups. The dependent variable was log2 transformed expression levels. The exploratory variables included race, age, TRICSHD and DCOD.
Prognostic marker set evaluation. Support vector machine-based leave-one-out cross validation (SVM-LOOCV) was used in this analysis. The predictive strength of a marker set for BCR was assessed with AUC and Fisher’s exact test P-value. The 2 performance metrics were calculated according to the predicted BCR statuses and decision values, that is, transcriptomic BCR risk scores, of individual subjects, as well as their actual BCR statuses.
Feature wrapper. The feature wrapper proposed in the Reference 27 was used to determine a prognostic marker set from the top PRS genes. The wrapper combined the model optimization of a regression analysis and a model validation step that was highly desired for avoiding overfitting. Redundant features were iteratively dropped according to their negative impacts on the expected prediction strength.
Software and application notes PLINK 1.931,32 and VCFtools 33 were used to manipulate SNP data. Beagle 5.0 was used to impute the missed PCa risk variants (SNPs) in the GWAS and TCGA datasets. The LiftOver tool, run on the UCSC Genome Browser website (https://genome.ucsc.edu/), was used to convert genome coordinates between assemblies. Statistical/computational analysis was completed using the relevant functions in the R packages “stats,” “01071” and “AUC” as well as our labor-owned R codes. In the implementation of the SVM() function, a radial kernel was used, the class weights were specified as the reciprocals of the ratios between the “1” samples and the “-1” samples in the training set, and defaults for the hyperparameter cost and gamma were held on. The p-value from one-tailed Fisher’s exact test was calculated in evaluating the finally identified marker set. BCR was treated as a binary endpoint and the time from the initial PCa diagnosis to relapse for a BCR+ sample and to the end of follow-up for a BCR- sample were not considered.
Results
Heritability
To facilitate understanding of the potential differences of heritability estimates between cohorts, we sought to perform genetic analysis on synthesized datasets, in which a SNP was identically genotyped by experiment or imputed by computation. We first homogenized the 3 GWAS datasets, that is, CGEMS, BPC3 and MEC-AA, by removing the SNPs that were missing in any one of them. Then, the SNP genotypes for 240 risk variants that were in the GTEx dataset but not in the homogenized GWAS datasets were imputed using the 1000 Genomes dataset as the reference. The substitution of the genotypes in the original data with the imputed genotypes occurred in 5 SNPs for CGEMS samples and 18 SNPs for MEC-AA samples (but not in BPC3 samples). In these SNPs, the mid-quartile range of the imputation quality scores, that is, squared correlations between the dosages of minor alleles derived from the observed genotypes and the dosages from the imputed genotypes, was 0.718 to 0.981.
After homogenization and imputation, the datasets contained 527,124SNPs (termed MK-WA) in autosomes. Prostate cancer heritability (
PRS genes and pathway analysis
Based on the information in the working prostate subset of the GTEx dataset (see the Data section), the genes that were unexpressed in at least half of the samples were filtered out. The remaining 18 126 genes were scanned using the regression model M-1. The typical L-shaped distribution (Figure 1A) of the p-values for the effects of PRS on gene expression levels indicated the substantial existence of differentially expressed genes. With a cutoff of
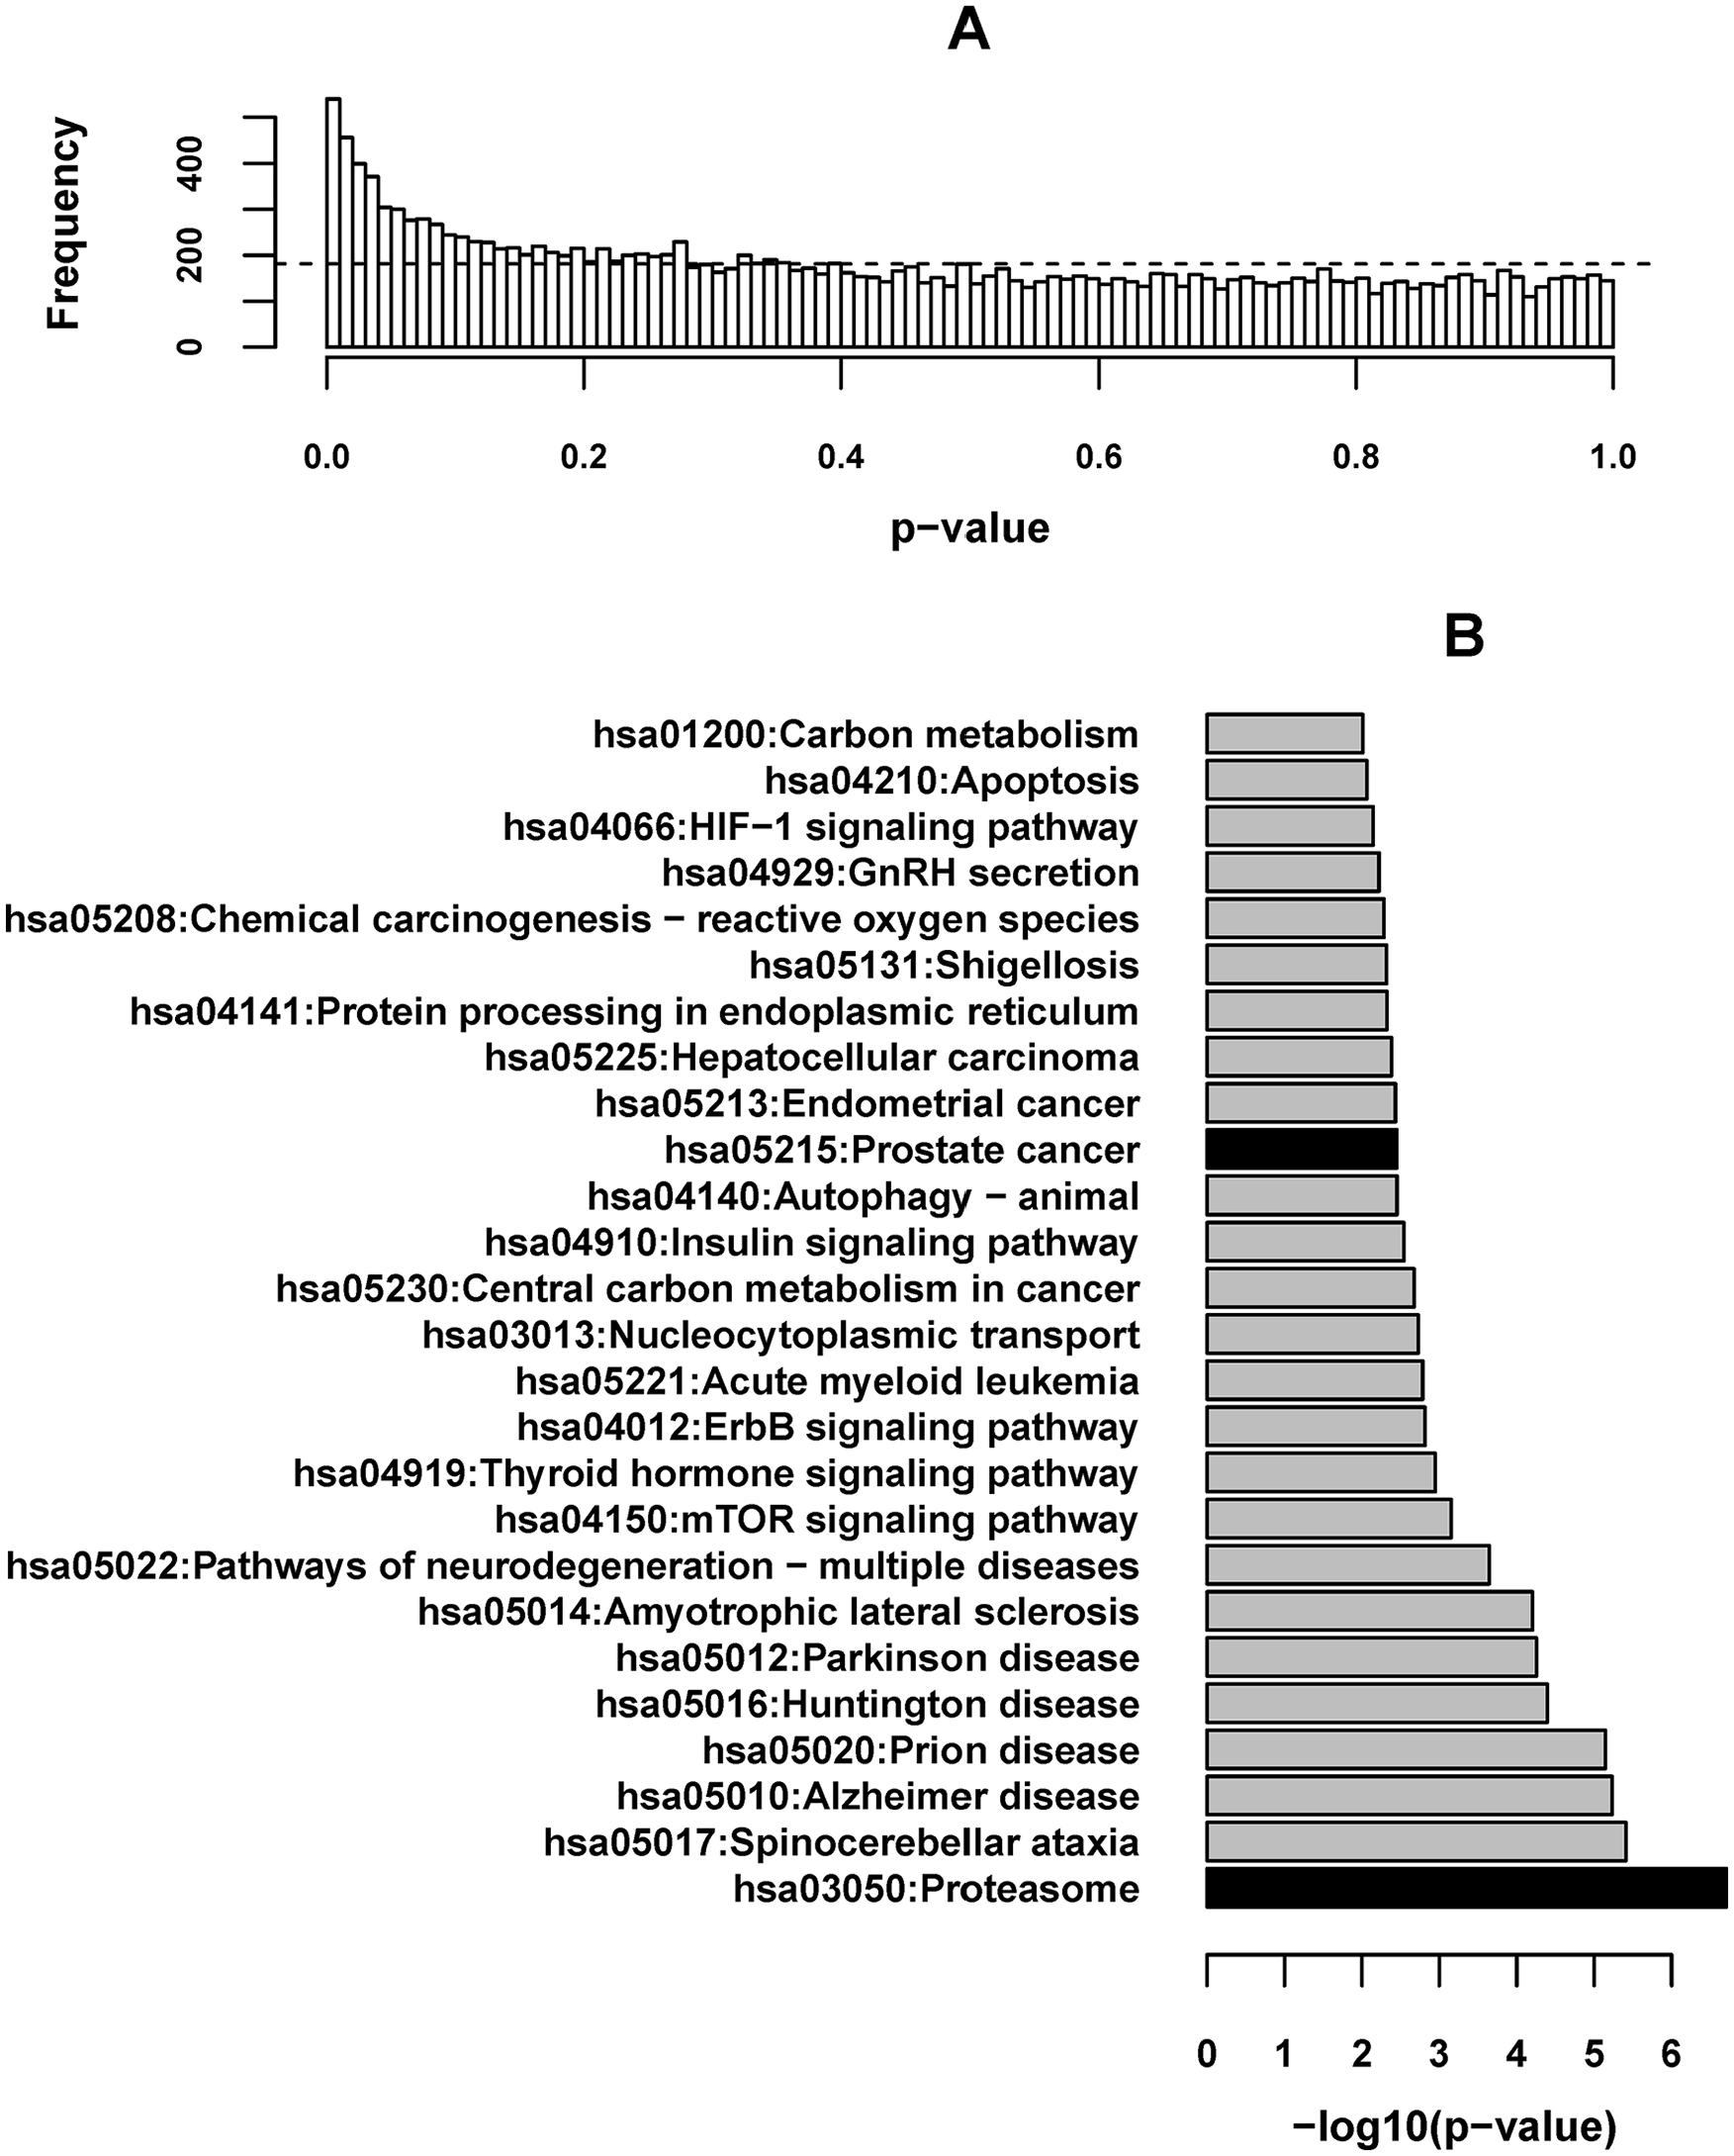
The association between the PRS and gene expression level in prostate tissue. The data from 87 healthy EA males in the GTEx cohort were used. (A) The distribution profile of the p-values for the effects of PRS on the gene expression levels of 18 126 expressed genes. The horizontal line indicates the expected probabilities of P-values falling within each of the 100 bins when the PRS vector is substituted with a randomly generated numeric vector of the same length in the regression analysis. (B) The KEGG pathways overrepresented by the 540 PRS genes whose expression levels were associated with PRS.
Functional enrichment analysis was performed using the DAVID tool/database. 34 Twenty-six Kyoto Encyclopedia of Genes and Genomes pathways 35 were overrepresented (P < .01, FDR < 0.1) by the 540 PRS genes (Figure 1B). The most significant one (BH adj P-value = 5.4 × 10⁻⁵) of these pathways was “hsa03050::Proteasome,” which denotes the 26s proteasome complex (https://www.genome.jp/pathway/hsa03050). The complex plays a central role in the second step of the 2-steps ubiquitin-proteasome system (UPS) or protein degradation pathway.36 -38 For nearly all the 42 proteasome genes (11 were in the PRS gene set), the partial correlations between expression levels and PRS were positive (Figure 2A). The “proteasome signature” calculated by averaging the standardized expression levels of the 42 genes was positively correlated with the PRS (r = .32, P = .02; Figure 2B). While the second step (denoted by “hsa04120::Ubiquitin mediated proteolysis,” https://www.genome.jp/pathway/hsa04120) of the UPS was not overrepresented by the PRS gene set, the “ubiquitination signature” that aggregated the expression levels of the 128 genes in hsa04120 also demonstrated significant positive correlation with PRS (r = .27, P = .011: Figure 2C). As expected, the positive correlation between the two signatures was even stronger (r = .55, p = 3 × 10⁻⁸; Figure 2D).

The association between the PRS and the expression of the genes in the ubiquitin-proteasome system (UPS). (A) The distribution profile of partial correlations between PRS and the expression levels of 42 UPS genes. (B) The partial correlation between PRS and the proteasome signature that was calculated by averaging the standardized expression levels of the 42 proteasome genes. (C) The partial correlation between PRS and the ubiquitination signature that aggregated the expression levels of the 128 genes in the KEGG pathway “hsa04120::Ubiquitin mediated proteolysis.” (D) The correlation between the proteasome signature and ubiquitination signature.
Decreased proteasome function has been reported in a broad array of chronic neurodegenerative disorders (NDDs) and proteasome genes have been annotated to pathways for NDDs, including Alzheimer disease, Parkinson disease and others.39,40 This was clearly reflected by the spectrum of the pathways overrepresented by the PRS genes. However, for our research aim, a more important finding was the enrichment of PRS genes in the pathway “hsa05215::Prostate cancer” (Figure 3). The fold enrichment score and P-value from Fisher’s exact test of independence were 3.6 and .004, respectively. The involved PRS genes included GSK3B, MAP2K1, NRAS, CHUK, AKT2, MAPK1, MTOR, HSP90B1 and MAPK3. These 9 genes play roles in the cancer progression-relevant parts, which are frequently hit by somatic mutations in prostate tumors, of the PI3K-Akt/RAS-MAPK/mTOR signaling pathways.25,41 -45 The expression levels of these genes were also significantly correlated with the proteasome signature mentioned in the last paragraph (Figure 4). In particular, NRAS, AKT2, MAPK1 and MTOR have been added into the Cancer Gene Census by the Catalogue of Somatic Mutations in Cancer (https://cancer.sanger.ac.uk/cosmic). While our analysis demonstrated a negative correlation between the expression intensity of the AKT2 gene and PRS, previous studies in mouse models suggested both the oncogenic and tumor-suppressor roles of AKT2 in hepatocellular carcinoma.46,47

The involvement of PRS genes in prostate cancer-related pathways. The diagram of the KEGG pathway “hsa05215::Prostate cancer” was retrieved from the KEGG website. The use of the pathway map was approved by KEGG. The nine PRS genes involved in the pathway are marked with red stars. PKB/Akt, GSK3, IKK, MEK/ERK, HSP, Ras and mTOR are the alternative or family identifiers of the genes AKT2, GSK3B, CHUK, MAPK1/MAPK3, HSP90B1, NRAS and MTOR, respectively.
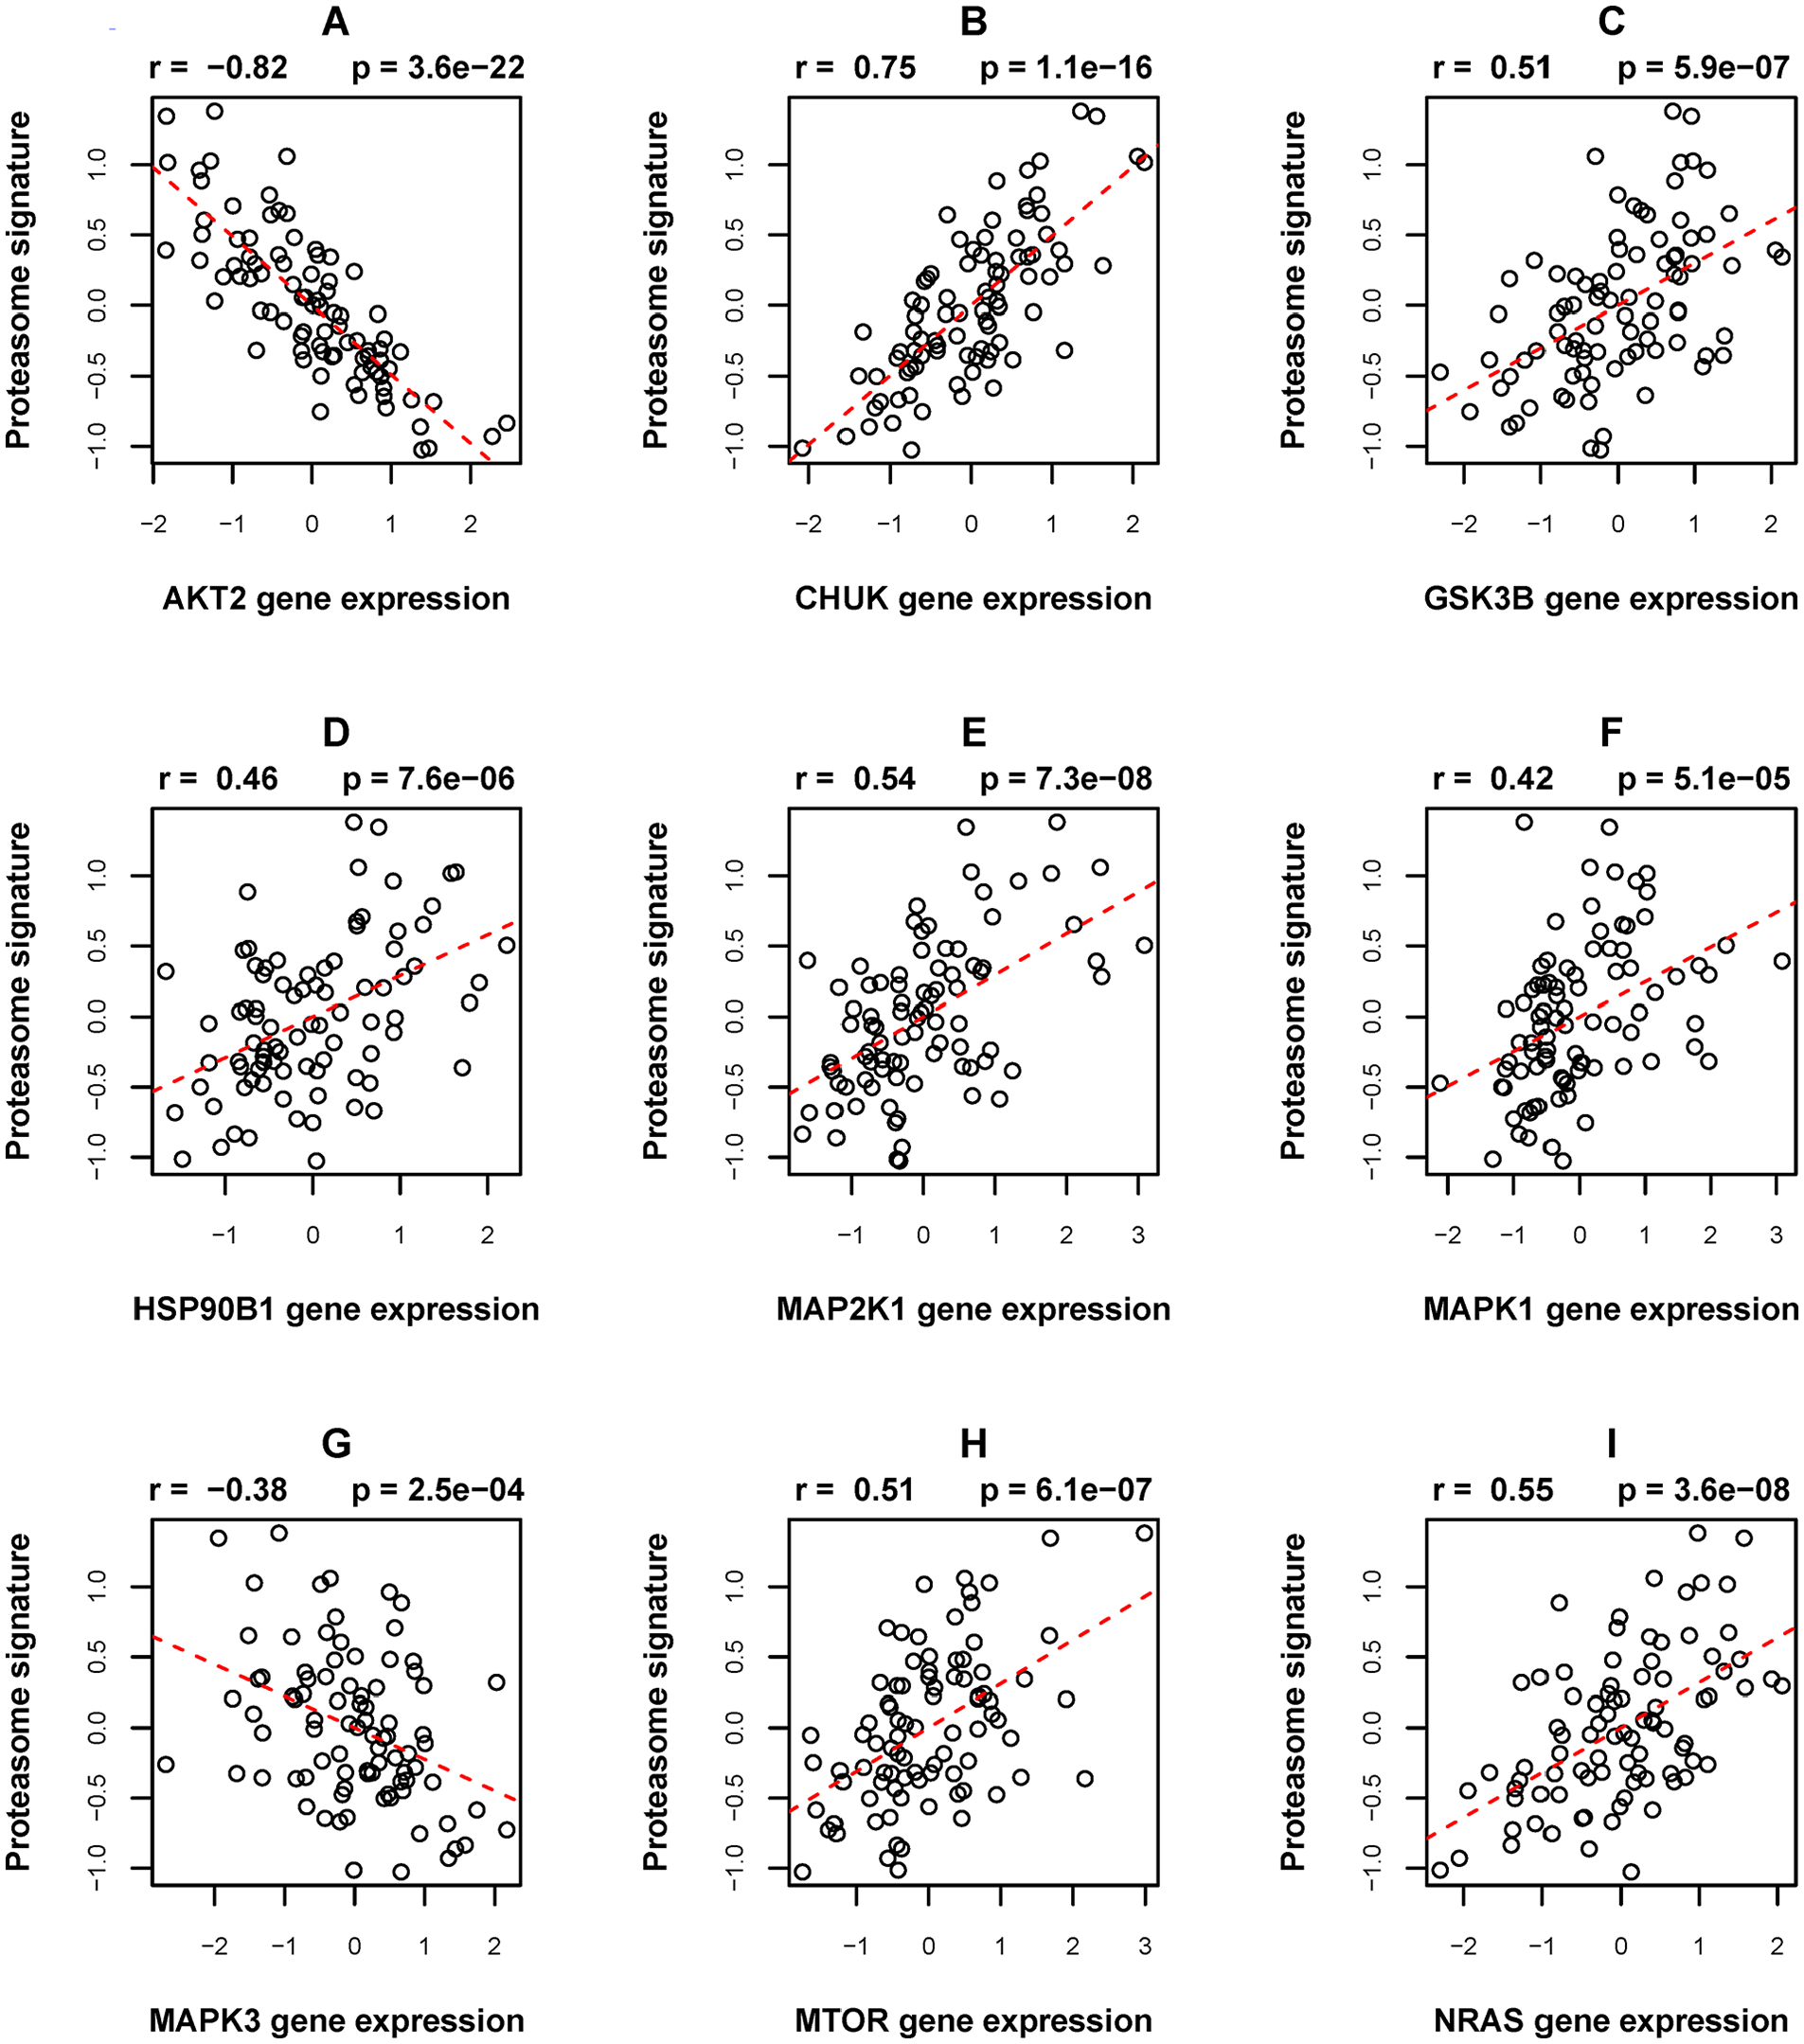
The correlation between the proteasome signature and the expression levels of the nine PRS genes that are involved in the KEGG pathway “hsa05215::Prostate cancer.” (A)-(I) Correlations between proteasome signature and the expression levels of AKT2, CHUK, GSK3B, HSP90B1, MAP2K1, MAKP1, MAKP3, MTOR and NRAS genes.
PRS genes as predictors of cancer progression
Given the PRS genes, their involvement in the prostate cancer pathway and the adhered substantial FDR, the following 2 problems may be worth investigation to validate the observed associations, directly or indirectly, and to understand their potential roles in mediating PRS and PCa susceptibility. The first is whether the initiation and growth of tumors before developing to detectable cancer are related to the expression levels of the PRS genes. The second is whether the further progression potential of primary cancer cells is influenced by the expression profiles of those genes. Here, using an array of available datasets, we performed a study regarding the second problem. More specifically, we assessed the capacity of the expression profiles of the PRS genes in predicting the biochemical relapse of malignant prostate cancer (Gleason score ⩾7) after prostatectomy.
Among the top 100 PRS genes (ranked according to the P-values, which were determined by the standardized effect sizes and an identical residual degree of freedom in the t-test used in the linear model analysis) for the associations between PRS and gene expression levels, eighty were included in the TCGA expression dataset. Based on the information of the TCGA cohort, we selected a transcriptomic prognostic marker set by refining the top PRS gene set. The marker set of 35 genes (Supplemental Text S1) demonstrated prediction strength in the TCGA dataset and 4 of 5 external datasets (Figure 5), with AUCs ranging from 0.65 (in GSE70769) to 0.8 (in GSE54460). It could be further condensed to a smaller marker set (18 genes, Supplemental Text S1), with a small loss in robustness (Supplemental Figure S1). The sizes (35 and 18) of the 2 prognostic marker sets were determined by visually finding the peak points of a spline curve. The curve depicted the dependence of AUC values (y-axis) on the numbers (x-axis) of temporally selected prognostic markers (genes) and was based on the iteratively updated results from running the feature wrapper (See the Method section) 27 on the TCGA data (Supplemental Figure S2).

The performance of the prognostic transcriptomic signature of 35 PRS genes in the discovery dataset TCGA (-PRAD) and five external datasets, that is, GSE54460 and others. The “-radial” indicates the kernel function used the SVM models. The output BCR label (1 or -1) and numeric decision values, that is, transcriptomic BCR risk scores (TRSs) of patients in the GSE70769, which had a small sample size (N = 36), were predicted by the model trained using the GSE70768 dataset. For the patients in other cohorts, the labels and scores were predicted via LOOCV. Together with the actual BCR labels, the output BCR labels and TRSs were used to calculate a 2 × 2 contingency table for estimating the p-value and to generate the ROC curve, respectively. Sn and Sp denote sensitivity and specificity, respectively.
Regarding the analysis and results mentioned above, the following points are worth noting. First, because the primary objective of this study is to understand the biology for PRS in prostate cancer, we initiated the feature wrapping from top PRS genes such that the finally selected genes had a relatively strong relationship with PRS. The somewhat arbitrary cutoff “top 100” was specified in reference to our recent publication which shew that cancer progression could be well predicted with a transcriptomic signature of 10 to 40 genes. 27 Second, the poor and elusive AUC value in the GSE84042 data may be partially due to the small size and high-class imbalance of the cohort (14 BCR+ and 43 BCR− cases), or unknown confounding factor(s) adhering to the samples. As shown in the reference, 27 most of the prognostic gene expression signatures identified in earlier studies lacked prediction strength in the data.
Racial disparities in PRS and gene expression
Previous publications showed that the difference in PCa incidence rates between EA and AA was compatible with the interpopulations variation in PRS.12,48 To further evaluate the aptness of PRS in explaining the racial disparity in PCa, we specially tested a heuristic hypothesis (

Racial disparities in PRS and gene expression level. (A) Comparisons of PRS between AA and EA males. 1000G:ASW and 1000G:CEU denote African Ancestry in the SW USA and Utah residents with Northern and Western European ancestry, respectively, as coded by the 1000 Genomes Project. T-test was used to estimate the p-values for the between-group differences. (B) The KEGG pathways overrepresented by the 593 genes (disparity genes) differentially expressed between AA and EA prostate samples in the GTEx dataset. (C) The distribution profiles of the fold changes in the expression levels of the 42 proteasome genes between the AA and EA groups. (D) The inverse relationship between the AA-versus-EA fold changes (y-axis) of the expression levels of the 23 genes that were in both the PRS gene set and disparity gene set and the partial correlation coefficients (x-axis) between expression levels and PRS.
By running the regression model M-2 (See Methods section), 593 differentially expressed genes (P < .01, FDR = 0.31) (disparity genes) between the EA and AA groups were identified (Supplemental Table S2). Four KEGG pathways were overrepresented (P < .01) by the disparity genes (Figure 6B). The top significant pathway (BH adj P-value = .002) was hsa04120::Ubiquitin mediated proteolysis, the only one with adj P-value < .1. As mentioned in the PRS genes and pathway analysis subsection, hsa04120 actually denotes the second step of UPS. The common enrichment of the disparity genes and the PRS genes with UPS represented a functional relevance of these 2 gene sets. However, most of the log2 fold changes (AA versus EA) in the expression of the 128 genes in hsa04120 were negative (Figure 6C). This was different from the distribution profile of the (partial) correlations between the expression levels of proteasome genes and PRS shown in the Figure 2A. We compared the disparity gene set and the PRS gene set, finding an overlap of 23 genes. For those genes, a highly significant negative relationship between the AA-versus-EA fold changes and the correlations between expression levels and PRS was demonstrated (Figure 6D). This inverse pattern was also observed when we used to TCGA datasets to perform the same analyses (Supplementary Figure S3), although the involved genes were different. All results indicated that the hypothesis
Discussion
To reveal the biological basis for polygenic inheritance in prostate cancer, we carried out this comprehensive genomic analysis. The specific results suggested the aptness and inaptness of PRS for explaining PCa susceptibility. First, the risk variant-based heritability of the trait holds double-edged implications. On the one hand, the inaptness is implied by the fact that the risk variants contribute only 9.4% to 12% of the phenotypic variance, or 15.8% to 37.8% (derived from the heritability estimates) of the variance that can be explained by the variants in a whole genome array of a half million SNPs. On the other hand, aptness is apparent in that the h 2 estimates, although small, are statistically significant. In particular, the values are at least 5.7 times of their standard errors, and, therefore, the probability of zero-contribution of the risk variants to the trait is definitely less than 0.03 (1/5.72), as derived using Chebychev’s Inequality. 49
Using the data of 87 physically-healthy EA males in the GTEx cohort, we identified 540 PRS genes whose expression levels are associated with PRS. While the false discovery rate of the gene set was high (~0.32), the functional enrichment analysis demonstrated an encouraging result. The apparent relevance of the overrepresented pathways to prostate cancer, that is, the substantial involvement of the PRS genes in several PCa-related canonical cancer pathways, suggests the aptness of the PRS for biologically explaining males’ susceptibility to the cancer. A novel finding in this analysis is the consistent positive correlation between the PRS and expression levels of the genes in the ubiquitin-proteasome system (UPS). The UPS plays an important role in both cell proliferation and survival.50,51 Cancer cells can utilize the increased UPS activity to achieve aberrant growth and resistance to apoptosis. 52 The components of the UPS represent a diverse group of potential anticancer targets.53 -55 Basing on our results and the established knowledge in the fields of cancer biology and genetics, we perceive that PI3K-Akt/RAS-MAPK/mTOR signaling pathways and ubiquitin-proteasome system may be 2 pivots linking PRS and the initiation and growth of prostate tumors. If this is true, the following 2 problems would be worth investigating. The first is whether the positive association between PRS and proteasome signature indicates the more frequent existence of tumorous cells in the prostate tissue of high-PRS individuals compared to the existence in low-PRS individuals. The second is whether there is a directed regulatory relationship between the proteasome genes and the PRS genes on the PI3K-Akt/RAS-MAPK/mTOR signaling pathways in prostate tissue. A previous study showed that mTOR inhibition activated overall protein degradation by the UPS and autophagy in myoblasts. 56 However, the mechanism in prostate tissue is still unknown.
Among the hundreds of PCa risk variants, those located within or adjacent to a cancer-related gene are not populous. 12 Although PRS is known to be noisy, its relevance with cancer susceptibility is intuitively stranger and more robust than individual risk variant. To our knowledge, the results and implications discussed in the last paragraph have been hardly reported by previous eQTL analysis or the function annotation of the risk loci.
Another novel finding in this study is that the expression profiles of the most significant PRS genes in tumor samples are capable of predicting the biochemical relapse of malignant PCa after prostatectomy. Except for the GSE84042 data, the predictive performance of the marker sets selected by refining the top 100 PRS genes is comparable with the best of the transcriptomic prognostic signatures (gene sets) reported in recent publications, including the TP53 mutation status-associated signature. 27 This finding could be considered as an additional evidence for the aptness of the PRS in explaining prostate cancer. It also suggests that some PRS genes play roles in both the early development of prostate tumors and the late progression of malignant cancers. However, it is worth noting that the associations between PRS and gene expression levels in healthy male prostate tissue samples may be not maintained in prostate cancer samples, as shown by the comparison between the PRS gene set and the corresponding result (not reported in this paper) from analyzing the TCGA data. A recent publication showed that PRS for cancer incidence was a weak predictor of prostate cancer metastasis or death. 57 This discordance with our result could be attributed to the fact that the associations between PRS and the expression levels of the prognostic PRS genes were moderate.
We confirmed the previous observation that American males of African ancestry had higher PRSs than Europeans American males. Meanwhile, we also found that the transcriptomic differences between African American (AA) and EA samples were incompatible with the patterns of the associations between PRS and gene expression levels found in EA samples. The latter result somewhat compromises the aptness of PRS for explaining the racial disparity in the PCa incident rate. While the analysis results were likely biased due to the small size of the AA group in the GTEx data and the potential unhealthy status in some of the individuals who were assumed to be “physically health” in the selection of samples (see the Data section), the possibility that the pattern shown in Figure 6D was due to the data insufficiency-sourced biases and/or random coincidences should be very small. Hereby, our analysis raised an important question in prostate genetics. That is, whether there is a racial disparity in the biological mechanisms by which the genetic predisposition, assessed with PRS, influences the initiation and growth of tumors.
A major limitation of this study was that, for a specific PRS gene, the paths that bridged the variations in expression intensity and PRS were not pursued, due to the lack of analysis methods appropriate for the purpose. Theoretically, expression quantitative trait loci (eQTLs) may be involved in these paths. In the prostate tissue-specific eQTL catalog of the GTEx release V8 (https://gtexportal.org/home/datasets), the SNPs hosting 33 (of 269) PCa risk variants are paired with 41 genes in the manner of one to one or one to many (Supplemental Table S3). While there is only a small overlap between those eQTL genes and the PRS genes identified here, which contains HLA-DRB6 and UHRF1BP1, it is possible that the effects of the eQTL SNPs on the cis-located target genes are conveyed to the PRS genes through signaling cascades or more complicated regulatory networks. Intuitively, such a possibility also exists for those eQTL SNPs that have not been identified by any published study.
Conclusions
We investigated the biological basis for polygenic risk scores and disparities in prostate cancer by a comprehensive genomic analysis. The new findings in this study, alongside the moderate but significant heritability of PCa susceptibility contributed by the risk variants, suggest the aptness and inaptness of the PRS for explaining PCa and racial disparities. They may be useful for conceiving the potential biological mechanisms that bridge the cancer susceptibility and polygenic inheritance. We also identified a promising transcriptomic prognostic signature.
Supplemental Material
sj-docx-1-cix-10.1177_11769351241276319 – Supplemental material for Understanding the Biological Basis of Polygenic Risk Scores and Disparities in Prostate Cancer: A Comprehensive Genomic Analysis
Supplemental material, sj-docx-1-cix-10.1177_11769351241276319 for Understanding the Biological Basis of Polygenic Risk Scores and Disparities in Prostate Cancer: A Comprehensive Genomic Analysis by Wensheng Zhang and Kun Zhang in Cancer Informatics
Footnotes
Acknowledgements
The authors thank the editor and 3 reviewers for their constructive comments.
Author Contributions
Study conception and design: WZ, KZ. Experiments: WZ. Data analysis: WZ, KZ. Writing: WZ, KZ. All authors read and approved the final manuscript.
Funding:
The author(s) disclosed receipt of the following financial support for the research, authorship, and/or publication of this article: This research is supported by the NIH grants U54MD007595 and U19AG055373.
Declaration Of Conflicting Interests:
The author(s) declared no potential conflicts of interest with respect to the research, authorship, and/or publication of this article.
Data Availability
The SNP genotype datasets of the 3 GWAS projects, GTEx and TCGA are deposited in dbGaP (The database of Genotypes and Phenotypes, https://www.ncbi.nlm.nih.gov/gap/) at the archives with accession numbers phs000207.v1.p1, phs000812.v1.p1, phs000306.v3.p1, phs000424.v8.p2, and phs000178.v10.p8, respectively. The access for these collections is controlled by a data access committee in the National Institutes of Health, USA. The open GTEx gene expression data is linked at the website (https://gtexportal.org/home/datasets). The gene expression data of the TCGA samples is available in Genomic Data Commons Data Portal (https://portal.gdc.cancer.gov/). The 1000 Genomes data is currently available at ![]() .
.
Supplemental Material
Supplemental material for this article is available online.
References
Supplementary Material
Please find the following supplemental material available below.
For Open Access articles published under a Creative Commons License, all supplemental material carries the same license as the article it is associated with.
For non-Open Access articles published, all supplemental material carries a non-exclusive license, and permission requests for re-use of supplemental material or any part of supplemental material shall be sent directly to the copyright owner as specified in the copyright notice associated with the article.