
Abstract
Host immunogenetics play a critical role in the human immune response to melanoma, influencing both melanoma prevalence and immunotherapy outcomes. Beneficial outcomes that stimulate T cell response hinge on binding affinity and immunogenicity of human leukocyte antigen (HLA) with melanoma antigen epitopes. Here, we use an in silico approach to characterize binding affinity and immunogenicity of 69 HLA Class I human leukocyte antigen alleles to epitopes of 11 known melanoma antigens. The findings document a significant proportion of positively immunogenic epitope-allele combinations, with the highest proportions of positive immunogenicity found for the Q13072/BAGE1 melanoma antigen and alleles of the HLA B and C genes. The findings are discussed in terms of a personalized precision HLA-mediated adjunct to immune checkpoint blockade immunotherapy to maximize tumor elimination.
Introduction
Melanoma incidence has been increasing for decades and, despite being the least common form of skin cancer, melanoma accounts for a disproportionately high number of skin cancer related deaths.1,2 Therapeutic advances such as checkpoint blockade immunotherapy have improved melanoma survival rates; however, checkpoint blockade immunotherapy outcomes are partially dependent on host immunogenetics. To that end, a recent study documented extended survival in patients who possessed certain human leukocyte antigen (HLA) Class I B alleles (B*18:01, B*44:02, B*44:03, B*44:05, B*50:01) and poor outcomes in those with another HLA allele (B*15:01). 3 Remarkably, immunogenetic epidemiological findings demonstrated congruence between the population frequency of those HLA alleles that influence checkpoint blockade immunotherapy outcomes and the population prevalence of melanoma, suggesting that certain HLA alleles may similarly influence overall melanoma risk and protection as well as treatment outcomes. 4 In addition, that study evaluated the influence of a large number of HLA alleles on the population prevalence of melanoma and identified robust protective effects associated primarily with alleles of the HLA Class I B gene, extending HLA-melanoma associations beyond those that are already known to influence melanoma checkpoint blockade immunotherapy outcomes. 4 Taken together, these and other studies highlight the influence of HLA on melanoma population prevalence and individual survival and treatment response and suggest broad HLA-melanoma associations.3-6 Here we evaluate those associations in the context of the role of HLA in antigen elimination.
HLA plays a critical role in immune surveillance and host protection by facilitating identification and elimination of foreign antigens including cancer neoantigens. 7 Optimally, melanoma antigen-derived peptides bound by HLA class I are exported to the cell surface for presentation to CD8+ T lymphocytes signaling destruction of tumor cells, a process that depends on both binding affinity and immunogenicity. However, the highly polymorphic nature of HLA contributes to variation in the binding groove; consequently, HLA alleles vary tremendously with respect to peptide binding capability, immunogenicity, and subsequent antigen elimination.8-16 This variability also has implications for checkpoint blockade immunotherapy outcomes. Various immune-escape mechanisms exploited by tumors may disrupt the host immune response, permitting unchecked tumor cell proliferation.17-19 Immune checkpoint inhibitors are aimed at improving the ability of the host’s immune system to detect and eliminate tumor antigens; however, that rests on the assumption that host HLA composition complements that of the tumor antigen to permit antigen binding with sufficient affinity and immunogenicity to support tumor antigen elimination. Indeed, differential immunotherapy outcomes have been attributed to variability in melanoma neoantigen binding. 3 Thus, both host immune response to cancer neoantigens and success of immunotherapy depends on binding affinity and immunogenicity of a given HLA allele-melanoma antigen combination; yet, relatively little is known about binding affinity and immunogenicity of specific HLA alleles with melanoma antigens.
We have previously characterized the immunogenetic profile of melanoma with regard to 69 Class I HLA alleles. 4 In that study, we determined the association between allele prevalence and melanoma prevalence at the population level and documented negative (protective) and positive (susceptibility) scores. Here, to test the hypothesis that those protective and susceptibility effects are related to melanoma antigen elimination, we use an in silico approach 20 to characterize binding affinity and immunogenicity of those 69 Class I HLA alleles to 11 known melanoma antigens. 21
Materials and Methods
Melanoma antigens
Eleven melanoma antigens (Table 1) were used based on their known occurrence in melanoma tumors 21 ; their amino acid (AA) sequences were retrieved from the Uniprot Database 22 and are given in Supplemental Appendix A.
The 11 melanoma-related antigens. The listing is from the UniProt Consortium 22 .

HLA alleles and their supertypes
We used 69 HLA Class I alleles (Table 2), consisting of 20 gene A, 36 gene C, and 13 gene C alleles. Alleles of A and B genes were assigned to supertypes. 23 More specifically, of a total of 56 alleles of A and B genes, 53 alleles could be assigned to supertypes, namely all 20 A gene alleles and 33/36 B gene alleles; B*13:02, B*47:01 and B*49:01 were unassigned (Figure 2 in Sidney et al 23 ). The assignment of alleles to supertypes is given in Table 2 and their distribution in Table 3.
The 69 HLA Class I alleles used and their gene and supertype assignments.

Distribution of 56 Class I A and B alleles in supertypes.

Melanoma-HLA protection/susceptibility (P/S) scores
The P/S scores
4
are the Pearson correlations,

A negative score stems from a negative correlation between melanoma prevalence and allele frequency and, hence, indicated a protective role of that allele; conversely, a positive score stems from a positive correlation between melanoma prevalence and allele frequency, indicating a susceptibility role. Given the continuous nature of
Melanoma-HLA P/S scores 4 of the 69 HLA Class I alleles. Negative and positive scores indicate protection or susceptibility, respectively.

Determination of immunogenicity of HLA Class I alleles
The INeo-Epp method 20 was used for T-cell receptor (TCR) epitope prediction using the INeo-Epp web tool via the INeo-Epp web form interface. 24 For that purpose, we split a given melanoma antigen to all possible 9-mer AA residue epitopes using a sliding window approach10-12 (Figure 1) and submitted each epitope to the web-application together with a specific HLA allele (Table 2). More specifically, we paired all epitopes with all alleles and obtained for each pair its percentile rank, a measure of binding affinity of the epitope-HLA allele complex; smaller percentile ranks indicate higher binding affinity. The web-application also gave a TCR predictive score for pairs with high binding affinities (percentile rank <2); scores >0.4 (called s) indicated positive immunogenicity and were analyzed further.
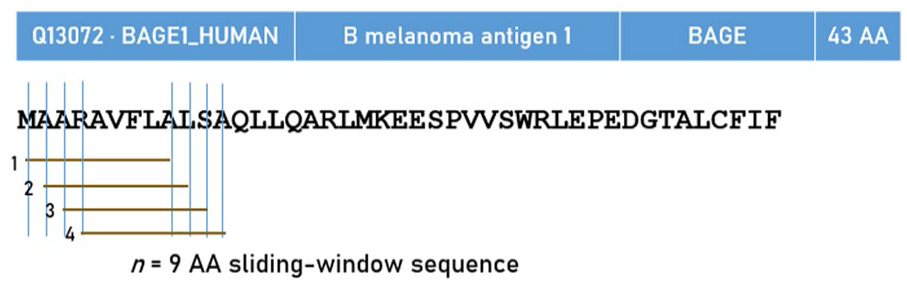
Schematic diagram to illustrate the exhaustive, sliding-window method for testing in silico all possible consecutive 9-AA residues.
Application to individuals
Since every individual carries 6 classical HLA alleles (2 of each 3 HLA Class I genes), an average Melanoma-HLA P/S score can be calculated:

where A, B, C denote HLA Class I genes. Similarly, we computed an average positive immunogenicity score:

We obtained expected estimates of ξ and θ using a bootstrap procedure,
25
as follows. For each gene, 2
Standard parametric (mean, standard deviation, etc.) and nonparametric statistics (median, interquartile range, etc.) were used to evaluate the distribution of ξ* and θ*. We used Tukey’s fences 26 to identify outlier and extreme values, as follows.


where Q1, Q3 are the 25th and 75th percentiles, respectively. These fences demarcated outlier values, that is, values lying outside the fences.
Data analysis
Standard statistical methods were used to analyze the data, including descriptive statistics, analysis of variance (ANOVA), Pearson correlation, and the Wilson score and associated 95% confidence intervals (CI) for testing a proportion. These analyses were done using the IBM-SPSS statistical package (version 27). All reported statistical significance P-values are 2-sided. The bootstrap was implemented using FORTRAN (Geany, version 1.38, built on or after 2021-10-09). A 64-bit Mersenne Twister random number generator with a large random double-precision odd seed was used for the random sampling.
Results
Overall, there was a total of10 806 epitope-allele combinations with high estimated binding affinity (percentile rank < 2). Of those, 5817 (53.8%) had a positive immunogenicity score; this proportion (0.538 ± 0.005 SE, 95% CI 0.529-0.548) was statistically highly significant (Z = 7.96, P < .001, Wilson score test for single proportion).
Assessment of predictive TCR (positive immunogenicity)
Detailed results are given in Tables 5 to 7 and are plotted in Figures 2 to 6. There was a total of 11 antigens ×´ 69 alleles = 759 antigen-allele combinations, of which 15 had no cases of positive immunogenicity (PI, “hits”). We analyzed the remaining 744 combinations using a univariate ANOVA where the proportion of PI per count of high binding affinity (for each antigen-allele combination) was the dependent variable and the Antigen (N = 11) and Gene (N = 3) were fixed factors. We found the following.
Ranked mean proportions (and associated statistics) of sequences with positive nonamer immunogenicity (over all sequences with high binding affinity) for the 11 antigens tested.

For a given antigen-allele combination, the immunogenicity of each nonamer of the antigen was evaluated with respect to the given allele. Let M be the number of nonamers that showed high binding affinity, and K the number of nonamers (out of M) that showed positive immunogenicity; the proportion Prop = K/M is the proportion (Prop) of nonamers with positive immunogenicity for an antigen-allele combination. The mean proportion in the table is the mean Prop across the contributing alleles (column 3, “N alleles,” ie, alleles associated with positive immunogenicity) for the corresponding antigen. SEM, standard error of the mean. N is the number of alleles with positive immunogenicity for the listed antigen. Results are from the ANOVA described in the text.
Mean proportions of antigen-allele combinations with positive immunogenicity, ranked for the 3 HLA Class I genes. Conventions as in Table 3.

Mean proportions of antigen-allele combinations with positive immunogenicity, ranked for alleles.

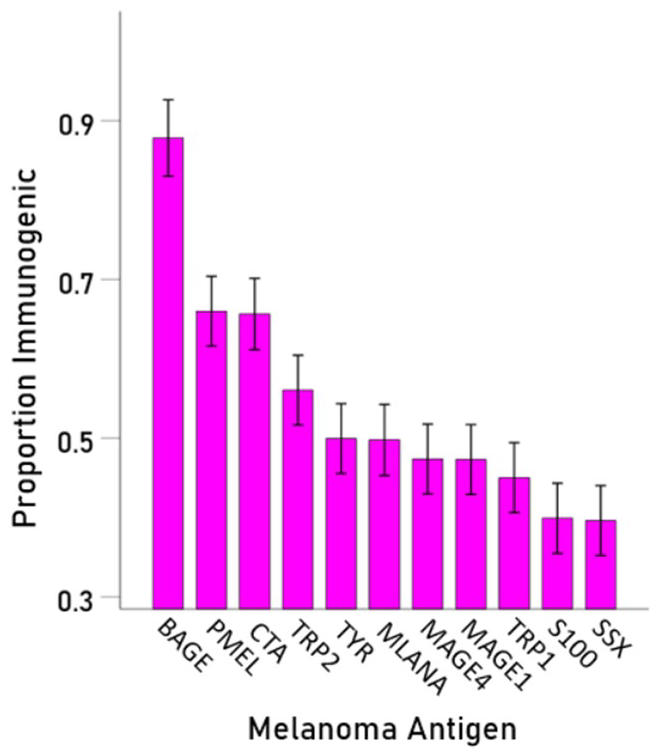
Mean PI (±95% CI) is plotted for each melanoma antigen, ranked from high to low.

Mean PI (±95% CI) is plotted for each HLA gene.

Mean PI (±95% CI) is plotted for each melanoma antigen – HLA gene combination.


Frequency distribution (left panel) and corresponding boxplot (right panel) of the 69 immunogenicity scores. See text for detail.
Effect of antigen
Antigen had a highly significant effect on PI (F[10,711] = 36.7, P < .001). It can be seen in Table 5 and Figure 2 that antigen BAGE had the highest PI score (proportion of hits), followed by PMEL and CTA. The remaining antigens had smaller effects, with SSX having the lowest.
Effect of Gene
Gene had also a highly significant effect (F[2,711] = 44.0, P < .001), with gene B having the highest PI score (Table 6 and Figure 3), followed by genes C and A.
Antigen x Gene interaction
There was a highly significant Antigen × Gene interaction (F[20,711] = 4.5, P < .001), indicating that the effect of gene differed among antigens, as can be seen in Figure 4.
Effect of alleles
This was assessed by a univariate ANOVA where the PI score (immunogenicity proportion) was the dependent variable and the allele was a fixed factor. We a highly significant allele effect (F[68,675] = 2.58, P < .001). The immunogenicity scores for each allele are given in Table 7 and are plotted ranked in Figure 5. Allele B*56:01 had the highest score of 0.743, and allele A*03:01 had the lowest (0.257). The frequency distribution of the immunogenicity scores and the corresponding box plot are shown in the left and right panels of Figure 6, respectively. The median was at 0.566, and there were 2 high (2.9%) and 6 low (8.7%) outliers.
Effect of supertype
This was assessed by a univariate ANOVA where the PI score (immunogenicity proportion) was the dependent variable and the supertype was a fixed factor. We found a highly significant effect (F[12,589] = 8.29, P < .001). The average scores for individual supertypes are plotted in Figure 7. It can be seen that supertypes B44 and A03 A24 had the highest and lowest scores, respectively. Of special interest is the contrast between B44 and B62, since B44 has been found to be beneficial to the outcome of checkpoint blockade immunotherapy of melanoma, in contrast to B62 which had the opposite effect. 3 Indeed, the average scores of B44 and B62 were ranked first and ninth, respectively (Figure 7), reflecting a significantly higher immunogenicity score of B44 than B62 (Figure 8). For B44, the mean ±SEM was 0.650 ± 0.02, N = 121 antigen-allele combinations, whereas for B62 it was 0.496 ± 0.047, N = 22 antigen-allele combinations; the differences was highly statistically significant (t[141] = 3.16, P = .002, independent samples t-test).

Mean PI (±SEM) for the 11 allele supertypes.

Mean PI (±SEM) for B44 and B62 supertypes.
Evaluation of nonamers
The results above dealt with HLA allele immunogenicity at the antigen level. In this analysis we focused on the relations between individual immunogenic nonamers and HLA alleles. Detailed information about the counts of single nonamers with positive immunogenicity and alleles of the 3 HLA Class I genes is given in Supplemental Appendix B. There was a total 837 distinct nonamers with positive immunogenicity. Of those, 830 came each from a different antigen (peptide): although a given antigen comprised a number of immunogenic nonamers (Supplemental Appendix C), any specific immunogenic nonamer came from only one antigen. The remaining 7 nonamers were present in both MAGE1 (P43355) and MAGE4 (P43358) antigens, and, hence, are shown twice in Supplemental Appendices B and C.
Application to individuals: Association between positive nonamer immunogenicity and melanoma-HLA P/S scores
The bootstrap analysis was aimed to derive estimates of immunogenicity against the 11 melanoma antigens from sets of 6 HLA alleles (2 per each Class I gene), a realistic assessment at the organism level, given that each individual carries 6 such alleles. For the same set of randomly selected alleles, we computed (a) the average positive immunogenicity score ξ*, (b) the average Melanoma-HLA P/S score θ*, and (c) the covariance COVξ*θ* between the 2 scores. We thus obtained 1 million triplets which enabled us to evaluate the distributions of ξ*and θ*, and their association. The frequency distributions of ξ*and θ* are plotted in Figure 9A and B, respectively. With respect to the distribution of ξ*(Figure 9A), the median was at −0.124, and there were 655 (0.06%) high- and 7525 (0.75%) low-immunogenicity outliers (Figure 10A). With respect to the distribution of θ*Figure 9B, the median was at 0.537, and there were 8093 (0.81%) high (susceptibility) and 40 (0.004%) low (protection) P/S score outliers (Figure 10B). These findings indicate a correspondence between high immunogenicity/high protection and low immunogenicity/low protection (susceptibility). Direct support for this association was provided by 3 additional findings. First, the Pearson correlation between ξ*and θ* was negative and highly significant (P = −.095, P < .001, N = 1 million). Second, the average covariance was significantly negative (P < .001, one-sample t-test). And third, the average immunogenicity ξ* was significantly higher in the group with protective (negative) θ* values: for protective ξ*, θ* = 0.537 ± 0.018 (mean ±SEM, N = 700257), and for susceptibility ξ*, θ* = 0.534 ± 0.021 (N = 299743; P < .001, independent samples t-test).

Frequency distribution of 1 million ξ* (A) and θ* (B) values. See text for details.

Boxplots of the data shown in Figure 9. See text for details.
Discussion
Here we evaluated the immunogenicity of 69 HLA Class I alleles with 11 antigens expressed in melanoma tumors. Overall, a significant proportion of epitope-allele combinations were positively immunogenic, suggesting a propensity toward melanoma antigen elimination conferred by those HLA Class I alleles. The relatively low rates of melanoma may be partially attributable to the relatively high proportion of positively immunogenic epitope-antigen combinations. Further analyses documented positive immunogenicity varied across melanoma antigens and HLA Class I alleles with the highest proportions of positive immunogenicity found for the Q13072/BAGE1 melanoma antigen and alleles of the HLA B gene. Those findings and their implications are discussed further below.
Of the 11 melanoma antigens, Q13072 (BAGE1) had the highest proportion of positive immunogenicity (88%) followed by P78358 (CTG1B) and P40967 (PMEL/gp100) (each 66%). A prior study that reported BAGE1 expression in 22% of melanomas suggested BAGE1 could serve as a target for T cells immunotherapy 27 ; however, that has not been evaluated in clinical trials to date. 28 The present findings showing that the vast majority of BAGE epitope-HLA Class I allele combinations were highly immunogenic support the hypothesis that targeting BAGE may be beneficial. Of note, 9 of the 69 HLA alleles did not have any “hits” in terms of positive immunogenicity for BAGE, highlighting the specificity of antigen epitope-allele effects. We are not aware of clinical trials involving antigen P78358 (CTG1B); however, several clinical trials targeting gp100 have shown varying rates of clinical response.28,29 Of course, clinical response is partially reliant on host HLA. Here, while 66% of the epitope-allele combinations resulted in positive immunogenicity for P78358 and P40967 antigens, 34% did not. Thus, for all 3 of these melanoma antigens, a majority of antigen epitope–HLA Class I allele combinations investigated here predict T cell response aimed at tumor elimination, although several HLA Class I alleles may be incapable of promoting an immune response to these antigens thereby permitting tumor proliferation.
With regard to HLA, the B gene had the highest proportion of positive immunogenicity with melanoma antigens both overall (Figure 3) and for many of the specific melanoma antigens (Figure 4); however, considerable variation in immunogenicity was documented across alleles within each of the Class I genes (Table 4). Remarkably, alleles of the B44 supertype had significantly higher immunogenicity scores than those of supertype B62 (Figures 7 and 8), corresponding to favorable versus poor outcomes associated with those supertypes, respectively, in melanoma checkpoint blockade immunotherapy. 3 This finding lends further support to the hypothesis that HLA-mediated melanoma antigen elimination underlies successful clinical response to the aforementioned immunotherapy.
Variable immunogenicity likely partially accounts for varying HLA associations with melanoma prevalence 4 and immunotherapy outcomes, 3 a conclusion supported by the significant congruence documented here between positive immunogenicity and population-derived immunogenetic scores with respect to melanoma. 4 This congruence was further supported by the results of the bootstrap analyses which took into account the fact that each individual carries 6 HLA Class I alleles, thus documenting the positive association between immunogenicity and melanoma-HLA P/S scores at this more realistic level. In summary, melanoma antigen binding and immunogenicity is presumed to be the mechanism through which certain HLA alleles protect against melanoma at the population level and improve treatment outcomes at the individual level. This idea is illustrated in the schematic diagram of Figure 11. To that end, we have proposed that sufficient immunogenic binding of melanoma antigens may eliminate cancerous cells, potentially even before their detection. 4 In contrast, HLA alleles with poor binding affinity and/or weak/negative immunogenicity may result in cancer proliferation, metastasis, poor checkpoint blockade immunotherapy response, and shortened survival. In the latter case that is characterized by the absence of protective HLA, we propose a novel cancer immunotherapy consisting of administering the mRNA blueprint for the synthesis of specific HLA molecules with the highest affinity and immunogenicity to a patient’s tumor antigen(s). Coupled with immune checkpoint blockade immunotherapy, this personalized precision approach has the potential to maximize the effectiveness of HLA-mediated tumor elimination, and ideally, improve melanoma survival.

Schematic diagram to illustrate the hypothesized effects of antigen elimination by HLA molecules on melanoma prevalence and survival (blue, protective; red, susceptibility). HLA alleles with high positive immunogenicity will facilitate the elimination of cancer cells even prior to detection; therefore, those protective alleles would be associated with low prevalence of melanoma. In contrast, HLA alleles that are associated with susceptibility may be unable to sufficiently bind and eliminate melanoma neoantigens, thereby promoting continued proliferation of cancerous cells and reduced survival.
Supplemental Material
sj-docx-1-cix-10.1177_11769351231172604 – Supplemental material for Melanoma and Human Leukocyte Antigen (HLA): Immunogenicity of 69 HLA Class I Alleles With 11 Antigens Expressed in Melanoma Tumors
Supplemental material, sj-docx-1-cix-10.1177_11769351231172604 for Melanoma and Human Leukocyte Antigen (HLA): Immunogenicity of 69 HLA Class I Alleles With 11 Antigens Expressed in Melanoma Tumors by Apostolos P Georgopoulos, Lisa M James, Spyros A Charonis and Matthew Sanders in Cancer Informatics
Footnotes
Funding:
The author(s) disclosed receipt of the following financial support for the research, authorship, and/or publication of this article: Partial funding for this study was provided by the University of Minnesota (the Anita Kunin Chair in Women’s Healthy Brain Aging, the Brain and Genomics Fund, the McKnight Presidential Chair of Cognitive Neuroscience, and the American Legion Brain Sciences Chair) and the U.S. Department of Veterans Affairs. The sponsors had no role in the current study design, analysis or interpretation, or in the writing of this paper. The contents do not represent the views of the U.S. Department of Veterans Affairs or the United States Government.
Declaration Of Conflicting Interests:
The author(s) declared no potential conflicts of interest with respect to the research, authorship, and/or publication of this article.
Author Contributions
SAC and MS retrieved the data. APG performed data analysis. LMJ and APG wrote and reviewed the paper. All authors edited the paper.
Ethical Approval
This article does not contain any studies with human participants performed by any of the authors.
Supplemental Material
Supplemental material for this article is available online.
References
Supplementary Material
Please find the following supplemental material available below.
For Open Access articles published under a Creative Commons License, all supplemental material carries the same license as the article it is associated with.
For non-Open Access articles published, all supplemental material carries a non-exclusive license, and permission requests for re-use of supplemental material or any part of supplemental material shall be sent directly to the copyright owner as specified in the copyright notice associated with the article.