
Abstract
It is increasingly recognized that the human immune response influences cancer risk, progression, and survival; consequently, there is growing interest in the role of human leukocyte antigen (HLA), genes that play a critical role in initiating the immune response, on cancer. Recent evidence documented clustering of cancers based on immunogenetic profiles such that breast and ovarian cancers clustered together as did uterine and cervical cancers. Here we extend that line of research to evaluate the HLA profile of those 4 cancers and their associations. Specifically, we evaluated the associations between the frequencies of 127 HLA alleles and the population prevalences of breast, ovarian, cervical, and uterine cancer in 14 countries in Continental Western Europe. Factor analysis and hierarchical clustering were used to evaluate groupings of cancers based on their immunogenetic profiles. The results documented highly similar immunogenetic profiles for breast and ovarian cancers that were characterized predominantly by protective HLA effects. In addition, highly similar immunogenetic profiles for cervical and uterine cancers were observed that were, conversely, characterized by susceptibility effects. In light of the role of HLA in host immune system protection against non-self antigens, these findings suggest that certain cancers may be associated with similar contributory factors such as viral oncoproteins or neoantigens.
Keywords
Introduction
Cancer is a leading cause of death among women worldwide resulting from both modifiable and genetic factors.1 -3 Regarding genetic factors, the influence of human leukocyte antigen (HLA) on cancer risk, progression, and therapeutic response is increasingly recognized for several cancer types,4 -9 including women’s cancers such as breast, ovarian, uterine, and cervical cancers9 -21 Furthermore, HLA has been implicated in shared heritability across cancers.22,23 Located on chromosome 6, the HLA region codes for cell-surface proteins that are instrumental in immune system surveillance and T-cell activation aimed at elimination of non-self antigens, including viral oncoproteins and neoantigens resulting from cancer proliferation.24 -26 HLA Class I molecules (HLA-A, B, C) bind and export small endogenous peptides (8-10 amino acid residues) to the cell surface to signal cell destruction by CD8+ T lymphocytes; HLA Class II molecules (HLA-DPB1, DQB1, DRB1) bind and export larger endocytosed exogenous peptides (15-22 amino acid residues) to CD4+ T lymphocytes, initiating antibody production and adaptive immunity, and also inducing proliferation of CD8+ T lymphocytes through the release of IL-2.27,28
HLA is the most highly polymorphic region of the human genome with nearly all of the variability located within the binding groove. HLA-antigen binding is a critical initial step in facilitating the immune response to viral oncoproteins and neoantigens; thus, HLA composition determines the landscape of peptides that can be bound and, thus, eliminated. It is well-established that HLA variability is associated with variation in disease outcomes 29 including cancer susceptibility and treatment response, both at the individual 7 and population levels.30,31 Using an immunogenetic epidemiological approach, we recently evaluated the overall influence of 127 HLA Class I and II alleles on the prevalence of 30 types of cancer and documented a preponderance of protective effects of HLA on cancers, although the effects of most alleles were mixed with regard to protection or susceptibility for specific cancers. 30 Subsequent analyses of HLA-cancer associations identified 3 distinct clusters suggesting shared genetic immunogenetic influences among cancers within a given cluster 31 ; among them, breast and ovarian cancers clustered together, in keeping with prior evidence of immunogenetic overlap (associations) between breast and ovarian cancer, 23 as did uterine and cervical cancer. Here we extend that line of research by evaluating the immunogenetic profiles of breast, ovarian, cervical, and uterine cancers and their associations.
Materials and Methods
Prevalence of breast, cervical, ovarian, and uterine cancers
The population prevalence of these 4 cancers in 2016 was computed for each of the following 14 countries in Continental Western Europe (CWE): Austria, Belgium, Denmark, Finland, France, Germany, Greece, Italy, Netherlands, Portugal, Norway, Spain, Sweden, and Switzerland. Specifically, the total number of people with each cancer in each of the 14 CWE countries was identified from the Global Health Data Exchange, 32 a publicly available catalog of data from the Global Burden of Disease study, the most comprehensive worldwide epidemiological study of more than 350 diseases. The number of people with each cancer in each country was divided by the total population of each country in 2016 33 and expressed as a percentage. We have previously shown that life expectancy for these countries is virtually identical 34 ; therefore, life expectancy was not included in the current analyses.
HLA
The frequencies of all reported HLA alleles of classical genes of Class I (A, B, C) and Class II (DPB1, DQB1, DRB1) for each of the 14 CWE countries were retrieved from the website allelefrequencies.net (Estimation of Global Allele Frequencies)35,36 on October 20, 2020. As we reported previously, 34 there was a total of 2746 entries of alleles from the 14 CWE countries, comprising 844 distinct alleles, that is, alleles that occurred in at least one country. Of those, 127 alleles occurred in 9 or more countries and were used in further analyses. This criterion is somewhat arbitrary but reasonable; it was partially validated in a previous study. 37
Cancer-HLA profiles and Protection/Susceptibility (P/S) estimates
HLA profiles for each cancer were derived by computing, first, the Pearson correlation coefficient,
HLA-Cancer Protection/Susceptibility (P/S) estimate:

Negative P/S estimates indicate a protective association (“protective” alleles), whereas positive P/S estimates indicate a susceptibility association (“susceptibility” alleles). Thus 4 Cancer-HLA profiles were computed, each consisting of 127 values of
Factor analysis
A Factor Analysis (FA) was performed to identify potential groupings (“components”) of cancers (from the Allele-Cancer matrix). The method of principal components was used for extraction and the method of direct oblimin (delta = 0) with Kaiser normalization for factor rotation.
Hierarchical clustering
A hierarchical clustering analysis 39 was performed to identify potential immunogenetic cancer clusters in a dendrogram using average between-groups linkage as the method and squared Euclidean distance as the interval.
Testing of proportions
Comparison of proportions between 2 groups was performed using the Wald H0 test.
Data analysis
Standard statistical methods were used to analyze the data, including repeated measures analysis of variance (ANOVA), Pearson correlations, linear regression, etc. Statistical analyses were performed using the IBM−SPSS package (IBM SPSS Statistics for Windows, Version 27.0, 64-bit edition. Armonk, NY: IBM Corp; 2020) and Intel FORTRAN (Microsoft Visual Studio Community 2019, Version 16.7.5; Intel FORTRAN Compiler 2021). More specifically, factor analysis and hierarchical clustering were performed using the IBM-SPSS statistical package above. All P-values reported as 2-sided.
Results
Immunogenetic profiles
Representative examples of associations between cancer prevalence and allele frequency are shown in Figures 1 and 2 for breast cancer (Figure 1, left panel), cervical cancer (Figure 1, right panel), ovarian cancer (Figure 2, left panel) and uterine cancer (Figure 2, right panel). The immunogenetic scores of the 4 cancers and 127 HLA alleles analyzed are given in the Appendix. Their frequency distributions are plotted in Figure 3, and descriptive statistics are shown in Table 1.
Descriptive statistics of P/S scores of the 4 cancers analyzed.
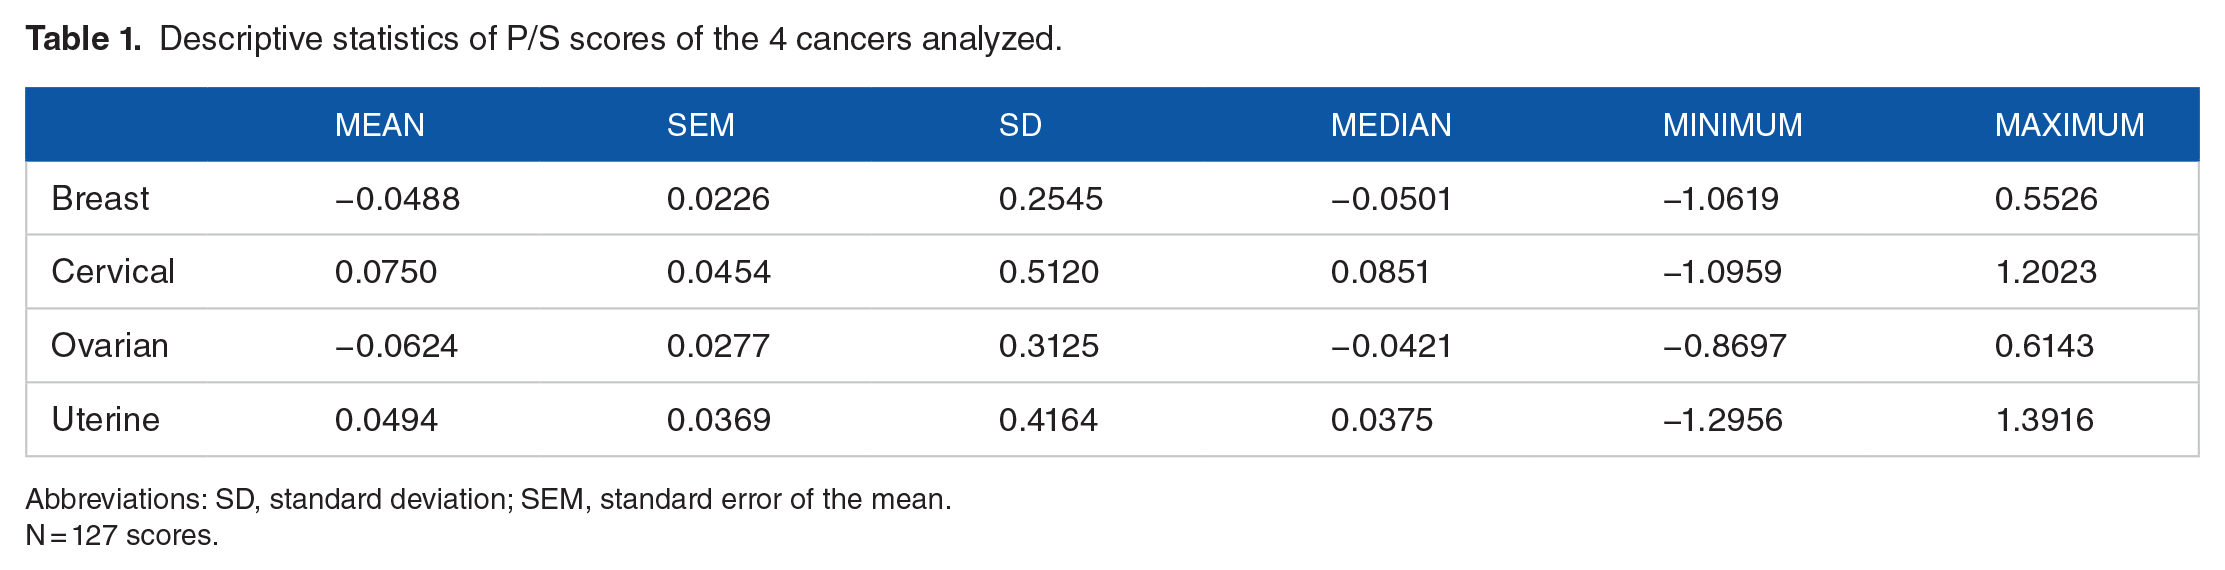
Abbreviations: SD, standard deviation; SEM, standard error of the mean.
N = 127 scores.
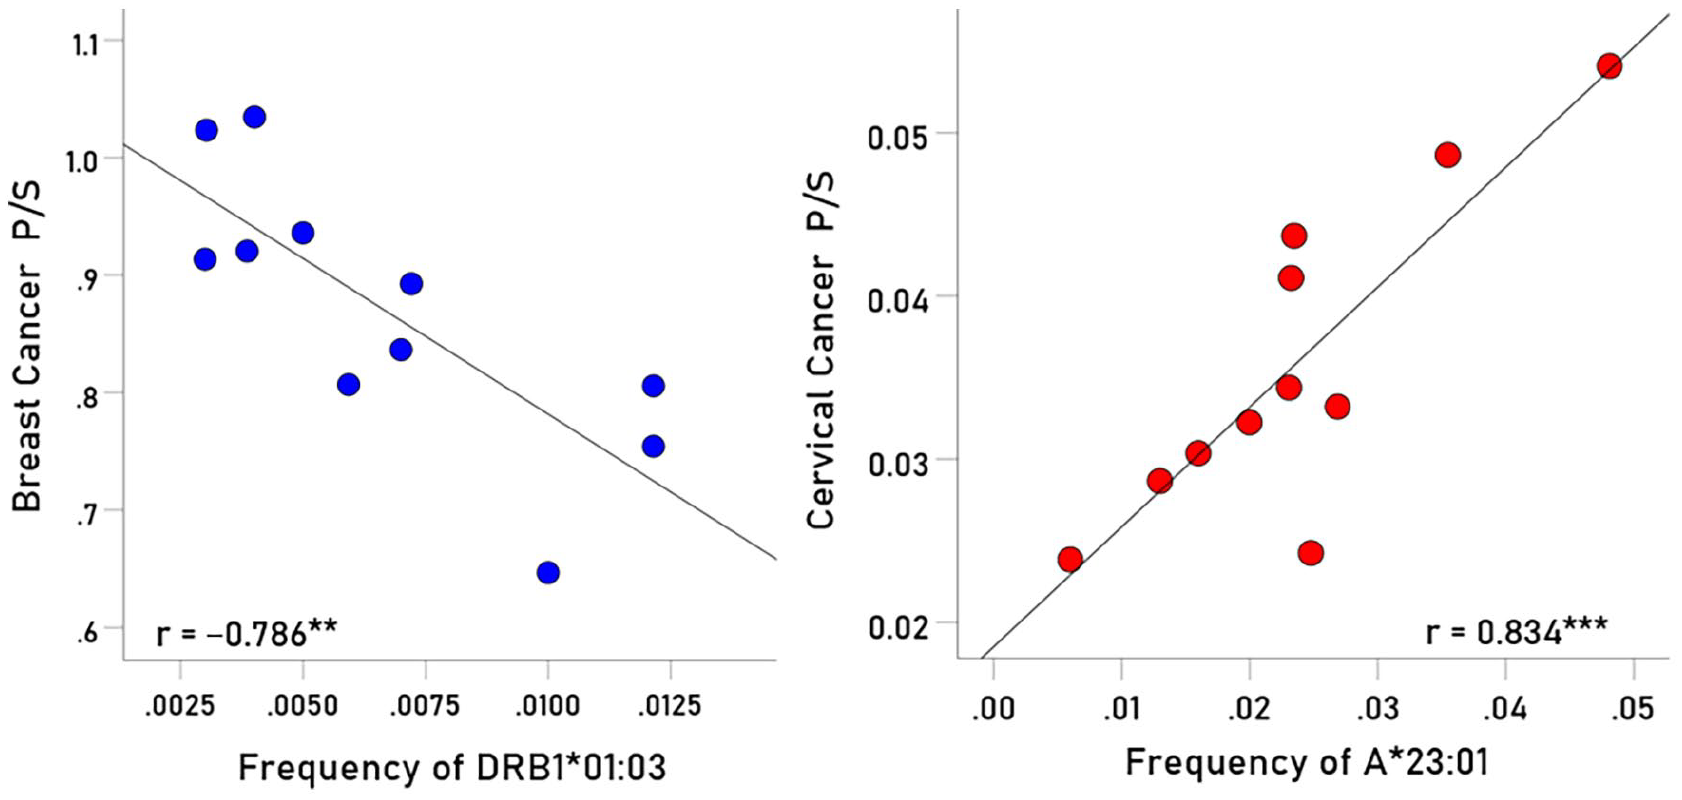
Left panel: Example of a protective allele for breast cancer. Prevalence of breast cancer is plotted against frequency of DRB1:01:03 for 11 CWE countries. P = .004; r = −0.786,

(Left panel) Example of a protective allele for ovarian cancer. Prevalence of ovarian cancer is plotted against frequency of A*23:01 for 11 CWE countries. P = .022; r = −0.677,

Frequency distributions of immunogenetic P/S scores of breast, cervical, ovarian, and uterine cancers. N = 127 for each distribution.
A repeated measures ANOVA with the P/S score of the 4 cancer types as the Within Subjects variables revealed a statistically significant effect for the Cancer factor (Greenhouse-Geisser test, P = .019). With respect to individual cancer types, there was an overall HLA protection effect for breast and ovarian cancers, and an overall susceptibility effect for cervical and uterine cancers (Figure 4). More specifically, the mean P/S scores did not differ significantly between breast versus ovarian cancer, and cervical versus uterine cancer; in contrast, the mean P/S scores of breast and ovarian cancers were significantly lower (ie, more protective) than either the cervical or uterine P/S scores (Table 2).
Pairwise comparisons of mean cancer P/S scores (from the repeated measures ANOVA).

Abbreviations: SE, standard error. *, statistically significant; **, highly statistically significant; NS, not statistically significant.

Mean ± SEM of the 4 cancer P/S scores.
Immunogenetic associations between specific cancers
All the 6 pairwise immunogenetic scores of the 4 cancers are plotted in Figures 4 to 7; the corresponding Pearson correlations and associated statistics (confidence intervals and P values) are given in Table 3. It can be seen that all correlations were statistically significant but with different signs and P-values. These results point to separate groupings of the 4 cancers, an idea that was explored further using factor analysis (FA) and hierarchical clustering.
Pearson correlations and associated statistics for the 6 pairwise associations of the P/S scores of the 4 cancer types.

Abbreviation: CI, confidence interval. *, statistically significant; **, highly statistically significant; ***, very highly statistically significant.

(A) breast cancer P/S scores are plotted against cervical cancer P/S scores (P = .004); (B) breast cancer P/S scores are plotted against ovarian cancer P/S scores (P = .001).

(A) breast cancer P/S scores are plotted against uterine cancer P/S scores (P = .001); (B) cervical cancer P/S scores are plotted against ovarian cancer P/S scores (P < .001).
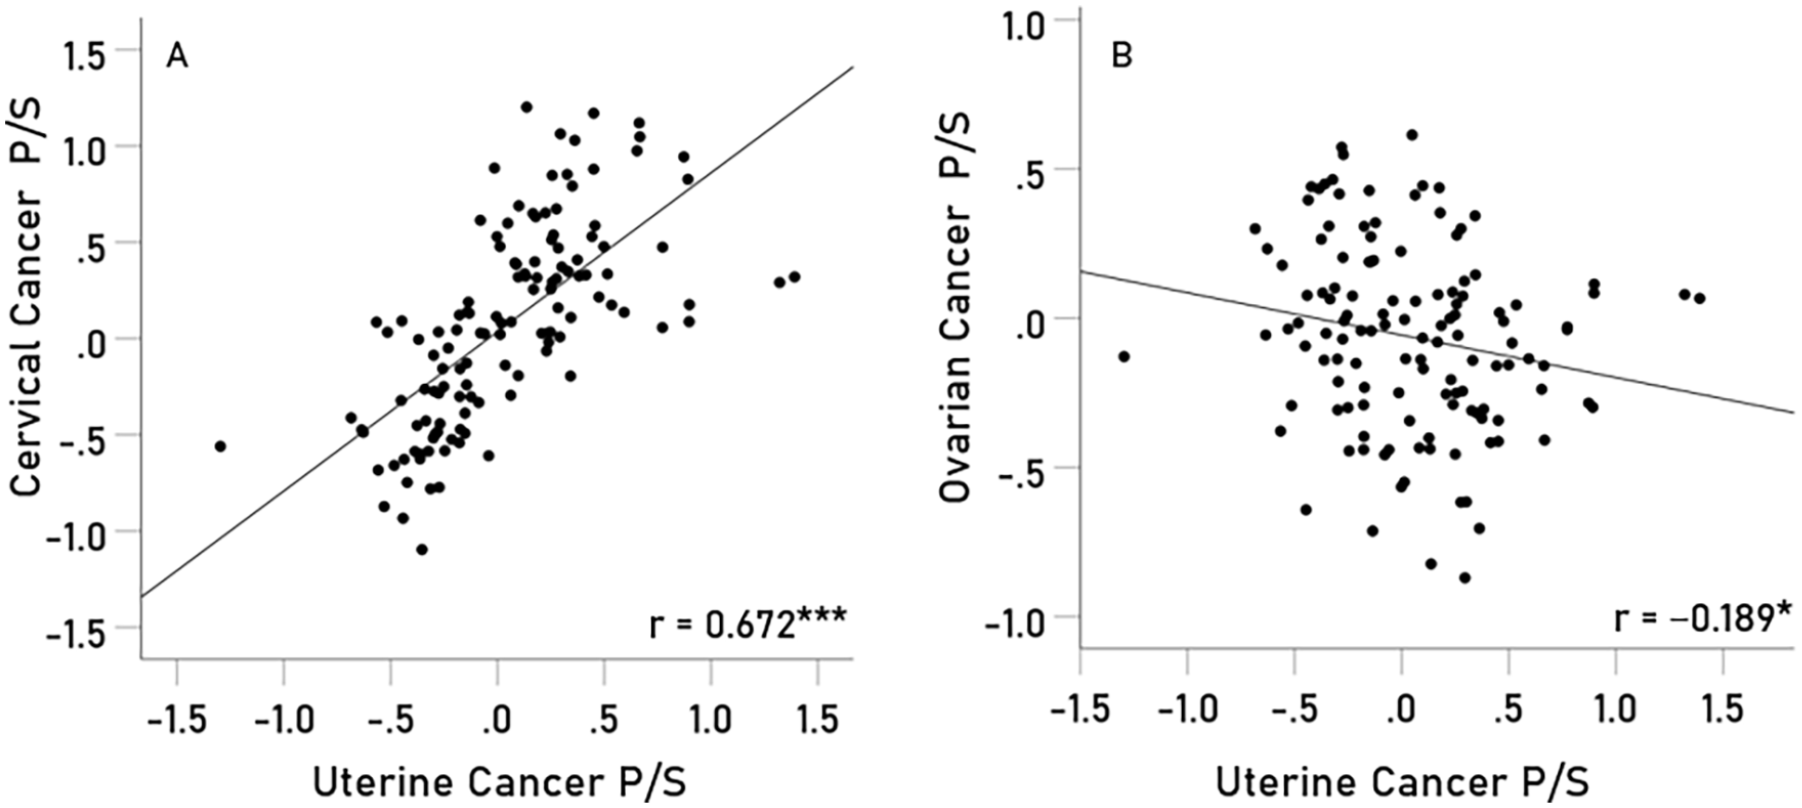
(A) cervical cancer P/S scores are plotted against uterine cancer P/S scores (P < .001); (B) ovarian cancer P/S scores are plotted against uterine cancer P/S scores (P = .033).
Factor analysis of cancer P/S scores
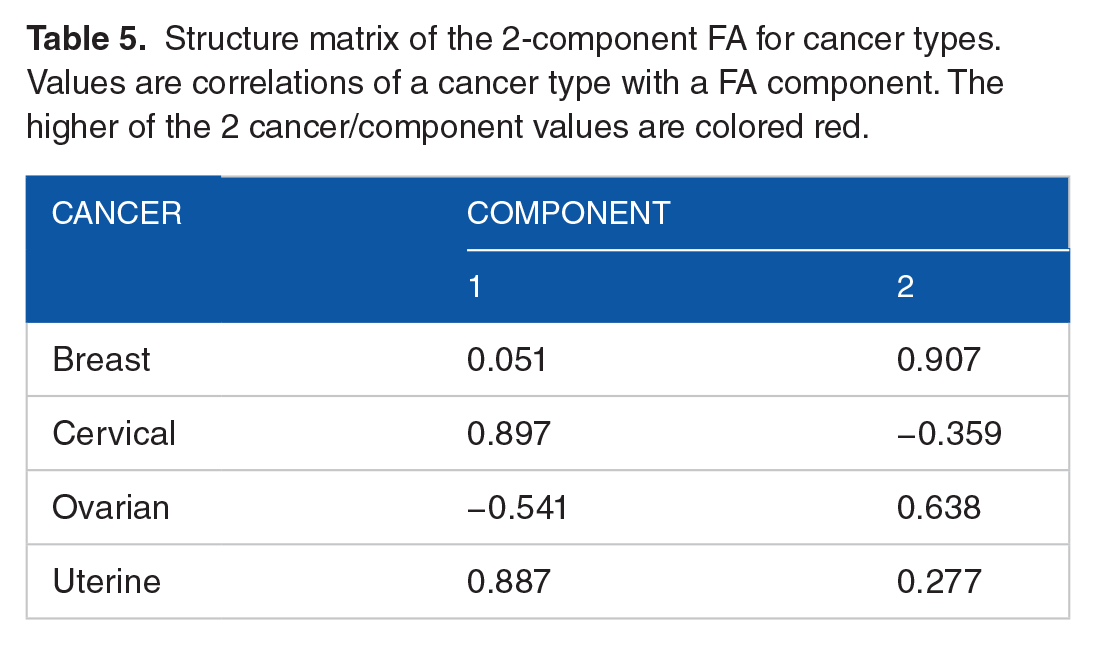
This FA yielded 2 components (with eigenvalue > 1) which explained (ie, accounted for) 82% of the variance (Table 4; Figure 8, scree plot). The correlation between the components was very low (r = −0.104). The specific assignment of the 4 cancer types to the 2 FA components was inferred from the FA structure matrix, which provides the correlations of between cancer type and FA component (Table 5). It can be seen that Cervical and Uterine cancers were primarily associated with Component 1, whereas Breast and Ovarian Cancers were primarily associated with Component 2. This is illustrated in the component plot of Figure 9, where it can be seen that Cervical and Uterine cancers project at high values on Component 1, whereas Breast and Ovarian cancers project highly on Component 2.
Total variance explained by components (groupings) of cancer type.

Structure matrix of the 2-component FA for cancer types. Values are correlations of a cancer type with a FA component. The higher of the 2 cancer/component values are colored red.

Scree plot of factor analysis of the 4 cancer P/S scores.

Component plot of factor analysis of the 4 cancer P/S scores. The first component (green cluster) comprised cervical and uterine cancers scores, and the second component (burnt orange cluster) comprises breast and ovarian scores.
Hierarchical clustering of cancer P/S scores
Hierarchical clustering yielded 2 separate clusters (Figure 10), one comprising breast and ovarian cluster, and the other comprising cervical and uterine cancers. This result is in keeping with the outcome of the factor analysis above.

Dendrogram of hierarchical clustering of the 4 cancer P/S scores to show the 2 separate cancer clusters.
Overall protective and susceptibility alleles
The last column in Appendix gives the count of protective P/S cancer scores for each allele. There were 14/127 (11.0%) with a protective effect for all 4 cancers (sum = 4) and 9/127 (7.1%) with a susceptibility effect for all 4 cancers (sum = 0). The distribution of protective and susceptibility proportions between the 2 HLA Classes (I and II; Appendix) is shown in Tables 6 and 7, respectively. The proportions of overall protective alleles did not differ significantly between the 2 HLA classes (Table 6). In contrast, overall susceptibility alleles were only found in HLA Class II, a highly significant difference in the proportions of the 2 classes (Table 7).
Proportions of protective alleles and associated statistics of comparison between the 2 HLA Classes.

Proportions of susceptibility alleles and associated statistics of comparison between the 2 HLA Classes.

Discussion
Here we evaluated the immunogenetic profiles of 4 women’s cancers and their associations to investigate shared influences of HLA on the prevalences of breast, ovarian, cervical, and uterine cancers. The findings, which extend the results of a recent HLA-cancer clustering study, 31 documented highly similar immunogenetic profiles for breast and ovarian cancers that were characterized by protective HLA effects as well as highly similar immunogenetic profiles for cervical and uterine cancers that were conversely characterized by susceptibility effects. The findings and their implications are discussed below.
Genetic associations between breast and ovarian cancers are well documented,23,40,41 with the BRCA1 and BRCA2 genes, in particular, having been implicated in both conditions.42 -44 Here we document that genetic similarities between breast and ovarian cancers extend beyond BRCA to include genes involved with the immune response to non-self antigens. Comparatively, little research has evaluated genetic associations between cervical and endometrial cancers. A recent study documented both novel and common pathogenetic patterns of gene expression in cervical and endometrial cancers 45 ; still others have documented highly distinct gene networks associated with cervical and endometrial cancers. 46 With regard to their HLA profiles, our findings demonstrated cervical and uterine cancers were highly similar to each other yet differed from the breast and ovarian cancer profiles. Across the 4 cancer types roughly 18% of HLA alleles were found to confer either universal protection or universal susceptibility for all 4 cancers with the remaining HLA alleles exerting mixed effects on cancer prevalences, indicating both shared and unique immunogenetic profiles for the 4 cancers.
Although this is the first study to evaluate the influence and overlap of a large number of HLA alleles on the prevalences of these 4 women’s cancers, previous studies have implicated HLA in each of the cancers investigated here. For instance, HLA has been linked to breast cancer protection versus susceptibility, 11 tumor progression and relapse, 12 response to chemotherapy14, and breast cancer survival. 15 Cohort, 10 meta-analytic,9,47 and genome-wide association studies 21 have consistently shown that HLA is associated with cervical cancer risk and protection. Furthermore, downregulation of certain HLA alleles have been associated with worse survival outcomes for patients with cervical cancer. 48 Similarly, HLA is associated with ovarian cancer risk 17 and prognosis49 -51 and with uterine cancer prognosis52,53 and survival. 18 Our study, which evaluated the influence of a large number of HLA alleles on the prevalences of breast, ovarian, cervical, and uterine cancers, adds to the body of literature implicating HLA in women’s cancers and expands the knowledge base by documenting immunogenetic overlap between breast-ovarian and cervical-uterine cancers. Since HLA has been implicated in immunotherapy outcomes of other types of cancer, 7 the present findings of shared versus unique HLA associations with each of the women’s cancers could have broader implications regarding effectiveness of widely used immunotherapies of breast and gynecological cancers.54,55 Future studies evaluating the association of protective/susceptibility HLA alleles identified in this epidemiological study with immunotherapy effectiveness and survival in women with breast and gynecological cancers are warranted, akin to previous studies documenting the influence of certain HLA on immunotherapy for melanoma. 7
Since foreign antigen elimination is the primary function of HLA, the present findings documenting highly similar HLA profiles for breast and ovarian cancers as well as cervical and uterine cancers suggest that each cancer pair may involve similar non-self antigens, such as neoantigens or viral oncoproteins. More than 20% of cancers are associated with a small number of infectious agents such as Epstein-Barr virus, human papillomaviruses, and Hepatitis B and C viruses. 56 Indeed, microbial infections have been implicated in breast cancer,57 -60 ovarian cancer,61,62 cervical cancer,63,64 and uterine cancer65,66 via 3 primary mechanisms including chronic inflammation resulting from persistent infection, direct virus-induced transformation of infected cells, and immunosuppression. 67 HLA is the most highly polymorphic region of the human genome; the interaction between host immunogenetics and microbial exposure is known to influence cancer proliferation as exemplified for cervical cancer.20,68,69
The present study documents immunogenetic associations of a large number of HLA alleles with 4 cancers that commonly occur in women and demonstrates similarities and differences in their immunogenetic profiles. The immunogenetic epidemiological approach here permits evaluation of the influence of a larger number of alleles on the prevalence of these cancers; however, the novel findings are not without limitation. First, the present analyses focused on Continental Western Europe. Since both HLA70,71 and the global distribution of cancers3,72 vary geographically, the immunogenetic profiles observed here may not generalize to other populations. Second, although we evaluated the influence of a large number of high-resolution HLA alleles on the prevalences of women’s cancers, analyses were limited to those alleles occurring in at least 9 of the 14 countries and, consequently, many HLA-cancer associations remain unknown. Finally, in light of the role of HLA in foreign antigen elimination, the findings point to the presence of similar non-self antigens among cancers that cluster together—that is, breast-ovarian and cervical-uterine—though the present analyses do not elucidate specific antigens that may be associated with a given cluster. Additional studies are warranted to identify antigens that may be associated with cancer clusters.
Footnotes
Appendix
Immunogenetic scores

| Index | Allele | Class | Breast | Cervical | Ovarian | Uterine | Frequency protective |
|---|---|---|---|---|---|---|---|
| 1 | A*01:01 | I | 0.0682 | −0.0045 | 0.0849 | −0.3682 | 2 |
| 2 | A*02:01 | I | 0.0863 | −0.7472 | 0.4408 | −0.4215 | 2 |
| 3 | A*02:05 | I | −0.0707 | 0.8271 | −0.2982 | 0.8924 | 2 |
| 4 | A*03:01 | I | 0.0415 | −0.9332 | 0.0767 | −0.4410 | 2 |
| 5 | A*11:01 | I | −0.0339 | 0.8475 | 0.0475 | 0.2571 | 1 |
| 6 | A*23:01 | I | −0.5190 | 1.2023 | −0.8233 | 0.1376 | 2 |
| 7 | A*24:02 | I | −0.1690 | −0.1386 | −0.3434 | 0.0374 | 3 |
| 8 | A*25:01 | I | −0.1882 | 0.1319 | 0.1941 | −0.1310 | 2 |
| 9 | A*26:01 | I | −0.3261 | 0.3851 | −0.1387 | 0.0894 | 2 |
|
|
|
|
|
|
|
|
|
| 11 | A*29:02 | I | −0.2099 | 0.6495 | −0.0800 | 0.1673 | 2 |
| 12 | A*30:01 | I | −0.0796 | 0.0086 | 0.1244 | 0.2932 | 1 |
| 13 | A*30:02 | I | −0.1136 | 0.5868 | 0.0186 | 0.4571 | 1 |
|
|
|
|
|
|
|
|
|
| 15 | A*32:01 | I | −0.0536 | 0.3201 | −0.0661 | 0.0981 | 2 |
| 16 | A*33:01 | I | −0.1179 | 1.0478 | −0.4084 | 0.6673 | 2 |
| 17 | A*33:03 | I | −0.0577 | 0.1224 | −0.4402 | −0.1773 | 3 |
| 18 | A*36:01 | I | −0.1961 | 0.6736 | −0.6164 | 0.2767 | 2 |
| 19 | A*68:01 | I | 0.3177 | −0.2731 | −0.2125 | −0.2957 | 3 |
| 20 | A*68:02 | I | −0.6692 | −0.1559 | 0.0099 | −0.2551 | 3 |
|
|
|
|
|
|
|
|
|
| 22 | B*08:01 | I | 0.2826 | −0.4515 | 0.2647 | −0.3752 | 2 |
| 23 | B*13:02 | I | −0.2549 | −0.2630 | 0.3088 | −0.3392 | 3 |
| 24 | B*14:01 | I | −0.2620 | 0.8800 | −0.4127 | 0.4512 | 2 |
| 25 | B*14:02 | I | −0.0230 | 0.9440 | −0.2843 | 0.8730 | 2 |
| 26 | B*15:01 | I | 0.0733 | −0.6248 | −0.1402 | −0.3615 | 3 |
| 27 | B*15:17 | I | 0.3409 | 0.0572 | −0.0377 | 0.7730 | 1 |
| 28 | B*15:18 | I | 0.1512 | −0.0188 | −0.2889 | 0.2404 | 2 |
| 29 | B*18:01 | I | −0.1000 | 0.2933 | 0.2787 | 0.2575 | 1 |
| 30 | B*27:02 | I | −0.0065 | −0.3878 | 0.4280 | −0.1509 | 3 |
|
|
|
|
|
|
|
|
|
| 32 | B*35:01 | I | 0.3931 | −0.1948 | 0.3434 | 0.3429 | 1 |
| 33 | B*35:02 | I | −0.2745 | 0.1594 | −0.2444 | 0.2845 | 2 |
| 34 | B*35:03 | I | −0.0644 | 0.2555 | 0.0793 | 0.1697 | 1 |
| 35 | B*35:08 | I | 0.1012 | 0.2156 | −0.0103 | 0.4761 | 1 |
| 36 | B*37:01 | I | 0.3337 | −0.6087 | 0.0589 | −0.0404 | 2 |
| 37 | B*38:01 | I | −0.2746 | 1.1706 | −0.3424 | 0.4513 | 2 |
| 38 | B*39:01 | I | 0.1481 | 0.2578 | −0.4555 | 0.2504 | 1 |
| 39 | B*39:06 | I | 0.1202 | −0.3322 | 0.0137 | −0.0864 | 2 |
| 40 | B*40:01 | I | 0.2049 | −0.7800 | 0.1013 | −0.3123 | 2 |
|
|
|
|
|
|
|
|
|
| 42 | B*41:01 | I | −0.0880 | −0.1925 | 0.4442 | 0.0984 | 2 |
| 43 | B*41:02 | I | −0.2421 | 0.5291 | −0.5649 | −0.0014 | 3 |
| 44 | B*44:02 | I | −0.4169 | 0.0851 | −0.3782 | −0.5653 | 3 |
| 45 | B*44:03 | I | −0.3159 | 0.6897 | −0.1690 | 0.1009 | 2 |
| 46 | B*44:05 | I | 0.1509 | 0.3244 | −0.4377 | 0.1326 | 1 |
| 47 | B*45:01 | I | −0.0447 | 0.3932 | −0.4343 | 0.0827 | 2 |
| 48 | B*47:01 | I | −0.2259 | 0.1892 | −0.7129 | −0.1351 | 3 |
| 49 | B*49:01 | I | −0.0810 | 1.1198 | −0.1589 | 0.6643 | 2 |
| 50 | B*50:01 | I | −0.3562 | 1.0296 | −0.7044 | 0.3630 | 2 |
| 51 | B*51:01 | I | 0.0119 | 0.3352 | −0.0829 | 0.5160 | 1 |
| 52 | B*52:01 | I | −0.2397 | −0.2411 | 0.1896 | −0.1432 | 3 |
| 53 | B*55:01 | I | 0.3238 | −0.1276 | 0.2732 | −0.1435 | 2 |
| 54 | B*56:01 | I | −0.0067 | −0.6273 | 0.3963 | −0.4359 | 3 |
| 55 | B*57:01 | I | −0.1046 | 0.0449 | −0.0411 | −0.1895 | 3 |
| 56 | B*58:01 | I | 0.0338 | 0.0275 | −0.2544 | 0.2081 | 1 |
| 57 | C*01:02 | I | −0.0817 | −0.4852 | 0.5731 | −0.2797 | 3 |
| 58 | C*03:03 | I | 0.2503 | −0.7727 | 0.5486 | −0.2720 | 2 |
| 59 | C*04:01 | I | −0.1714 | 0.4089 | −0.3353 | 0.3750 | 2 |
| 60 | C*05:01 | I | −0.2268 | 0.0289 | −0.0214 | −0.0781 | 3 |
| 61 | C*06:02 | I | 0.0664 | 0.4785 | −0.5491 | 0.0124 | 1 |
| 62 | C*07:01 | I | 0.3642 | −0.4920 | 0.1891 | −0.1513 | 2 |
| 63 | C*07:02 | I | 0.3829 | −0.5855 | 0.4647 | −0.3218 | 2 |
| 64 | C*07:04 | I | −0.1306 | 0.0916 | −0.6418 | −0.4463 | 3 |
| 65 | C*12:02 | I | −0.0491 | 0.0293 | 0.0875 | 0.2385 | 1 |
| 66 | C*12:03 | I | −0.0499 | 0.4776 | −0.1563 | 0.4993 | 2 |
| 67 | C*14:02 | I | −0.0058 | 0.3308 | −0.4169 | 0.4151 | 2 |
| 68 | C*15:02 | I | −0.1914 | 0.3715 | −0.6150 | 0.3020 | 2 |
| 69 | C*16:01 | I | −0.4252 | 0.5390 | −0.0574 | 0.2627 | 2 |
| 70 | DPB1*01:01 | I | −0.1029 | −0.5867 | 0.4343 | −0.3853 | 3 |
| 71 | DPB1*02:01 | II | 0.2341 | 0.4746 | −0.0294 | 0.7737 | 1 |
| 72 | DPB1*02:02 | II | −0.2530 | 0.6329 | 0.3532 | 0.1798 | 1 |
|
|
|
|
|
|
|
|
|
|
|
|
|
|
|
|
|
|
|
|
|
|
|
|
|
|
|
| 76 | DPB1*05:01 | II | 0.0730 | −0.4967 | 0.4166 | −0.2908 | 2 |
| 77 | DPB1*06:01 | II | −0.0538 | 0.0241 | −0.4405 | −0.0594 | 3 |
|
|
|
|
|
|
|
|
|
| 79 | DPB1*10:01 | II | 0.3635 | 0.3483 | −0.1412 | 0.3317 | 1 |
| 80 | DPB1*11:01 | II | −0.3943 | 0.5992 | 0.6143 | 0.0492 | 1 |
| 81 | DPB1*13:01 | II | 0.3106 | 0.1364 | −0.0421 | −0.1421 | 2 |
| 82 | DPB1*14:01 | II | −0.1016 | 0.0219 | −0.0042 | 0.0135 | 2 |
|
|
|
|
|
|
|
|
|
| 84 | DPB1*19:01 | II | 0.2628 | −0.1562 | 0.3078 | −0.1743 | 2 |
| 85 | DQB1*02:01 | II | −0.1174 | 0.1140 | 0.2243 | −0.0036 | 2 |
| 86 | DQB1*02:02 | II | −0.4133 | 0.3157 | −0.0243 | 0.1855 | 2 |
| 87 | DQB1*03:01 | II | 0.2102 | 0.5132 | −0.2508 | 0.2546 | 1 |
| 88 | DQB1*03:02 | II | 0.0573 | −0.2945 | 0.4129 | 0.0631 | 1 |
|
|
|
|
|
|
|
|
|
|
|
|
|
|
|
|
|
|
|
|
|
|
|
|
|
|
|
|
|
|
|
|
|
|
|
|
|
|
|
|
|
|
|
|
|
| 94 | DQB1*06:01 | II | 0.1675 | −0.0495 | 0.0747 | −0.2295 | 2 |
| 95 | DQB1*06:02 | II | −0.1960 | −0.6831 | 0.1775 | −0.5573 | 3 |
| 96 | DQB1*06:03 | II | −0.4678 | 0.0327 | −0.2927 | −0.5135 | 3 |
|
|
|
|
|
|
|
|
|
| 98 | DQB1*06:09 | II | 0.2155 | 0.3254 | −0.3044 | 0.3827 | 1 |
| 99 | DRB1*01:01 | II | −0.0309 | −0.5995 | 0.4502 | −0.3583 | 3 |
| 100 | DRB1*01:02 | II | −0.3273 | 1.0634 | −0.8697 | 0.2957 | 2 |
| 101 | DRB1*01:03 | II | −1.0619 | 0.6142 | −0.4573 | −0.0791 | 3 |
|
|
|
|
|
|
|
|
|
| 103 | DRB1*04:01 | II | −0.3189 | −0.4868 | 0.2328 | −0.6270 | 3 |
| 104 | DRB1*04:02 | II | −0.0168 | 0.9755 | −0.2380 | 0.6540 | 2 |
| 105 | DRB1*04:03 | II | −0.1294 | 0.4701 | 0.0743 | 0.2855 | 1 |
| 106 | DRB1*04:04 | II | −0.0165 | −0.4275 | 0.0645 | −0.3340 | 3 |
|
|
|
|
|
|
|
|
|
| 108 | DRB1*04:07 | II | −0.3512 | 0.6529 | −0.0009 | 0.2255 | 2 |
|
|
|
|
|
|
|
|
|
| 110 | DRB1*07:01 | II | −0.3527 | 0.8858 | −0.2497 | −0.0131 | 3 |
|
|
|
|
|
|
|
|
|
| 112 | DRB1*08:03 | II | 0.1138 | −0.0867 | −0.3072 | −0.2980 | 3 |
|
|
|
|
|
|
|
|
|
| 114 | DRB1*10:01 | II | 0.2315 | −0.0646 | −0.2056 | 0.2304 | 2 |
| 115 | DRB1*11:01 | II | 0.4058 | 0.1362 | −0.1356 | 0.5938 | 1 |
| 116 | DRB1*11:02 | II | −0.2805 | 0.7924 | −0.3173 | 0.3513 | 2 |
| 117 | DRB1*11:03 | II | 0.0078 | 0.5301 | −0.1595 | 0.4432 | 1 |
|
|
|
|
|
|
|
|
|
| 119 | DRB1*12:01 | II | −0.0215 | −0.3028 | 0.3201 | −0.1222 | 3 |
| 120 | DRB1*13:01 | II | −0.1226 | 0.0345 | −0.0697 | −0.2751 | 3 |
| 121 | DRB1*13:02 | II | −0.2663 | −0.2843 | 0.2035 | −0.2740 | 3 |
| 122 | DRB1*13:03 | II | −0.3729 | 0.8524 | −0.3095 | 0.3273 | 2 |
| 123 | DRB1*13:05 | II | −0.1895 | 0.3362 | −0.4014 | 0.1279 | 2 |
| 124 | DRB1*14:01 | II | −0.0164 | 0.0800 | −0.1359 | 0.0189 | 2 |
| 125 | DRB1*15:01 | II | −0.3570 | −0.4118 | 0.2998 | −0.6837 | 3 |
| 126 | DRB1*15:02 | II | −0.1083 | 0.0867 | 0.0570 | 0.0654 | 1 |
|
|
|
|
|
|
|
|
|
Funding:
The author(s) disclosed receipt of the following financial support for the research, authorship, and/or publication of this article: Partial funding for this study was provided by the University of Minnesota (the Anita Kunin Chair in Women’s Healthy Brain Aging, the Brain and Genomics Fund, the McKnight Presidential Chair of Cognitive Neuroscience, and the American Legion Brain Sciences Chair) and the U.S. Department of Veterans Affairs. The sponsors had no role in the current study design, analysis or interpretation, or in the writing of this paper. The contents do not represent the views of the U.S. Department of Veterans Affairs or the United States Government.
Declaration of Conflicting Interests:
The author(s) declared no potential conflicts of interest with respect to the research, authorship, and/or publication of this article.
Author Contributions
LMJ extracted cancer prevalences and populations data. APG extracted allele frequencies and performed data analysis. LMJ and APG wrote and reviewed the paper.
Ethical Approval
This article does not contain any studies with human participants performed by any of the authors.
Data Availability
All data used were retrieved from freely accessible websites, as mentioned in Methods, and, as such, are publicly and freely available. Specifically:
Global Burden of Disease Collaborative Network. Global Burden of Disease Study 2016 (GBD 2016) Results. Seattle, United States: Institute for Health Metrics and Evaluation (IHME), 2020. Available from http://ghdx.healthdata.org/gbd-results-tool (2016). Data retrieved July 5, 2021. Population Reference Bureau. 2016 world population data sheet with a special focus on human needs and sustainable resources. Population Reference Bureau, Washington, DC, 2016. https://www.prb.org/2016−world−population−data−sheet/ (2016). Accessed February 5, 2019. Gonzalez−Galarza, F. F., Christmas, S., Middleton, D., & Jones, A. R. Allele frequency net: a database and online repository for immune gene frequencies in worldwide populations. Nucleic Acid Res. Allele*Frequencies in Worldwide Populations. Allele frequency net database (AFND) 2020 update. Liverpool, UK. Available from: http://allelefrequencies.net/hla6006a.asp (2020).