
Abstract
Objectives:
Immunogenic cell death (ICD) has been demonstrated to play a critical role in the development and progression of malignant tumors by modulating the anti-tumor immune response. However, its function in cervical cancer (CC) remains largely unexplored. In this study, we aimed to construct an ICD-related gene signature to predict patient prognosis and immune cell infiltration in CC.
Methods:
The gene expression profiles and clinical data of CC were downloaded from The Cancer Genome Alas (TCGA) and Gene Expression Omnibus (GEO) datasets, serving as the training and testing groups, respectively. An ICD-related gene signature was developed using the LASSO-Cox model. The expression levels of the associated ICD-related genes were evaluated using single-cell data, CC cell lines, and clinical samples in vitro.
Results:
Two ICD-associated subtypes (cluster 1 and cluster 2) were identified through consensus clustering. Patients classified into cluster 2 demonstrated higher levels of immune cell infiltration and exhibited a more favorable prognosis. Subsequently, an ICD-related gene signature comprising 3 genes (IL1B, IFNG, and FOXP3) was established for CC. Based on the median risk score, patients in both training and testing cohorts were segregated into high-risk and low-risk groups. Further analyses indicated that the estimated risk score functioned as an independent prognostic factor for CC and influenced immune cell abundance within the tumor microenvironment. The up-regulation of the identified ICD-related genes was further validated in CC cell lines and collected clinical samples.
Conclusion:
In summary, the stratification based on ICD-related genes demonstrated strong efficacy in predicting patient prognosis and immune cell infiltration, which also provides valuable new perspectives for the diagnosis and prognosis of CC.
Introduction
Cervical cancer (CC) still remains one of the highly lethal diseases, which results in approximately 604 000 new cases and 342 000 fatal deaths worldwide annually in 2020.1,2According to the National Comprehensive Cancer Network (NCCN) guidelines, radical surgical and adjuvant chemotherapy or radiotherapy remains the main treatment options for CC. 3 However, the long-term prognosis of advanced CC receiving traditional treatments is far from satisfactory, with a 5-year survival rates of less than 20%.4 -6 Therefore, it is urgent to explore the pathogenesis of CC, and identify more specific and effective interventions to prevent and treat CC.
CC is the only malignancy with definite etiology: persistent human papillomaviruses (HPV) infections. Nearly all cases of CC are attributed to HPV.7,8 Studies have shown that HPV-related oncoproteins, E6 and E7, play critical roles in regulating the immune environment of HPV-associated malignancies.9,10 Furthermore, HPV-positive patients with head and neck tumors exhibited more favorable prognoses following immunotherapy compared to their HPV-negative counterparts. 11 Immunotherapy has brough new hope for the treatment of advanced or recurrent CC; however, its overall response rate remains disappointingly low. 12 Given the complex tumor microenvironment characteristic of HPV-related CC,13,14 it is essential to identify novel targets involved in immune remodeling to enhance treatment efficacy and improve response rate.
Immunogenic cell death (ICD) represents a novel form of cell death characterized by tumor cells undergoing external stimulation, which not only causes their demise but also transitions them from a non-immunogenic to an immunogenic state, thereby mediating an anti-tumor immune response.15,16 During ICD in tumor cells, a cascade of signaling molecules, collectively known as damage-associated molecular patterns (DAMP), is generated. These include calreticulin, high mobility group protein 1 (HMGB1), ATP molecules, and heat shock proteins (HSP70, HSP90). The DAMPs released during the ICD process bind to pattern recognition receptors (PRRs) located on the surface of dendritic cells, triggering a series of downstream cellular reactions that eventually activate both innate and adaptive immune responses. 17 As a stress response that is inducible in tumor cells, ICD can be initiated by a variety of clinical drugs, such as doxorubicin, anthracycline, idarubicin, bleomycin. These agents have been shown to reliably induce genuine ICD and influence tumor therapy outcomes.18 -20 However, the role of ICD in CC remains poorly understood, warranting further investigation.
In this study, we aimed to develop an ICD-related gene signature with strong predictive capabilities for patient prognosis and immune cell infiltration in CC, while also identifying novel therapeutic targets. To accomplish this, we first analyzed the expression profiles of specific ICD-related genes and stratified CC patients from The Cancer Genome Alas (TCGA) database using consensus clustering. Next, we constructed an ICD-related gene signature comprising 3 key genes (IL1B, IFNG, and FOXP3) through the LASSO-Cox model, which demonstrated its effectiveness in predicting both patient survival and immune cell infiltration. Lastly, we validated the expression levels of these 3 hub genes using single-cell sequencing data and experimental approaches, including analyses on CC cell lines and collected clinical samples.
Materials and Methods
Bioinformatics
Data source and processing
The copy number variations (CNV), gene expression profiles and clinical information for CC were downloaded from the TCGA database (http://portal.gdc.cxancer.gov/). In total, 304 primary CC samples were analyzed in this study. To validate our findings externally, transcriptome and clinical data from 300 CC patients were retrieved from the Gene Expression Omnibus (GEO, accession: GSE44001) database (http://www.ncbi.nlm.nih.gov/geo/). Accordingly, 40 ICD-related genes were identified from previously published studies.21 -25 Clinical information, including factors such as age, stage, grade, pathological types, and survival status, from the TCGA cohort was presented in Supplemental Table 1, while clinical details such as stage and survival status from the GSE44001 cohort were shown in Supplemental Table 2.
Mutation analysis
The circus plot was utilized to visualize the frequency of CNV, including both gains or deletions, across 40 ICD-related genes in CC. 26 The tumor mutation burden (TMB) distribution was analyzed using the “Maftools” R package, which provided detailed data on mutation frequency, mutation types, and TMB scores. 27
Analyses of tumor microenvironment
The proportions of 22 immune cell types in the CC samples were calculated using the “CIBERSORT” R package. 28 The ImmuneScore, StromalScore, ESTIMATEScore and TumorPuritry were determined with the “ESTIMATE” R package. 29
Consensus clustering
Consistency clustering is a resampling-based unsupervised classification method used to identify subgroups within a dataset and validate clustering results. To uncover distinct molecular subtypes based on the proportions of 22 immune cell types, the “ConsensusClusterPlus” R package was utilized. This tool grouped samples into 2 clusters, labeled as cluster 1 and cluster 2, with parameters configured for 1000 replicates (reps = 1000) and a resampling rate of 80% (pItem = 0.8). 30 The cluster number (k) was tested across a range from 2 to 10, with the optimal k determined by analyzing the cumulative distribution function (CDF).
Differentially expressed genes (DEGs) between immune subtypes
The expression levels of the 3 identified hub genes in CC were analyzed using the GEPIA database. 31 The “limma” R package was applied to identify DEGs between cluster 1 and cluster 2. 32 The thresholds were settled as follows: fold change (FC) ⩾1.2, and an adjusted P-value < .05. Gene Ontology (GO) and Kyoto Encyclopedia of Genes and Genomes (KEGG) enrichment analyses were conducted through the online platform Metascape (https://metascape.org/gp/index.html/main/step1). 33
Identification of gene consensus modules and hub genes
We employed weighted gene co-expression network analysis (WGCNA) to construct consensus gene modules for DEGs, and examined their correlation with 22 immune cell types.34,35 Gene significance (GS) was defined as the p-value derived from the linear regression analysis of gene expression and corresponding scores, while module membership (MM) served as a measure of the connectivity between specific genes and their respective modules. To pinpoint immune-related hub genes, we focused on the 3 modules exhibiting the highest correlation coefficients. Within these modules, genes meeting the criteria of |GS| ⩾ 0.2 and |MM| ⩾ 0.5 were identified and selected as hub genes.
Construction and validation of the ICD-related prognostic model
The ICD-related hub genes were utilized for constructing the ICD-related prognostic model. The LASSO-Cox model, along with multivariate Cox regression, was applied to select the modeling genes and calculate their respective regression coefficients.
36
The risk score for each sample was calculated using the following formula: Risk Score =
Single-cell data acquisition and processing process
The single-cell sequencing data for CC was downloaded from the GSA-Human database (https://ngdc.cncb.ac.cn/gsa-human/; ID: subHRA005765). This dataset comprised 20 CC samples, including 5 normal cervix samples, 4 high-grade intraepithelial neoplasia samples, 5 microinvasive carcinoma samples, and 6 invasive cervical squamous carcinoma samples). 38 The “Seurat” (version 4.3.0) R package was used to process all cells. Initially, cells with fewer than 50 detected genes or a mitochondrial gene ratio exceeding 7% were filtered out. Next, the data was normalized, scaled, and subjected to dimensionality reduction using UMAP through PCA. Finally, cell annotations were assigned based on canonical gene expression profiles with the aid of the “singleR” package.
Experimental methods
Collection of clinical CC samples
This study was approved by the Ethics Committee of the First Affiliated Hospital of Zhengzhou University (permission number: 2023-KY-0551). Tumor tissues and adjacent normal tissue were obtained from patients diagnosed with CC by a pathologist, and stored at −800C refrigerator for subsequent RNA and protein extraction.
Culture of CC cell lines
CC cell lines (SiHa, HeLa, Caski, C33A, ME180), along with the normal epithelial cell line (HcerEpic), were obtained from the American Type Culture Collection (ATCC). These cell lines were cultured in complete Dulbecco’s Modified Eagle Medium (DMEM), supplemented with 10% fetal bovine serum (FBS) and 1% penicillin-streptomycin (Gibco, 24215140163). The cultures were maintained at 370C in a humidified incubator with 5% CO2.
Western blotting (WB)
CC tissue, RIPA lysate (CAT # P0013B, Beyotime) containing 1% PMSF (CAT # P8340, Solarbio), and magnetic beads were placed into a 1.5 mL centrifuge tube and processed in a tissue grinder at a frequency of 70 Hz for 1 minute, repeated 3 times. The tissue grinding solution was repeatedly mixed using a pipette, lysed on ice for 30 minutes, and further disrupted using an ultrasonic instrument. Subsequently, the mixture was centrifugated at 40C with at 12 000 rpm for 20 minutes. The supernatant was carefully transferred to a new EP tube, and the protein concentration was measured using the BCA assay kit. The proteins were separated by electrophoresis on a gel under a constant voltage of 120 V for approximately 1.5 hours. They were then transferred onto a 0.22 μm PVDF membrane using a constant current of 280 mA for around 2 hours. The PVDF membrane was blocked at room temperature for 1 hour using 5% skim milk and incubated with the primary antibody at 40C overnight. Following incubation, the membrane was washed with 3 times with PBST and then incubated with the secondary antibody at room temperature for 1 hour. Images were captured using a gel imaging analyzer (CAT# A44240, Thermo Fisher Scientific). Details of the antibodies used were as follows: GAPDH (1:1000, CAT# BM3896, BOSTER), IL-1β (1:2000, CAT# 66737-1-IG, Proteintech), and anti-mouse IgG HRP-linked secondary antibody (1:1000, CAT#BA1031, BOSTER).
RNA extraction, cDNA synthesis, and real-time quantitative polymerase chain reaction (qRT-PCR)
Total RNA from CC tissues or cell lines was extracted using Trizol reagent (Invitrogen, CAT#15596026). Specifically, 1 mL of TRIzol lysis buffer was added to the samples following cell precipitation or tissue grinding. The mixture was thoroughly homogenized with a pipette and left to lyse at room temperature for 5 minutes. Subsequently, 200 μL of chloroform was added to each EP tube, and the mixture was allowed to stand on ice for 5 minutes. The tubes were then centrifuged at 12 000 rpm for 20 minutes. The upper aqueous phase (targeted RNA solution) was carefully transferred to a new 1.5 mL EP tube, followed by the addition of an appropriate volume of isopropanol. The mixture was thoroughly combined and left on ice for 10 minutes. Afterward, the solution was centrifuged again at 12 000 rpm for 20 minutes. The supernatant was discarded, and 1 mL of pre-chilled 75% ethanol was added to gently rinse the RNA pellet. After a final round of centrifugation, the pellet was air-dried at room temperature, and dissolved in the appropriate volume of DEPC-treated water. RNA concentration was then measured. cDNA synthesis was performed using a reverse transcription kit (CAT#K1622, Thermo Fisher Scientific) in accordance with the manufactures’ protocol. The expression levels of targeted genes were measured by qRT-PCR using a SYBR Green kit (CAT#4309155, Thermo Fisher Scientific), with GAPDH serving as the internal reference gene. The primers sequences for the targeted genes were as follows:
(1) IL1B-F: CCACAGACCTTCCAGGAGAATG; IL1B-R: GTGCAGTTCAGTGATCGTACAGG.
(2) FOXP3-F: GGCACAATGTCTCCTCCAGAGA; FOXP3-R: CAGATGAAGCCTTGGTCAGTGC.
(3) IFNG-F: GAGTGTGGAGACCATCAAGGAAG; IFNG-R: TGCTTTGCGTTGGACATTCAAGTC.
Statistical analysis
For between-group comparisons, unpaired Student’ t-tests were used to calculate p-values. To account for multiple testing in different expression analysis, the false discovery rate (FDR) method was applied to adjust the p-values. Survival curves were generated using the Kaplan-Meier method, and the log-rank test was employed to assess the significance of observed differences. The “survival” and “survminer” R packages were utilized to create the survival curves. P-values below .05 were considered statistically significant.
Result
The landscape of ICD-related genes in CC samples
Base on previous literature and studies, 40 ICD-related genes were included in our analysis. Among these, 4 genes (NLPR3, CD8A, CD8B, and PIK3CA) exhibited copy number amplifications, while 4 other genes (CASP8, MYD88, CASP1, and HMGB1) displayed copy number deletions (Figure 1A). Mutations in the ICD-related genes were identified in 46.69% (134 out of 287) of the samples, with PIK3CA showing the highest mutation frequency (28%; Figure 1B). The predominant category of mutations observed in the ICD-related genes was missense mutations. Furthermore, when we analyzed expression differences of ICD-related genes between tumor and normal tissues in the TCGA cohort, 21 genes were found to be differentially expressed (Figure 1C).

Identification of ICD-associated subtypes via consensus clustering. (A) Circus plots displayed the CNVs of 40 ICD-related genes across human chromosomes. (B) Somatic mutations of 40 ICD-related genes in 287 CC patients. (C) Heatmap displayed the differential expression of 40 ICD-related genes in tumor versus normal tissues. Red asterisks indicate high expression in tumor tissues, while green asterisks denote low gene expression in tumors. (D and E) Consensus clustering analysis based on CIBERSORT results (k = 2). (F) Survival analysis comparing cluster 1 and cluster 2. (G) Volcano plot depicting the DEGs between cluster 1 and cluster 2 (FC ⩾ 1.2 and adjusted P < .05). (H and I) Enrichment analyses of up-regulated down-regulated genes between cluster 1 and cluster 2, respectively. Dot size represents the gene count, while dot color corresponds to dot the -log 10 (P-value).
Clustering based on the results of CIBERSORT
We analyzed the proportions of 22 immune cell types in tumor tissues using the CIBERSORT algorithm. Based on these findings, a consensus clustering analysis was conducted, identifying the optimal clustering value as k = 2 (Figure 1D and E). Consequently, the 304 CC samples were categorized into 2 distinct clusters. A significant difference in survival status was observed between the 2 clusters, with patients in cluster 1 exhibiting a poorer prognosis compared to those in cluster 2 (P = .0065; Figure 1F).
To pinpoint the key genes driving the prognostic differences between cluster 1 and cluster 2, we performed a differential expression analysis. A total of 3108 DEGs were identified, comprising 1986 up-regulated genes and 1122 down-regulated genes in cluster 1 compared to cluster 2. The threshold for inclusion was set at a fold change (FC) ⩾1.2, P-adj < .05 (Figure 1G, and Supplemental Table 3). To gain further insights into the functional roles of these DEGs, we performed functional enrichment analyses. Our findings revealed that the up-regulated genes were enriched in certain cancer-related pathways, such as extracellular matrix organization, response to growth factors, and positive regulation of cell migration. In contrast, the down-regulated genes were enriched in immune-related pathways, including leukocytes activation, immune effector processes, MHC protein binding (Figure 1H and I). These results indicated that the identified DEGs played a crucial role in the progression of CC by reshaping the tumor microenvironment.
Differences of immunocytes infiltration between cluster 1 and cluster 2
The proportion of each immune cell in the CC samples was illustrated in Figure 2A. A comparison between cluster 1 and cluster 2 revealed notable differences: the proportions of naïve B cells, resting CD4+ memory T cells, M0 macrophages, activated dendritic cells, activated mast cells, and neutrophils were significantly higher in cluster 1. In contrast, cluster 2 exhibited elevated proportions of CD8+ T cells, activated CD4+ memory T cells, follicular helper T cells, gamma delta T cells, M1 macrophages and resting mast cells (Figure 2B). Subsequently, we assessed the immune cell infiltration score for each patient using the ESTIMATE algorithm (Figure 2C). Significant disparities were observed in immune scores, ESTIMATE scores and tumor purity between the 2 clusters (Figure 2D-G). Specifically, tumor purity was markedly higher in cluster 1, whereas cluster 2 samples contained a greater abundance of immune cells and stromal cells. This suggested that patients in cluster 2 possess a more intricate tumor microenvironment, characterized by complex regulation. As a result, these patients may exhibit reduced sensitivity to conventional treatments such as chemotherapy, but could potentially benefit more from immunotherapy methods.39,40

Differences in immune cell infiltration between cluster 1 and cluster 2. (A) The estimated proportions of 22 common immune cell types in each CC patient using the “ConsencesclusterPlus” R package. (B) A Comparison of the estimated proportions of the 22 immune cell types between cluster 1 and cluster 2. (C) The estimated scores of StromalScore, ImmuneScore, TumorPuritry, and ESTIMATEScore for each CC patient in cluster 1 and cluster 2, determined using the ESTIMATE algorithm. (D-G) Comparisons of the StromalScore, ImmuneScore, TumorPuritry, and ESTIMATEScore between cluster 1 and cluster 2, respectively. (H-K) Differential expression levels of common immune checkpoints, MHC molecules, chemokines, and chemokine receptors between cluster 1 and cluster 2, respectively.
We further analyzed the differences in the expression of immune checkpoints, MHC molecules, chemokines and chemokine receptors between cluster 1 and cluster 2, as these elements play crucial roles in remodeling the tumor microenvironment. As illustrated in Figure 2H to K, the immune checkpoints, MHC molecules, chemokines and chemokine receptors were consistently expressed at significantly higher levels in cluster 2.
The identification of key modules and immune-related hub genes by WGCNA
To further refine the DEGs associated with immune cells, we constructed co-expressed gene networks to pinpoint key immune-related gene modules using WGCNA. A power index of 4 was chosen as the soft threshold (Figure 3A and B). In total, 10 modules were identified, with the gray module exhibiting the strongest correlation with the M0 macrophages score and activated mast cells score, while the blue module displayed the highest correlation with the CD8 T cells score (Figure 3C and D). For subsequent analysis, we selected genes meeting the criteria with |GS| ⩾ 0.2 and |MM| ⩾ 0.5 within these 2 modules. Ultimately, 595 hub genes closely associated with immune cells were identified.

WGCNA of the identified DEGs between cluster 1 and cluster 2. (A and B) Determination of the threshold value based on scale independence and mean connectivity, respectively. (C) A dendrogram of the identified DEGs, where each branch represents a single gene, and the colors below correspond to distinct one co-expression modules. (D) A heatmap depicted the correlation between gene modules and 22 immune cell types. Each cell’s correlation coefficient indicates the strength of the associations between a specific gene module and one of the 22 commonly observed immune cells.
Construction of the ICD-related prognostic model for CC
Among the 595 hub genes identified through WGCNA, 10 genes were found to be ICD-related (Figure 4A). Using LASSO-Cox regression, we developed a prognostic risk model based on these 10 ICD-related hub genes. Ultimately, 3 genes (IL1B, FOXP3, and IFNG) were selected to construct the prognostic risk model (λ = 0.01585587; Figure 4B and C). The coefficient for each gene was determined through multivariate Cox regression, yielding the following 3-gene signature: Risk Score = 0.3712*ExpIL1B− 0.3955*ExpFOXP3 − 0.20711*ExpIFNG. Using this formula, we calculated the risk score for each patient and categorized all patients into high- and low-risk groups based on the average score (Figure 4D). The distribution of clinical features, such as treatments, pathological types, grade, stage, age across the 2 risk groups in the TCGA cohort was displayed in Supplemental Figure 1. Notably, patients with a more advanced stage (P = .041) or younger age (<60 years, P = .039) had significantly higher risk scores (Supplemental Figure 2). Kaplan-Meier survival curves demonstrated significant differences between the 2 groups, indicating that high-risk group had a worse prognosis (Figure 4E). Additionally, the ROC curves confirmed the models’ sensitivity and specificity, with AUC values of 0.873, 0.794, 0.703, and 0.692 for 1-, 2-, 3-, 5-year survival, respectively (Figure 4F). To further validate the model’s reliability, we conducted PCA, which effectively separated the high- and low-risk groups (Figure 4G). A nomogram was also created to provide a straightforward tool for estimating patient survival rates based on the risk score, achieving a C-index of 0.744 (Figure 4H). The calibration curves demonstrated that the predicted survival probabilities at 1-,3-,5-year interval closely aligned with the observed survival rates in our cohorts (Figure 4I). Finally, univariate (HR = 2.59, 95%CI: 1.83-3.66, P < .00001) and multivariate (HR = 2.59, 95%CI: 1.79-3.88, P < .00001) Cox regression analyses confirmed that the risk score serves as an independent prognostic factor for overall survival (Figure 4JK).
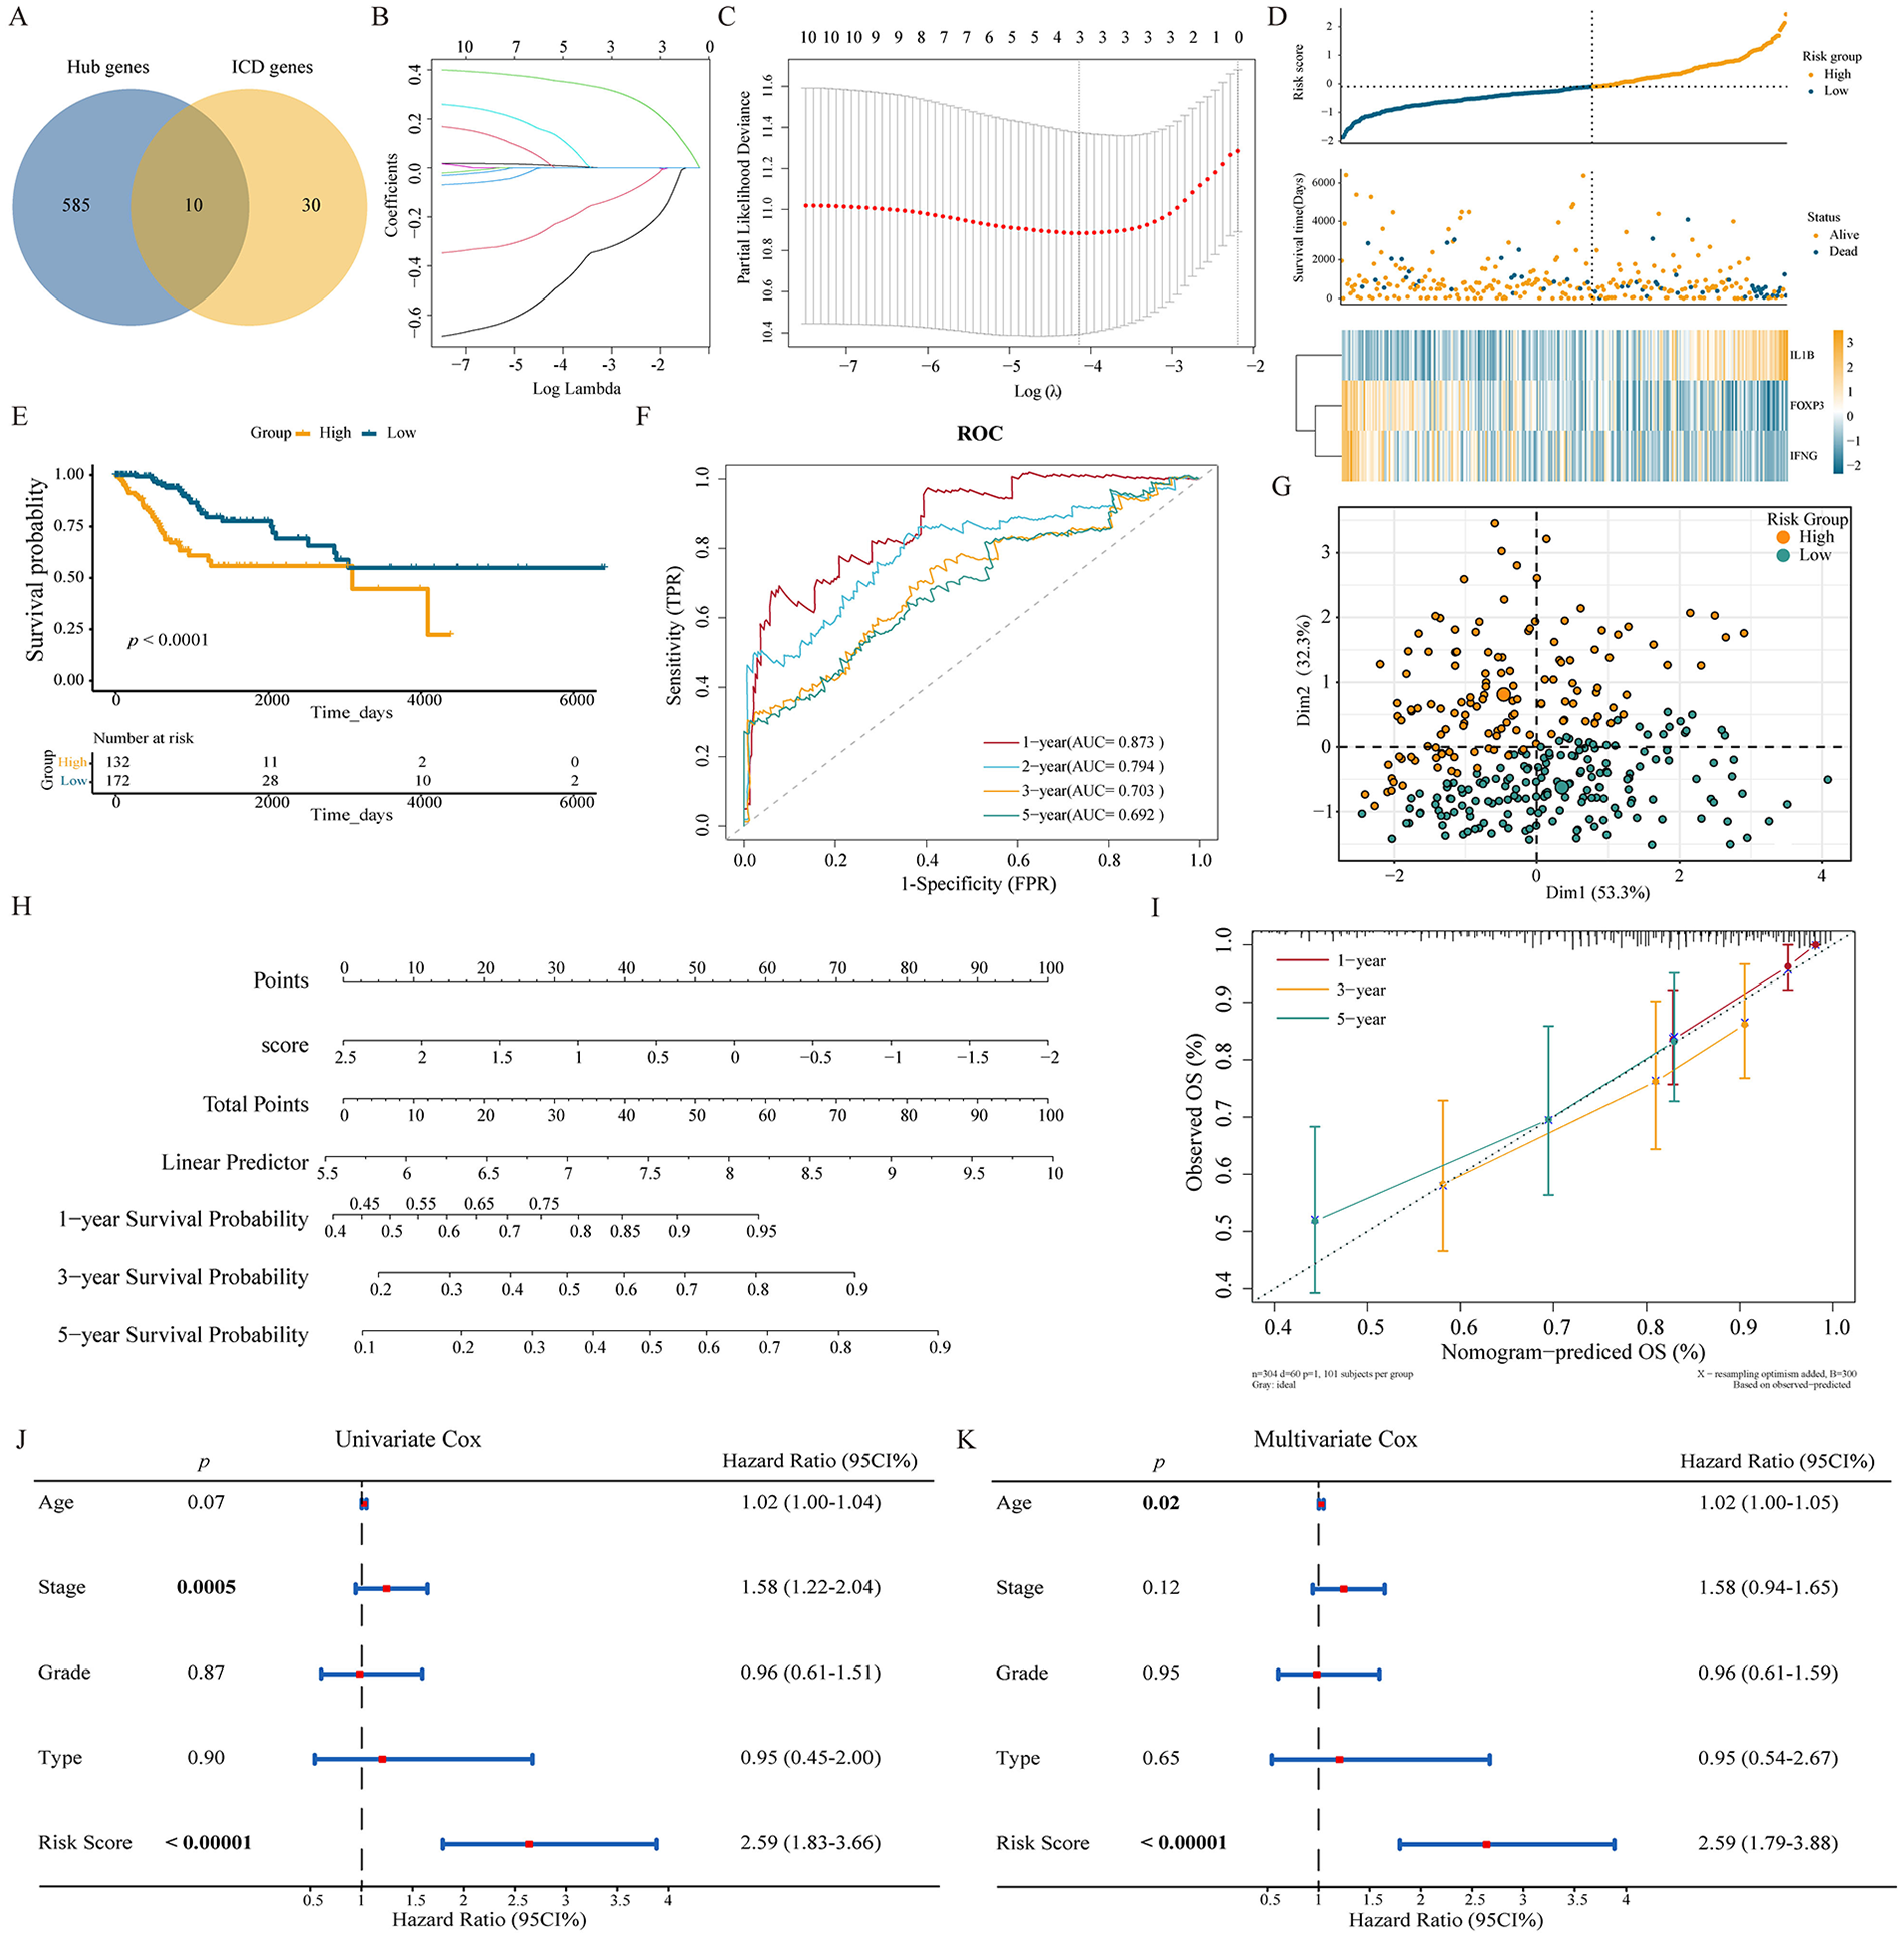
Construction of the ICD-related prognostic model. (A) The Venn diagram identified 10 hub genes as ICD-related genes. (B) The coefficients of the 10 ICD-related hub genes in the TCGA cohort were presented. (C) The partial likelihood deviance of the 10 ICD-related hub genes for OS was evaluated using the LASSO-Cox regression in the TCGA cohort. (D) The risk scores plots illustrated the ranking of risk scores and group distributions (top), the survival status of patients in distinct risk groups (middle), and the gene expression profiles of the 3 included genes (bottom) within the TCGA cohort. (E) Comparison of prognostic survival status between high- and low-risk groups in the TCGA cohort. (F) Time-dependent ROC curves displayed the performance of the ICD-related prognostic model in predicting prognosis at 1-, 2-, 3-, and 5-year intervals within the TCGA cohort, respectively. (G) PCA was performed based on the ICD-related gene signature in the TCGA cohort. (H) Nomograms were developed to predict the 1-, 3-, and 5-year survival rates of CC patients in the TCGA cohort. (I) Calibration curves of the nomogram were generated for predicting OS probabilities at 1-, 3-, and 5-year from the TCGA cohort. (J) Univariate Cox regression analysis was conducted on CC patients in the TCGA cohort. (K) Multivariate Cox regression analysis was performed on CC patients in the TCGA cohort.
To further assess the reliability of the prognostic model, we calculated the risk scores of patients in the GSE44001 cohort using the same formula (Figure 5A). Similarly, patients were then classified into high-risk and low-risk groups based on the median risk score. The Kaplan-Meier survival analysis demonstrated that the high-risk group exhibited a significantly poorer prognosis (P = .035), aligning with the findings from the TCGA cohort (Figure 5B). The ROC curves and nomogram consistently indicated that the model performed well in predicting patient prognosis (Figure 5C and F). Furthermore, the risk scores effectively classified all samples into distinct high-risk and low-risk groups (Figure 5D). Both univariate (HR = 81.23, 95%CI: 5.75-1146.66, P = .001) and multivariate (HR = 112.40, 95%CI: 7.83-1613.67, P = .0005) Cox regression analyses confirmed that the risk score served as an independent prognostic factor (Figure 5G and H). Collectively, these findings underscore the strong reliability and robustness of our constructed prognostic model in predicting patient outcomes.

External validation of the ICD-related prognostic model. (A) The risk score diagrams illustrated the ranking of risk scores and group distribution (top), the survival status of patients in different risk groups (middle), and the gene expression profiles of the 3 included genes (bottom) within the GSE44001 cohort. (B) A comparison of prognostic survival outcomes between high-risk and low-risk groups within the GSE44001 cohort. (C) Time-dependent ROC curves demonstrating the performance of the ICD-related prognostic model in predicting survival outcomes at 1-, 3-, and 5-year intervals within the GSE44001 cohort. (D) PCA plot based on the ICD-related gene signature for the GSE44001 cohort. (E) Nomograms constructed to predict the 1-, 3-, and 5-year survival rates of CC patients in the GSE44001 cohort. (F) Calibration curves of the nomogram for predicting OS probabilities at 1-, 3-, and 5-year intervals within the GSE44001 cohort. (G) Univariate Cox regression analysis performed on CC patients within the GSE44001 cohort. (H) Multivariate Cox regression analysis performed on CC patients within the GSE44001 cohort.
The relationships between risk score and immunocytes infiltration
We further examined the relationships between the risk score and immune cell infiltration in the TCGA and GSE44001 cohorts. As illustrated in Figure 6A and B, the risk score showed a negative correlation with the infiltration abundance of CD8+ T cells, follicular helper T cells, regulatory T cells, resting mast cell, naïve B cells. The immune cell proportion score (IPS) and TMB score were considered key indicators for predicting the efficacy of immunotherapy. Consequently, we also explored the association between the risk score and the estimated IPS and TMB scores in the TCGA cohort. As depicted in Figure 6C and D, the risk score demonstrated a statistically significant correlation with the IPS (R = −.12, P = .04) and TMB scores (R = −.12, P = .043). These findings indicate that patients in the low-risk group exhibited higher IPS and TMB scores, suggesting a greater likelihood of benefiting from immunotherapy. In conclusion, these results highlighting the impact of the risk score on immune cell infiltration and the potential predictive value for immunotherapy outcomes.

Relationships between risk scores and immune cell infiltration in CC. (A and B) The relationship between risk scores and common immune cells types in the TCGA and GSE44001 cohorts, respectively. (C) Correlation analysis between the IPS score and risk scores in the TCGA cohort. (D) Correlation analysis between TMB and risk scores in the TCGA cohort.
Single-cell sequencing analysis of identified ICD-related gene signature
As shown in Figure 7A, 17 cell types were identified and annotated based on the expression of specific classical genes. These include normal squamous epithelial cells (EPCAM and SOX17), malignant squamous epithelium cells (CDKN2A and KRT17), columnar epithelial cells (MUC5B and TFF3), B cells (IGKC and JCHAIN), endothelial cells (PLVAP and EMCN), fibroblasts (APOD and COL3A1), mast cells (TPSAB1 and TPSB2), smooth muscle cells (MYL9 and RGS5), macrophages (CD14 and CD163), neutrophils (SORL1 and CSF3R), CD4+ memory T cells (CD3D and TCF7), CD4+ naïve T cells (CD3D and IL7R), CD4+ effector T cells (CD3D and GNLY), CD4+ regulatory T cells (CD3D and IL2RA), CD8+ exhausted T cells (CD3D and HAVCR2), CD8+ effector cells (CD3D and LAG3), CD8+ cytotoxic T cells (CD3D and CD8A). Subsequently, we analyzed the expression of IL1B, IFNG, and FOXP3 across different cell types at the single-cell level. As shown in Figure 7B and C, IL1B was predominantly expressed in macrophages and neutrophils, IFNG was primarily expressed in CD8+ and CD4+ T cells, and FOXP3 was chiefly expressed in CD4+ Treg cells. Notably, IL1B displayed uniform expression across myeloid cells, including macrophages and neutrophils, whereas the expression levels of IFNG and FOXP3 in T cells and Treg cells, respectively, increased progressively with disease development (Figure 7D).

Single-cell sequencing analysis of CC samples. (A) Annotation of various cell types in CC tissues at the single-cell resolution, with each color representing a distinct cell type. (B and C) Expression patterns of IL1B, IFNG and FOXP3 across different cell types. (D) Expression levels of IL1B in myeloid cells, IFNG in T cells, FOXP3 in Tregs across different pathological stages.
We identified the DEGs (min.pt = 0.25, logFC.threshold = 0.25) between IL1B-negative and IL1B-positive myeloid cells, IFNG-negative and IFNG-positive T cells, as well as FOXP3-negative and FOXP3-positive CD4+ Treg cells (Figure 8A, D and G). Functional enrichment analyses demonstrated that IL1B-related DEGs were primarily associated with T cell activation, leukocyte cell-cell adhesion, and the positive regulation of cytokine production (Figure 8B and C). Similarly, IFNG-related DEGs were mainly linked to the positive regulation of lymphocytes activation, mononuclear cell differentiation, T cell activation, and T cell differentiation (Figure 8E and F). In contrast, FOXP3-related DEGs predominantly involved in various immune-related pathways, including neutrophil activation, T cell activation, leukocyte cell-cell adhesion, and the T cell receptor signaling pathway (Figure 8H and I). Together, these findings highlighted the pivotal roles of the 3 identified ICD-related genes in immune regulation.

Identification of DEGs and their functional enrichment analyses. (A) DEGs between IL1B-negative and IL1B-positive myeloid cells. (B and C) Functional enrichment analyses of the up-regulated and down-regulated genes identified in (A). (D) DEGs between IFNG-negative and IFNG-positive T cells. (E and F) Functional enrichment analyses of the up-regulated and down-regulated genes identified in (D). (G) DEGs between FOXP3-negative and FOXP3-positive CD4+ Treg cells. (H and I) Functional enrichment analyses of the up-regulated and down-regulated genes identified in (G).
IL1B was confirmed to be up-regulated in CC using experimental methods
We sought to further investigate the expression of 3 identified hub genes (IL1B, IFNG, and FOXP3) in CC. As illustrated in Figure 9A, analysis using GEPIA revealed that both IL1B and FOXP3 were significantly up-regulated in CC tissues compared to normal tissues. Notably, elevated IL1B expression was associated with poorer patient prognosis (HR = 2.04, 95%CI = 1.27-3.30, P = .003), whereas higher FOXP3 expression was linked to improved patient outcomes (HR = 0.50, 95%CI = 0.31-0.81, P = .004; Figure 9B). To validate these findings, we analyzed mRNA expression levels of IL1B, IFNG, and FOXP3 in 18 paired CC and adjacent normal tissues. As demonstrated in Figure 9C, all 3 genes (IL1B, IFNG, and FOXP3) were significantly up-regulated in CC tissues in comparison to adjacent normal tissues. Among these, IL1B showed the highest expression levels across CC cell lines, including Caski, HeLa, S12, ME180, and SiHa, relative to IFNG and FOXP3 (Figure 9D). Moreover, protein expression analysis confirmed that IL1B was markedly over-expressed in tumor tissues compared to adjacent tumor tissues (Figure 9E and F).

Validation of 3 identified ICD-related genes. (A) Comparative expression levels of IL1B (left), IFNG (middle) and FOXP3 (right) in tumor tissues versus normal tissues from the TCGA cohort, respectively. (B) Survival analysis of IL1B (left), IFNG (middle) and FOXP3 (right) in the TCGA cohort, respectively. (C) Differential mRNA expression levels of IL1B (left), IFNG (middle) and FOXP3 (right) in collected CC samples. (D) Variations in mRNA expression levels of IL1B, IFNG and FOXP3 observed in CC cell lines. (E and F) Differential protein expression levels of IL1B in collected CC samples.
Discussion
Due to the constraints of economic development, early screening and vaccination for CC have not been widely implemented. In developing countries, the incidence and mortality rates of CC are increasing year by year, particularly among patients with advanced or recurrent CC, whose prognoses remain exceedingly poor. Gaining a deeper understanding of the mechanisms driving the onset and progression of CC is therefore crucial for improving its prevention and treatment. Recently, ICD, a novel modality of cell death, has garnered attention for its role in antitumor therapies, such as chemotherapy, radiotherapy, or chemo-radiotherapy. 41 Studies have demonstrated that ICD plays a pivotal role in the progression of malignant tumors by multiple pathways.42,43 Firstly, tumor cells may undergo apoptosis or necrosis, releasing immunogenic molecules that stimulate immune cells like macrophages and T cells to target and destroy cancer cells. Secondly, therapeutic approaches such as radiotherapy and chemotherapy can induce ICD in tumor cells, thereby enhancing the efficacy of immunotherapy. 44 Furthermore, certain immunotherapies, including PD-1/PD-L1 inhibitors, have been shown to boost the immune response and inhibit tumor growth by promoting ICD.
In this study, we first categorized all CC patients from the TCGA cohort into 2 clusters, with patients in cluster 2 demonstrating a more favorable prognosis. Functional enrichment analysis revealed the activation of immune-related pathways in this cluster, such as leukocytes activation, positive regulation of immune response, innate immune response, immune effector processes, and MHC protein binding. Further evaluation of immune cell infiltration within the tumor microenvironment indicated that patients in clusters 2 exhibited higher infiltration levels of anti-tumor immune cells (eg, CD8+ T cells, M1 macrophages, resting mast cells) alongside lower tumorpurity.45,46 Additionally, the expression levels of specific chemokines associated with immune regulation (CCL3, CCL5, CCL13, CXCL10) and antigen-presenting molecules (B2M, HLA-A, HLA-C, HLA-E, HLA-DOA) were elevated in cluster 2. These findings suggested that patients in cluster 2 possessed more active immune regulation and a more complex tumor microenvironment composition. Moreover, the increased expression of immune checkpoints (BTLA, CD274, CTLA4, IDO1, TIGIT) in cluster 2 indicated that these patients were potentially more responsive to immunotherapy.
Then, we developed an ICD-related gene signature comprising 3 genes: IL1B, IFNG, and FOXP3. Using this signature, we calculated a risk score for each patient within the TCGA cohort. The ICD-related gene signature demonstrated robust performance in predicting patient outcomes. External validation using the GSE44001 database further confirmed that this signature serves as an independent prognostic risk factor for CC. Additionally, the expression levels of these 3 ICD-related genes were validated through qRT-PCR and WB analyses using collected CC samples, further reinforcing the reliability of our findings.
Immune checkpoint inhibitors represent one of the most promising therapeutic strategies for advanced or recurrent CC. The U.S. Food and Drug Administration has approved the use of pembrolizumab in such patients due to its demonstrated anti-tumor efficacy and favorable tolerability.47,48 However, the overall response rate of pembrolizumab as a monotherapy remains unsatisfactory in cases of advanced or recurrent CC. Our study showed that the estimated risk score derived from the constructed ICD-related gene signature was associated with the infiltration of immune cells in patients. In the TCGA cohort, the risk score was negatively correlated with the infiltration abundance of CD8+ T cells, mast cell resting, M1 macrophage, immune cells known to play vital roles in tumor readication. 49 Similarly, in the GSE44001 cohort, a negative correlation was observed between the risk score and the abundance of CD8+ T cells, activated NK cells, and resting mast cells. Furthermore, the ICD-related gene signature exhibited a negative correlation with the patient’s IPS and TMB score, both of which are key predictive indicators of immunotherapy.50,51 These findings collectively highlighted that CC patients with higher risk scores based on the ICD-related gene signature may possess fewer tumor-killing effector immune cells and were consequently less likely to derive significant benefit from immunotherapy.
IL1B, a member of the IL-1 family, has been shown to be up-regulated in various solid malignancies, including melanoma, lung cancer, breast cancer. 52 The IL1B protein can be secreted by a diverse range of cell types, such as immune cells, fibroblasts, cancer cells, and endothelial cells. It is known to play dual roles in regulating tumor immunity. In our study, analyses of single-cell data from CC samples revealed that IL1B mainly was predominantly expressed in myeloid cells. Previous studies have investigated the role of IL1B in CC, where it appears to function as either an antitumor or pro-tumor factor.53,54 Notably, our study found that IL1B was significantly up-regulated in CC tissues compared to adjacent normal tissues at both the mRNA and protein levels. Earlier research has demonstrated that IL1B can reshape the tumor microenvironment by promoting the accumulation of myeloid-derived suppressor cells (MDSCs) and intra-tumor neutrophils.55,56 Additionally, blocking IL-1β has been shown to enhance the infiltration of cytotoxic CD8+ T within the tumor microenvironment of lung cancer. 57 Despite these findings, the precise mechanism through which IL1B influences the tumor microenvironment and tumor progression remain elusive, and warrant further investigation in the near future.
In our study, the risk score was calculated using the following formula: risk Score = 0.3712*ExpIL1B − 0.3955*ExpFOXP3 − 0.20711*ExpIFNG. This indicates that the expression of FOXP3 and IFNG contributed negatively to the risk score. FOXP3 is a transcription regulatory factor that not only governs the stability and suppressive function of Tregs, but also directly regulates the expansion and activity of conventional T cells, thereby maintaining immune system homeostasis. 58 Moreover, FOXP3 derived from tumor cells can inhibit CD8+ T cell functions by upregulating PD-L1 expression within the tumor microenvironment of pancreatic ductal adenocarcinoma. 59 IFNG encodes a soluble cytokine that belongs to the type II interferon family and is secreted by both innate and adaptive immune systems cells. The encoded protein, interferon-gamma (IFN-γ), has been shown to regulate the proliferation and functional phenotype of immune cells, induce antigen presentation, and promote apoptosis in tumor cells. 60 In our study, while no significant differences were observed in IFNG expression between tumor and adjacent tissues, CC patients with higher IFNG expression tended to have improved prognoses. A similar prognostic effect was noted with FOXP3 expression in CC patients. Further investigation is necessary to determine whether targeting this ICD-related gene signature could enhance the efficacy of immunotherapy for CC.
There is no denying that our study has certain limitations. First, the number of clinical specimens used to validate the expression levels of the identified ICD-related signature was relatively small, necessitating the inclusion of more specimens for verification in the near future. Second, the impact of the risk score or target genes on immune cell infiltration and immune function requires further validation through both in vitro and in vivo studies. Lastly, the functional mechanisms of the identified gene warrant deeper investigation and comprehensive verification.
Conclusion
In summary, this study developed an ICD-related gene signature comprising 3 key genes (IL1B, IFNG and FOXP3) based on data from the TCGA and GSE44001 cohorts. This signature demonstrated strong performance in predicting the prognosis of CC patients and influencing immune cell infiltration within the tumor microenvironment. These findings offer valuable insights into prognosis prediction and potential strategies for enhancing immunotherapy sensitivity in CC.
Supplemental Material
sj-jpg-1-cix-10.1177_11769351251323239 – Supplemental material for An Immunogenic Cell Death-Related Gene Signature Predicts the Prognosis and Immune Infiltration of Cervical Cancer
Supplemental material, sj-jpg-1-cix-10.1177_11769351251323239 for An Immunogenic Cell Death-Related Gene Signature Predicts the Prognosis and Immune Infiltration of Cervical Cancer by Fangfang Sun, Yuanyuan Sun and Hui Tian in Cancer Informatics
Supplemental Material
sj-jpg-2-cix-10.1177_11769351251323239 – Supplemental material for An Immunogenic Cell Death-Related Gene Signature Predicts the Prognosis and Immune Infiltration of Cervical Cancer
Supplemental material, sj-jpg-2-cix-10.1177_11769351251323239 for An Immunogenic Cell Death-Related Gene Signature Predicts the Prognosis and Immune Infiltration of Cervical Cancer by Fangfang Sun, Yuanyuan Sun and Hui Tian in Cancer Informatics
Supplemental Material
sj-xlsx-3-cix-10.1177_11769351251323239 – Supplemental material for An Immunogenic Cell Death-Related Gene Signature Predicts the Prognosis and Immune Infiltration of Cervical Cancer
Supplemental material, sj-xlsx-3-cix-10.1177_11769351251323239 for An Immunogenic Cell Death-Related Gene Signature Predicts the Prognosis and Immune Infiltration of Cervical Cancer by Fangfang Sun, Yuanyuan Sun and Hui Tian in Cancer Informatics
Supplemental Material
sj-xlsx-4-cix-10.1177_11769351251323239 – Supplemental material for An Immunogenic Cell Death-Related Gene Signature Predicts the Prognosis and Immune Infiltration of Cervical Cancer
Supplemental material, sj-xlsx-4-cix-10.1177_11769351251323239 for An Immunogenic Cell Death-Related Gene Signature Predicts the Prognosis and Immune Infiltration of Cervical Cancer by Fangfang Sun, Yuanyuan Sun and Hui Tian in Cancer Informatics
Supplemental Material
sj-xlsx-5-cix-10.1177_11769351251323239 – Supplemental material for An Immunogenic Cell Death-Related Gene Signature Predicts the Prognosis and Immune Infiltration of Cervical Cancer
Supplemental material, sj-xlsx-5-cix-10.1177_11769351251323239 for An Immunogenic Cell Death-Related Gene Signature Predicts the Prognosis and Immune Infiltration of Cervical Cancer by Fangfang Sun, Yuanyuan Sun and Hui Tian in Cancer Informatics
Footnotes
Acknowledgements
Not applicable.
List of Abbreviations
CC: Cervical Cancer; ICD: Immunogenic Cell Death; TCGA: The Cancer Genome Alas; GEO: Gene Expression Omnibus; NCCN: National Comprehensive Cancer Network; HPV: Human Papillomaviruses; DAMP: Damage Associated Molecular Patterns; HMGB1: High Mobility Group Protein 1; PRRs: Pattern Recognition Receptors; CNV: Copy Number Variant; TMB: Tumor Mutation Burden; ATCC: American Type Culture Collection; DMEM: Dulbecco’s Modified Eagle Medium; FC: Fold Change; GO: Gene Ontology; KEGG: Kyoto Encyclopedia of Genes and Genomes; WGCNA: Weighted Gene Co-expression Network analysis; GS: Gene Significance; MM: Module Membership; ROC: Receiver Operator Characteristics; PCA: Principal Component Analysis; IPS: Immune Cell Proportion Score; MDSC: Myeloid-derived Suppressor Cells.
Author Contributions
H.T. conceived the original project; F.S. and H.T. planned the framework, performed the related analysis, made all the figures and tables, and performed the validated experiments; F.S. and Y.S, draft the manuscript; F.S. and H.T. revised the manuscript. All authors have read and approved the final manuscript.
Availability of Data and Materials
Declaration Of Conflicting Interests:
The author(s) declared no potential conflicts of interest with respect to the research, authorship, and/or publication of this article.
Funding:
The author(s) received no financial support for the research, authorship, and/or publication of this article.
Ethics Approval and Consent to Participate
This study was approved by the Ethics Committee of the First Affiliated Hospital of Zhengzhou University (permission number: 2023-KY-0551). Written informed consents were obtained from all participants.
Consent for Publication
Not applicable.
Supplemental Material
Supplemental material for this article is available online.
References
Supplementary Material
Please find the following supplemental material available below.
For Open Access articles published under a Creative Commons License, all supplemental material carries the same license as the article it is associated with.
For non-Open Access articles published, all supplemental material carries a non-exclusive license, and permission requests for re-use of supplemental material or any part of supplemental material shall be sent directly to the copyright owner as specified in the copyright notice associated with the article.