
Abstract
Researchers often report a measure to several decimal places more than what is sensible or realistic. Rounding involves replacing a number with a value of lesser accuracy while minimizing the practical loss of validity. This practice is generally acceptable to simplify data presentation and to facilitate the communication and comparison of research results. Rounding also may reduce spurious accuracy when the extraneous digits are not justified by the exactness of the recording instrument or data collection procedure. However, substituting a more explicit or simpler representation for an original measure may not be practicable or acceptable if an adequate degree of accuracy is not retained. The error introduced by rounding exact numbers may result in misleading conclusions and the interpretation of study findings. For example, rounding the upper confidence interval for a relative effect estimate of .996 to 2 decimal places may obscure the statistical significance of the result. When presenting the findings of a study, authors need to be careful that they do not report numbers that contain too few significant digits. Equally important, they should avoid providing more significant figures than are warranted to convey the underlying meaning of the result.
Introduction
Rounding is a practical tool for simplifying scientific expressions but in some cases can yield seemingly illogical or counterintuitive results. Let

Here,
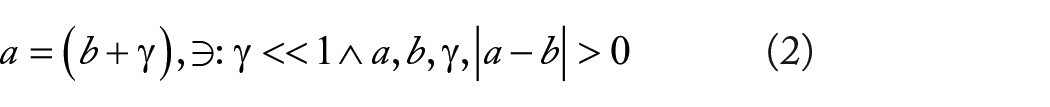


As


Again, as


By disregarding rounding error, this proof allows for division by zero, yielding the untenable result of 2 ≅ 1. In real-world applications of this concept, numbers are frequency truncated (or rounded) because of floating-point library limitations inherent to the operating system. This occurs, for example, in the field of cancer informatics when computing odds ratios (ORs) and statistical significance for thousands of single-nucleotide polymorphisms (SNPs) in a genome-wide association study (GWAS). Such errors can accumulate and significantly affect computational results and accuracy.
On the contrary, rounding often is used to intentionally aid the parsimonious presentation of data. This helps to simplify ideas without the need for unnecessary complexity. However, as illustrated above, rounding error cannot be simply overlooked, especially in applications where the loss of accuracy may be additive or multiplicative in nature. In this article, technical guidance and intuitive examples are provided to highlight the use and misuse of rounding, focusing on the computation and presentation of relative effect estimates (REEs).
Relative Effect Estimates and Confidence Intervals
The consequences of rounding can have important implications for how the results of an analysis are interpreted. Inevitably, rounding leads to less accurate (closeness to truth) and precise (repeatability) results when reporting parameter estimates. In turn, this is gauged against parsimony and the practical aspects of not reporting findings beyond what is necessary to convey the underlying meaning. Accordingly, rounding should be “not too much and not too little.” 1 One must also be attentive to rounding numbers beyond what is warranted by the process or device used to measure the value, to avoid unfounded accuracy in the presentation of results. 2
When measurements are taken on the linear scale, rounding to a fixed number of decimal places is a common and reasonable approach. However, the process becomes more complex for REEs such as ORs, hazard ratios (HRs), and relative risks (RRs), which are expressed on a logarithmic scale. In contrast to a linear scale in which values may range from
A result is deemed to be statistically significant when the P value is less than or equal to
In Table 1, a few representative examples are provided to compare REEs (and CIs) before and after rounding to 2 significant digits using the above-mentioned strategy. The underlined values (vinculum) in the table denote the respective significant digits of rounding. When the point estimate for the REE is greater than 1.0 but less than 1.05, some researchers round the value to 1.0 and omit the second significant digit. However, this oversimplification can result in the estimate falling outside the corresponding CI (Example #12). Similarly, in Example #10, the HR is rounded to 1.07 instead of 1.1 so that the rounded value is contained within the CI (rather than being equal to the upper limit). To avoid ambiguity, the upper confidence limit (UCL) for Example #13 is rounded to .9989 instead of .999 (wherein the actual value could be as low as .9985 or as high as .9999 if the value was truncated to .999). The P value in Example #15 is rounded to .0502 and is consistent with its CI that spans unity (ie, statistically nonsignificant, given α = .05). In Examples #4 and #6, the trailing zeros in the P value are retained to convey the exactness of rounding to 2 significant digits versus values that may have been rounded to a single significant digit. This is also the case for the trailing zero in the REE
Relative effect estimates before and after rounding to 2 significant digits.

Abbreviations: LCL, lower confidence limit; UCL, upper confidence limit; φ, relative effect estimate.
Based on rounding the original values rather than using a conversion formula applied to the rounded estimates.
Rounding allows for the presentation of numbers with a higher degree of decimal place accuracy in a more succinct format while still retaining the true meaning of the value. This is often done to facilitate the formatting of tables, enabling the maximum content of information in a limited space. However, a parsimonious solution for rounding may not always be feasible.
Example
Consider the following case:

According to the above-mentioned rules, this would be rounded as

The interpretation of the CI which contains unity is consistent with the original unrounded values and corresponds to a statistically nonsignificant P value in both cases. Yet, the number of decimal places required to meaningfully represent the CI after rounding is cumbersome. Unless a CI is mandatory for the example at hand, it may be more reasonable to forego this statistic and only present the P value corresponding to the point estimate.
Logarithmic-based effects also may pose a challenge for rounding when numbers are too small or too large to be conveniently written in decimal form. Typically, computer programs will use scientific notation to represent the confidence bounds, as indicated in the example below

where “E” denotes multiplying the mantissa by 10 raised to the order of magnitude shown after this symbol. For example

The above can be further reduced by rounding the mantissas in the CI, as well as the P value, to 2 significant digits. That is

Although some precision is forfeited, this rounded form still conveys the nonsignificance of the point estimate.
Returning to Table 1, Example 14, let us assume that the researcher opted instead to round the HR to 1.0. to save space (ie, more parsimonious). While this abbreviated point estimate appropriately lies within the CI, we are uncertain if the true value is above or below unity. We can determine the directionality of the estimate on the log scale by computing the midpoint of the CI and adding the result to the lower bound. That is

Accordingly, we see that this value is logarithmically in the positive direction (ie, above 1.0) and conclude that little information would have been lost by the researcher’s rounding decision (as it is possible to estimate the additional significant digit needed to determine if the point estimate is above or below unity).
Computing P Values as a Simple Measure of Rounding Accuracy
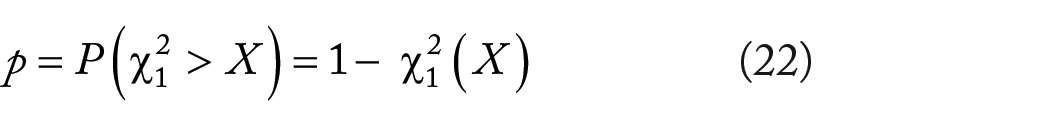
From basic probability theory, recall that


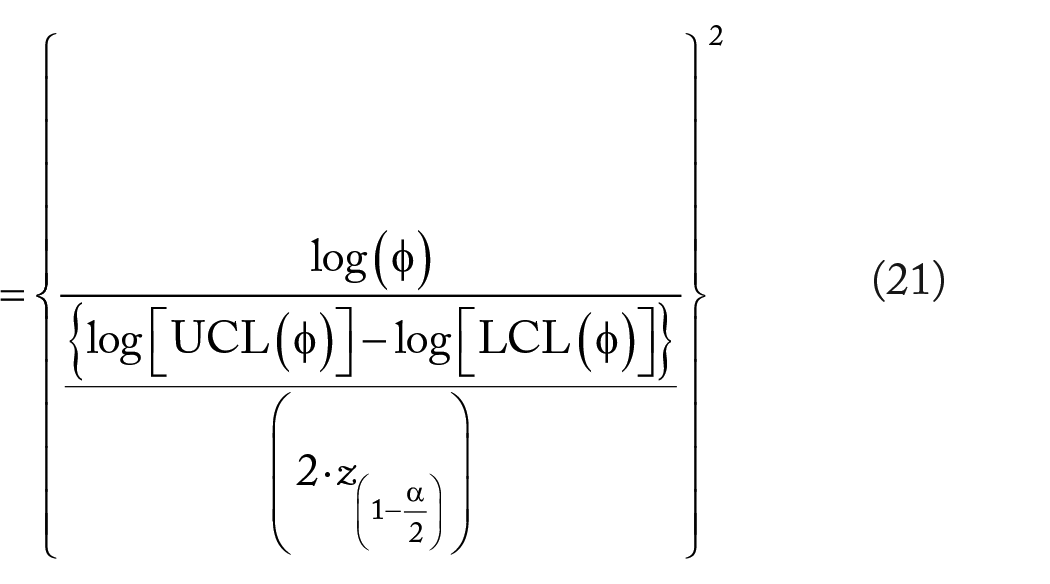
follows a chi-square distribution with 1 degree of freedom (df), that is,
For example, consider

and applying equation (21), we have
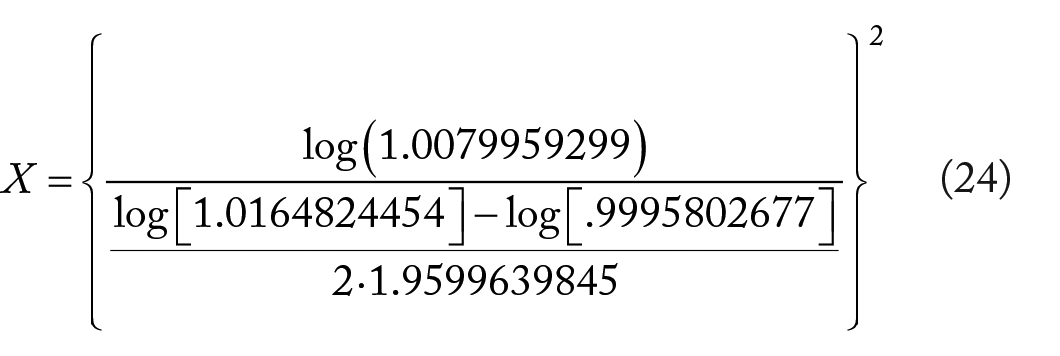

The resulting P value = .0626284
Converting a REE and corresponding CI to a P value is a simple way to gauge the accuracy of rounding. Rounding the above example to 2 significant digits gives
Applying equation (22) to the rounded values for the REE and CI yields the smaller P value of .053. While rounding to 2 significant digits in this example is suitable for determining if the point estimate is contained within or outside the CI (ie, nonsignificant vs significant), it may not provide enough accuracy for reliably estimating a P value for other purposes. In practice, journal articles often provide a REE with CI, foregoing a P value. An interested reader could estimate a P value using the above conversion equation. In such a case, however, it is important that a sufficient number of significant digits are provided to assure that the derived P value is reasonably close to the actual value.
Accumulated Rounding Error
Ratio of 2 independent REEs
In the previous section, we discussed how to gauge rounding error by estimating a P value when given the REE, lower confidence limit (LCL), and UCL (ie, 3 sources of rounding error). While only the REE and LCL are necessary to estimate a P value, see equation (19), the latter form may not adequately capture the CI’s true width when the estimates have been rounded. Recall that REEs are based on a logarithmic rather than linear scale and consequently rounding may differentially affect the distance of LCL and UCL from the REE.
To further illustrate the accumulation of rounding errors, we consider estimating the


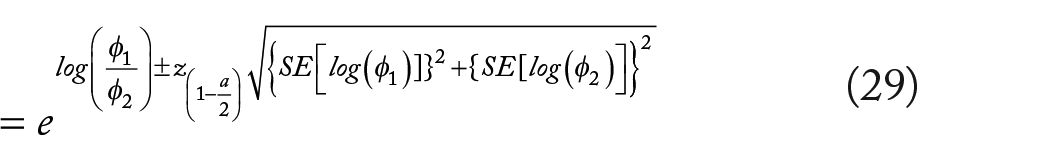
where from the denominator of equation (21) we see that
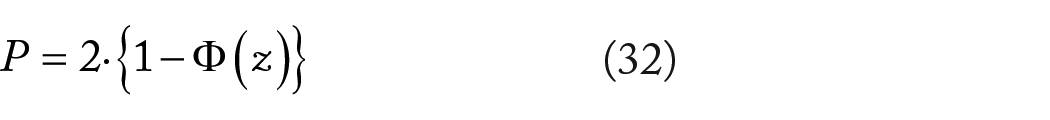
To test the null hypothesis that

with a standard normal distribution to obtain the corresponding P value, that is,
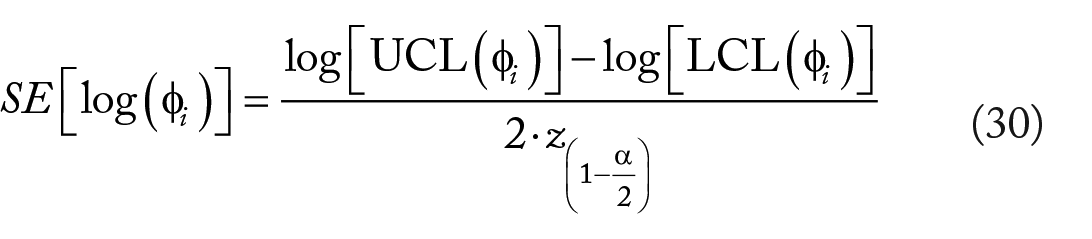
where

In the above equations, we see that there are 6 potential sources of rounding error corresponding to the 2 sets of REEs and CIs {ie,
Example
A mildly immunosuppressive, genetically modified compound (Factor X) produced by drug company (A) for the treatment of rheumatoid arthritis has been observed to increase the risk of cancer. Company (B) has developed a non-immunosuppressive compound (Factor Y) for rheumatoid arthritis and wishes to test if this new drug reduces cancer risk in this population. The senior management of the company would like to move forward with regulatory submission of Factor (Y) but only if there is a 50% risk reduction over Factor (X) at the P < .01 level of statistical significance. A randomized clinical trial reports the following results
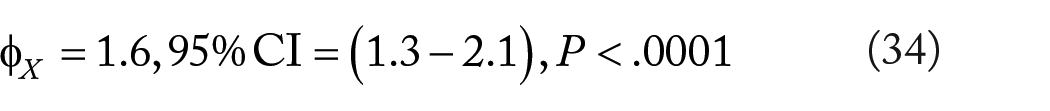


and

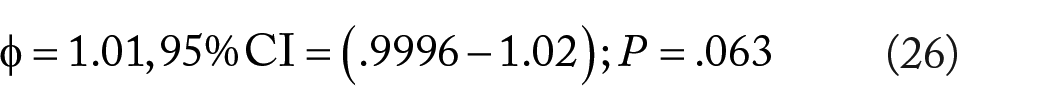
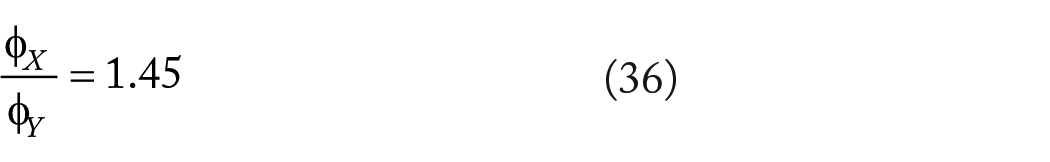
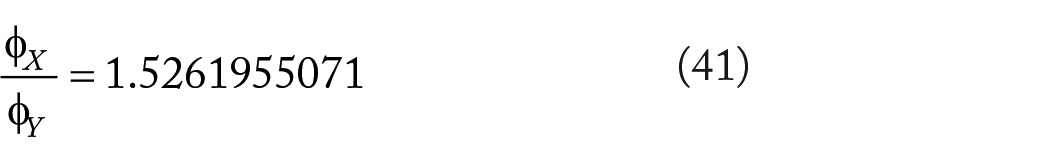
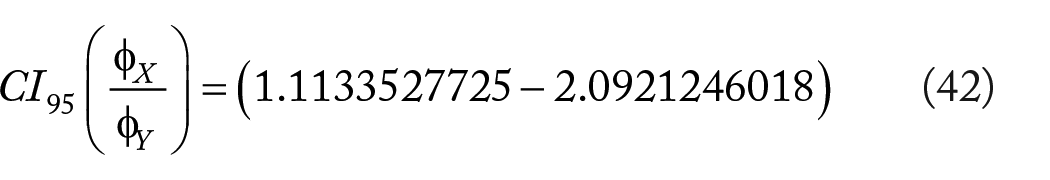
Because the achieved risk reduction is less than 50% (ie, ~45%) and the P value of .020 fails to satisfy the a priori criteria of <.01, Company (B) decides against further investment in this therapy. However, an independent consultant questions these results given that the analysis was conducted on the reported rounded values. Requesting the unrounded data and reanalyzing the data, her more precise result gives


and

We now see that the risk reduction of Factor (Y) versus Factor (X) is ~53%, with a corresponding P value of .0081. Based on the reanalyzed data, Company (B) decides to move forward with submitting their drug for regulatory approval.
Multiplicity-adjusted CIs for REEs
Accounting for multiple comparisons in the form of multiplicity-adjusted CIs is important to avoid the inflation of type I error (ie, the probability of wrongly rejecting 1 or more null hypotheses increases in proportion to the number of risk comparisons being considered). Multiplicity-adjusted CIs also are useful for identifying a parsimonious set of variables to include in multivariable models such as Cox and logistic regression. However, the process of computing multiplicity-adjusted CIs using rounded values may yield imprecise and misleading results.
Given

where
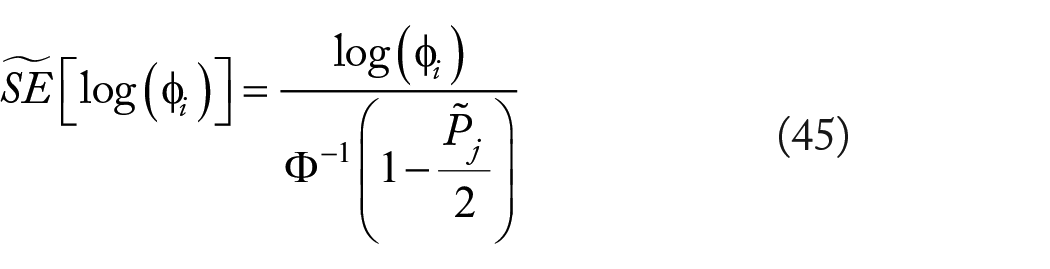

and
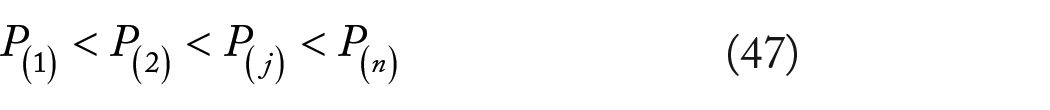
from the set of
Example
A molecular scientist has bioengineered a benign respiratory animal virus to help combat opportunistic infections. While the approach has been shown to be effective at reducing blood human papillomavirus (HPV) levels and subsequent cancer, an increased occurrence of severe coughing and wheezing episodes has been observed over the 5-year follow-up period. Accordingly, she decides to examine the association of selected SNPs with the outcome, hoping to identify an antidote target. To control for false positives, the Hochberg method is used to adjust CIs for multiplicity. 4 The study findings, computed before and after rounding, are summarized in Tables 2 and 3.
Confidence intervals adjusted for multiplicity before rounding.

Abbreviations: LCL, lower confidence limit; SNP, single-nucleotide polymorphism; UCL, upper confidence limit; φ, relative effect estimate.
Confidence intervals adjusted for multiplicity after rounding.

Abbreviations: LCL, lower confidence limit; SNP, single-nucleotide polymorphism, UCL, upper confidence limit; φ, relative effect estimate.
In Table 2 (before rounding), SNP #3 corresponds to a P value of .5253357016 (which is the least significant result in the table), with
Discussion
Rounding is a compromise strategy that involves replacing a true or more accurate value with one having less accuracy. The intent is to preserve the meaning and interpretation of the original result. It represents a balance between reporting too few significant digits and losing information versus failing to achieve parsimony (ie, retaining too many inessential digits). In some cases, the numbers are rounded beyond the capacity of the measurement device (spurious accuracy) or practical aspects of the problem at hand. The degree of rounding imposed in a situation depends on the desired accuracy and precision of the result. Additionally important is the need to minimize the error that may accumulate when performing complex computations on rounded values. Such sequential operations can lead to ill-conditioned and inaccurate findings.
The goal of research is to gain insights and answers to relevant scientific questions. Rounding helps to simplify the presentation of data and to make findings easier to understand and compare across research studies. Insufficient or inappropriate rounding (ie, numeric representation error) may affect the credibility and quality of a study, leading to a false sense of discovery. Results also may be difficult to replicate in future studies. Ideally, one aims to minimize the bias associated with rounded, realizing that a “one-size-fits-all” solution or set of rules rarely exists in the real world. In this article, a rounding strategy is presented based on the number of significant digits that are needed to determine if a REE is statistically significant. The method is simple to implement yet reasonably robust in most common applications.
An alternative rounding method for reporting REEs (and associated CIs), known as the “Rule of Four,” is based on the “maximum absolute fractional rounding error,” a value that varies because of the nonlinear (logarithmic) aspect of REEs. 3 This rule entails dividing the REE by 4 and rounding down to 2 significant digits, and then reporting the REE to that number of decimal places. In brief, REEs are reported to 3 decimal places for values ranging from (.040 to .399), 2 decimal places for (.40 to 3.99), and 1 decimal place for (4.0 to 39.9), and so forth.
Within certain ranges, this rule has the advantage of reporting rounded values with greater absolute accuracy than the strategy suggested in the current manuscript (ie, “Goldilocks Rule”). For example, the REEs of .2543 and 3.9421 are rounded to .254 and 3.94, respectively, using the Rule of Four. In comparison, the values are rounded to .25 and 3.9 using the Goldilocks Rule. However, the Rule of Four often is less parsimonious from the perspective of using CIs to gauge the statistical significance of a REE. For instance, rounding the lower confidence bound of .3994 to .399 (Rule of Four) versus .40 (Goldilocks Rule) conveys the same interpretation of the REE as being statistically nonsignificant, but in the latter case, fewer decimal places are required to present the value. Furthermore, rounding an UCL of .9973 and a LCL of 1.0042 by the Rule of Four (ie, 1.0 in both cases) does not flag the values as being statistically significant, compared with the Goldilocks Rule which rounds the values to .997 and 1.004, respectively.
Investigators are increasingly advocating for the use of effect sizes and CIs versus a single P value, wherein the latter does not convey the magnitude and relative importance of an effect. 5 This approach has the added advantage of being able to gauge the statistical significance of the result (ie, CI excludes unity), which remains a common practice in the literature. Caution, however, is advised when dealing with CLs near unity, as insufficient rounding may obscure the underlying statistical significance (or lack thereof) of the result. Researchers also are counseled to avoid spuriously significant findings which may not be scientifically relevant or practically meaningful, based only on whether the CI excludes unity. 6
Conclusions
Little guidance exists in the literature for how to round REEs and CIs, especially with respect to the interpretation of statistical significance. The current manuscript provides a parsimonious framework for rounding to aid cancer researchers in the presentation of their results. Tools also are provided for gauging the rounding accuracy of REEs in terms of associated P values, as well as providing intuitive examples of accumulated rounding error. Importantly, rules for rounding, whether those presented here or by other authors, are merely recommendations and should be carefully considered in the context and aims of the underlying research.
Footnotes
Acknowledgements
Acknowledgments are due to Andrew Thompson (CSPEC/DVAHCS) for providing technical support and quality review.
Funding:
The author(s) received no financial support for the research, authorship, and/or publication of this article.
Declaration of conflicting interests:
The author(s) declared no potential conflicts of interest with respect to the research, authorship, and/or publication of this article.
Authors’ Note
The content of this manuscript does not represent the views of CSPEC/HSR&D/DVAHCS or the US Government. Examples are hypothetical and presented only for didactic illustration of underlying quantitative concepts.
Author Contributions
JTE contributed to the conceptualization, writing—original draft preparation, and writing—review and editing. The author has read and agreed to the published version of the manuscript.