
Abstract
Observational case-control studies for biomarker discovery in cancer studies often collect data that are sampled separately from the case and control populations. We present an analysis of the bias in the estimation of the precision of classifiers designed on separately sampled data. The analysis consists of both theoretical and numerical results, which show that classifier precision estimates can display strong bias under separating sampling, with the bias magnitude depending on the difference between the true case prevalence in the population and the sample prevalence in the data. We show that this bias is systematic in the sense that it cannot be reduced by increasing sample size. If information about the true case prevalence is available from public health records, then a modified precision estimator that uses the known prevalence displays smaller bias, which can in fact be reduced to zero as sample size increases under regularity conditions on the classification algorithm. The accuracy of the theoretical analysis and the performance of the precision estimators under separate sampling are confirmed by numerical experiments using synthetic and real data from published observational case-control studies. The results with real data confirmed that under separately sampled data, the usual estimator produces larger, ie, more optimistic, precision estimates than the estimator using the true prevalence value.
Introduction
Biomarker discovery is typically attempted by means of observational case-control studies where classification techniques are applied to high-throughput measurement technologies, such as DNA microarrays,1,2 next-generation RNA sequencing (RNA-seq), 3 or “shotgun” mass spectrometry. 4 The validity and reproducibility of the results depend critically on the availability of accurate and unbiased assessment of classification accuracy.5,6
The vast majority of published methods in the statistical learning literature make the assumption, explicitly or implicitly, that the data for training and accuracy assessment are sampled randomly, or unrestrictedly, from the mixture of the populations. However, observational case-control studies in biomedicine typically proceed by collecting data that are sampled with restrictions. The most common restriction, and the one that is studied in this article, is that the data are sampled separately from the case and control populations. That creates an important issue in the application of traditional statistical learning techniques to biomedical data, because there is no meaningful estimator of case prevalences under separate sampling. Therefore, any methodology that directly or indirectly uses estimates of case prevalence could be severely biased.
Precision and Recall have become very popular classification accuracy metrics in the statistical learning literature.7–9 The recall does not depend on the prevalence, while the precision does. Therefore, we investigate in this article the bias of the precision estimator when the typical separate sampling design used in case-control studies is not properly taken into account.
A similar study was conducted previously into the accuracy of cross-validation under separate sampling. 10 It was shown in that study that the usual “unbiasedness” property of k-fold cross-validation does not hold under separate sampling. In fact, the bias can in fact be substantial and systematic, ie, not reducible under increasing sample size. In Braga-Neto et al, 10 modified k-fold cross-validation estimators were proposed for the class-specific error rates. In the case where the true case prevalence is known, those estimators can be combined into an estimator of the overall error rate, which satisfies the usual “unbiasedness” property of cross-validation.
By contrast, the present paper employs analytical and numerical methods to investigate precision estimation under separate sampling. We show that the usual precision estimator is asymptotically unbiased as sample size increases, under the condition that the classification rule has a finite Vapnik-Chervonenkis (VC) dimension. However, under separate sampling, we show that the usual precision estimator will in general display a systematic bias, which cannot be reduced by increasing sample size, if the observed prevalence of cases in the data is different from the true prevalence in the population of interest, and the bias is larger the more different they are. In particular, the bias tends to be large when the true prevalence is small but the training data contain an equal number of examples from both classes, which is a common scenario in practice. If the true case prevalence is known (eg, from public health records), then a modified precision estimator that uses the known prevalence is shown to be asymptotically unbiased in the separate sampling case, under the condition that the classification rule is sufficiently stable as sample size increases. All of these theoretical results, and the approximations used to derive them, are verified by numerical experiments using both synthetic and real data from published studies.
Materials and Methods
In this section, we define and study the various error rates of interest in this study, including precision and recall.
Population performance metrics
The feature vector
The prevalence is defined by

ie, the probability that a randomly selected individual is a case subject. The prevalence plays a fundamental role in the sequel.
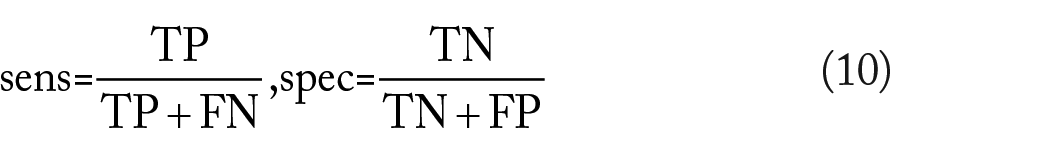
A classifier


The closer both are to 1, the more accurate the classifier is. A noteworthy property of the sensitivity and specificity is that they do not depend on the prevalence.
Other common performance metrics for a classifier are the false-positive (FP), false-negative (FN), true-positive (FP), and true-negative (FN) rates, given by


Unlike sensitivity and specificity, the previous performance metrics do depend on the prevalence.
Note that

Finally, we define the precision and recall accuracy metrics. Precision measures the likelihood that one has a true case given that the classifier outputs a case:

Applying Bayes’ Theorem and using previously derived relationships reveal that

On the other hand, recall is simply the sensitivity:

It follows that precision depends on the prevalence, but recall does not.
Estimated performance metrics
In practice, the performance metrics defined in the previous section need to be estimated from sample data

where

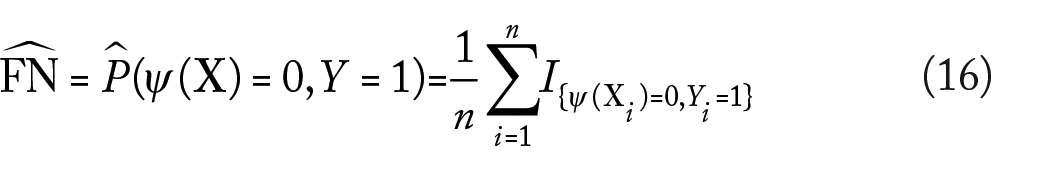


The remaining performance metrics estimators are defined analogously, using equations (10), (12), and (13):


Mixture and separate sampling
The usual scenario in Statistical Learning is to assume that

for
By contrast, observational case-control studies in biomedicine typically proceed by collecting data from the populations separately, where the separate sample sizes

It is not difficult to verify that under equation (23), the marginal distribution of each label
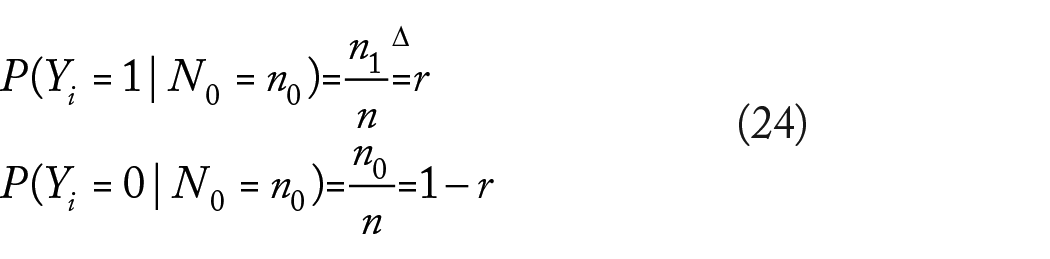
for
Bias of the precision estimator
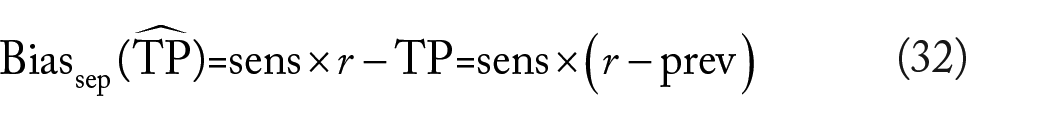
In this section, we present a theoretical large sample analysis of the bias of the estimators discussed previously, focusing on the precision estimator. Estimation bias is defined as the expectation over the sample data
The situation is clear with the estimator of the prevalence itself, given by equation (14). Under mixture sampling, we have

so the estimator is unbiased (in addition, as

according to equation (24). This also follows directly from the fact that

Assuming that the sample size ratio
The situation for
Assuming mixture sampling and a classification algorithm with finite VC dimension

so that the bias vanishes as
Next we consider the bias of the precision and recall estimators under mixture sampling (the analysis for the sensitivity and specificity estimators is similar; in fact, the former is just the recall estimator). We will make use of the following approximation for the expectation of a ratio of two random variables

The approximation is quite accurate if

for a sufficiently large sample, where we used the previously established asymptotic unbiasedness of
We are not aware of the existence of a VC theory for separate sampling at this time. To obtain approximate results for the separate sampling case, we will assume instead that at large enough sample sizes, the classifier
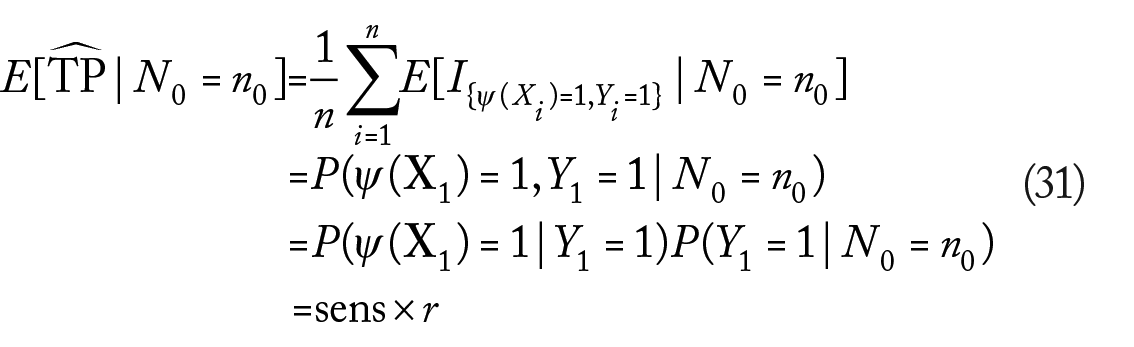
where we used the fact that the event
As in the case with the bias of
The recall estimator is approximately unbiased under separate sampling:

This is a consequence of recall’s not being a function of the prevalence. However, for the precision estimator,

The precision estimator is thus biased under separate sampling unless the true prevalence matches exactly the sample ratio
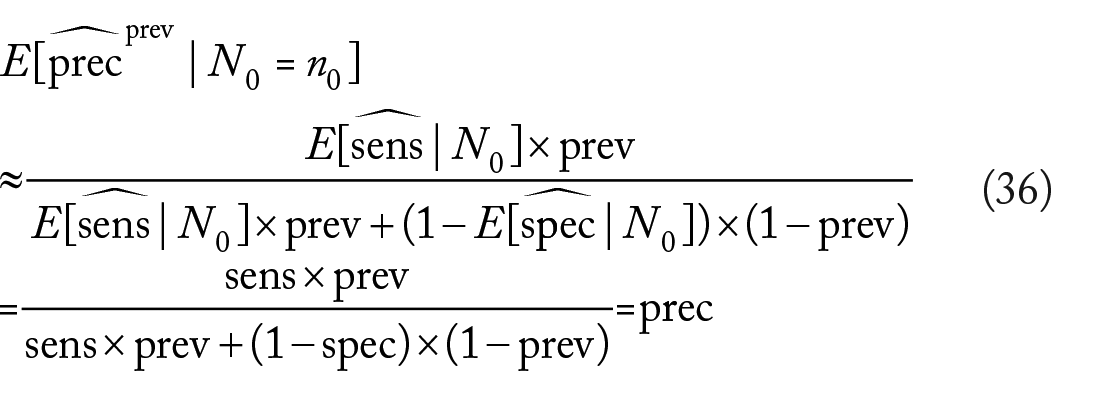
In case the true prevalence is known, eg, from public health records and government databases, then we show below that the following estimator of the precision,
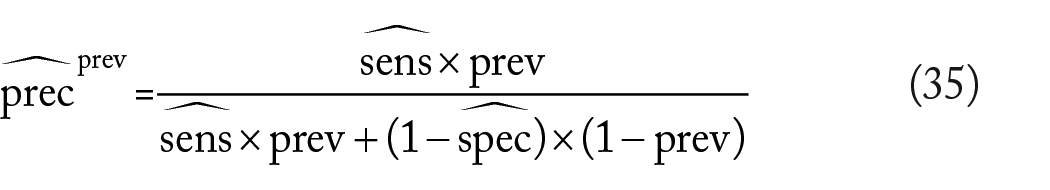
which is based on equation (12), is an asymptotically unbiased estimator of the precision under either mixture or separate sampling. Asymptotic unbiasedness in the mixture sampling case can be shown by repeating the steps in the analysis of the ordinary precision estimator. Under separate sampling, we have
since
Results and Discussion
In this section, we employ synthetic and real-world data to investigate the accuracy of the analysis in the previous section and the performance of the precision estimator under separate sampling. Corresponding results for mixture sampling and the recall estimator can be found in the Supplementary Material.
Experiments with synthetic data
We performed a set of experiments employing synthetic data from a homoskedastic Gaussian model, consisting of three-dimensional class-conditional distributions
Synthetic data parameters.

For each value of
Generate sample data
Train a classifier using one of three classification rules: 12 LDA, 3-Nearest Neighbors (3NN), and a nonlinear Radial-Basis Function Support Vector Machine (RBF-SVM).
Obtain recall and precision estimates. Compute both the usual precision estimate
Obtain accurate estimates of the true precision values using a test set of size 10 000.
Figure 1 displays the results of the experiment. Note that there is only one curve for the traditional precision estimator

Average true precision (solid curves), average usual precision estimate
To examine more closely the effect of the difference between
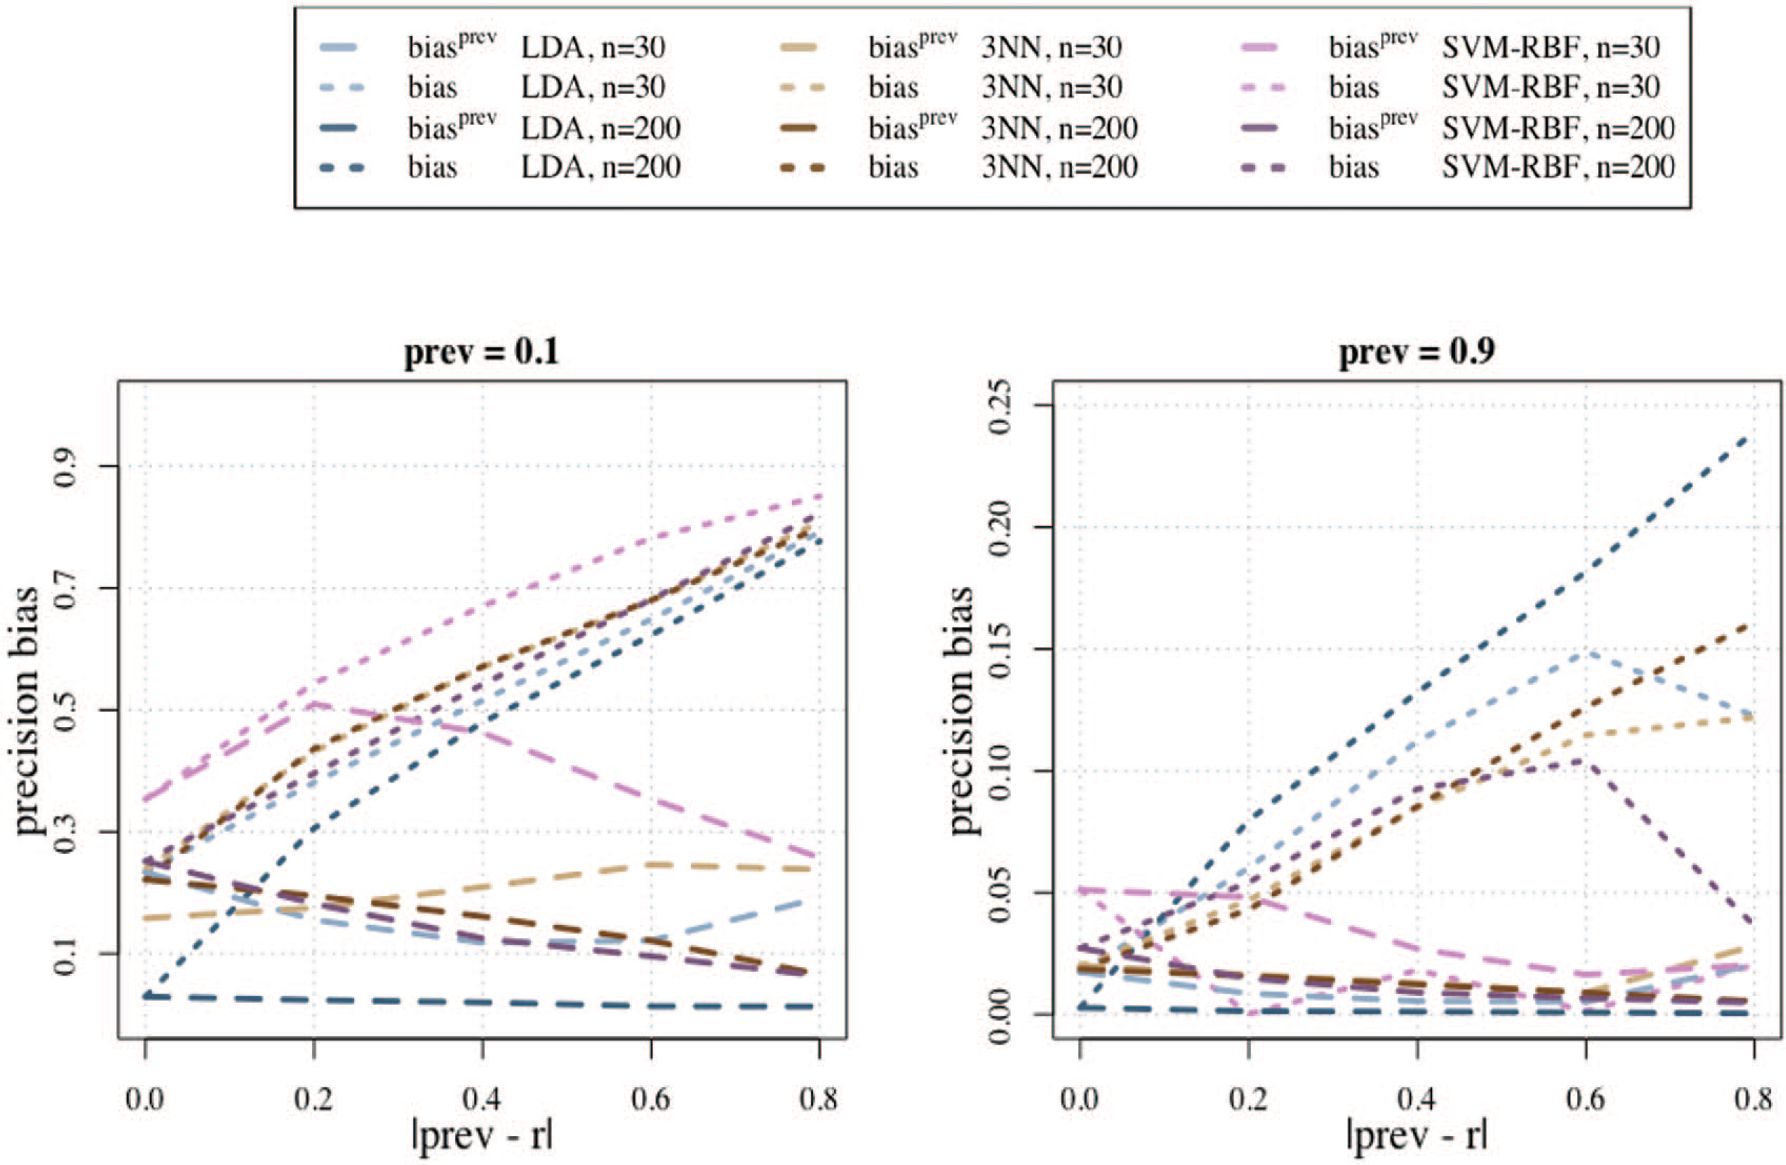
Estimated bias of the usual precision estimator
Case studies with real data
Here we further investigate the bias of precision estimation under separate sampling using real data from three published studies.
Leukemia study
This publication
13
used a tumor microarray data set containing two types of human acute leukemia: acute myeloid leukemia (AML) and acute lymphoblastic leukemia (ALL). Gene expression measurements were taken from
Breast cancer study
The second publication
15
employed the Wisconsin Breast Cancer (Original) Dataset from the University of California-Irvine (UCI) Machine Learning Repository,16,17 which has been used by several groups to investigate breast cancer classification methods.18,19 The data set consists of 699 instances, 458 and 241 of which are from benign and malignant tumors, respectively, and 10 features corresponding to cytological characteristics of breast fine-needle aspirates. According to Wilkins,
20
fewer than 20% of breast lumps are malignant; therefore, we used used
Liver disease study
The final publication
21
employed a liver disease data set, also from the UCI Machine Learning Repository. This data set contains 5 blood test attributes and 345 records, of which 145 belong to individuals with liver disease (class 0) and 200 measurements are taken from healthy individuals (class 1), so that
All three studies used libraries from the Weka machine learning environment
23
to compute usual precision estimates on separately sampled data, while ignoring true prevalences, for different classification rules: Naive Bayes (NB),
24
C4.5 decision tree,
25
Back-Propagated Neural Networks, 3NN, and Linear SVM.
12
We reproduced the analysis in all three papers using Weka, obtaining almost exactly the same
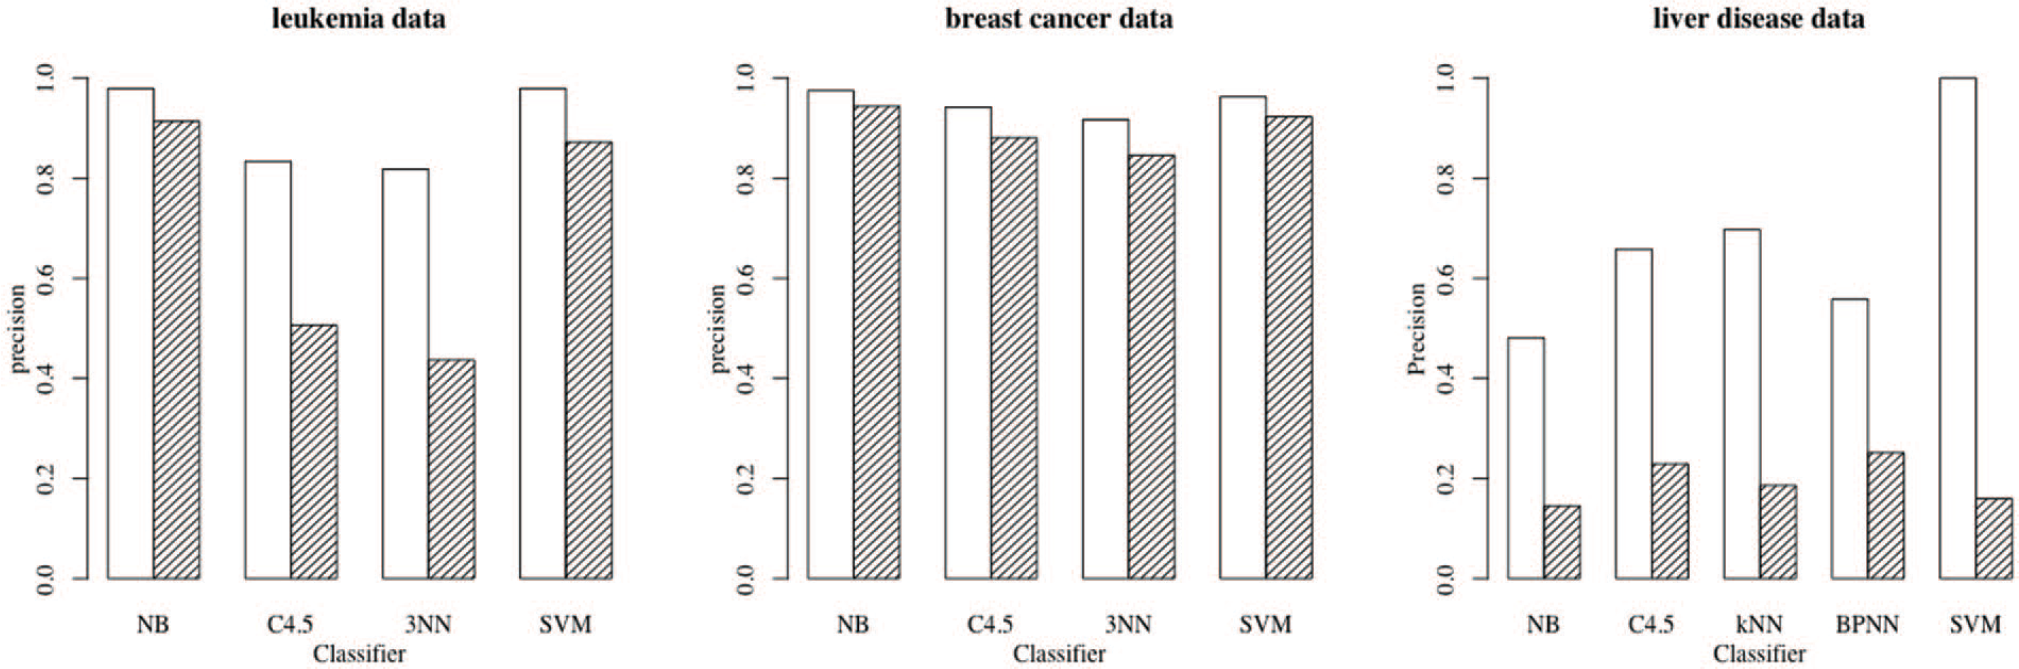
Precision estimates for different classification rules using separately sampled leukemia, breast cancer, and liver disease data. The white bars depict the usual estimated precision estimates, while the shaded bars are for the precision estimates using the true case prevalences. NB indicates Naive Bayes; 3NN, 3-Nearest Neighbors; SVM, Support Vector Machine.
Concluding Remarks
Accuracy and reproducibility in observational studies is critical to the progress of biomedicine, in particular, in the discovery of reliable biomarkers for disease diagnosis and prognosis. In this study, theoretical results confirmed by numerical experiments show that the usual estimator of precision can be severely biased under the typical separate sampling scenario in observational case-control studies. This will be true especially if the true disease prevalence differs significantly from the apparent prevalence in the data. If knowledge of the true disease prevalence is available, or can even be approximately ascertained, then it can be used to define a modified precision estimator, which is nearly unbiased at moderate sample sizes. In all the results using real data sets, we observed that the usual precision estimator produces values that are larger, ie, more optimistic, than the modified one using the true prevalence, which agrees with the results obtained with the synthetic data. Absence of knowledge about the true prevalence means simply that the precision cannot be reliably estimated in observational case-control studies and its use should be discouraged. Finally, we note that in our experiments, we considered the case where the prevalence is between 0.1 and 0.9, not without reason. If the prevalence is significantly under 0.1, as is the case in some rare diseases, then neither the precision, nor in fact the classification error, should be used as a criterion of performance, but rather the sensitivity and specificity need to be considered separately—otherwise, a large precision and small classification error can be achieved by biasing the classification rule to produce FP rates close to zero while ignoring the FN rate.
Supplemental Material
suppl_figures – Supplemental material for On the Bias of Precision Estimation Under Separate Sampling
Supplemental material, suppl_figures for On the Bias of Precision Estimation Under Separate Sampling by Shuilian Xie and Ulisses M Braga-Neto in Cancer Informatics
Footnotes
Appendix 1
Here we derive the asymptotic approximation in equation (29). If
Now let
Taking expectations on both sides gives
Except in pathological cases involving heavy-tailed distributions, the remainder in the previous equation becomes negligible as
as long as
Funding:
The author(s) received no financial support for the research, authorship, and/or publication of this article.
Declaration of Conflicting Interests:
The author(s) declared no potential conflicts of interest with respect to the research, authorship, and/or publication of this article.
Author Contributions
UMB-N proposed the original idea of studying precision estimates under separate sampling. SX conducted a detailed bibliographical research on the use of precision in Bioinformatics. SX designed and conducted the numerical experiments using the synthetic and real data sets. Both authors contributed in the discussion of the results. SX prepared the initial draft of the manuscript, and UMB-N contributed in the preparation of the final version.
Supplemental Material
Supplemental material for this article is available online.
References
Supplementary Material
Please find the following supplemental material available below.
For Open Access articles published under a Creative Commons License, all supplemental material carries the same license as the article it is associated with.
For non-Open Access articles published, all supplemental material carries a non-exclusive license, and permission requests for re-use of supplemental material or any part of supplemental material shall be sent directly to the copyright owner as specified in the copyright notice associated with the article.