
Abstract
Objectives:
The primary goal of this research is to develop treatment-related genomic predictive markers for non-small cell lung cancer by integrating various machine learning algorithms that recommends near-optimal individualized patient treatment for chemotherapy in an effort to maximize efficacy or minimize treatment-related toxicity. This research can contribute toward developing a more refined, accurate and effective therapy accounting for specific patient needs.
Methods:
To accomplish our research goal, we implement ensemble learning algorithms, bagging with regularized Cox regression models and nonparametric tree-based models via Random Survival Forests. A comprehensive meta-database was compiled from the NCBI Gene Expression Omnibus data repository for lung cancer patients to capture and utilize complex genomic patterns that can predict treatment outcomes more accurately.
Results:
The developed novel prediction algorithm demonstrates the ability to support complex clinical decision-making processes in the treatment of NSCLC. It effectively addresses patient heterogeneity, offering predictions that are both refined and personalized in improving the precision of chemotherapy regimens prescribed to the eligible patients.
Conclusion:
This research should contribute substantial advancement of cancer treatments by improving the accuracy and efficacy of chemotherapy treatments for a targeted group of patients who need the right treatment. The integration of complex machine learning techniques with genomic data holds substantial potential to transform current cancer treatment paradigms by providing robust support in clinical decision-making.
Keywords
Introduction
Non-small-cell lung cancer (NSCLC) affects over 200 000 Americans per year and it constitutes 85% of lung cancer. 1 Physicians consider the best medical treatment options to improve quality of life and prolong survival in patients with NSCLC. The best treatment option for early-stage NSCLC is currently curative surgery. However, it has been proven that 30% to 55% of stage I-IINSCLC patients who underwent complete surgical resection eventually relapse2 -4; thus, such patients with poor prognosis would benefit of adjuvant cisplatin-based chemotherapy (ACT).5,6
Recently, clinical investigations have revealed a survival benefit of 4% to 15% for individuals with resected stages IB to IIIA when ACT is used. 7 Furthermore, current practice is to treat all Stage II patients with ACT, but it is unclear whether all of these individuals will benefit from the chemotherapy due to the inherent toxicity of chemotherapy. Doctors must assign patients with ACT carefully such that chances of success are high enough to justify the risk of relapse and metastatic potential.
Advancements in biotechnology in recent years have increased the availability of high-dimensional genomic data for biomedical decision making. For such data to be informative for patient care, it must be transformed from simply a mass of raw data on each patient to a higher level of relevant knowledge. Statistical machine learning algorithms have been used to develop computational algorithms that can process such high-dimensional data to predict survival of patients through model validation methods.8 -10 The primary goal of these algorithms is to assign viable chemotherapies to the right patients, considering both maximizing efficacy for the intended beneficial effect and minimizing the risk of adverse effects.
Machine learning has been extensively utilized in various biomedical studies to improve prediction accuracy and uncover novel insights. For instance, Le et al 11 illustrated the application of machine learning algorithms in predicting patient outcomes in oncology, while Le and Ou 12 highlighted the use of machine learning techniques for the classification of complex disease phenotypes. Additionally, Solheim et al 13 explored the use of deep learning for medical image analysis, and Moura et al 14 discussed the integration of machine learning models in electronic health record data for disease prediction, further underscore the widespread adoption and impact of these methodologies in biomedical research.
Various machine learning survival models have been proposed to provide treatment recommendations for NSCLC patients.15,16 The Cox proportional hazards model 17 is a fundamental approach for statistical modeling of survivorship data. Regularized Cox regression models, the lasso Cox model 18 and the elastic net, 19 are popular regularization models for feature selection. Moon et al 20 implemented the lasso Cox regression model to determine prognostic genes that are highly correlated with treatment-related patient survival and to identify patients whose survival rates improve from ACT treatment.
As a parametric Accelerated Failure-Time (AFT) model 21 can design survival times directly, AFT models perhaps provide an alternative measure of treatment effect on survival compared to the hazard ratio. Moon et al 22 devised a statistical decision-making algorithm using penalized AFT models via elastic net in order to enhance treatment efficacy for patients who could benefit from ACT.
Recently, Moon et al 23 applied a modified-covariate regularized Cox regression model with lasso penalty to investigate treatment effects by implementing explicit treatment interaction factors for identifying genes that were closely related to the treatment effect. Risk scores estimated from the model were used to stratify patients into a high risk or low risk group respective to ACT treatment.
In this project, robust ensemble-based algorithms are employed to improve efficacy of therapies to individualized patients in the treatment of NSCLC and to identify profiles of disease and risk sub-categories. We consider the bagging approach to the regularized Cox model and Random Survival Forest (RSF) based on survival trees to uncover treatment-associated genomic markers.
Ensemble Machine Learning Algorithms for Predicting Treatment Recommendations
Data description
This paper utilized the following 2 datasets available at National Center for Biotechnology Information (NCBI) Gene Expression Omnibus (GEO) repository. The GEO database provides gene expression and other functional genomic datasets. 24 The following 2 datasets, GSE14814 and GSE68465, were downloaded from the NCBI GEO repository, which is available at https://www.ncbi.nlm.nih.gov/.
The first dataset (GSE14814) was obtained from the JBR.10 clinical trial for demonstration of benefit from ACT compared to the observation (OBS) group after surgical resection in early-stage NSCLC. 5 In the original study that began in July 1994, a total of 482 patients were randomly assigned to receive either surgery alone with no chemotherapy (n = 242) or a regimen of ACT treatment following surgery (n = 240). Out of these 482 patients, 445 consented to sample banking. Among the 445 patients, only 169 frozen tissue samples were collected. This actual collection was limited by several factors, including the availability of high-quality samples, logistical constraints, and specific study requirements, which dictated that only 169 samples were suitable for freezing and subsequent gene expression profiling. Out of 169 tumor samples, only 166 contained >20% tumor cellularity. Using the Affymetrix U133A oligonucleotide microarray platform, 133 randomly selected frozen JBR 10 tumor samples out of 169 were subject to gene expression profiling by Zhu et al 5 Among these 133 patients, 71 underwent ACT, while 62 were in the OBS group.
The second dataset (GSE68465) was obtained from Director’s Challenge Consortium for the Molecular Classification of Lung Adenocarcinoma based on multi-site clinical trials conducted in several continents. 25 This challenge was conducted to characterize the performance of several prognostic models based on gene expression for 442 lung adenocarcinomas. However, 56 patients were removed due to missing values. Thus, in this project, we used 386 patients (65 OBS and 321 ACT). Overall design of this dataset was based on Affymetrix U133A platform as well. This data set was considered to be the largest publicly available microarray data with lung adenocarcinoma characteristics.
The data set utilized TNM staging, which was inconsistent with the number staging system used in the other data set considered in this project. To make it consistent, the TNM stages were converted to number stages using the American Joint Committee on Cancer’s Lung Cancer Staging. 26 We note that the GSE68465 dataset did not include information on the M (Metastasis) stage, which indicates whether the cancer has spread to other parts of the body. Thus, pN0pT1 and pN0pT2 were converted to stage I; pN0pT3, pN1pT1, and pN1pT2 were converted to stage II; pN0pT4, pN1pT3, pN1pT4, pN2pT1, pN2pT2, pN2pT3, and pN2pT4 were converted to stage III. Consequently, 244 were stage I patients, 77 were stage II patients, and 65 were stage III patients. A different transformation from the one we used may affect the interpretation of results.
We employed a rigorous validation approach to ensure the robustness and reliability of the ensemble machine learning algorithms. Specifically, we utilized a random sampling technique to divide our patient samples into training and test sets. In order to develop predictive models for treatment recommendation for NSCLC patients, we combined the above 2 datasets. In this meta-database, we randomly select about 70% of patient samples (n = 364) into a training set model development. The remaining 30% (n = 155) of the samples were allocated to the test set to assess the performance of the models after finalizing the models. The demographics of the learning set and the test set are listed in Table 1.
Demographics of combined datasets (GSE14814 and GSE68465).

This approach allows us to evaluate the models’ predictive capabilities on the independent dataset, which helps to mitigate the risk of overfitting and provides a more accurate estimation of the models’ generalizability to new, unseen data. By using a separate test set, we ensure that the models are not only specifically adjusted or optimized to the training data but also perform well on external data, reflecting their potential applicability in real-world clinical settings.
Furthermore, we employed cross-validation techniques during the training phase to fine-tune the models’ hyperparameters and optimize their performance. Cross-validation involves partitioning the training set into multiple subsets, training the models on some subsets while validating them on the remaining subsets. This iterative process helps in identifying the best model parameters and reduce the likelihood of overfitting.
Data preprocessing
Affymetrix microarrays have played a significant role in advancing our understanding of diverse biological processes and became an essential tool for modern genomics research. These microarrays are based on high-density oligonucleotide probe arrays and offer a comprehensive view of gene expression. It enables researchers to simultaneously analyze thousands of genes in a single experiment.
In Affymetrix microarray technology, the platforms are made up of microscopic dots imprinted on microscopic slides, and each gene is typically composed of 11 to 20 pairs of probes. Each probe pair is made up of a perfect match (PM) probe with a mismatch (MM) probe, referring to 2 types of probe sequences used to measure gene expression levels. The PM probe is designed to be complementary to a specific target mRNA sequence of a gene of interest. On the other hand, the MM probe is very similar to the PM probe, but it contains a single nucleotide mismatch in the 13th position.
Before being analyzed, raw microarray data must be preprocessed. We employed Robust Multichip Analysis (RMA) method27,28 for preprocessing. We chose the RMA method over other available methods due to several key advantages. RMA effectively normalizes data and performs background correction, reducing technical variability and enhancing the reliability of measured gene expression levels. It includes a log2 transformation step, which stabilizes the variance across expression values, making the data more suitable for downstream statistical analysis. Additionally, RMA uses a robust linear model that is less sensitive to outliers compared to other methods, ensuring accurate and reliable expression estimates. Comparative studies27,28 have shown that RMA often outperforms other normalization methods such as MASS and dChip in terms of accuracy, precision, and reproducibility, particularly with large datasets and varying conditions. Furthermore, RMA is computationally efficient, allowing for the processing of large datasets in a reasonable timeframe. Its wide adoption and extensive validation in the genomics community provide confidence in its reliability and accuracy, making it a trusted and accepted choice in this research.
The RMA involves 3 steps: probe intensity background correction, quantile normalization, and robust probe summarization. This method plays a pivotal role in ensuring the robustness and compatibility of microarray data, facilitating meaningful biological discoveries.
Background correction in the RMA method is a crucial step for reducing the impact of local artifacts and other noise from the raw intensity values for each probe on the microarray chip. It uses only the PM probe intensities. This procedure aids in the removal of spatial heterogeneity and the background noise, which can arise from non-specific binding, imperfection in the chip, or other technical factors.
Background correction is done by a normal-exponential background correction model.
29
This model operates at the probe level. For each probe on the microarray, it aims to estimate and correct the background noise. This model assumes that the background-subtracted observed PM intensity value

The parameters

where
After applying the Normal-Exponential background correction model, we have a set of corrected intensity values for each probe, where the background noise has been effectively removed. These corrected values can then be further processed through quantile normalization and summarization steps as part of the RNA method to obtain a single expression value for each gene.
Quantile normalization ensures that the expression profiles of genes are consistent across different microarray chips, allowing for meaningful comparisons and reducing the impact of technical variations. To perform quantile normalization, the algorithm aligns the distribution of intensities from different chips. It can be achieved by matching the empirical distribution of intensities, making sure that each chip’s distribution looks similar.
The algorithm sorts the probe intensity values for each chip and ranks them in ascending order, creating a ranked list of values of each chip. A reference distribution is created by taking the median of the ranked values from all the chips. This reference distribution represents a common distribution that all chips will be adjusted to match. Each chip’s ranked values are then “normalized” to match the reference distribution. This adjustment involves replacing each value with the corresponding value from the reference distribution at the same rank. After quantile normalization, we have a set of normalized intensity values for each chip, making them directly comparable. Finally, these normalized values are used for gene-level summarization.
The gene-level summarization step involves combining probe-level data for a specific gene into a single summarized value. This is typically achieved by taking the median intensity of the probe sets, targeting a particular gene. The aim is to reduce noise and variability, providing a representative expression value for each gene across multiple probes on the microarray.
In this step, the probe sets are summarized using the median polish method. 30 It is based on the additive linear model such that

where

where
Survival prediction models
In the learning set referred in Table 1, there were 50 ACT patients and 43 OBS patients in GSE14814, while there were 46 ACT patients and 225 OBS patients in GSE68465. For each observation, there were 22 283 probe sets, therefore it was necessary to conduct a variable screening to determine which probe sets might contain useful information to predict survival in the patients, rather than noise. The ultimate goal of implementing survival prediction models is to identify the most relevant potential markers, unraveling critical insights into lung cancer treatment responses to a chemotherapy.
Feature screening
Feature screening is a pivotal step in predictive modeling. The screening involves choosing a subset of treatment-related features, such as probe sets, clinical variables, and demographic factors. This process not only aids in reducing dimensionality but also enhances interpretability and model performance. For the screening, a modified univariate Cox proportional hazard model 31 is implemented for each feature such that

where
Leave-one-out cross-validation (LOOCV) is used to measure a variable importance score for probe sets. The score is based on the number of times a feature is significant at the 5% significance level during LOOCV. For GSE14814 there are 1874 probe sets that are significant at least once. Likewise, for GSE68465 there are 1946 probe sets that are significant at least once. However, the screened features are still larger than the learning sample size of 364 patients. Thus, further reduction on features is necessary to implement our bagging algorithm that is an ensemble-based penalized cox regression.
The elastic net penalized Cox regression model, employed as a vital tool for additional probe set screening, combines the properties of both

where
The elastic net regularization aims to minimize the negative log partial likelihood, incorporating a tuning parameter that balances the lasso and ridge penalties. We set the alpha parameter, which controls the balance between
In summary, feature screening for all types of features began with a modified Cox proportional hazard model. Leave-one-out cross-validation (LOOCV) was used to measure a variable importance score for probe sets. The score was based on the number of times a feature was significant at the 5% significance level during LOOCV. This initial feature screening selected a total of 3820 features. Given that the learning sample size of 364 patients is substantially smaller than the number of screened features, we applied the elastic net penalized Cox regression model for an additional probe set screening. Consequently, we screened down to 138 probe sets and 6 clinical and demographic variables.
Ensemble learning with bagging for Cox regression
In this research, we propose an approach for predictive modeling in the context of lung cancer treatment survival outcomes using an ensemble algorithm with bagging based on Cox regression. We draw inspiration from bagging, a powerful technique that involves generating multiple bootstrap samples from a dataset and training separate models on each sample. Likewise, in survival analysis, the Cox proportional hazards model is a widely used tool to predict the survival times of patients. By extending the bagging concept to Cox regression, we aim to construct an ensemble model that aggregates predictions from multiple Cox models, each trained on a different bootstrap sample. This ensemble approach endeavors to enhance the robustness and predictive power of survival predictions related to treatment options for lung cancer patients, contributing to a more accurate understanding of treatment-related genomic markers and their implications for personalized therapeutic strategies.
Our empirical preliminary experiments demonstrated that using 200 models provided a good balance between model performance and computational efficiency. Increasing the number of models beyond 200 resulted in marginal improvements in performance while significantly increasing the computational burden. Friedman et al 32 also support the notion that ensembles of around 100 to 200 models are often sufficient to achieve robust performance improvements.
In this paper, we construct a formidable ensemble by generating 200 Cox regression models through bootstrap sampling. Each model is trained on a distinct bootstrap sample to capture the variability in the dataset and provide diverse perspectives on survival predictions. After training, we aggregate the risks predicted by each Cox model for the respective treatment groups. The aggregation process enables a comprehensive assessment of hazard to death for each treatment group. Leveraging this aggregated risk information, we assign predicted treatment recommendations by comparing the hazard to death between the ACT group and the OBS group. ACT is recommended if the hazard from ACT is lower than the hazard from OBS, and vice versa. This approach harnesses the collective wisdom of the ensemble to enhance treatment decision-making and ultimately improve patient outcomes, aiming to guide personalized treatment strategies for lung cancer patients.
As an outcome measure, the concordance index (C-index) 33 is utilized to evaluate the performance of predictive survival models. It quantifies the concordance or agreement between predicted survival times and observed (actual) outcomes for individual patients. The C-index ranges from 0 to 1, where a higher value signifies better predictive accuracy. In our bagging ensemble algorithm, the C-index is measured among each bag, and the final CI is calculated by taking an average of the C-indices from 200 bags.
The C-index is widely used in survival analysis due to its ability to assess the discriminatory power of a predictive model by measuring the proportion of correctly ordered pairs of patients based on predicted survival times. This metric is non-parametric, making it suitable for various types of survival models. Furthermore, the C-index provides an intuitive interpretation, ranging from 0.5 (no better than random chance) to 1.0 (perfect prediction), similar to an accuracy measure.
However, we acknowledge the limitations of the C-index. It does not provide specific information about the magnitude of prediction errors or the accuracy of survival time estimates, only evaluating the rank ordering of predictions, which might be insufficient for certain clinical application where precise survival time estimates are required.
The C-index is popular in survival analysis because it effectively handles censored data, which is common in this field, and focuses on ranking predicted survival times rather than exact predictions. Unlike traditional metrics like accuracy and area under the curve (AUC), the C-index reflects the time-to-event nature of the data. It is also versatile and standardized, applicable across various survival models. These characteristics make the C-index more suitable for survival analysis than accuracy or AUC, which do not naturally account for censoring or the temporal aspects of survival data.
In addition to these metrics, we employed robust validation techniques such as leave-one-out cross-validation (LOOCV) and bootstrap resampling. LOOCV helps mitigate the risk of overfitting by assessing the model’s performance on different subsets of the data, while bootstrap resampling provides a robust estimate of performance metrics by generating multiple samples from the original data.
Random survival forests algorithm
Random survival forests (RSF) 34 algorithm has emerged as a powerful and versatile algorithm for survival analysis, offering a non-parametric, data-driven approach to model survival outcomes. The RSF extends the concepts of Random Forests 35 algorithm to the realm of survival analysis by utilizing an ensemble of decision survival trees to predict survival probabilities and estimate hazard functions. Unlike traditional survival models, RSFs do not require strong assumptions about the underlying distribution of the survival data, making them particularly well-suited for complex and heterogeneous datasets. By aggregating predictions from multiple trees and leveraging random feature selection, RSF provides a robust and accurate framework for survival prediction, yielding valuable insights into genomic markers. In this study, we incorporate RSF as a key component of our ensemble survival model, aiming to harness their predictive prowess and contribute to the advancement of survival analysis methodologies.
The algorithm begins by constructing multiple decision survival trees through bootstrapping the dataset and selecting a subset of features at each split. For each tree, survival times and event indicators are used to determine the split points and build the tree structure. During node splitting, RSF calculates the log-rank statistic to evaluate the potential splits based on survival differences. The procedure ensures that the tree branches are optimized for survival prediction. After the ensemble is created, predictions are made by aggregating the survival estimates form all trees, providing a robust model for survival outcomes. Additionally, RSF employs a random feature selection process to enhance the diversity of trees, contributing to improve predictive performance.
The feature selection process in RSF involves several key steps to identify the most important features influencing survival outcomes. Initially, a large number of survival trees are built using bootstrap samples of the training data, with each tree constructed using a random subset of features at each node to split the data. During this process, each feature’s contribution to predictive performance is assessed. The variable importance measure, calculated as the average decrease in prediction error measured by Harrell’s C-index when a feature is permuted, is used to quantify the significance of each feature. Features that consistently result in larger decreases in prediction error are considered more important. This method allows for the identification of features that have a strong association with survival prediction. As a result, the RSF algorithm can efficiently select a subset of critical features that improve the model’s accuracy and interpretability, facilitating better understanding and prediction of survival outcomes.
Let ℎ be a terminal node of a tree in an ensemble for a given covariate

where
Let

where

where
Our preliminary experiments indicated that using 1000 trees in the RSF model resulted in stable and robust out-of-bag (OOB) error rates. Increasing the number of trees beyond this point showed diminishing returns in terms of model performance improvement, while significantly increasing computational costs.
According to Breiman, 35 using a large number of trees (e.g. 1000) is generally sufficient to achieve stable predictions and low OOB error rates. A study by Ishwaran et al 34 also suggests that while the number of trees can be increased, 1000 trees are often adequate to ensure the convergence of the error rate and robust model performance. Further increasing the number of trees could be explored in future work to evaluate any potential incremental improvements in model performance.
In this paper, we used 1000 survival trees to ensure robust and stable estimates of variable importance and survival predictions. The minimum number of unique events required in a terminal node was set to 15, balancing the depth of the trees with model interpretability. The log-rank splitting rule was applied to maximize the difference in survival between the child nodes. Each tree was built using bootstrap samples of the training data, with the out-of-bag (OOB) samples used for internal validation and estimation of variable importance. At each split, a random subset of variables, sized
The RSF uses the C-index to assess the predictive accuracy of the model for survival outcomes. The C-index is computed by examining each pair of samples and evaluating if the predicted risk of death aligns with the observed survival times. The risk is calculated in each tree of the RSF. Then, the CHF is summarized by a notion of mortality as a survival outcome. Let

which refers to the process of combining multiple individual survival tree models into an ensemble by aggregating cumulative risk of mortality occurring up to a given time. This aggregation process results in an improved estimate of the CHF, enhancing the prediction of mortality over time. The predicted risk for each patient is represented by the mortality value. If a patient has a higher ensemble mortality value with ACT, our model suggests opting for OBS due to the higher estimated risk of mortality compared to taking OBS. Conversely, if the mortality value with ACT is lower, our model indicates opting for ACT due to the lower risk of mortality with ACT.
To estimate prediction accuracy, the OOB estimators are typically used to calculate C-index if there is no separate test set. However, when using a totally separate test set for model evaluation, the typical approach is to use in-bag ensemble estimators with the test set. In-bag estimators are more appropriate as they use the predictions from the individual trees on the test set to compute the C-index, allowing for model evaluation on unseen data without introducing a bias.
Results
In summary, Figure 1 presents an overview flowchart that illustrates the steps of our procedure. Two datasets from NCBI GEO repository were downloaded in R via BioConductor repository of R packages. Each raw microarray dataset was preprocessed via RMA method. Two preprocessed data were combined and split into training and test data using probability sampling. About 70% of patients (

An overview flowchart illustrating the steps of our procedure.
Using the learning dataset, 2 survival ensemble algorithms were implemented to predict the risk scores associated with the ACT treatment compared to OBS. One was a bagging survival ensemble algorithm consisting of 200 Cox regression models. The other was RSF algorithm consisting of 1000 survival trees. Next, the predicted treatment recommendation was provided according to the treatment risk. If the risk for taking ACT was higher, the model predicted to OBS recommendation. Otherwise, the model predicted ACT treatment recommendation for each patient. For a conclusion, patients were then divided into 2 groups: those who followed the treatment recommendation by the model and those who did not, and the differences in survival were compared using a log-rank test.
In the learning phase, both the RSF model and the bagging survival ensemble model showed similar performance. In both models, the log rank tests showed significantly higher survival times for patients who followed the predicted treatment recommendation that was either ACT or OBS (

Survival difference of patients who followed our predicted treatment recommendation versus who did not for the learning dataset: (a) bagging survival ensemble model (top), (b) random survival forest model (bottom).
The median C-index for the bagging ensemble Cox regression model was 0.754, and the mean C-index was 0.753 with a standard deviation of 0.011. The C-index for the RSF was 0.925 that was calculated at the median survival time of 6.5 years (See Figure 3). The number of trees in the RSF was determined by examining the number of trees from 100 to 1000 trees in the learning phase. We chose 1000 trees because it had the smallest OOB error from the learning dataset. Similarly, the node size specifying the minimum number of observations in a terminal node was also determined in the learning phase by considering it from 1 to 10. In general, lowering the node size results in deeper trees, which indicates that more splits are carried out up until the terminal nodes. 39 Lastly, the number of splits considered for each candidate variable was also determined in the learning phase. By examining it from 1 to 10, ten splits were chosen.
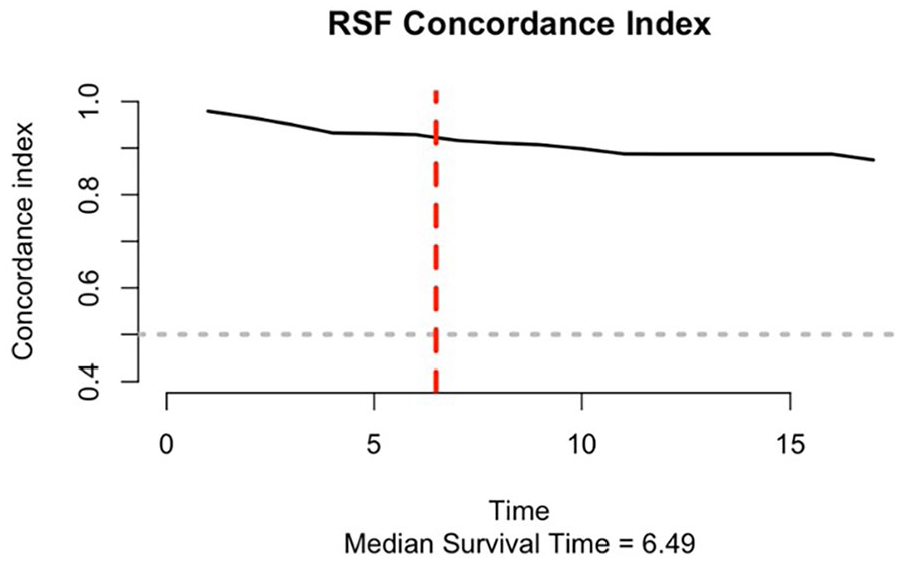
The C-index for the random survival forest.
For the separate test dataset, the overall survival for patients who followed the predicted treatment recommendation by the bagging survival ensemble Cox model was higher than the survival for patients who did not follow (See Figure 4a). However, the survival between 2 groups was marginally able to distinguish (

Survival difference of patients who followed our predicted treatment recommendation versus who did not for the test dataset: (a) bagging survival ensemble model (top), (b) random survival forest model (bottom).
On the other hand, the patients in the test dataset who followed the predicted treatment recommendation from the RSF showed significantly higher survival (
When the RSF builds an ensemble of decision trees, variable importance can be obtained based on bootstrapped samples of the original data. At each split in each tree, a random subset of variables is considered for splitting. The RSF uses log-rank statistics to assess the difference in survival times between subgroups created by the split. Variable importance in RSF is calculated by comparing the OOB error rates of the ensemble with and without the inclusion of each variable. Variables that lead to substantial increases in OOB error when removed are considered more important. The importance scores are often transformed into Z-scores. Variables with higher importance scores are more influential and have a stronger impact in predicting survival times. It is essential to consider the direction of the relationship between the variable and survival time. A positive importance score indicates that an increase in the variable value is associated with longer survival times. Comparing variable importance scores can help identify which genomic markers have a greater impact on survival. This gives guidance to prioritize which markers to focus on assigning patients treatment.
In our study, the top 20 features selected from the RSF model using the variable importance measure are presented in Table 2. These features include both clinical variables such as cancer stage and patient age, and specific genes that may play crucial roles in lung cancer prognosis.
Top 20 features selected from RSF using variable importance measure.

For example, Eukaryotic translation initiation factor 4A3 (EIF4A3) is involved in the initiation of translation, a critical process for protein synthesis. Its role in cancer could be linked to its involvement in cellular growth and proliferation. Kynureninase (KYNU) is an enzyme in the tryptophan catabolism pathway, which has been implicated in immune response and cancer biology. Methyltransferase like 9 (METTL9) is involved in the methylation of proteins, which is a key post-translational modification that can affect gene expression and protein function. Ras homolog gene family member F (RHOF) is associated with the formation of filopodia, which are actin-rich structures involved in cell migration and invasion, processes that are critical in cancer metastasis. Tumor necrosis factor alpha-induced protein 8 (TNFAIP8) has been linked to apoptosis and immune regulation, processes that are often dysregulated in cancer. Adenylate cyclase 3 (ADCY3) is involved in cyclic AMP (cAMP) signaling, which can influence cell proliferation and survival. Transforming growth factor beta 2 (TGFB2) is a cytokine that plays a significant role in cell growth, differentiation, and immune regulation, and is known to be involved in cancer progression.
In future studies, gene enrichment analyses, including Gene Ontology (GO) enrichment analysis, pathway analysis, or protein-protein interaction network analysis, could be considered to further understand the biological significance of these genes. These procedures can help identify whether the selected genes are overrepresented in certain biological pathways or functional categories, providing insights into the underlying biological processes associated with lung cancer prognosis.
Discussion
The utilization of ensemble machine learning algorithms, specifically the ensemble bagging algorithm with penalized Cox regression and Radom Survival Forests (RSF), has proven to be a powerful approach in predicting treatment recommendations for lung cancer patients in the realm of personalized medicine. The primary goal of this research is to predict treatment recommendations for lung cancer patients after surgical resection by integrating various ensemble machine learning algorithms. These algorithms can help to optimally assign individualized patient treatment to maximize efficacy for chemotherapy after surgical resection.
The significance of this project lies in its contribution toward personalized medicine by developing more effective therapies that can replace one-size-fits-all drugs with individualized treatments accounting for specific patient needs for chemotherapy. For this project, we compiled 2 genomic datasets (GSE14814 and GSE68465) from the NCBI. The analysis of these datasets provided a robust foundation for our models, supporting complex clinical decision-making for cancer treatment after surgery by addressing population heterogeneity.
This research contributes substantially to the advancement of cancer treatments by aiming to improve treatment efficacy and reduce toxicity risks in a targeted group of patients, thereby providing better support for the complexity of clinical decision-making. By implementing a bagging ensemble algorithm with regularized Cox regression and the RSF, risk scores were estimated to subgroup patients into adjuvant chemotherapy (ACT) or observation only (OBS) treatment groups. Patients who followed their predicted treatment recommendation survived significantly longer than those who did not follow the recommendation in the RSF model (
Our results reveal a significant survival benefit for patients who adhered to the treatment recommendations derived from our models. This underscores the potential of incorporating predictive analytics into clinical decision-making processes. Both models utilized in this research not only demonstrated efficacy in forecasting patient outcomes but also unveiled valuable insights into treatment-related markers, particularly identified through the RSF model.
Our models are crucial for identifying key prognostic factors and predicting patient outcomes, which can significantly enhance clinical decision-making processes. By accurately predicting survival times and identifying high-risk patients for ACT, these models enable personalized treatment plans designed for individual patient profiles. This personalized approach can improve patient outcomes by optimizing treatment efficacy and resource allocation. Additionally, the models can aid in early detection of adverse outcomes, allowing for timely interventions that could potentially save lives. The integration of these predictive models into clinical practice provides a robust tool for clinicians, facilitating data driven decisions that enhance the quality of patient care. These models’ ability to handle high-dimensional data and accommodate complex interactions among variables further underscores their practical utility in a clinical setting, making them valuable assets in advancing personalized medicine and improving overall healthcare outcomes.
While our study demonstrates the potential of ensemble machine learning algorithms in predicting treatment recommendations for NSCLC patients, several limitations should be considered to provide a comprehensive understanding of our research implications.
One limitation is the potential for data biases. Our models were developed using specific datasets (GSE14814 and GSe68465) that may not fully represent the broader population of NSCLC patients. The demographic and clinical characteristics of the patients in these datasets could introduce biases that affect the generalizability of our findings.
Another limitation is related to the assumption inherent in the ensemble machine learning algorithm used in this study. Cox regression assumes proportional hazards, which might not hold true for all patients. To relax such an assumption, we introduced the RSF that is a non-parametric approach and does not require such an assumption.
Potential confounders also present a limitation. Although our models incorporate various clinical and demographic factors, there may be unmeasured variables that influence treatment outcomes, such as environmental exposures, lifestyle factors, and adherence to treatment protocols. These unmeasured confounders could bias the model’s predictions.
To address these limitations, future research should focus on several key areas. First, efforts should be made to validate our predictive models using larger and more diverse datasets that better represent the heterogeneity of NSCLC patients. This will help mitigate data biases and improve the generalizability of the models. Second, more advanced modeling approaches, such as deep learning models, might capture complex interactions more effectively in order to enhance predictive accuracy.
Lastly, incorporating additional data sources, such as environmental and lifestyle factors, into the models could help account for potential confounders. This more comprehensive approach to data integration will provide a broad aspect of the factors influencing treatment outcomes.
In a future study, we will conduct a comparative analysis of the RSF model with several advanced models in this field. Two candidate models for the comparative analysis will be DeepSurv and Gradient Boosting Machine (GBM). DeepSurv is a survival neural network that uses a deep learning-based Cox proportional hazards model to capture complex interactions among covariates. GBM is an ensemble technique that builds models sequentially to minimize prediction errors.
Conclusion
Our study highlights the promising role of ensemble machine learning algorithms in enhancing personalized treatment strategies for non-small cell lung cancer (NSCLC) patients. The observed survival advantages emphasize the clinical relevance of our predictive models. Moreover, the identification of treatment-related genomic markers adds a layer of precision to the personalized medicine landscape.
Integrating these findings into clinical practice has the potential to significantly improve patient outcomes and contribute to the ongoing paradigm shift toward more tailored and effective treatments in lung cancer intervention. This research benefits individual patients by optimizing their treatment plans and has broader public health implications. By improving the precision and effectiveness of cancer treatments, we can reduce the overall healthcare burden associated with ineffective treatments and recurrent disease. Additionally, the application of these advanced predictive models can lead to more efficient use of medical resources, ensuring that patients receive the most appropriate therapies based on their unique genetic profiles and clinical characteristics.
As we delve deeper into the era of personalized medicine, the amalgamation of genomic data and advanced predictive analysis stands as a beacon for more informed and optimized clinical decisions. This shift toward personalized treatment regimens can enhance the quality of life for patients, increase survival rates, and pave the way for a more sustainable healthcare system. Moreover, the success of such predictive models in NSCLC can serve as a model for other cancers and complex diseases, promoting a wider adoption of personalized medicine approaches across the medical field.
Our study demonstrates significant survival benefits for patients adhering to treatment recommendations derived from our predictive models, which utilize genomic microarray data combined with clinical and demographic information. The integrative approach emphasizes the importance of precision medicine in improving patient outcomes by customizing treatments based on individual genetic profiles and other relevant factors.
Despite these promising results, several limitations should be considered when interpreting our findings. One concern is the representativeness of our sample. The genomic and demographic characteristics of the patients in our study may not fully capture the diversity of the broader NSCLC patient population. This potential lack of representativeness could limit the external validity of our models.
Additionally, the use of genomic microarray data, while providing valuable insights into the genetic underpinnings of disease and treatment response, may introduce biases related to the specific array platform and the selected genomic markers. Variations in these factors across different populations could affect the applicability of our models in other settings.
To address these limitations, future research should aim to validate our predictive models in larger and more diverse target populations. This will help ensure that the models are robust and generalizable across different populations and clinical contexts. Another important consideration is the potential impact of environmental and lifestyle factors that were not accounted for in our study. These factors can significantly influence treatment outcomes and should be integrated into future models to provide a more holistic approach to personalized medicine.
In our study, we chose to focus on the C-index as it is a widely accepted and robust metric for evaluating the performance of survival models. It is particularly suitable for assessing the predictive accuracy of survival model and has been extensively validated in various studies as a standard performance metric for survival models, providing a reliable benchmark for comparing model performance (Harrell et al, 57 Uno et al 58 ). While the C-index provides valuable insights into model performance, additional metrics such as the integrated Brier score and area under the time-dependent AUC can offer complementary information. The integrated Brier score evaluates the accuracy of probabilistic predictions over time, while the time-dependent AUC measures the model’s discriminative ability at different time points. We defer the use of these additional metrics to future studies to provide a more comprehensive evaluation of our models.
In order to effectively integrate our findings in this study into clinical practice, it is essential to develop user-friendly interfaces and decision support systems that can be seamlessly incorporated into routine clinical workflow. Training clinicians on the use of these predictive models and ensuring continuous updates with new data will maintain their accuracy and relevance. Furthermore, validating our models in larger and more diverse populations will enhance their robustness and generalizability. By incorporating environmental and lifestyle factors, we can provide a more comprehensive approach to personalized medicine. Ultimately, the integration of these advanced predictive models into clinical practice has the potential to improve patient outcomes, optimize treatment efficacy, and contribute to the broader adoption of precision medicine, thereby enhancing the quality of care for NSCLC patients and potentially serving as a model for other cancers and complex diseases.
Footnotes
Acknowledgements
Hojin Moon’s research was partially supported by the Research, Scholarship, and Creative Activity (RSCA) Award from CSULB.
Author Contribution(s)
Hojin Moon and Lauren Tran had full access to all of the data in the study and take responsibility for the integrity of the data and the accuracy of the data analysis.
Concept and design: Moon and Tran.
Acquisition, analysis or interpretation of data: All authors.
Drafting of manuscript: Moon and Tran.
Critical Review of the Manuscript for important intellectual content: Moon and Tran.
Statistical analyses and Visualization: All authors.
Administrative, technical, or material support: Moon
Supervision: Moon
All authors have read and agreed to the published version of the manuscript.
Funding:
The author(s) received no financial support for the research, authorship, and/or publication of this article.
Declaration Of Conflicting Interests:
The author(s) declared no potential conflicts of interest with respect to the research, authorship, and/or publication of this article.
Availability of Data and Materials
Data are available upon reasonable request for access to the datasets used in this study.
Ethics Approval and Consent to Participate
Not applicable.
Consent for Publication
Not applicable.