
Abstract
Objectives
This study aimed to assess the impact of interlaboratory differences (in analysis technique and reference intervals [RIs]) on the measurement of serum creatinine (sCr) and serum symmetric dimethylarginine (sSDMA) concentrations in cats and on classification by stage of chronic kidney disease (CKD).
Methods
For the interlaboratory discrepancy study, samples from 30 client-owned cats (healthy or diagnosed with CKD) with sCr in the range of 130–200 µmol/l and urine specific gravity <1.035 were retrospectively selected. A single batch of samples was analysed for sCr and sSDMA with one in-house laboratory machine and in three commercial laboratories. In addition, sCr values from 63 healthy cats aged ⩾10 years were used to calculate an age-specific RI for the in-house analyser.
Results
Despite a relatively good correlation (interclass correlation coefficient [ICC] = 0.875), the in-house analyser consistently reported lower sCr values, while for sSDMA, systematically higher values were obtained in one commercial laboratory (ICC = 0.707). A total of 22/30 (73%) cases had at least one laboratory reporting inconsistent sSDMA values in relation to the RI, and 23/30 (77%) for sCr. For subsequent staging using sSDMA, at least 1/4 laboratories indicated a different stage in 22/30 (73%) cases. For sCr, all laboratories classified the cats as stage 2; however, the in-house analyser classified 8/30 (27%) cats as stage 1. The RI (71–212 µmol/l) provided by the company for sCr measurement on the in-house machine was subsequently recalculated, resulting in a considerably lower upper limit (163 µmol/l) and a significantly (adjusted P value = 0.016) different proportion of cats with measurements outside the RI.
Conclusions and relevance
Clinicians must be careful when interpreting sCr and sSDMA values, as they may lead to discrepant outcomes due to interlaboratory variability. Moreover, age-specific RIs should be applied when available, facilitating the early detection of CKD in older cats.
Introduction
Chronic kidney disease (CKD) is a prevalent and progressive condition in cats, affecting all age groups, but particularly senior cats.1 –3 Accurate diagnosis and early management of CKD are crucial for improving the quality of life and prognosis for affected cats. 4 Traditionally, diagnosis is based on the combination of urine specific gravity (USG) <1.035 and increased serum creatinine (sCr) levels, as measurement of the glomerular filtration rate (GFR) is not feasible for everyday practice.5,6 Serum symmetric dimethylarginine (sSDMA), a more recent biomarker, has gained attention for its purported ability to detect renal dysfunction earlier, 7 although this superiority could not be confirmed by Brans et al. 8 Nevertheless, International Renal Interest Society (IRIS) guidelines provide a well-established framework for the staging of patients with confirmed CKD using sCr and sSDMA, with specific therapeutic interventions for each stage. 9
Despite advances in diagnostic methodologies, inter-laboratory discrepancies in the measurement of these biomarkers remain a significant issue, as documented in previous studies.10,11 Bias in sCr and sSDMA values can arise from differences in analytical techniques and a lack of calibration and standardisation.10,12 These discrepancies can lead to inconsistent diagnostic outcomes, complicating the assessment of disease severity and initiation of therapeutic interventions. Furthermore, variability between reference intervals (RIs) introduces additional complexity, particularly when measurements approach the upper limit of the RI. 13 Moreover, age-specific RIs, appropriate for different stages of life, and longitudinal evaluation of measurements, especially sCr values, exhibiting a high index of individuality have gained increased attention to ensure better diagnosis and monitoring of CKD.14 –16 The impact of interlaboratory discrepancies in sCr and sSDMA measurements on clinical decision-making in the context of feline CKD remains to be demonstrated. However, understanding these discrepancies is essential for improving diagnostic consistency, ensuring better patient management.
Therefore, the aim of this study was to investigate the effect of interlaboratory variability in sCr and sSDMA values on the classification of cats by laboratory-specific RIs (ie, within the RI or increased values) and IRIS-defined cut-offs for staging (ie, stage 1 or 2) (discrepancy study). A secondary aim was to calculate an age-specific RI for sCr for the in-house analyser (Catalyst Dx Chemistry Analyzer; IDEXX) for cats aged ⩾10 years (RI study).
Materials and methods
Ethical approval
Ethical approval was obtained from the ethical committees of the Faculties of Veterinary Medicine and Bioscience Engineering and the Deontological Committee (EC2020/081).
Study sample
Leftover serum samples were used from client-owned healthy cats (aged ⩾10 years) and cats with CKD (aged ⩾5 years) that had been participating in a longitudinal study with 6-monthly evaluations between October 2021 and January 2024. Cats had been recruited via the Small Animal Clinic at the Faculty of Veterinary Medicine, Ghent University, and through first- and second-opinion veterinary practices located in Flanders, Belgium. For all evaluation visits conducted outside the Faculty, a mobile team comprising the same veterinarians and researchers as at the Small Animal Clinic carried out on-site health screenings and collected blood and urine samples using standardised procedures. Owners were instructed to keep their cat fasted for at least 12 h before the appointment and were asked to complete a questionnaire related to their cat’s health status, living environment, daily activity, feeding practices and disease history at each time point during the longitudinal study.
To assess a cat’s general health status, the following examinations were performed: physical examination (including blood pressure measurement using Doppler ultrasound); complete blood count; serum biochemistry; and urinalysis (including dipstick testing, urinary protein:creatinine [UPC] measurement, determination of USG, microscopic sediment analysis and bacterial culture). Feline leukaemia virus and feline immunodeficiency virus testing was performed at baseline only. Blood samples were collected 30 mins after topical application of EMLA cream (AstraZeneca) via jugular or cephalic venepuncture using a 10 ml syringe with a 23 G needle. 17 Sterile urine was obtained through ultrasound-guided cystocentesis using a 10 ml syringe with a 22 G needle. Both samples were collected within a time frame of 15 mins and underwent subsequent centrifugation (447 g for 3 mins at room temperature for urine, 2190 g for 5 mins at 2°C for serum). For the inclusion and longitudinal follow-up samples, all laboratory analyses were conducted at a commercial laboratory (Medvet, Antwerp), except for dipstick testing (VetLab UA-Analyzer; IDEXX), measurement of USG (Atago Master SUR/NM handheld refractometer) and microscopic sediment analysis, which were performed at the in-house laboratory of the Small Animal Clinic. The remaining blood and urine were aliquoted into plastic Eppendorf tubes and stored at −80°C for 1–2.5 years until use in the present study.
Interlaboratory discrepancy study
From the longitudinal study, 30 cats were selected with a USG <1.035 and sCr values in the range of 130–200 µmol/l, as this interval contained the cut-off point between IRIS stages 1 and 2 and the upper limit of the RI (164.4 µmol/l) used to initially diagnose CKD in cats during the evaluation visits. Cats included in this study were either healthy or diagnosed with CKD. No other abnormalities were allowed based on the above examinations, except for CKD-related abnormalities, such as hypertension, hyperphosphataemia or proteinuria.
Aliquots containing a minimum of 300 µl of serum were defrosted. On the same day, samples were analysed in the in-house laboratory of the Small Animal Department at Ghent University (laboratory 1) and transported as a single batch at room temperature to Medvet (Antwerp; laboratory 2), IDEXX Laboratory (Leipzig; laboratory 3) and Zoolyx (Aalst; laboratory 4). Analysis was conducted promptly after the samples arrived. Laboratory 2 had originally measured the initial sCR and sSDMA levels of the cats in the longitudinal study but remeasured them in the batch of samples provided for the current study. The method used by each laboratory to measure sCr and sSDMA, and the laboratory-specific RIs that were employed, are presented in Table 1. For laboratory 3, the RI provided by the company and an age-specific RI for cats aged ⩾7 years, were compared. 15
Laboratory-specific reference intervals (RIs) for serum creatinine (sCr) and serum symmetric dimethylarginine (sSDMA) and analytical methods

For laboratory 3, the RI provided by the company (*), as well as the age-specific RI for cats aged ⩾7 years (†) are presented
LC-MS/MS = liquid chromatography-tandem mass spectrometry
Age-specific RI for sCr
To determine an age-specific RI for sCr on the in-house analyser, sCr values from a population of healthy senior cats aged ⩾10 years (n = 63) were used, based on the Feline Life Stage Guidelines of the American Animal Hospital Association and the American Association of Feline Practitioners, 18 as well as previous studies determining age-specific RIs 15 or comparing age-related differences using 10+ years as a cut-off point.19 –23 The age-specific RI study and interlaboratory discrepancy study did not have any cats in common. All cats had at least one follow-up visit after inclusion in the present study. Cats with a persistent decreased USG (<1.035), a combination of USG <1.035 with sCr ⩾140 µmol/l, sSDMA ⩾18 µg/dl or proteinuria (UPC >0.4) were excluded to avoid the potential inclusion of cats with CKD. Preventive medication (vaccination, deworming, tick and flea prevention) was allowed up to 1 week before presentation.
Statistical analysis
Statistical analysis was performed using R (version 2023.03.0) and MedCalc (version 22.003). Normality of the data distribution was assessed using the Shapiro–Wilk test, histograms and Q-Q plots. To assess interlaboratory variability, a random effects model was employed, incorporating serum samples, laboratory and their interaction as random effects. Then, interclass correlation coefficients (ICCs) were derived from the restricted maximum likelihood estimates of the variance components. The ICC was considered poor for values below 0.5, moderate between 0.5 and 0.75, good between 0.75 and 0.9, and excellent when above 0.9. 24 The differences between various laboratory measures of sCr and sSDMA were calculated using ANOVA with post-hoc Tukey HSD (Honestly Significant Difference) tests and further visualised through boxplots. We also calculated the absolute number and percentage of cats in which different sCr and sSDMA values led to a discrepant classification and CKD stage, according to the IRIS guidelines. To evaluate differences in the proportions of cats with measurements of sCr and sSDMA outside the RI, χ2 tests with pairwise comparisons for proportions were performed. As samples were remeasured at laboratory 2, a paired t-test (normal distribution, sSDMA) and paired Wilcoxon signed rank test (not normally distributed, sCr) were performed to evaluate statistical differences between original and present measurements.
An age-specific RI for sCr measurements using the in-house analyser at laboratory 1 was determined following the guidelines of the American Society of Veterinary Clinical Pathology (ASVCP). 25 Since the sample size was ⩾40 but <120, a robust method with a 90% confidence interval (CI) of reference limits was used for 95% RI determination. 26 This method involves an iterative process, in which the initial central value is estimated by the median and the initial spread by the median absolute deviation about the median. Outliers were evaluated using the method of Reed et al. 27 Outliers flagged as ‘suspicious’ by the software were retained for analysis, while far outliers were excluded from the data set, in accordance with ASVCP guidelines. 25
Results
Population demographics
Serum samples from 30 and 63 client-owned cats were included for the discrepancy and RI studies, respectively. Population characteristics are reported in Table 2.
Population demographics of all cats included in the discrepancy and reference interval (RI) studies

Data are n or median (range). sCr and sSDMA values are reported as median values across all four laboratories for the discrepancy study
BLH = British Longhair; BSH = British Shorthair; DLH = domestic longhair; DSH = domestic shorthair; sCr = serum creatinine; sSDMA = serum symmetric dimethylarginine; USG = urine specific gravity
sSDMA and sCr values were measured in batch in all four laboratories. Although samples were measured twice in laboratory 2 (ie, at the initial health screening and for this study), there was no significant difference between both measurements for sCr and sSDMA (P = 0.175 and 0.059, respectively). Median values for individual cats across all four laboratories were in the range of 141.9–209.1 µmol/l for sCr and 9.0–19.7 µg/dl for sSDMA. For each laboratory, a boxplot of the measured values was constructed (Figure 1a,b), as well as a boxplot of values that deviated from a collective mean value for sCr or sSDMA derived from all laboratories combined (Figure 1c,d). Median and ranges for sCr and sSDMA for each individual laboratory are presented in Table 3. For sSDMA, higher values were noted when aliquots from the same sample were sent to laboratory 4 compared with the other laboratories. For sCr on the other hand, lower values were observed for the in-house analyser in laboratory 1. This analyser also had the highest upper limit of the RI for sCr (71–212 µmol/l), which necessitated a re-evaluation of these intervals and determination of a new RI for our population. Determination of ICC values showed a good correlation between the different laboratories for sCr (ICC = 0.875), but a moderate correlation for sSDMA (ICC = 0.707).
Median and range of all serum creatinine (sCr) and serum symmetric dimethylarginine (sSDMA) measurements per laboratory

Data are median (range)

Boxplot representation of (a) serum creatinine (sCr) and (c) serum symmetric dimethylarginine (sSDMA) measurements for each laboratory, and of the deviations of (b) sCr and (d) sSDMA per laboratory from the mean value across all laboratories (red dashed line)
A significant difference (P <0.001) between laboratory measurements was confirmed by ANOVA for both analytes. Post-hoc Tukey HSD tests revealed that for the measurement of sCr, the discrepancy was significant (adjusted P <0.001) between laboratory 1 and all other laboratories. For sSDMA, a significant difference (adjusted P <0.001) was noted between laboratory 4 and the remaining laboratories (Table 4; Figure 2a,b).
Post-hoc comparisons using the Tukey HSD test after ANOVA to evaluate the difference in serum creatinine (sCr) and serum symmetric dimethylarginine (sSDMA) measurements between laboratories
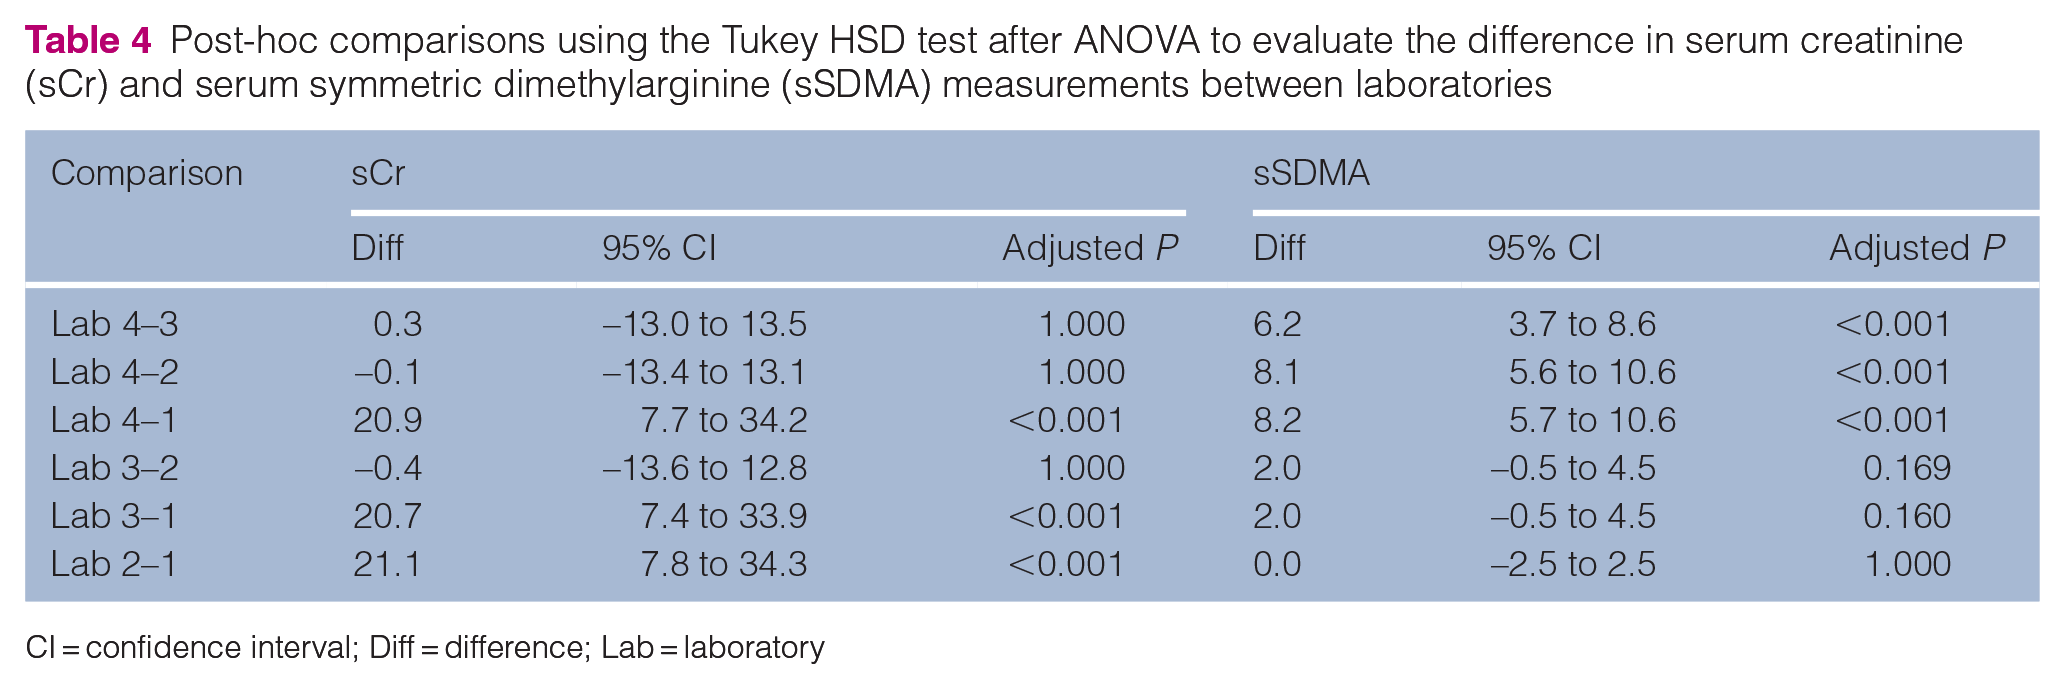
CI = confidence interval; Diff = difference; Lab = laboratory

Differences in serum creatinine (sCr) and serum symmetric dimethylarginine (sSDMA) measurements between laboratories. The 95% family-wise confidence intervals (CIs) of the difference in means of (a) sCr and (b) sSDMA between laboratories are presented, resulting from ANOVA with the post-hoc Tukey HSD test. Any CIs that do not contain 0 provide evidence of a difference in the groups. Bar plots of the number of cases that have values of (c) sCr and (d) sSDMA that fall within or above the reference interval (RI) of each laboratory are also presented. For laboratories 1 and 3, the RI provided by the company (1a and 3a), as well as the age-specific RI for cats aged ⩾10 years (1b, newly determined RI for sCr) and ⩾7 years (3b, for sCr and sSDMA), are presented
When we evaluated whether a measurement of sCr would fall within or above the laboratory-specific RI (Figure 2c,d), it was found that contradictory diagnostic conclusions were reached in at least one laboratory in 23/30 (77%) cases. Increased sCr values above the RI occurred in three laboratories at most, but never in all four, independent of which RI was used for laboratory 3. In total, 0/30 (0%) cats in laboratory 1, 19/30 (63%) cats in laboratory 2, 1/30 (3%) cats in laboratory 3 when applying the RI provided by the company, 18/30 (60%) in laboratory 3 with the age-specific RI and 19/30 (63%) in laboratory 4 had increased sCr values. When the newly determined age-specific RI was applied to evaluate sCr measurements from laboratory 1, the number of cats with elevated sCr values increased from 0/30 (0%) to 8/30 (27%) (Figure 2c, laboratory 1a and 1b, respectively). Of the 19 cats with increased sCr in laboratories 2 and 4, only 15 had increased values in both laboratories. With regard to sSDMA, 22/30 (73%) measurements yielded inconsistent diagnostic interpretation in at least one laboratory, with 8/30 (27%) having increased sSDMA in laboratory 1, 10/30 (33%) in laboratory 2, 12/30 (40%) in laboratory 3 when using the RI from the company while this was 6/30 (20%) for the age-specific RI, and 27/30 (90%) in laboratory 4.
Significant (adjusted P <0.001) interlaboratory discrepancies for the classification of both analytes with regard to the RI were confirmed using the χ2 test. Specifically, the post-hoc pairwise comparisons for proportions revealed significant differences for sCr between multiple laboratories (Table 5), including between laboratory 1a and 1b (adjusted P = 0.016), the latter being the age-specific RI calculated in this study. For sSDMA, only laboratory 4 revealed significant (adjusted P <0.001) differences in the classification compared with all other laboratories (Table 5).
Post-hoc pairwise comparisons of proportions following the χ2 test to compare the proportion of animals with results falling above the RI between laboratories

Values in italic font = sCr; values in regular font = sSDMA
Lab = laboratory; RI = reference interval; sCr = serum creatinine; sSDMA = serum symmetric dimethylarginine
The potential impact of the measured sCr and sSDMA concentrations on IRIS staging of stage 1–2 CKD is shown in Table 6. As not all cats had a confirmed diagnosis of CKD, the staging was performed merely to demonstrate the impact of interlaboratory discrepancies and does not reflect the actual clinical context. For staging based on sSDMA, more inconsistencies were observed across laboratories than with sCr. Specifically, sSDMA values from at least 1/4 laboratories indicated a different stage in 22/30 (73%) cases.
Resulting stages when using serum creatinine (sCr) or serum symmetric dimethylarginine (sSDMA) values for each laboratory following the International Renal Interest Society guidelines for staging
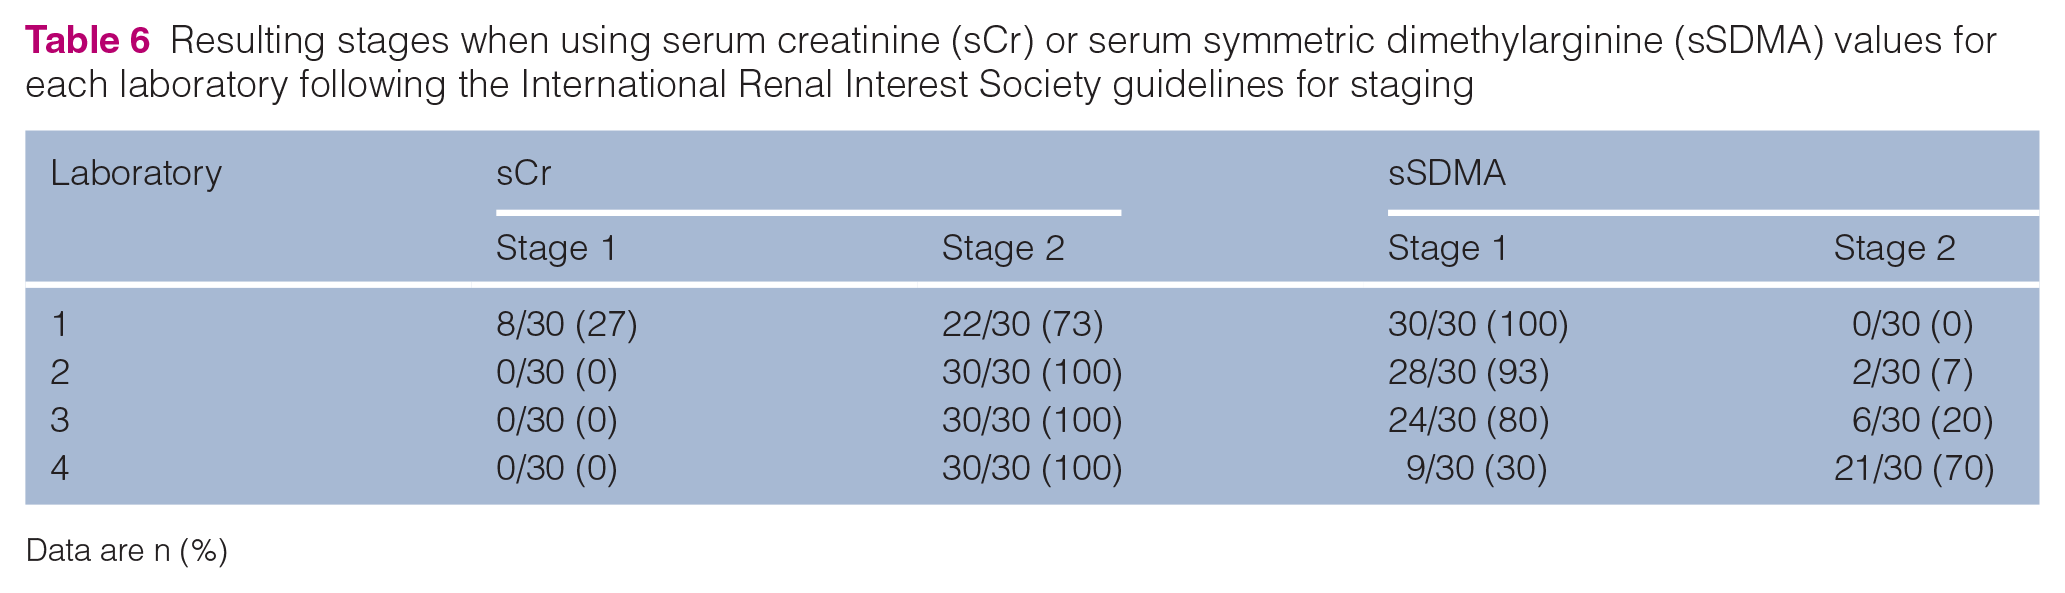
Data are n (%)
Age-specific RI sCr
Data from 63 healthy senior cats aged ⩾10 years were included. sCr values were normally distributed (Figure 3), confirmed by the Shapiro–Wilk test (P = 0.834). There were no outliers in the data set.

Histogram of serum creatinine values from all healthy senior cats aged ⩾10 years (n = 63)
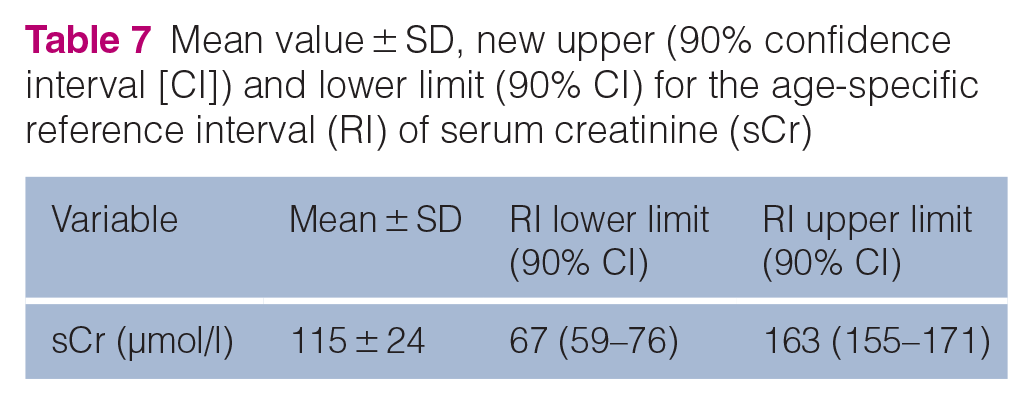
The mean value and SD of sCr and the age-specific 95% RI with 90% CI of the reference limits are presented in Table 7. Compared with the RI provided by the company (71–212 µmol/l), the upper limit of the age-specific sCr RI was considerably lower (163 µmol/l), while the lower limits of both RIs were similar.
Mean value ± SD, new upper (90% confidence interval [CI]) and lower limit (90% CI) for the age-specific reference interval (RI) of serum creatinine (sCr)
Discussion
Our results revealed interlaboratory differences either in terms of actual concentration of the analytes or in terms of frequency of abnormal results compared with the corresponding RI. Moreover, we demonstrated that these differences may impact the diagnosis of CKD, as researchers or clinicians typically use the laboratory’s upper RI as the threshold to differentiate between normal and abnormal values. Although the staging in this study reflects an artificial scenario for research purposes, not representative of how staging should be applied in clinical practice (ie, after confirmation of CKD diagnosis), significant differences between laboratories were demonstrated in terms of staging. As the IRIS system uses fixed values to indicate thresholds for CKD stages, these cut-off values may not accurately divide cats into CKD stages due to inherent variability in analyte measurement across laboratories. This is significant since the IRIS thresholds are widely used for staging, and the bias associated with different laboratory measurements can impact clinical interpretation and thereby influence therapeutic decisions, such as the initiation of a renal diet from stage 2 onwards, as recommended by the IRIS board. The findings of this study therefore demonstrate that fixed thresholds for clinical decision-making may be inadequate and must be adapted to the reality of each individual laboratory and analyte, in addition to sCr and sSDMA.
It is important to consider the various analytical techniques employed in different laboratories as a source of the interlaboratory variability in sCr and sSDMA measurements. Although this study did not directly assess the exact influence of these methodological differences on the variability observed, which has been described in previous studies, these analytical discrepancies may contribute to the differences in clinical outcome. For sCr, the enzymatic and Jaffe methods are the two most-used techniques. The Jaffe method, an older technique, is known to be more susceptible to interference from non-creatinine chromogens, particularly at lower creatinine concentrations.28 –30 These chromogens, such as proteins, glucose and ketones, can lead to an overestimation of sCr values.
Similarly, discrepancies depending on the analytical methods have been described for sSDMA. For instance, ELISA methods have been reported to yield higher SDMA concentrations than liquid chromatography-tandem mass spectrometry (LC-MS/MS), which is considered the gold standard, although this method is less widely available. 31 This was also seen in our study, as the mean value for laboratory 2, using the LC-MS/MS method, was the lowest and significantly (P <0.001) different from laboratory 4. Furthermore, a poor correlation between LC-MS/MS and ELISA, 32 the inability of the ELISA method to distinguish L-arginine, SDMA and asymmetric dimethylarginine (ADMA), 31 and other interfering factors such haemolysis 33 have been observed in human and canine studies. In addition, Ernst et al 34 demonstrated that sSDMA concentrations measured using the IDEXX SDMA Test (method used in laboratory 3) were more accurate and more precise in macroscopically normal serum than those measured with the DLD SDMA ELISA (method used in laboratory 4) when compared with the reference method of LC-MS.
As well as the differences in measuring sCr and sSDMA, there was also variability in the RIs provided by the commercial laboratories. These RIs are frequently utilised in clinical practice and are designed to be broad to accommodate the inherent variability in patient populations, including differences in age, breed and sex. This approach helps to prevent the misclassification of healthy individuals with physiological variations, such as breeds with inherently higher creatinine levels, as potentially azotaemic. Consequently, these broad RIs may be unable to identify the early stages of CKD, emphasising the need for population-specific RIs. In the light of the variability in kidney function associated with a reduction in muscle mass, age-specific RIs are instrumental in enhancing diagnostic accuracy in the older feline population, thereby facilitating timely intervention and more effective disease management. We calculated an age-specific RI for sCr for cats aged ⩾10 years because of the discrepancy between the RIs provided by the analyser supplier and the values observed in this study. Furthermore, as Marino et al 3 reported a significantly higher prevalence of CKD in cats aged 15–20 years (81%) than in younger groups, a separate RI for this age group could provide additional clinical value. However, this could not be calculated because of an insufficient sample size. It is also noteworthy that the RIs may be influenced by specific populations within a certain geographic region; therefore, the results of our study may reflect characteristics that are unique to our region-based population.
In the light of the growing emphasis on regular health screenings for pets, including routine bloodwork, especially in the older population, the use of serial biomarker assessment has become increasingly evident. This shift allows veterinarians to monitor trends in individual patients over time rather than relying solely on single-point measurements. Given that population-based RIs are less diagnostically sensitive for measurements with high individuality, such as sCr, implementing patient-based RIs may offer a more accurate approach to detect subtle changes indicative of early disease onset while accounting for individual biological variability.
To determine the age-specific RI, only cats with at least one follow-up visit were included. This enabled the identification and exclusion of cats that developed CKD. As a result of the time-consuming and labour-intensive nature of the procedure, it was not feasible to perform measurements of GFR for the discrepancy and RI studies. This could have provided more certainty on the presence or absence of early non-azotaemic CKD in the included cats. Sample sizes were also limited in both populations. Although storage at –80°C could be a potential source of bias, it likely did not influence the results in this study as all samples were processed in a single batch and analysed promptly upon arrival. While sCr and sSDMA had already been determined in laboratory 2 at the time of the initial visit for the longitudinal study, all samples underwent a second round of analysis to avoid potential confounding effects of differing storage times. Finally, this study did not investigate the effect of interlaboratory discrepancies on more advanced stages of CKD.
Conclusions
This study highlights interlaboratory variability in sCr and sSDMA measurements, leading to discrepant outcomes in the classification (ie, increased or normal renal values) and staging (stage 1 or 2) of feline CKD. These inconsistencies arise from laboratory-specific differences in measured values for sCr and sSDMA and the application of broad-population RIs, utilised for clinical decision-making. It is thus recommended that the same laboratory should be used consistently, that age-specific RIs should be adopted where available and that patient-based RIs should be employed in cases of serial monitoring, with the objective of enhancing the accuracy of CKD diagnosis.
Footnotes
Acknowledgements
The authors wish to thank the owners of the cats that donated blood and urine samples to conduct this study and the veterinarians for referring their patients to us to make this study possible.
Conflict of interest
The authors declared no potential conflicts of interest with respect to the research, authorship, and/or publication of this article.
Funding
This research was funded by the Research Foundation – Flanders (FWO, FWO SBP 2020 006001) and by the Special Research Fund of Ghent University (BOF, DOC 2020 004701).
Ethical approval
This work involved the use of non-experimental (owned or unowned) animals. Established internationally recognised high standards (‘best practice’) of veterinary clinical care for the individual patient were always followed and/or this work involved the use of cadavers. Ethical approval from a committee was therefore not specifically required for publication in JFMS. Although not required, where ethical approval was still obtained, it is stated in the manuscript.
Informed consent
Informed consent (verbal or written) was obtained from the owner or legal custodian of all animal(s) described in this work (experimental or non-experimental animals, including cadavers, tissues and samples) for all procedure(s) undertaken (prospective or retrospective studies). No animals or people are identifiable within this publication, and therefore additional informed consent for publication was not required.