
Abstract
Objectives
Previous studies have identified various bacterial taxa that are altered in cats with chronic enteropathies (CE) vs healthy cats. Therefore, the aim of this study was to develop a targeted quantitative molecular method to evaluate the fecal microbiota of cats.
Methods
Fecal samples from 80 client-owned healthy cats and 68 cats with CE were retrospectively evaluated. A panel of quantitative PCR (qPCR) assays was used to measure the fecal abundance of total bacteria and seven bacterial taxa: Bacteroides, Bifidobacterium, Clostridium hiranonis, Escherichia coli, Faecalibacterium, Streptococcus and Turicibacter. The nearest centroid classifier algorithm was used to calculate a dysbiosis index (DI) based on these qPCR abundances.
Results
The abundances of total bacteria, Bacteroides, Bifidobacterium, C hiranonis, Faecalibacterium and Turicibacter were significantly decreased, while those of E coli and Streptococcus were significantly increased in cats with CE (P <0.027 for all). The DI in cats with CE was significantly higher compared with healthy cats (P <0.001). When the cut-off value of the DI was set at 0, it provided 77% (95% confidence interval [CI] 66–85) sensitivity and 96% (95% CI 89–99) specificity to differentiate the microbiota of cats with CE from those of healthy cats. Fifty-two of 68 cats with CE had a DI >0.
Conclusions and relevance
A qPCR-based DI for assessing the fecal microbiota of cats was established. The results showed that a large proportion of cats with CE had an altered fecal microbiota as evidenced by an increased DI. Prospective studies are warranted to evaluate the utility of this assay for clinical assessment of feline CE.
Introduction
Chronic enteropathy (CE) is a common syndrome in cats, characterized by clinical signs including weight loss, vomiting, diarrhea and/or anorexia for >3 weeks in cats where metabolic, parasitic and extra-intestinal diseases have been ruled out.1–3 In cats, CE is commonly classified as food-responsive, steroid-responsive (previously inflammatory bowel disease [IBD]) or alimentary small cell lymphoma (SCL). Although the complete etiopathogenesis of CE remains unclear, CE is considered a multifactorial condition, in which genetics, environment and gut microbiome all contribute. 1
Intestinal dysbiosis, which is defined as compositional and functional alteration of the normal intestinal microbiome, has been associated in various diseases in humans,4,5 dogs6,7 and cats.8–11 Studies using 16S rRNA gene sequencing, fluorescence in situ hybridization or bacterial culture documented dysbiosis in various conditions in cats, including acute and chronic diarrhea, 12 IBD,9,13,14 SCL13,15 and following antimicrobial therapy.8,16,17 More specifically, cats with CE and healthy cats receiving antibiotics, the abundance of Eschericia coli was increased, whereas the abundances of beneficial bacteria, such as Clostridium hiranonis, Bifidobacterium species, Bacteroides species and Faecalibacterium species were decreased. While a sequencing approach is a useful tool for the characterization of the microbiota and discovery of important bacterial taxa, it only provides data on relative changes of the microbiome between groups.18,19 The lack of quantitative data, reproducibility, high cost and prolonged turnaround times limit its clinical application for individual patients.
A quantitative PCR (qPCR) based dysbiosis index (DI) for analyzing the fecal microbiota of dogs has previously been established. 20 The canine DI represents a single number that is calculated based on the qPCR abundances of seven bacterial groups and total bacteria, allowing the identification of shifts in the microbiota in dogs with CE. 20 The DI was also shown to be increased in healthy dogs receiving tylosin, 21 metronidazole22,23 or amoxicillin. 24 The canine DI has also been shown to correlate with species richness and overall shifts in microbiota composition based on 16S rRNA gene sequencing data.22,25 The reproducible results and established reference intervals (RIs) allow for comparisons between different time points in individual animals and across studies. Similarly, in humans, qPCR-based microbiota profiling 26 and a sequencing-based Gut Microbiome Health Index 27 have been developed to characterize the gut microbiota. However, a similar tool to characterize the gut microbiota in cats has not yet been reported in the literature.
Therefore, the aims of this study were to establish RIs of fecal abundances of selected biologically relevant bacterial groups quantified by qPCR, and to establish a qPCR-based DI to evaluate the feline intestinal microbiota.
Materials and methods
Sample population
Leftover fecal samples from 80 clinically healthy cats and 68 cats with CE that had been collected for use in previous studies were retrospectively analyzed.13,28–30 These samples were from three different cohorts, in which cats were under veterinary care and treated for CE at the Small Animal Hospital at Texas A&M University, the Veterinary Specialty Hospital in San Diego, California and the Animal Medical Center in Manhattan, New York. Samples were collected between 2016 and 2021. All cats were client owned, lived in individual households, and were fed various commercial pet foods or home-prepared diets. Cats with chronic gastrointestinal signs (ie, vomiting, diarrhea, weight loss and/or hyporexia of at least 3 weeks’ duration) and histopathologic evidence of mucosal inflammation or neoplastic cell infiltration were assigned to the CE group (n = 68 [Texas: n = 7; California: n = 25; New York: n = 36]). The final diagnosis of IBD or SCL was based on the evaluation of histopathologic examination of biopsy specimen by board-certified pathologists. 30 Immunohistochemistry staining (for CD3, expressed by T cells and/or CD79a, CD20 or PAX-5 expressed by B cells) and/or PCR for antigen receptor rearrangement was performed, where additional diagnostics were required to arrive at a diagnosis, as described previously.13,30 Cats with CE that were enrolled at Texas A&M University and at the Veterinary Specialty Center in San Diego did not receive antibiotics or acid suppressants for at least 4 weeks prior to sample collection. Cats with CE that were enrolled at the Animal Medical Center did not receive antibiotics or acid suppressants for at least 2 weeks prior to sample collection.
Clinically healthy cats without gastrointestinal signs, without systemic diseases, chronic illnesses or clinically significant laboratory abnormalities were assigned to the healthy group (n = 80 [Texas: n = 56; California: n = 8; New York: n = 16]). In addition, healthy cats that had received any antibiotics, antacids, anti-inflammatory drugs or corticosteroids within the past 6 months were excluded.
Owners were instructed to collect naturally passed feces in the home environment within 24 h of defecation, a period that has been previously shown to have only a minimal effect on microbiome structure in cats at ambient temperatures. 31 Fecal samples were frozen and shipped with dry ice or ice bags to the Gastrointestinal Laboratory at Texas A&M University and stored at −80°C prior to analysis. The cats’ signalment, clinical signs and, where applicable, the history of treatment trials (ie, food, antibiotic and immunosuppressant), clinicopathologic findings (serum concentrations of cobalamin, serum folate, feline pancreatic lipase [fPLI] and feline trypsin-like immunoreactivity [fTLI], if available], imaging findings, endoscopic histopathologic examinations and feline CE activity index (FCEAI) 2 were recorded. Written informed client consent was obtained before the enrollment of all cats, and the study protocol was approved by the Institutional Animal Care and Use Committee at Texas A&M University (IACUC 2015-0276 and IACUC 2021-0035) and by the Animal Medical Center (IACUC 11-25-20).
qPCR assays for individual bacterial taxa
The selection of targets was based on previous experiences with these PCR assays in dogs. A literature review revealed that these bacterial groups (Bacteroides,9,13–15 Bifi-dobacterium,13,14 E coli,9,12,13, Faecalibacterium, 12 Fusobac-terium, 15 Streptococcus,9,12,13 Turicibacter 13 and total bacteria9,14) are frequently altered in cats with gastrointestinal signs.12,13,32 Two bacterial groups (Blautia and Clostridium hiranonis)33,34 that were reported to be decreased in dogs with CE were also included in the qPCR panel.
Total fecal DNA was extracted using the QIAamp PowerFecal Pro DNA Kit (QIAGEN) and an automatic extraction system (Thermo KingFisher Flex Magnetic Particle Purification 96 PCR Isolation System), according to the manufacturers’ instructions. The qPCR assays were performed as previously reported.20,35 Briefly, the DNA concentration of the extract was measured by a spectrophotometer (NanoDrop 1000; Thermo Scientific) and normalized to 5 ng/µl. A mixture of 2 µl normalized DNA extract (5 ng/µl), 5 µl SsoFast EvaGreen supermix (Bio-Rad Laboratories), 0.4 µl forward primer (400 nM), 0.4 µl reverse primer (400 nM) and 2.2 µl DNA-free water was used for qPCR assays using a Bio-Rad C1000 Touch Thermal Cycler (Bio-Rad Laboratories). The protocol for the thermal cycler was as follows: initial denaturation at 98°C for 2 mins; 35 cycles with denaturation at 98°C for 3 s; and annealing for 3 s. All samples were analyzed in duplicate and the average of the two results were used for further analysis. The Bio-Rad CFX Maestro 1.1 software (Bio-Rad Laboratories) was applied to analyze the qPCR results. The 10 targeted bacterial groups, the primer sets and their specific annealing temperatures are listed in Table 1.
Primers and conditions used in the quantitative PCR assay
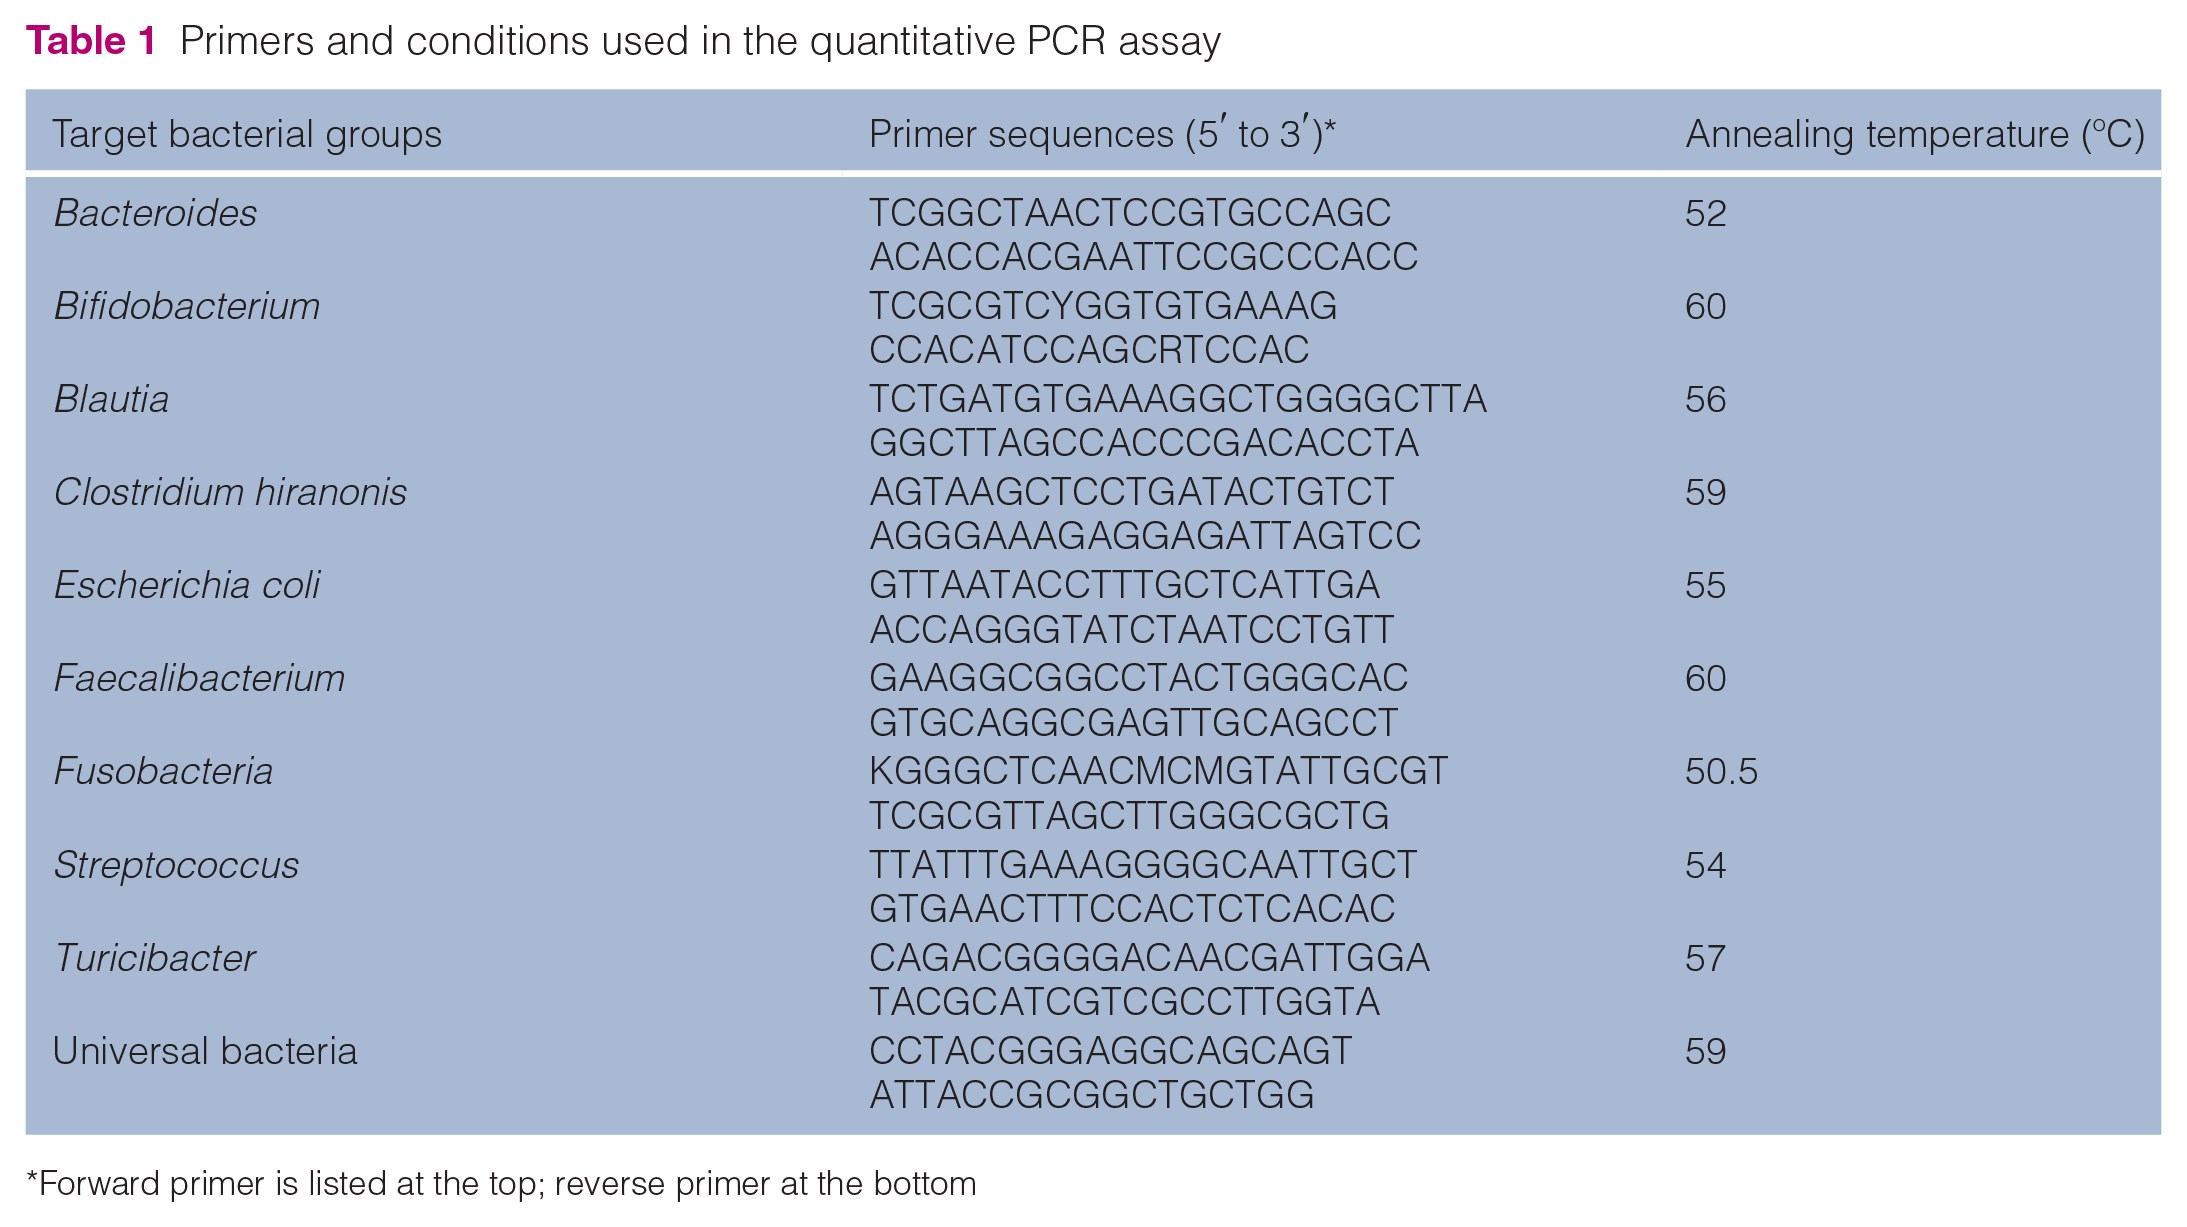
Forward primer is listed at the top; reverse primer at the bottom
To test the specificity of the PCR primers the PCR amplicons from each assay were separated by agarose gel electrophoresis. The PCR product was extracted from the gel using the QIAquick Gel Extraction Kit (QIAGEN) and ligated to pCR 4-TOPO vector (Invitrogen) and transformed into competent DH5aTM-T1R E coli using TOPO TA Cloning Kit (ThermoFisher). Purification of the plasmid DNA was performed by using the QIAprep Spin Miniprep Kit (QIAGEN). Twenty clones were picked for each bacterial target. The conventional PCR assay was repeated to ensure that the plasmid DNA contained the targeted bacterial sequence. The inserted DNA sequence was verified by Sanger Sequencing at Eton Bioscience (San Diego, CA).
Ten-fold serial dilution of the plasmid DNA was performed to establish a standard curve for each bacterial target. Each calibration curve was established based on 5–7 concentrations of the standard. The qPCR results were expressed as the log amount of DNA (fg) for each bacterial group/10 ng isolated total DNA. The melting curve was analyzed after 35 cycles at a temperature ranging from 60°C to 90°C with an increase of 0.5 for 5 s. The amplicon length, melting temperature, efficiency of the qPCR assay and the R 2 of the calibration curve is summarized in Table 1 in the supplementary material.
The abundance of each bacterial group in the 80 healthy cats was used to establish the RI using the freeware Microsoft Excel add-on Reference Value Advisor v2.1. 36
DI development
For calculation of the DI, the cycle threshold (Ct) values obtained for each bacterial group were used. To overcome variability between samples, the Ct values of each individual bacterial group were normalized by dividing them by the Ct values for total bacteria. The DI was established by the nearest centroid classifier algorithm, a classification model that was also used to establish the DI in dogs. 20
First, all samples were divided into a training set and a testing set. The training set consisted of 47 healthy cats (Texas: n = 23; California: n = 8; New York: n = 16) and 32 cats with CE (Texas: n = 7; California: n = 25). These samples were previously collected in a prospective fashion to study the fecal microbiota in cats with IBD and SCL; 30 a detailed history regarding previous medications administration (ie, antibiotics) was available for each of these.13,37 The remaining 33 healthy cats (Texas) and 36 cats with CE (New York) were included in the testing set. These samples from cats with CE were part of a study evaluating intestinal function markers in cats with IBD and SCL. 29 The normalized qPCR results from the training set of each cat were used as input in the classification model. Different combinations of bacterial groups involved in the classification model were tested. The classification model was then used to define the centroid of both the healthy and CE groups and to classify the test sample by calculating the Euclidean distances from the test sample to the centroids of both groups. The DI was calculated based on the difference between these two distances. If the distance from the test sample to the centroid of the healthy group was less than that of the CE group, the test sample was classified as healthy, with a DI <0. If the test sample was equidistant from both centroids, the DI was 0. If the distance from the test sample to the centroid of the healthy group was greater than that of the CE group, the test sample was consistent with dysbiosis, with a DI >0. The independent testing dataset was used to assess the diagnostic performance of the DI. For additional validation and to evaluate potential confounders of geographic differences, sampling time and antibiotic history, all 148 cats from all locations were randomized into 10 additional training and testing sets at a ratio of 1:1 (74 cats in each set) and the diagnostic performance was assessed.
Reproducibility of DI
Feces from six cats with DIs ranging between −4 and 4 were collected. Five aliquots of each fecal sample were evaluated. DNA extractions and qPCR assays were performed separately for each aliquot. Coefficients of variation were calculated to evaluate the reproducibility of the assay.
Statistical analysis
All data sets were tested for normal distribution using the Shapiro–Wilk test. Comparisons of sex and breed between cats with CE and healthy cats were evaluated using χ 2 tests. Comparisons of qPCR bacterial abundance of bacterial taxa between cats with CE and healthy cats were performed using the Student’s t-test or Mann–Whitney U-test as appropriate. One-way ANOVA was used to compare: (1) the DI and each bacterial taxon between healthy cats, cats with IBD and cats with SCL; (2) the DI of cats in different age groups (<7, 7–10 and >10 years); and (3) the DI of cats from different geographic locations (Texas, California, New York). Post hoc comparison with Dunn’s tests was used to identify differences between groups. The area under the receiver operating characteristic curve (AUROC), sensitivity and specificity were calculated to evaluate the diagnostic performance of the DI. Spearman’s rank correlation coefficient was used to evaluate the correlation between the DI and other clinicopathologic variables. A multiple linear regression analysis was performed to evaluate the associations between the DI, age, FCEAI or serum concentrations of cobalamin, serum folate, fPLI and fTLI. The forward step based on the minimum Bayesian information criterion rule was used in the multiple linear regression model. Statistical significance was set at P <0.05. To adjust for multiple comparisons, the P values were adjusted using a Benjamini–Hochberg correction. All statistical analyses were performed in GraphPad Prism 9.0 (GraphPad Software).
Results
Study population
While univariate analysis revealed that cats with CE (n = 68) were significantly older (P <0.001) than healthy cats (n = 80), this was not significant in the multiple regression model (see below). The median age of healthy cats was 6.5 years (range 0.5–15) and that of cats with CE was 11 years (range 2.2–20). Sex (P = 0.788) and the frequency of mixed-breed and purebred cats (P = 0.175) did not differ significantly between healthy cats and cats with CE. The healthy group consisted of 43 male and 37 female cats, and the CE group of 34 male and 32 female cats. A total of 72 mixed-breed cats (domestic shorthair, domestic mediumhair or domestic longhair cats) and eight purebred cats (one each of American Lynx, Bombay, Burmese, Maine Coon, Norwegian Forest Cat, Persian, Siamese and Sphynx) were in the healthy group, and 56 mixed-breed cats and 12 purebred cats (three Siamese, three Rag Doll and one each of Abyssinian, Bengal, Birman, Cornish Rex, Oriental and Persian) were in the CE group.
Of the 32 cats with CE in the training set, all of which had detailed medication history, 27 (84%) had a history that indicated no antibiotic exposure, while five cats (16%) had received antibiotics at least >4 weeks prior to fecal collection. Of the 36 cats in the testing set where detailed antibiotic history was inconsistent past the inclusion criterion of 2 weeks, 32 (89%) of cats had no mention of prior antibiotic administration, while the remaining 4 (11%) cats received antibiotics more than 2 weeks prior to fecal collection.
The median FCEAI score in cats with CE was 6 (range of 2–11) of a maximum possible score of 19. 2 The clinical findings in cats with CE are summarized in Table 2. The median duration of gastrointestinal signs was 5 months (range 3 weeks to 5 years). Weight loss was the most common clinical sign, followed by vomiting, decreased appetite, diarrhea and decreased activity/attitude. Nine cats (13%) presented with only one of aforementioned clinical signs, 29 cats (43%) with two signs, 21 cats (31%) with three signs, six cats (9%) with four signs and three cats (4%) with five signs.
Clinical findings in cats with chronic enteropathy

Two cats had feline pancreatic lipase immunoreactivity (fPLI) between 3.5 and 5.3; 12 cats had fPLI >5.3
fTLI = feline trypsin-like immunoreactivity
qPCR analysis of the fecal microbiota
Figure 1 shows the abundances of each bacterial group targeted in the qPCR panel. Table 2 in the supplementary material shows the RI for each bacterial group. The abundance of Bacteroides, Bifidobacterium, C hiranonis, Faecalibacterium, Turicibacter and total bacteria were significantly decreased in cats with CE, while those of E coli and Streptococcus were significantly increased. The abundance of C hiranonis, an important converter of primary to secondary bile acids, was below the RI in 24/68 (35%) of cats with CE. Although the abundances of 8/10 bacterial taxa differed significantly between groups, there was considerable overlap between them. None of the targeted bacterial taxa differed significantly between cats with IBD and SCL (see Figure 1 in the supplementary material). The AUROC to separate the microbiota of cats with CE from healthy cats based on each individual bacterial group ranged from 0.52 for Blautia to 0.73 for total bacteria (Table 3).

Results of the quantitative PCR panel in healthy control (HC) cats and cats with chronic enteropathy (CE). The gray area represents the reference interval. Horizontal lines represent medians
Area under the receiver operating characteristic (AUROC) curve for each bacterial group, as well as the dysbiosis index (DI)
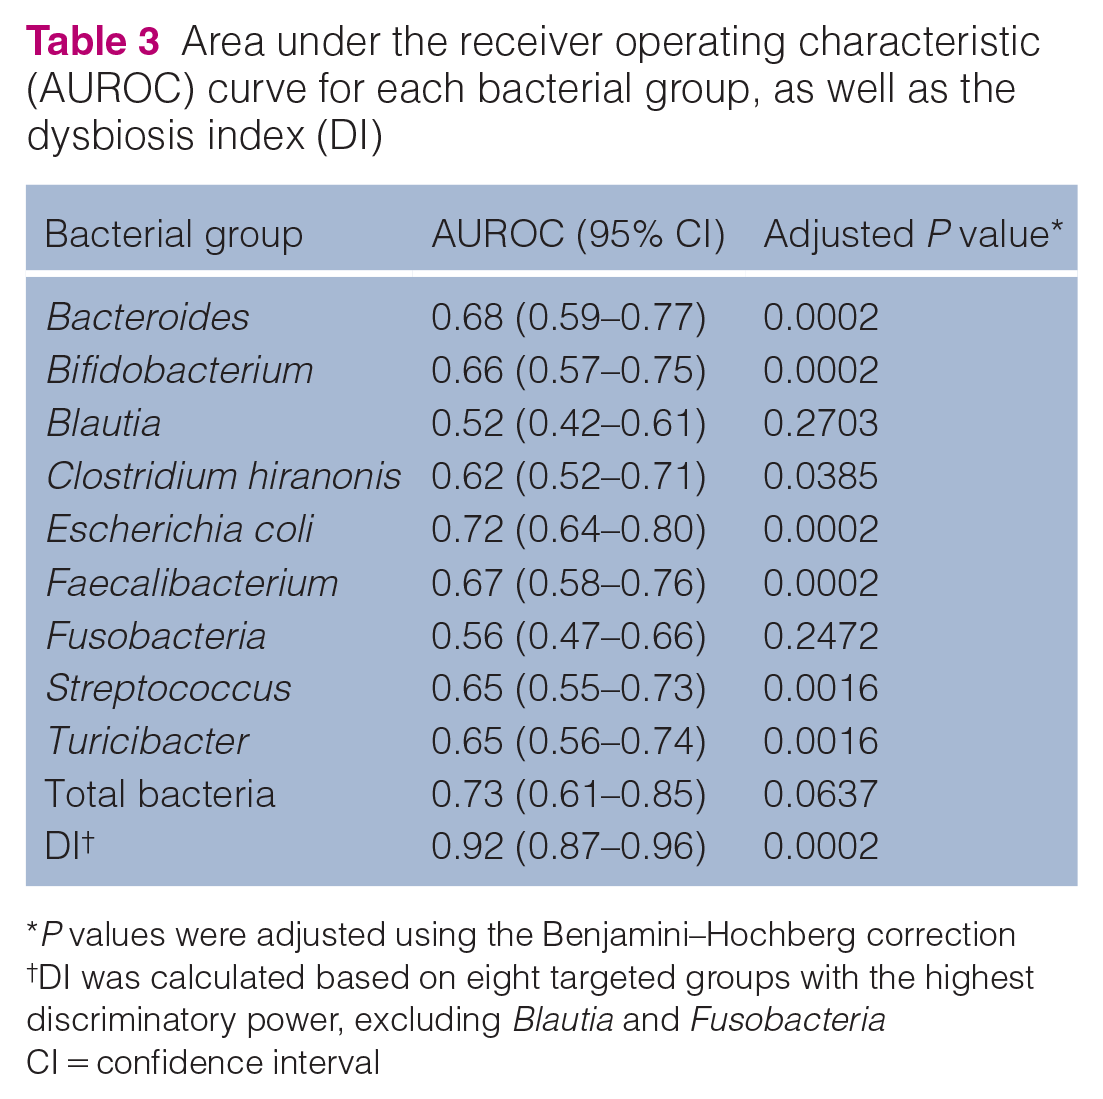
P values were adjusted using the Benjamini–Hochberg correction
DI was calculated based on eight targeted groups with the highest discriminatory power, excluding Blautia and Fusobacteria
CI = confidence interval
DI
Total bacteria, Bacteroides, Bifidobacterium, C hiranonis, E coli, Faecalibacterium, Streptococcus and Turicibacter were included in the final model. The combination of these bacterial groups was determined because they showed the highest discriminatory power.
In both the training set and the testing set, cats with CE had a significantly higher DI than healthy cats (P <0.001) (Figure 2). Increased DI was found in 52/68 cats with CE. The DI did not differ (P = 0.744) between cats with IBD and cats with SCL (Figure 3).

Scatter plots of the dysbiosis index (DI) for healthy control (HC) cats and cats with chronic enteropathy (CE), and receiver operating characteristic curves of the training and testing sets, and the combined set. AUC = area under the curve; CI = confidence interval

Dysbiosis index in healthy control (HC) cats, cats with inflammatory bowel diseases (IBD) and cats with alimentary small cell lymphoma (SCL)
The AUROC to separate the microbiota of cats with CE from healthy cats was 0.90 for the training set, 0.93 for the testing set and 0.92 for the combined set (all cats in the training and testing set). The DI, which was calculated based on the abundances of total bacteria and seven bacterial groups, resulted in a higher AUROC (Figure 2) than did the use of any single bacterial group (Table 3). The accuracy (ie, the ability to identify true positive and true negative case) of the classification model was 87%. The sensitivity and specificity of the DI at the cut-off value of 0 are summarized in Table 4. When the cut-off value of the DI was set at 0, the sensitivity and specificity for differentiating microbiota between cats with CE and healthy cats were 77% and 96%, respectively. The mean values for accuracy, sensitivity and specificity at a DI set at 0 for the 10 models with randomized samples were 86% (95% confidence interval [CI] 85–87), 78% (95% CI 76–79) and 93% (95% CI 91–96), respectively. The diagnostic performance of the classification model with manually assigned sample was similar to that with the randomized samples. The accuracy, sensitivity and specificity of 10 models based on randomized samples are summarized in the Excel file in the supplementary material. The sensitivity and specificity of the DI at the different cut-off values are summarized in Table 3 in the supplementary material.
Diagnostic performance of the dysbiosis index at the cut-off value of 0

Sensitivity and specificity of the models with randomized samples were presented as mean (95% confidence interval [CI]) of 10 models
The DI in cats with CE presenting with different clinical signs is shown in Figure 4. Eleven cats with CE showed only lethargy, hyporexia and/or weight loss but did not present with diarrhea or vomiting. Among these 11 cats, 10 had an increased DI. An increased DI was also found in 19/30 cats presenting with vomiting and/or other clinical signs but without diarrhea. All eight cats presenting with diarrhea but without vomiting had an increased DI.
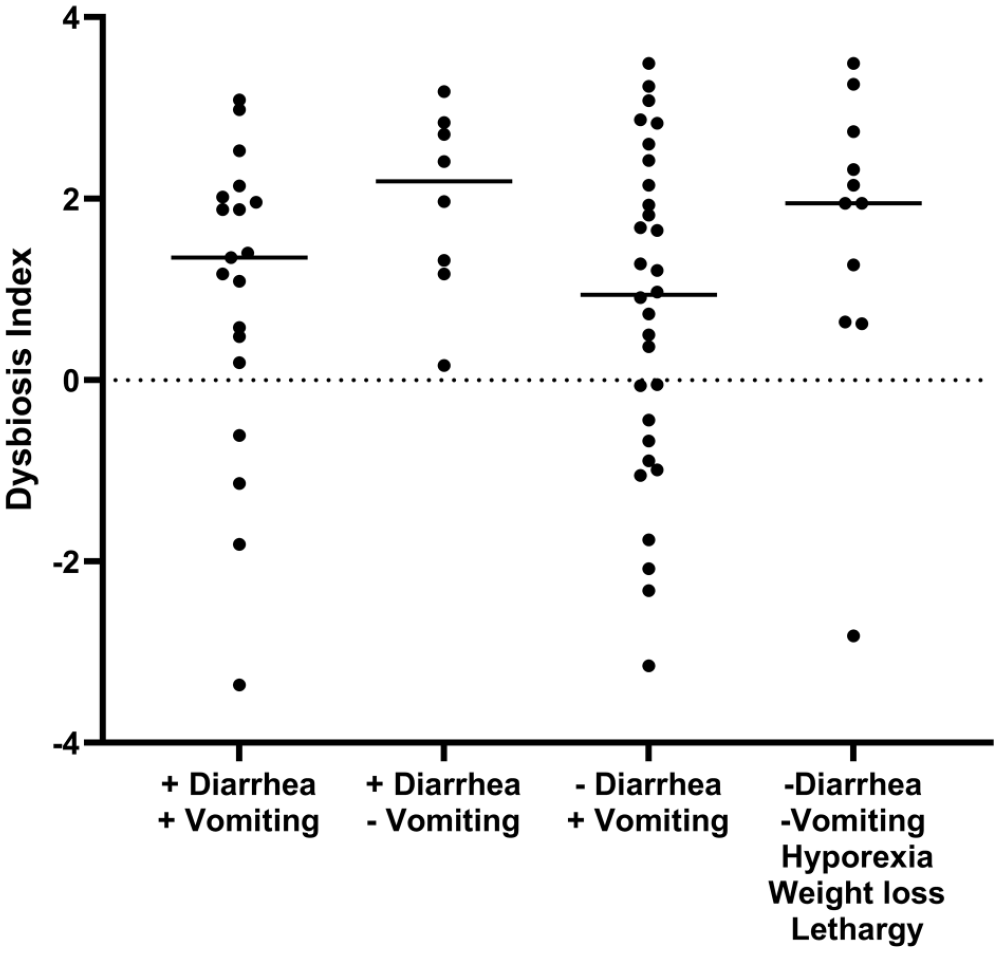
Dysbiosis index in cats with chronic enteropathy separated by main clinical signs. Cats were classified based on the presence or absence of vomiting and diarrhea, regardless of other clinical signs. Cats showed only hyporexia, weight loss and/or lethargy in the group in the fourth column
FCEAI score (r = 0.67, P <0.001 [n = 147]), age (r = 0.35, P <0.001 [n = 148]), fPLI (r = 0.38, P = 0.006 [n = 79]) and fTLI (r = 0.29, P = 0.013 [n = 74]) showed positive correlations with the DI, whereas serum cobalamin (r = −0.24, P = 0.025 [n = 90]) showed a negative correlation with DI. Serum folate (P = 0.515) did not show a correlation with the DI.
The multiple linear regression model was significant (F = 7.77, P <0.001). Based on the multiple linear regression model, a significant correlation was observed only between the FCEAI and the DI (P <0.001); there was no significant association between the DI and age (P = 0.136), serum cobalamin (P = 0.316), serum folate (P = 0.768), serum fPLI (P = 0.108) or fTLI (P = 0.050).
When the healthy cats were separated into three age groups, no statistically significant difference (P >0.999 for all) was found in the DI between these groups (Figure 5). Similarly, when the cats with CE were separated into the same age groups, no statistically significant difference (P >0.999 for all) was found in the DI between these groups. However, the DI of cats with CE was significantly higher compared with healthy cats within the same age group (P <0.005).

Dysbiosis index (DI) of cats in different age groups (left) and cats from different geographical locations (right). The DI of cats in different age groups and cats from different geographic locations was not significantly different within healthy cats (HC; P >0.999 for all) or within cats with chronic enteropathy (CE; P >0.999 for all). TX = Texas; CA = California; NY = New York
When the healthy cats were separated into three geographic locations, no statistically significant difference (P >0.999 for all) was found in the DI between these groups (Figure 5). Similarly, when the cats with CE were separated into the same geographic locations, no difference (P >0.999 for all) was found in the DI between these groups. However, the DI of cats with CE were significantly higher compared with healthy cats from the same geographic location (P <0.004).
Reproducibility of the DI assay
The percentage coefficients of variation (%CV) of the DI for five aliquots from six different cats were 2.3%, 5.2%, 5.9%, 8.1%, 10.2% and 12.5%, respectively. The DI results for each aliquot are shown in Figure 6.

Reproducibility of the quantitative PCR panel for calculation of the dysbiosis index. Five aliquots from each fecal sample (n = 6) were processed separately
Discussion
A qPCR-based DI was established to evaluate the fecal microbiota in cats. The qPCR method is less expensive, more accessible and less time consuming than a sequencing-based technique. The %CVs of the DI were <15%, indicating that the DI was reproducible. The entire process, including DNA extraction, qPCR assay and calculation of the DI can be performed in 1 day. Based on the results, the DI, a single number derived from the classification algorithm, distinguished the fecal microbiota of cats with CE from healthy cats better than any individual bacterial group targeted by the qPCR assays.
As in humans, feline and canine CEs are considered a multifactorial disorder and the interplay between the host immune system, inflammation, genetic factors and intestinal microbiota is involved in disease development.1,38 Therefore, a combination of biomarkers that assess these different components (eg, inflammation and dysbiosis) are needed to allow for a better understanding and diagnosis of CE and for assessing treatment outcome over time. The DI has the potential to help identify changes in the fecal microbiota in cats and may serve as an additional biomarker for CE. However, as in dogs, it is unlikely that modification of the microbiota alone is sufficient for the treatment of feline CE and therefore recognition of microbiota changes is not a predictor for a specific treatment modality. Treatment of feline CE requires either a stepwise or combination therapeutic approach with dietary modification, immunosuppressive and/or antibiotic therapy. In dogs, preliminary studies would suggest that the microbiota may normalize after dietary (eg, normalization of C hiranonis) 39 or immunosuppressive therapy. 40 Whether the feline DI could act as a monitoring biomarker, a prognostic biomarker or a predictive biomarker requires further investigations in prospective clinical studies.
On univariate analysis, age was weakly correlated with the DI when the entire cohort of all healthy cats and cats with CE was analyzed. This was likely caused by the significantly older age of cats with CE compared with that of cats in the healthy group. However, age was not associated with the DI in the multiple linear regression model. The DI did not differ significantly between different age groups within the healthy cat cohort or in cats with CE (Figure 5). Moderate correlation between FCEAI score and DI suggest that cats with more severe clinical signs and/or clinicopathologic abnormalities might have an increased DI. Serum fTLI, fPLI and cobalamin were only weakly associated with the DI. This may be due to the fact that hypocobalaminemia was present in only 34% of the study population, while an increased DI was present in 76% of cats with CE. This finding indicates that an abnormal gut microbiota might present even in cats with gastrointestinal signs with normal serum cobalamin, folate, fTLI or fPLI.
The targeted bacterial groups in this study were at the bacterial genus or species level. They belong to the main bacterial taxa residing in the gastrointestinal tracts of healthy cats.13,32,41 Blautia, C hiranonis, Faecalibacterium, Streptococcus and Turicibacter are in the phylum Firmicutes, which, according to 16S rRNA sequencing, is reported to be the major phylum in the feline gastrointestinal tract.32,41 Of the other predominant groups, Bacteroides is in the phylum Bacteroidetes, Bifidobacterium in the phylum Actinobacteria, E coli in the phylum Proteobacteria and Fusobacterium in the phylum Fusobacteria. Although the abundances of total bacteria and seven targeted bacterial groups showed statistically significant difference between healthy cats and cats with CE, the wide range of overlapping results limited the use of either the abundance of total bacteria or a single bacterial group as a biomarker for dysbiosis. The DI, a combination of the abundance of total bacteria and seven bacterial taxa, provided the highest ability to differentiate cats with CE and healthy cats.
Changes in fecal microbiota identified by the qPCR assay in the current study were consistent with those found in previous studies using sequencing methods. A previous study using fluorescence in situ hybridization (FISH) to evaluate colonic bacteria in cats with IBD also found decreased abundances of total bacteria, Bacteroides species and Bifidobacterium species. 14 Likewise, our findings of increased abundances of E coli and Streptococcus species in cats with CE were consistent with those of previous sequencing studies in cats with chronic and acute diarrhea and in dogs with CE.12,20 Studies using FISH also found more mucosal E coli in cats with gastrointestinal signs. 9 Further investigation of the specific strains of E coli and Streptococcus species might help elucidate their roles in feline CE. The abundances of short-chain fatty acid (SCFA)-producing bacteria, including Faecalibacterium species and Turicibacter species were decreased in cats with CE. This change has also been reported for humans with IBD and in dogs with CE.20,42 Because SCFAs are the main energy source for colonocytes, imbalances of SCFA-producing bacteria might disrupt gut homeostasis. In human studies, Faecalibacterium prausnitzii is considered an anti-inflammatory bacterium and its decreased abundance is associated with the pathogenesis of IBD.43,44 However, the role of F prausnitzii has not been investigated in cats to date.
Bile acid metabolism is crucial for maintaining intestinal heath.21,22,45,46 Clostridium hiranonis, a bile acid-dehydroxylating bacterium associated with bile acid metabolism in dogs,21,33 converts primary bile acids into secondary bile acids in the colon. Secondary bile acids have been shown to be anti-inflammatory and anti-pathogenic in vivo and in vitro.46,47 Dogs with a lower abundance of C hiranonis have a higher prevalence of potentially pathogenic Clostridium difficile and Clostridium perfringens. 35 Whether cats with a low abundance of C hiranonis might have abnormal bile acid metabolism and a higher risk of harboring more pathogenic bacterial groups needs to be evaluated in further studies.
In our study, weight loss was the most common clinical sign in cats with CE. This finding is in contrast to dogs, where diarrhea is the most common presenting clinical sign. One possible reason for weight loss could be that chronic inflammation in the gastrointestinal tract leads to maldigestion and malabsorption. Of note, 10/11 cats with CE without major gastrointestinal signs (vomiting or diarrhea) had a DI above the RI, suggesting that the DI could be useful in identifying dysbiosis in cats showing non-specific clinical signs.
In our study, three clinically healthy cats had DIs above 0. In one cat the abundance of E coli was higher than the RI, while in another cat the abundance of Bifidobacterium species was lower than the RI. The third cat had a DI of 0.28, and while the abundances of all bacterial taxa were within the RI, most of them were close to the respective lower or higher limits. Owing to the lack of follow-up sampling, it is not yet clear whether the increased DI was due to subclinical dysbiosis or a minor and clinically irrelevant shift in intestinal microbiota. Investigations into clinically healthy cats with increased DIs is warranted.
The DI did not differ significantly between cats with IBD and cats with SCL, a finding consistent with the results of a previous study using 16S rRNA gene sequencing on fecal samples. 13 A study using FISH reported a higher abundance of mucosa-adherent Fusobacterium species in ileal and colonic biopsies in cats with SCL than in cats with IBD, 15 suggesting that cats with SCL might have differences in mucosa-adherent bacteria. Analysis of fecal samples, as performed in the current study, does not allow for assessment of changes in mucosa-adherent bacteria, and larger studies evaluating the microbiota from biopsies using qPCR or sequencing methods may be useful to identify additional differences between IBD and SCL in future studies.
Several limitations of this study should be noted. First, the initial assignment of samples into the classification model was not randomized. However, the training set was built up with well-characterized (ie, a clear history of medication) subjects. Furthermore, the diagnostic performance of the model with manually assigned samples and the model with randomized samples was similar. This indicates that different sampling times, geographic distribution, diet and history of antibiotics might have had little impact on the results of this study. Second, some clinically healthy cats might have had subclinical disease, which, in turn, could have affected the intestinal microbiota. In this study, cats were considered healthy based on physical examination and owner questionnaire. Third, the antibiotic history was not complete in all cats. Short- and long-term dysbiosis induced by a single course of antibiotics has been reported in humans, dogs and cats. Metronidazole, 22 amoxicillin–clavulanate 24 and tylosin 21 administration have been shown to induce dysbiosis patterns that are similar to those observed in intestinal disease. To minimize the chance of enrolling clinically healthy cats with dysbiosis, we excluded cats with antibiotic or other medication exposure in the past 6 months before fecal collection. In contrast, some cats with CE had a history of antibiotic administration, which is difficult to avoid in clinical patients as antibiotics are commonly administered to some cats with CE. To minimize the interference of antibiotics during the development of the DI only cats with known antibiotic history were included in the training set. More specifically, 27 cats did not have any antibiotic exposure reported in their clinical records, and five cats received antibiotics more than 4 weeks prior to sample collection. To test the DI model, cats from a different cohort were enrolled in the testing set and these cats did not receive antibiotics for at least 2 weeks prior to sampling as an inclusion criterion. Unfortunately, owing to the retrospective nature of the study, the exact antibiotic history was unknown for many cats in the testing set, and it is possible that some of these cats had prior antibiotic exposure. However, the training set, the testing set and the results of the model with randomized samples set showed almost identical separation patterns between healthy cats and cats with CE, making it unlikely that unknown antibiotic exposure would be a major confounding factor in the testing set. Furthermore, a study reported that in healthy cats receiving a 7-day course of amoxicillin–clavulanic acid, the major bacterial taxa, including Bifidobacterium species and Enterobacteriaceae (E coli), which were also evaluated in this DI panel, normalized within 7 days after the antibiotic was discontinued. 48 However, future studies evaluating the effect of different antibiotics on the feline gut microbiota in cats using the DI are warranted.
Conclusions
A fecal DI was established to assess and compare the fecal microbiota of healthy cats and cats with CE. An increased DI was found in 76% cats with CE.
Supplemental Material
Supplementary Table 1
The validation data of the qPCR assays.
Supplemental Material
Supplementary Table 2
Reference interval of each bacterial group in feline feces.
Supplemental Material
Supplementary Table 3
Diagnostic performance of the DI at cut-off values of −0.5, 0 and 0.5.
Supplemental Material
Supplementary Figure 1
Results of qPCR panel in HC cats, cats with IBD and cats with SCL.
Supplemental Material
Excel file
The accuracy, sensitivity and specificity of each model based on randomized sample.
Footnotes
Author note
This paper was presented, in part, as an abstract at the 2021 ACVIM Forum.
Supplementary material
The following files are available online:
Supplementary Table 1: The validation data of the qPCR assays.
Supplementary Table 2: Reference interval of each bacterial group in feline feces.
Supplementary Table 3: Diagnostic performance of the DI at cut-off values of –0.5, 0 and 0.5.
Supplementary Figure 1: Results of qPCR panel in HC cats, cats with IBD and cats with SCL.
Excel file: The accuracy, sensitivity and specificity of each model based on randomized sample.
Conflict of interest
Chi-Hsuan Sung, Rachel Pilla, Jonathan A Lidbury, Jörg M Steiner, So Young Park, Min-Pyo Hong and Jan S Suchodolski are employed by the Gastrointestinal Laboratory at Texas A&M University, which provides assays for intestinal function and microbiota analysis on a fee-for-service basis. The canine Dysbiosis Index is licensed to IDEXX Laboratories through a commercial agreement with the Texas A&M University System. Drs Suchodolski, Lidbury and Steiner are co-inventors of the canine Dysbiosis Index, may receive royalties and may personally benefit similarly from the feline version of the Dysbiosis Index in the future.
Funding
This work was supported, in part, by the 2016 Miller’s Trust Fund of the EveryCat Health Foundation (formerly the Winn Feline Foundation). The contents of this publication are solely the responsibility of the authors and do not necessarily represent the views of EveryCat Health Foundation.
Ethical approval
The work described in this manuscript involved the use of non-experimental (owned or unowned) animals. Established internationally recognized high standards (‘best practice’) of veterinary clinical care for the individual patient were always followed and/or this work involved the use of cadavers. Ethical approval from a committee was therefore not specifically required for publication in JFMS. Although not required, where ethical approval was still obtained, it is stated in the manuscript.
Informed consent
Informed consent (verbal or written) was obtained from the owner or legal custodian of all animal(s) described in this work (experimental or non-experimental animals, including cadavers) for all procedure(s) undertaken (prospective or retrospective studies). No animals or people are identifiable within this publication, and therefore additional informed consent for publication was not required.
References
Supplementary Material
Please find the following supplemental material available below.
For Open Access articles published under a Creative Commons License, all supplemental material carries the same license as the article it is associated with.
For non-Open Access articles published, all supplemental material carries a non-exclusive license, and permission requests for re-use of supplemental material or any part of supplemental material shall be sent directly to the copyright owner as specified in the copyright notice associated with the article.