
Abstract
This study analyzed the impact of the interplay between fee-oriented strategies and ownership structure on analyst forecast accuracy using a sample of international publicly-listed hospitality firms. Based on 29,019 earnings forecasts made by financial analysts, using Ordinary Least Squares regression (OLS), entropy balancing, and Heckman two-stage models, we documented that, on average, forecasts were more accurate for firms pursuing a fee-oriented strategy. Moreover, the positive effect of fee-oriented strategies on forecast accuracy was stronger for companies with concentrated ownership. We explain our results by the fact that fee-oriented firms enjoyed more stable cash flows and revenue, reducing information asymmetries between a firm’s outsiders and insiders, thus enabling analysts to make more accurate forecasts. This effect was more important for firms with concentrated ownership in particular, as they generally disclosed less information to the capital markets. Our findings should be of great interest to hospitality firms’ owners, managers, and boards of directors.
Highlights
This study investigated the impact of fee-oriented strategies on analyst forecast accuracy.
Analyst forecasts were significantly more accurate for fee-oriented firms.
Results were amplified for firms with concentrated ownership.
Fee-oriented strategies mitigate information asymmetries between firm insiders and outsiders.
Introduction
Financial analysts are considered one of the most important information intermediaries and users of financial reports (e.g., Bhat et al., 2006; Revsine et al., 2004), and their forecasts are among the main proxies for profitability expectations used by capital market participants (Bradshaw et al., 2012). Analysts collect information from annual reports, companies’ websites, databases and conference calls, and assess firms’ long-term value generation. This information mosaic is then used as an input in valuation models and translated into earnings forecasts (Asquith et al., 2005; Bradshaw, 2002; Gleason et al., 2013; Green et al., 2016). Consequently, for market participants to predict future stock returns and make efficient asset allocation, accurate analyst forecasts are crucial. Prior literature agrees that the accuracy of analyst forecasts is a function of analyst characteristics (Clement, 1999; Jacob et al., 1999; Mikhail et al., 1997) and firm-specific characteristics (e.g., Bhat et al., 2006; Bhushan, 1989; Hope, 2003; Muslu et al., 2019). However, prior literature has not yet investigated the link between business strategies and analyst forecast accuracy in the hospitality industry.
The purpose of the study is to investigate the accuracy of analyst forecasts in the hospitality industry, which is a particularly interesting context for three main reasons. First, over the past few decades, many hospitality companies have shifted their business model towards an asset-light and fee-oriented strategy (ALFO hereafter; Blal & Bianchi, 2019), enabling them to grow more quickly without needing significant external capital and without bearing the risks related to property ownership. Furthermore, fees and royalties positively impact liquidity, providing firms with more flexibility as cash flows become more stable and more predictable. This change of paradigm hence impacts companies’ capital structure, liquidity, corporate actions, growth, and risk (e.g., Andrew et al., 2007; Dogru et al., 2020; Gim & Jang, 2019; Koh et al., 2018; Poretti & Blal, 2020; Sohn et al., 2013), all of which financial analysts should incorporate in their earnings forecasts. Second, as explained by Kross and colleagues (1990), the volatility of earnings is a critical factor influencing the accuracy of analyst forecasts. Given that the hospitality industry is highly exposed to consumers’ discretionary spending and macroeconomic conditions (Chen et al., 2005; Poretti & Heo, 2022a, 2022b; Singal, 2012; Wong & Song, 2006), it makes the forecasting of future profitability a very complicated task. Third, ownership structures have been changing over the past decades in the hospitality industry, are very heterogenous, and have become a critical matter to consider for investors (Leung and Lee, 2006; Masset et al., 2019; Oak and Dalbor, 2008a, 2008b; Oak and Upneja, 2009; Tsai and Gu, 2007). As ownership concentration negatively influences the information disclosure to capital markets participants (Eng & Mak, 2003), ownership structures should directly impact the quantity and quality of the information to which analysts have access when constructing their forecasts.
This study therefore investigates the links amongst fee-oriented strategies, ownership structure, and analyst forecast accuracy in the hospitality industry. We posit (1) that fee-oriented strategies impact analyst forecast accuracy, and (2) that this impact is stronger for firms with concentrated ownership. Regarding the first expectation, on the one hand, as fee-oriented strategies lead to lower ownership of fixed assets, lower risk, lower operating leverage, and more stable and higher cash flows (Andrew et al., 2007; Dogru et al., 2020; Poretti & Heo, 2021a), one might expect financial analysts to make more accurate earnings forecasts for these firms. On the other hand, analysts might make less accurate forecasts for some firms due to the incremental complexity induced by the adoption of fee-oriented strategies. Indeed, in most cases, revenue generated from franchises and management contracts only represents a fraction of total revenue, meaning that companies pursue both fee-oriented and equity-based strategies, hence becoming organizations of the plural form (Bradach & Eccles, 1989; Combs et al., 2011; El Akremi et al., 2015). Consequently, the plural form might add a layer of financial reporting complexity to the firm (Geringer et al., 1989; Hitt et al. 1997; Hua & Upneja, 2007; Poretti et al., 2023), which may lead to higher information asymmetry between the firm’s insiders and outsiders (Rodríguez-Pérez & Van Hemmen, 2010), making it more difficult for analysts to derive accurate earnings forecasts (Bentley-Goode et al., 2019).
Regarding the second expectation, the effect of fee-oriented strategies on analyst forecast accuracy may depend on companies’ information and disclosure environment. According to prior studies, demand and supply of financial information are conditional on ownership concentration (Wang, 2006). Firms with concentrated ownership tend to withhold private information internally, and thus disclose less information to capital markets than firms with diluted ownership (Ajinkya et al., 2005; Anderson & Reeb, 2003). Therefore, by considering that fee-oriented strategies incorporate information on future cash-flows, adopting fee-oriented strategies should critically improve the information disclosure of firms with concentrated ownership, which should reduce information asymmetry and help analysts make more accurate forecasts. 1 Overall, whether and how fee-oriented strategies in conjunction with ownership structure impact analyst forecast accuracy remains an open empirical question.
Using a sample of 29,019 earnings forecasts on publicly listed hotel and restaurant firms in Europe and North America from 2010 to 2019, we document that following a fee-oriented strategy increases analyst forecast accuracy, especially for companies with concentrated ownership. Furthermore, the adoption of a fee-oriented strategy leads to analysts making more accurate forecasts on the adoption year and the years after, for both widely-held and concentrated ownership firms. Our results hold after mitigating endogeneity concerns (i.e., adopting a fee-oriented strategy is not random) using a Heckman (1979) two-stage model and entropy balancing.
The remainder of the paper is organized as follows. The following section contains the literature review and the hypotheses development, followed by the sample description and methodology. The fourth section presents and discusses the findings. The last section provides conclusion and practical implications of our findings.
Theoretical Framework and Research Question Development
Fee-Oriented Strategies in the Hospitality Industry
Over past decades, companies have started to opt for ALFO strategies, modifying their capital structures, risk, and liquidity (Gim & Jang, 2019; Hsu & Jang, 2009; Roh, 2002). These strategies, also called “non-equity strategies,” imply either the divestment of long-term tangible assets, or the reduction of capital investments when the firm expands, while focusing more on management and/or franchising strategies. Such a fee-oriented business model enables firms to grow fast with fewer capital investments (Sohn et al., 2013), allowing for greater flexibility (Gim & Jang, 2019) and stabilizing and increasing cash flows (Andrew et al., 2007; Dogru et al., 2020).
Although the benefits of ALFO strategies have been widely advocated in the literature, only a few studies highlight their disadvantages. Gim and colleagues (2019) document that franchise restaurants that are in a growth phase tend to manage earnings more than other restaurants, while Blal and Bianchi (2019) show that hotel firms pursuing an asset-light strategy are not necessarily associated with better financial performance. In the same vein, Märklin and Bianchi (2022) document a lack of significant association between ALFO strategies and risk and return. More recently, Poretti and colleagues (2023) found that adopting an ALFO strategy may introduce incremental complexity in the firm. Indeed, most companies following an asset-light strategy use a mix of franchising/management contracts and real estate ownership (Hsu & Jang, 2009; Lawrence & Perrigot, 2015; Madanoglu et al., 2019), as the fraction of total revenue generated from franchise fees and management contracts never reaches 100% (i.e., the fee-income ratio is always smaller than 1). 2 As a result, most ALFO firms can be described as organizations of the plural form (Bradach & Eccles, 1989; Combs et al., 2011; El Akremi et al., 2015).
In turn, it can be expected that, all else equal, greater firm complexity leads to a greater informational gap between the firm’s insiders and outsiders (i.e., information asymmetries). From an analyst’s perspective, greater information asymmetry is detrimental as it diminishes both the breadth and depth of the information mosaic used to derive forecasts, leading to less accurate forecasts.
Accuracy of Analyst Forecasts
A considerable number of studies have investigated how accurate analysts are in predicting earnings per share (EPS; e.g., Capstaff et al., 2001; Harris, 1999), which have generally found that forecasts tend to be optimistic and relatively inaccurate. Since the publication of those seminal works, empirical research has tried to identify the determinants of earnings forecast accuracy, and three broad factors have emerged: analyst experience, cognitive biases, and firm characteristics.
Clement (1999) demonstrates that forecast accuracy increases when analysts have higher general and firm-specific experience, while Hussain (2010) shows that analyst forecasting accuracy is a positive function of their experience, but also depends on the experience of the broker houses they work for. Bradley and colleagues (2017) found that analysts who issue forecasts for firms in industries in which they worked before becoming analysts issue more accurate forecasts. With regards to cognitive biases, it has been documented that analysts have specific incentives to provide biased numbers when they (1) work for banks that have business relationships with the covered firms (Hodgkinson, 2001; Mehran & Stulz, 2007), (2) hold shares of these firms (Chan et al., 2018), and (3) are hired in the near future by one of the firms they cover (Lourie, 2019).
Moreover, analysts may use imperfect valuation models or make questionable judgments when implementing valuation models (e.g., Gleason et al., 2013; Green et al., 2016). For instance, they may not adjust their inputs for unconditional accounting conservatism, which leads to larger errors (Kim, nekrasov, et al., 2019). Analyst behavioral biases may also lead to the issuance of optimistic forecasts (e.g., Cen et al., 2013; Kahneman & Tversky, 1973; Roger et al., 2018).
Overall, prior literature considers firm-specific characteristics among the main factors influencing forecast accuracy. Denis and colleagues (2003) found that being included in the S&P 500 index decreases EPS forecast errors, implying that there are benefits in being quoted on a well-known market index. Andersson and Hellman (2007) suggest that the greater the access to financial information granted to analysts, the higher their forecast accuracy. Furthermore, firm-specific risk factors also play a role in analysts’ forecasting abilities. Chu and Zhai (2021) provide evidence that analysts make overly optimistic EPS forecasts for firms facing higher distress risk, while Dichev and Tang (2009) show a negative association between earnings forecasting errors and earnings volatility.
Given the importance documented in the literature of firm-specific characteristics in explaining analyst forecast accuracy, our study contributes to this body of research by investigating the effect of two firm-specific characteristics, namely business strategies and ownership structure, as well as their interplay, on analyst forecast accuracy.
Ownership Concentration
In the context of hospitality firms, the critical role that ownership structure plays in enhancing transparency cannot be understated. Oak and Dalbor (2010) explain that institutional investors are prominent actors in the hospitality industry, while several leading hospitality companies are family-controlled (Singal, 2014). Recent studies accounted for ownership characteristics in their analysis of the consequences of business strategies on financial outcomes (e.g., Gim & Jang, 2019; Poretti & Blal, 2020), emphasizing that ownership must be taken into consideration to gain a comprehensive understanding of the big picture.
Viewing ownership concentration through the lens of agency theory, the alignment hypothesis posits that the presence of a blockholder may reduce Type I agency conflicts between owners and managers, as controlling shareholders play a monitoring role, thereby reducing information asymmetries, disciplining managers, and preventing them from expropriating private benefits (Shleifer & Vishny, 1986). In the context of firms with significant institutional ownership, Ramalingegowda and colleagues (2021) document that common institutional ownership is associated with better financial reporting information quality. The authors explain that, in the United States, BlackRock, Vanguard, and State Street are “the largest shareholder in more than 40% of all United States listed companies and 88% of S&P 500 companies” (Fichtner et al., 2017, p. 212). Being the largest investor in a company enables institutional investors to elect members of the top management team and the board of directors, giving significant decisional power and monitoring capacity, thus enhancing financial information quality (e.g., Ayers et al., 2011; Bushee, 1998; Cornett et al., 2008; Rajgopal & Venkatachalam, 1997), and reducing agency conflicts.
In contrast, according to the entrenchment hypothesis, ownership concentration might lead to agency conflicts between minority and controlling shareholders, increasing the risk of wealth expropriation at the expense of minority shareholders (Schulze et al., 2003). Under this hypothesis, controlling shareholders (i.e., institutional investors, families in family firms, corporations, or individual investors) tend to entrench themselves, thus reducing the board monitoring effectiveness (e.g., Schulze et al., 2001; Villalonga & Amit, 2009). Indeed, controlling shareholders may withhold private information internally, and favor specific managers for high-level positions (e.g., top management), thus weakening the board’s monitoring role and hindering the reliability perceived by financial markets (Anderson & Reeb, 2003; Ajinkya et al., 2005). Ding and colleagues (2011) found that firms with concentrated ownership have less informative earnings, employ less conservative accounting practices, and have higher discretionary accruals, which ultimately suggest that such firms engage in more opportunistic reporting behavior.
Hypotheses Development
Since Akerlof’s (1970) seminal paper, the concept of information asymmetry has become increasingly important as firm insiders possess more information than outsiders, resulting in an information gap between the two groups. Leuz and Verecchia (2000, p. 92) explain that “information asymmetries create costs by introducing adverse selection into transactions between buyers and sellers of firm shares.” To avoid the negative consequences of information asymmetries—such as reduced liquidity and higher cost of capital (Hermalin & Weisback, 2012; Leuz & Wysocki, 2008)—and to enhance market participants’ comprehension of the firm (Holland, 1998), managers/firms disclose information on their activities and performance.
The accounting literature has extensively explored the benefits of corporate transparency and voluntary disclosure as a means of mitigating adverse selection and moral hazard problems (Bushman & Smith, 2001). The timely disclosure of financial accounting information may play a governance role through the reduction of information asymmetries across stakeholders.
When a company adopts a fee-oriented strategy, incremental information about revenue generation is disclosed through annual reports, which may help analysts forecast earnings more accurately. On the one hand, as fee-oriented strategies lead to lower risk, more stable and higher cash flows, financial analysts should make more accurate earnings forecasts for these firms (Andrew et al., 2007; Dogru et al., 2020). On the other hand, pursuing fee-oriented strategies may increase the inherent complexity of the firm (Poretti et al., 2023). In most cases, revenue generated from franchises and/or management contracts only represents a fraction of total revenue, meaning that companies pursue both fee-oriented and equity-based strategies, hence becoming organizations of the plural form (Bradach & Eccles, 1989; Combs et al., 2011; El Akremi et al., 2015). This increase in complexity may lead to higher information asymmetry between the firm’s insiders and outsiders (Rodríguez-Pérez & Van Hemmen, 2010), making it more difficult for analysts to derive accurate earnings forecasts (Bentley-Goode et al., 2019). These arguments lead us to formulate the first set of hypotheses:
H1a: Fee-oriented strategies are positively associated with analysts’ earnings forecast accuracy.
H1b: Fee-oriented strategies are negatively associated with analysts’ earnings forecast accuracy.
Moreover, the effect of fee-oriented strategies on analyst forecast accuracy may depend on companies’ information environment. According to prior studies, demand and supply of financial information are conditional on ownership concentration (Wang, 2006). Eng and Mak (2003) explain that the level of information disclosure is negatively related to ownership concentration. Firms with concentrated ownership tend to withhold information internally, and thus disclose less information to capital markets than firms with diluted ownership (Ajinkya et al., 2005; Anderson & Reeb, 2003), creating information asymmetries between insiders and outsiders. Therefore, assuming that fee-oriented strategies incorporate information on future performance, adopting fee-oriented strategies should critically improve the information environment of firms with concentrated ownership, which should help analysts make more accurate forecasts. These arguments lead us to formulate our second hypothesis:
H2: The impact of fee-oriented strategies on analysts’ earnings forecast accuracy is stronger for firms with concentrated ownership.
Data and Methodology
Sample and Sampling Procedure
We built the sample in five steps. First, we identified all hotel and restaurant firms available on Refinitiv Datastream over the 2010 to 2019 period and we retained firms from Europe and North America (N = 140). 3 Second, we kept only companies for which franchise and management fees could be hand-collected in annual reports and 10-k forms (N = 88). Third, we retrieved analyst earnings forecast data from the Institutional Brokers' Estimate System (IBES) database for each company-year observation. Fourth, we obtained all other firm-specific financial data (i.e., control variables) from Refinitiv Datastream and kept only firms for which the required information was available. Finally, after removing all firm-year observations with only one forecast (as it lead to a standard deviation of 0), the final sample was comprised of 29,019 analyst estimations made by 422 different analysts 4 for 11 hotels (6,855 observations) and 38 restaurant firms (22,164 observations). Out of the 49 firms, 19 (39%) were from Europe, 5 and 30 (61%) were from North America.
Model Development
To analyze the effect of fee-orientation on analyst forecast accuracy across different ownership structures, we investigated the impact of fee-oriented strategies for firms with or without concentrated ownership on analyst forecast accuracy (Model 1). The first model was the following:
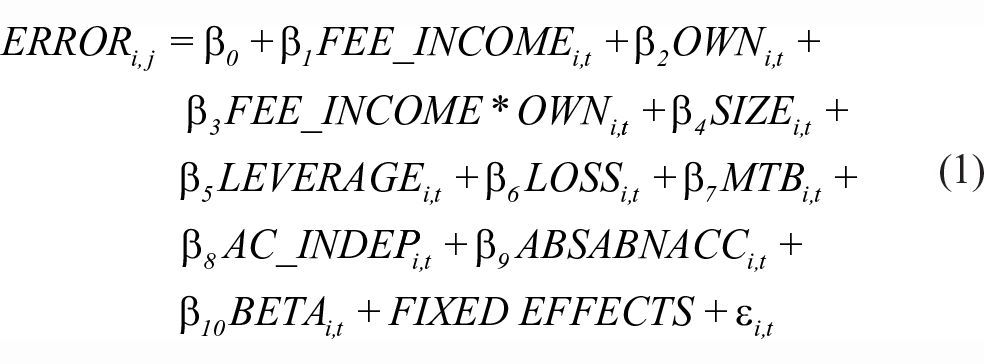
where ERROR was the analyst earnings forecast error, measured as the absolute difference between the actual EPS and the estimated EPS, scaled by the standard deviation of EPS estimations (absolute standardized unexpected earnings). The greater the difference between the actual and estimated EPS, the more the market will be surprised. The ratio was scaled by the standard deviation of estimations to account for the heterogeneity of expectations (i.e., a small standard deviation means that there is consensus among analysts, while a large standard deviation signals there is high uncertainty regarding future EPS). In line with previous studies (e.g., Poretti & Blal, 2020), FEE_INCOME measured the extent of fee-oriented strategies in the firm, computed as the ratio of franchise and management fees divided by total revenue. 6 OWN was a dummy variable taking the value of 1 if the percentage of voting rights owned by the largest investor is larger than the sample median, and 0 otherwise. The interaction term FEE_INCOME*OWN measured the incremental impact of fee-oriented strategies on analyst forecast accuracy for firms with concentrated ownership. If such strategies led to more accurate forecasts for firms with concentrated ownership, one might expect a positive coefficient β3 on this interaction term. In line with previous studies on analyst forecast accuracy (e.g., Bhat et al., 2006; So, 2013), various control variables were included in the model. SIZE measured firm size, computed as the natural logarithm of total assets. LEVERAGE was the ratio of long-term debt to total assets. LOSS was a dummy variable equal to 1 if net income was negative and 0 otherwise. MTB was the market-to-book ratio, which proxied for growth opportunities. AC_INDEP was a dummy variable equal to 1 if the audit committee was fully independent. 7 ABSABNACC was a measure of earnings quality, namely the absolute abnormal accruals calculated following Francis and Michas (2013). BETA measured risk and was the sensitivity of a given stock return to the market portfolio, calculated using 1 year of daily returns. We included analyst, firm, and year fixed effects. 8 All variables are defined in Appendix B (see the online supplemental materials).
Results
Summary Statistics
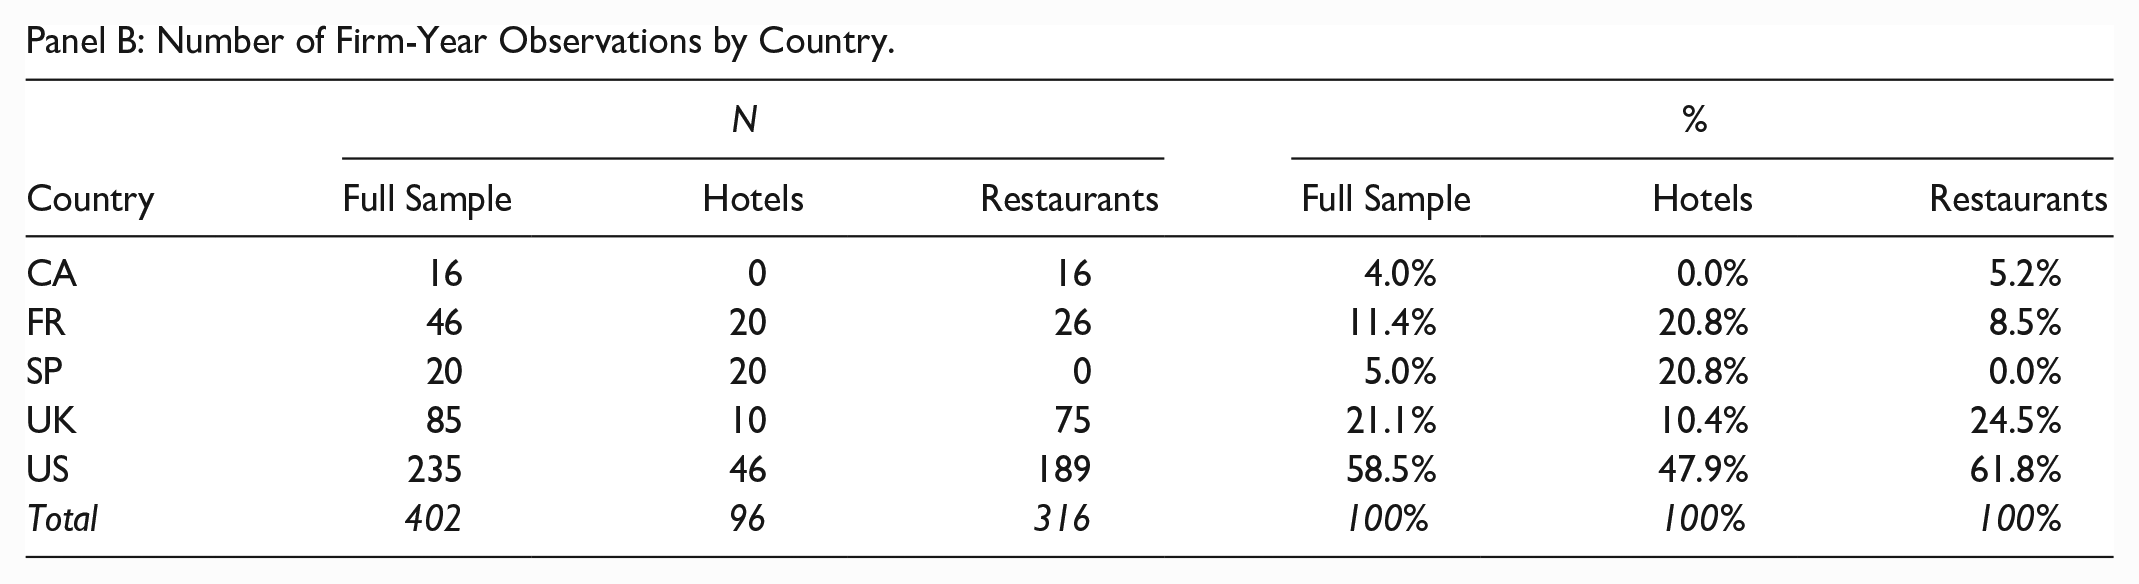
Table 1 documents the distribution of the sample by country and sub-industry. Panels A shows that the full sample was mainly composed of U.S. firms (68%), followed by U.K. firms (15%). Most analyst forecasts were related to restaurant firms (76%). Note that Appendix A provides information about the companies included in the sample. Panel B documents the distribution of firm-year observations by country and sub-industry. 9 Overall, as for forecasts, firm-year observations mostly came from U.S. (58%) and U.K. companies (21%), with 79% (316/402) of firm-year observations focusing on restaurant firms. Panel C presents information regarding sampled firms’ ownership structures. In all, 51% of observations were related to firms with concentrated ownership, and 49% to firms with diluted ownership. Furthermore, for the former group (concentrated), the main shareholder had, on average, 30.1% of voting rights, in contrast with the main shareholder in companies with diluted ownership who had, on average, only 8.9% of voting rights.
Sample Description.
Panel A: Number of Forecasts by Country.
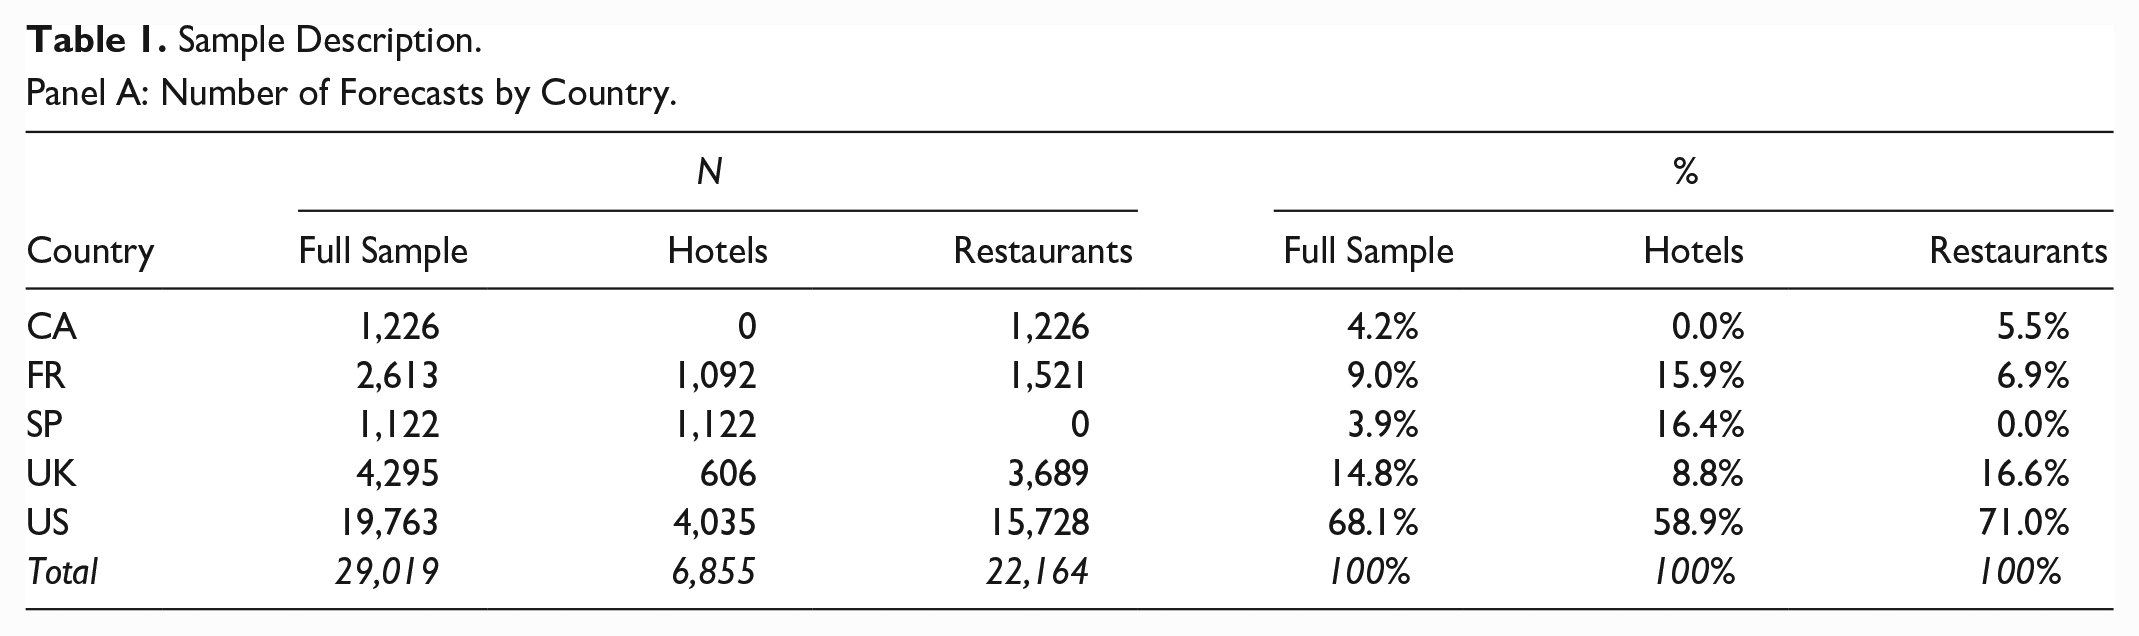
Panel B: Number of Firm-Year Observations by Country.
Panel C: Sample Distribution by Ownership Concentration.

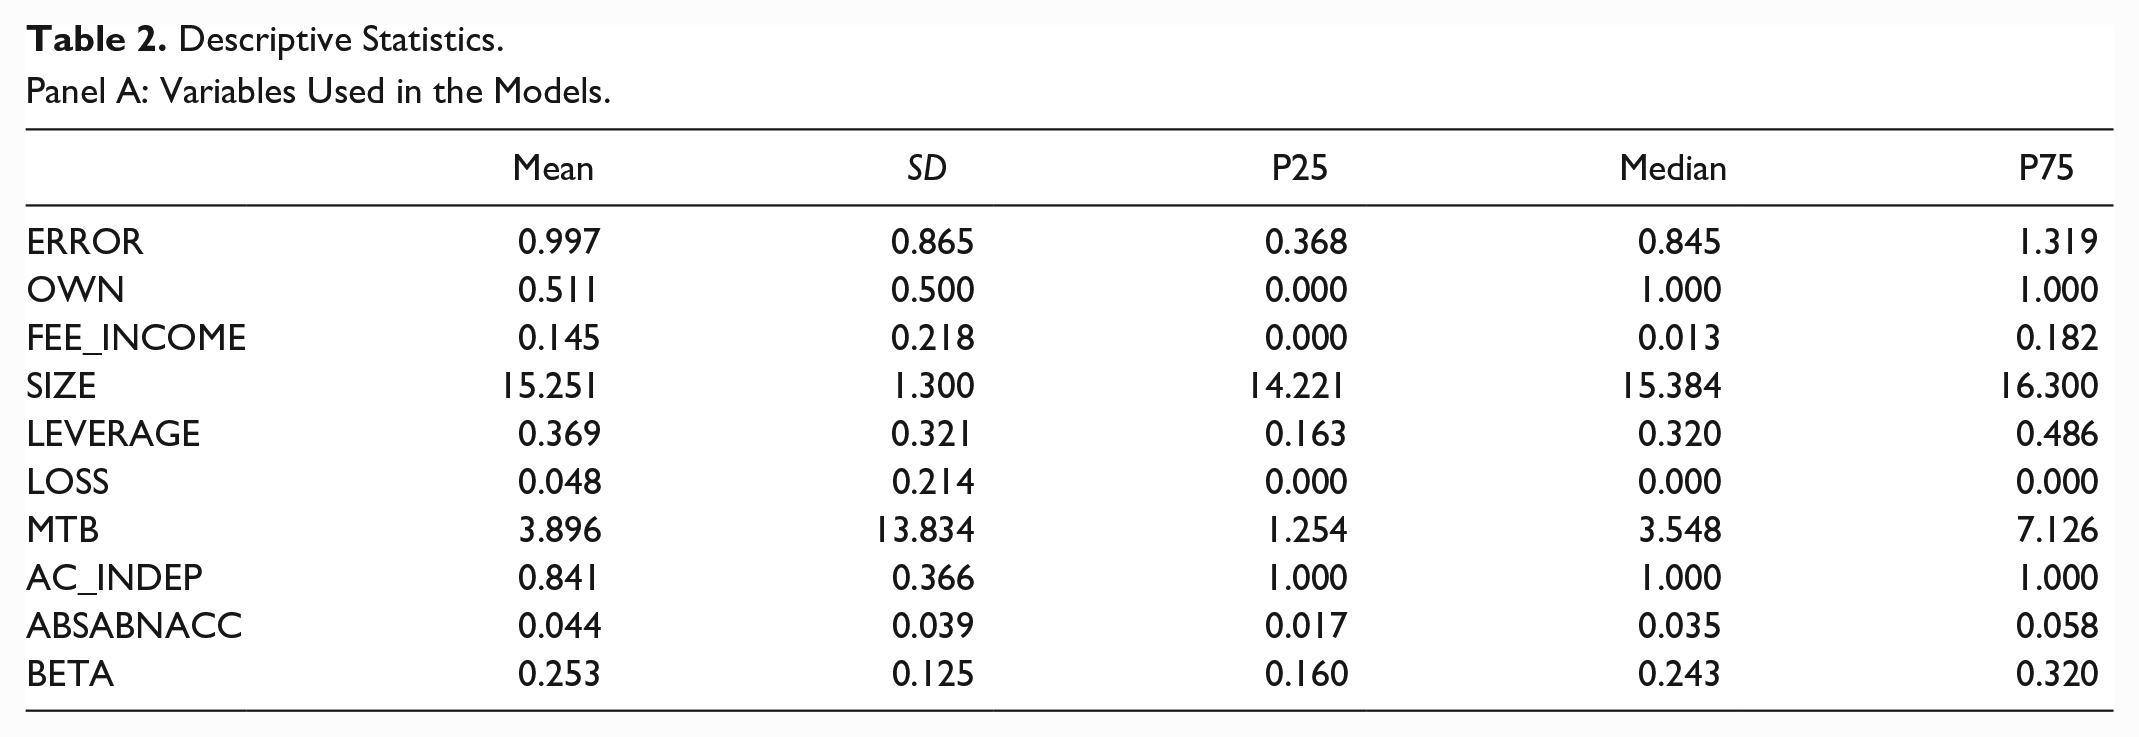
Descriptive statistics about the variables used in the models are provided in Panel A of Table 2. The analyst forecast error (ERROR) is expressed in absolute terms, which is why the figures are consistently positive, with an average analyst error of 99.7%. The average OWN (equal to 1 for firms with concentrated ownership) is equal to 51.1%. The average fee-income ratio is 14.5% (FEE_INCOME), 10 while the average SIZE is 15.25. The average debt-to-asset ratio is 36.9% (LEVERAGE), and firms disclose a net loss in 4.8% of observations (LOSS). The average market-to-book ratio (MTB) is 3.89. Next, 84% of audit committees are fully independent, and absolute abnormal accruals amount to 0.044 on average. Finally, the average BETA is 0.25.
Descriptive Statistics.
Panel A: Variables Used in the Models.
Panel B: Size of Sample Firms.
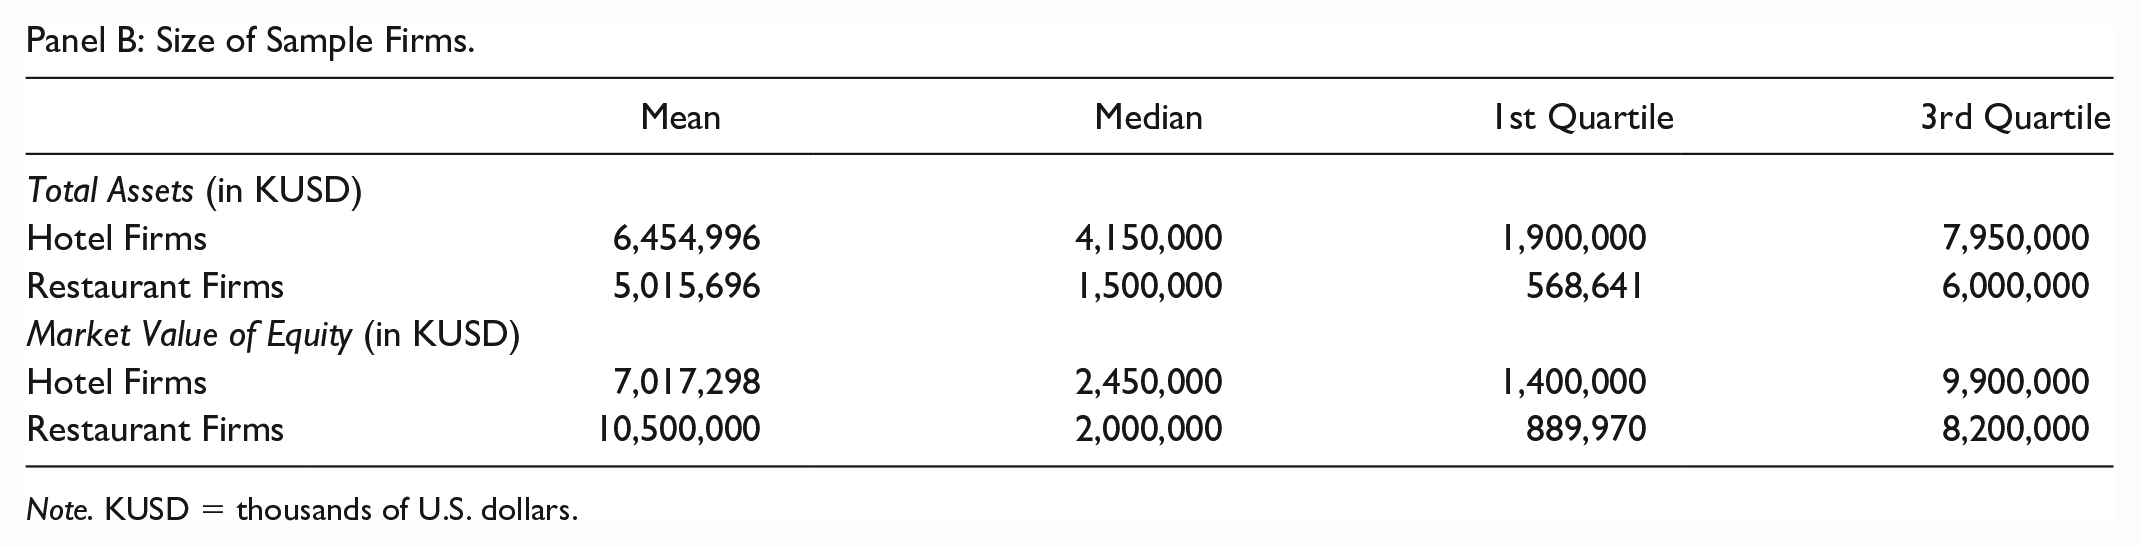
Note. KUSD = thousands of U.S. dollars.
Panel B of Table 2 describes the size of sample firms. On average (median), hotel firms are larger than restaurant firms in terms of total assets. However, the market value tends to be higher for restaurant firms, on average (but not median). This result is driven by several companies with high market values such as McDonalds, Starbucks, Chipotle Mexican Grill, Yum! Brands, and the Compass Group.
Correlation Matrix
Appendix C reports the Spearman correlations among the variables used in our models. Analyst forecast error (ERROR) is positively correlated with OWN and LOSS, while it is negatively correlated with FEE_INCOME, SIZE, MTB, and AC_INDEP. In other words, forecast errors were greater for firms with concentrated ownership and firms reporting a net accounting loss, while errors were smaller for larger firms, fee-oriented firms, and firms with greater growth opportunities and more independent audit committees. Given the high level of correlation among variables, and in line with Iacobucci and colleagues (2016), we mean-centered all variables used in the regressions. Variance inflation factors (VIF) were not higher than 4, indicating no multicollinearity issue.
The Impact of Fee-Oriented Strategies on Analyst Forecast Errors
The results of the application of Model 1 (OLS model) are presented in Table 3, with ERROR (the EPS forecast error scaled by the standard deviation [SD] of estimates) 11 as dependent variable. In Column 1, the results indicate that the greater the proportion of fee-income with respect to total revenue (i.e., fee-income ratio), the smaller the analyst forecast error, as evidenced by the negative and significant (p < .01) coefficient on FEE_INCOME. This result confirms H1a, that fee-oriented firms are associated with more precise analyst forecasts. Moreover, ownership concentration is associated with greater forecast error, as documented by the positive and significant (p < .01) coefficient on OWN. This result confirms the greater opaqueness underlying the information disclosed by companies with concentrated ownership, which makes their future earnings harder to forecast for analysts.
Fee-Oriented Strategies and EPS Forecast Errors.
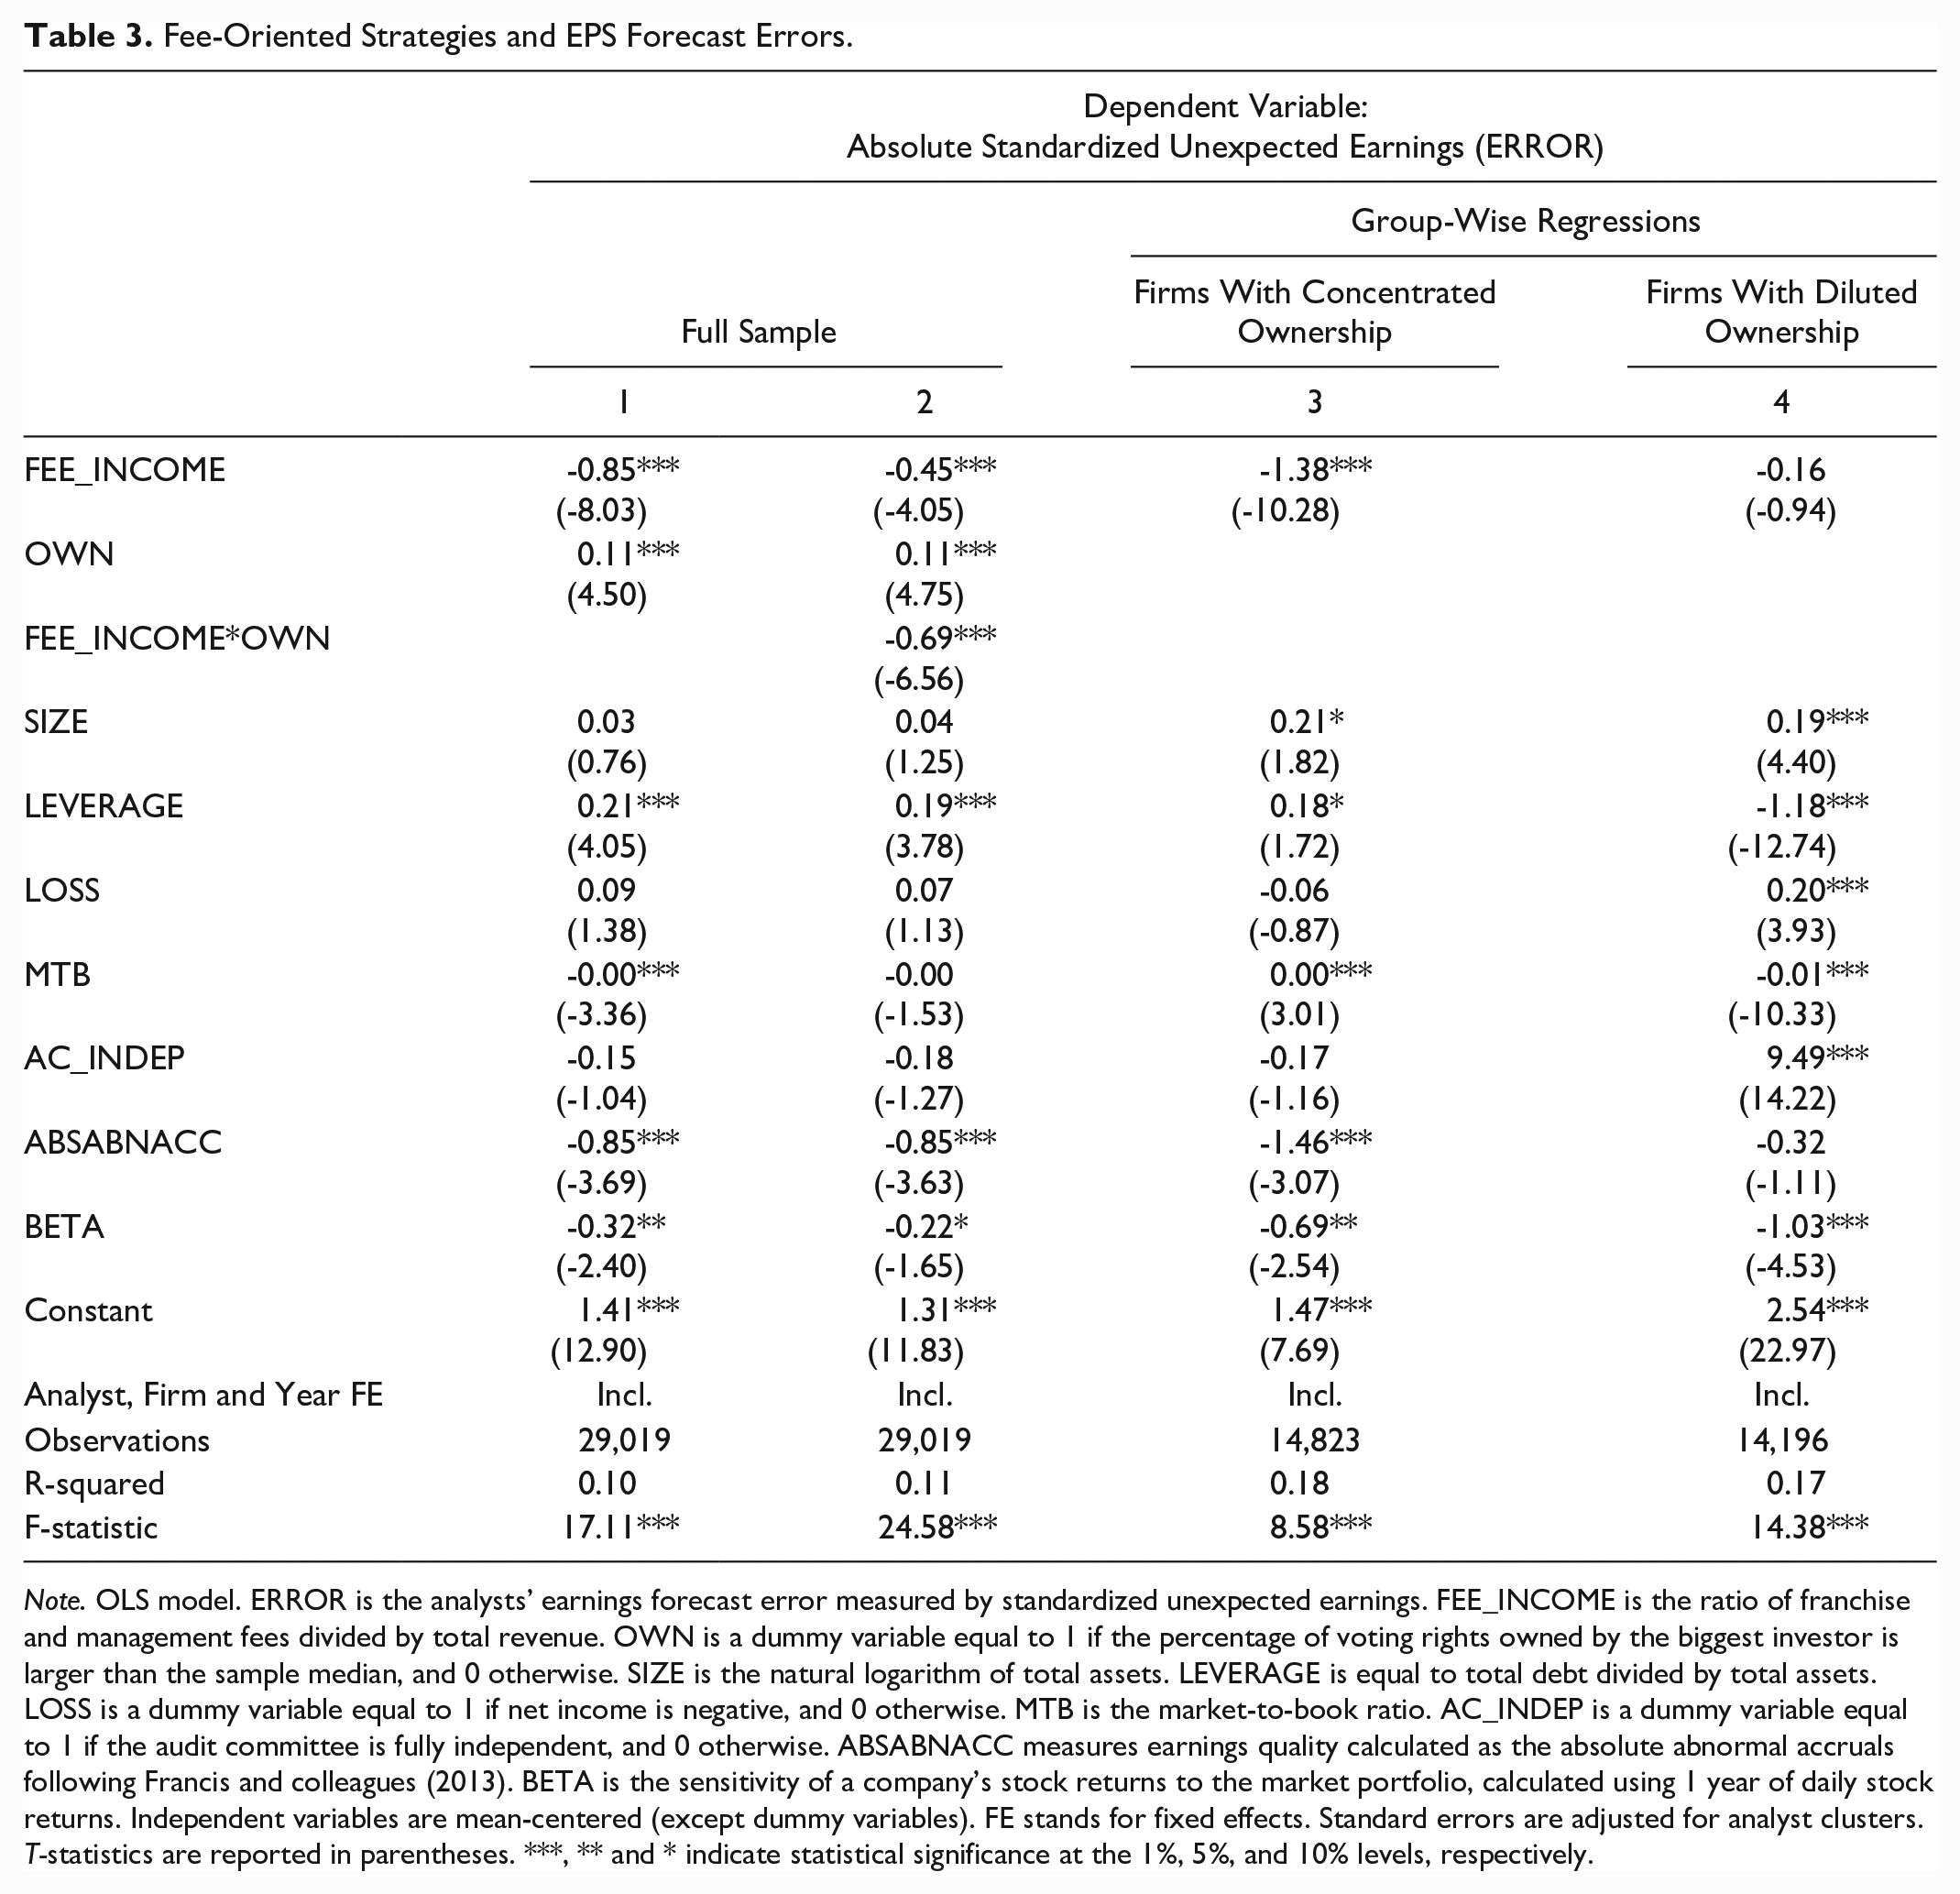
Note. OLS model. ERROR is the analysts’ earnings forecast error measured by standardized unexpected earnings. FEE_INCOME is the ratio of franchise and management fees divided by total revenue. OWN is a dummy variable equal to 1 if the percentage of voting rights owned by the biggest investor is larger than the sample median, and 0 otherwise. SIZE is the natural logarithm of total assets. LEVERAGE is equal to total debt divided by total assets. LOSS is a dummy variable equal to 1 if net income is negative, and 0 otherwise. MTB is the market-to-book ratio. AC_INDEP is a dummy variable equal to 1 if the audit committee is fully independent, and 0 otherwise. ABSABNACC measures earnings quality calculated as the absolute abnormal accruals following Francis and colleagues (2013). BETA is the sensitivity of a company’s stock returns to the market portfolio, calculated using 1 year of daily stock returns. Independent variables are mean-centered (except dummy variables). FE stands for fixed effects. Standard errors are adjusted for analyst clusters. T-statistics are reported in parentheses. ***, ** and * indicate statistical significance at the 1%, 5%, and 10% levels, respectively.
In Column 2, the coefficient on the interaction term FEE_INCOME*OWN is negative and significant (p < .01), meaning that the diminishing effect pursuing a fee-oriented strategy had on forecast errors was stronger for firms with concentrated ownership than for firms with diluted ownership, which is in line with our second hypothesis (H2). This result suggests that the effect of fee-oriented strategies on analyst forecast accuracy is dependent on the firm’s ownership structure.
To further investigate the results presented in Column 2, we ran group-wise regressions in Columns 3 and 4. In Column 3, we focused exclusively on firms with concentrated ownership, and the coefficient on FEE_INCOME appears to be negative and significant (p < .01). In contrast, in Column 4 (focus on firms with diluted ownership), the coefficient on FEE_INCOME is not statistically significant. In other words, the higher the firm’s reliance on a fee-oriented strategy, the more precise the analyst forecasts, 12 and such effect is magnified for firms with concentrated ownership. 13
Additional Analyses
Adopting a fee-oriented strategy
In this additional analysis, to refine our main findings, we investigated the impact of adopting a fee-oriented strategy on forecast accuracy for firms with concentrated or diluted ownership. To do so, we followed a Heckman (1979) two-stage approach in which we first modeled the decision to adopt a fee-oriented strategy using a probit model. Given that our sample was not the entire population of restaurant and hotel companies, the Heckman two-stage model enabled us to mitigate the endogeneity concern related to sample selection which could bias our estimations. To satisfy the exclusion restriction, we included MTB as a predictor in the first stage and excluded it in the second stage. Indeed, MTB was strongly associated with the probability of becoming fee-oriented in the first stage, while it was not correlated with the disturbance term in the second stage (Certo et al., 2016). Then, including the inverse Mills ratio (IMR) from the first step in the second step, we analyzed the impact of adopting a fee-oriented strategy on forecast accuracy, for firms with or without concentrated ownership (model 2):
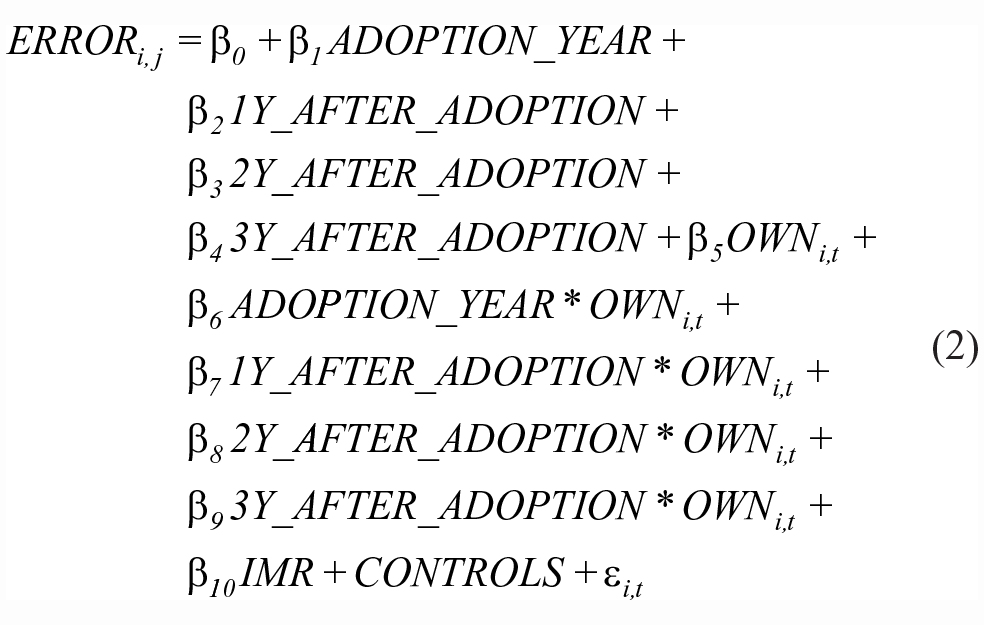
where ERROR is as defined for Model 1, ADOPTION_YEAR is a dummy variable equal to 1 on the year of the adoption of a fee-oriented strategy, 1Y_AFTER_ADOPTION is a dummy variable equal to 1 on the year following the adoption, 2Y_AFTER_ADOPTION is a dummy variable equal to 1 two years following the adoption, and 3Y_AFTER_ADOPTION is a dummy variable equal to 1 three years following the adoption. IMR stands for the inverse Mills ratio calculated in the first step. Each variable depicting the adoption of a fee-oriented strategy (and the 3 years following it) is then interacted with OWN (which is as defined for Model 1). We ran this model only on firms that either did not follow a fee-oriented strategy over the entire sample period or adopted a fee-oriented strategy during the sample period. 14 However, this comparison reduced sample size, with 12,570 observations in Model 2 (10,195 observations for asset-heavy firms, and 2,375 for companies adopting a fee-oriented strategy) instead of 29,019 in Model 1. Firms following a fee-oriented strategy over the whole period were excluded from the analysis, as they would have been part of the benchmark group and mixed with firms that remained asset-heavy over the whole sample period. We also included analyst, firm, and year fixed effects, and standard errors were clustered at the analyst level. 15 All variables are defined in Appendix B.
Model 2 enabled us to better capture the effect of fee-oriented strategies on analyst forecast accuracy by considering the decision to opt for a fee-oriented strategy as a “shock.” Furthermore, given that such a decision is not exogenous, including the inverse Mills ratio in the second step of the model captured the potential endogeneity underlying such a decision.
The results in Table 4 first indicate that ownership concentration, company size, and audit committee independence are all negatively associated with the probability of becoming fee-oriented. In contrast, leverage, losses, abnormal accruals and beta are associated with a higher propensity to become fee-oriented. Note that in Column 1 of Table 4, sample size is 418 because we explained the decision to become fee-oriented using unique firm-year observations, which contrasted with the analysis of analyst forecast accuracy for which there were various forecasts per firm-year.
Fee-Oriented Strategies Adoption and EPS Forecasts Errors—Heckman Two-Stage Model.
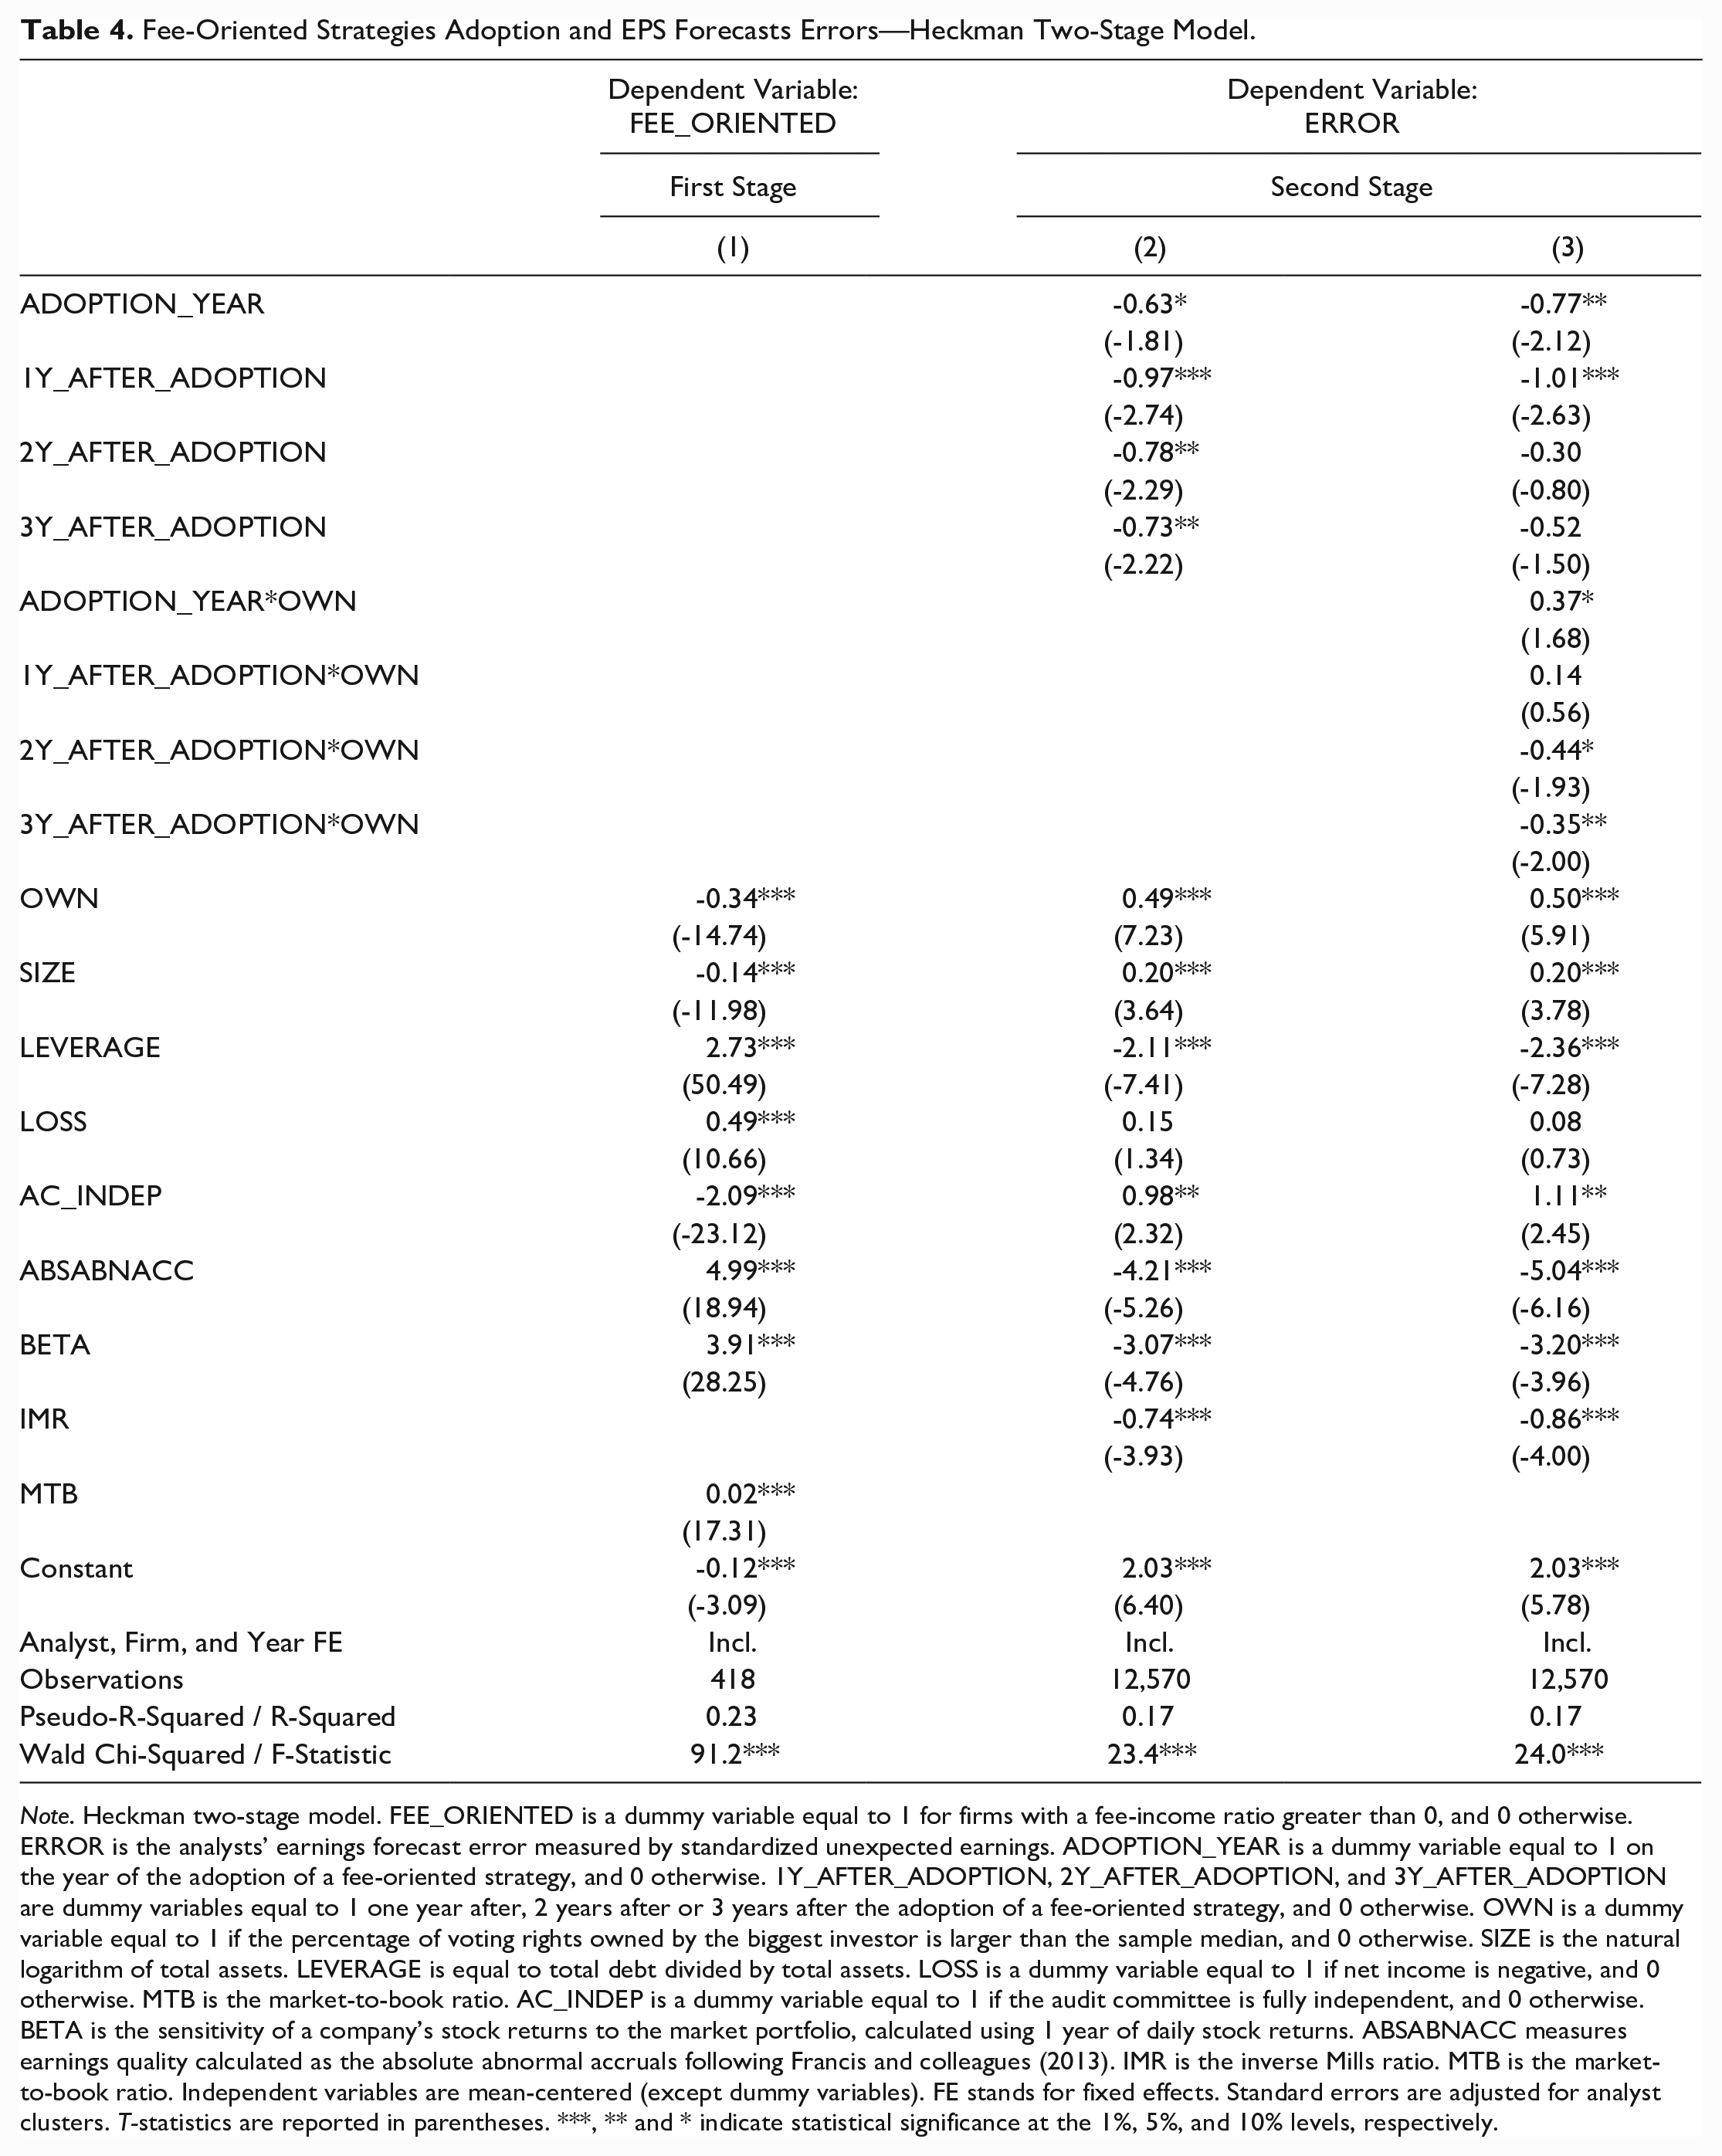
Note. Heckman two-stage model. FEE_ORIENTED is a dummy variable equal to 1 for firms with a fee-income ratio greater than 0, and 0 otherwise. ERROR is the analysts’ earnings forecast error measured by standardized unexpected earnings. ADOPTION_YEAR is a dummy variable equal to 1 on the year of the adoption of a fee-oriented strategy, and 0 otherwise. 1Y_AFTER_ADOPTION, 2Y_AFTER_ADOPTION, and 3Y_AFTER_ADOPTION are dummy variables equal to 1 one year after, 2 years after or 3 years after the adoption of a fee-oriented strategy, and 0 otherwise. OWN is a dummy variable equal to 1 if the percentage of voting rights owned by the biggest investor is larger than the sample median, and 0 otherwise. SIZE is the natural logarithm of total assets. LEVERAGE is equal to total debt divided by total assets. LOSS is a dummy variable equal to 1 if net income is negative, and 0 otherwise. MTB is the market-to-book ratio. AC_INDEP is a dummy variable equal to 1 if the audit committee is fully independent, and 0 otherwise. BETA is the sensitivity of a company’s stock returns to the market portfolio, calculated using 1 year of daily stock returns. ABSABNACC measures earnings quality calculated as the absolute abnormal accruals following Francis and colleagues (2013). IMR is the inverse Mills ratio. MTB is the market-to-book ratio. Independent variables are mean-centered (except dummy variables). FE stands for fixed effects. Standard errors are adjusted for analyst clusters. T-statistics are reported in parentheses. ***, ** and * indicate statistical significance at the 1%, 5%, and 10% levels, respectively.
Looking at the second stage in Table 4, the results indicate a positive and significant association between analyst forecast accuracy and the year of the adoption of a fee-oriented strategy as well as the years following the adoption (from the adoption year until 3 years after). Indeed, in Column 2, the coefficients on ADOPTION_YEAR, 1Y_AFTER_ADOPTION, 2Y_AFTER_ADOPTION, and 3Y_AFTER_ADOPTION appear to be negative and significant, while the coefficient on OWN is positive and significant. In other words, these results suggest a positive impact of adopting a fee-oriented strategy on forecast accuracy for several years following the adoption, compared to firms that did not change their business model. This forecasting improvement already appeared on the year of the adoption and was still present 3 years after.
In Column 3, we included interactions between OWN and (post)adoption-year variables. The results indicate that, overall, analyst forecasts were more accurate on the year of the adoption and the year after, but significant differences across ownership structures appeared. Companies with concentrated ownership only started to enjoy greater analyst forecast accuracy than their diluted counterparts 2 years after the adoption, which indicates a learning effect for analysts. When a firm with concentrated ownership adopted a fee-oriented strategy, analysts made less accurate forecasts on the adoption year, and started to be more accurate only 2 years after the adoption, which could be explained by the fact that it took some time for analysts to correctly incorporate this new information into their valuation models. For firms with diluted ownership, the benefits were most visible only during the first 2 years following the shift in business strategy. Overall, these additional analyses provided further details into our main findings.
Robustness Tests
In Table 5, we replicated the tests of Table 3 using a Heckman two-stage model (Columns 1 and 2) and entropy balancing (Columns 3 and 4; Hainmueller, 2012). As explained by McMullin and Schonberger (2020, p. 84), “entropy balancing identifies weights for the control sample to equalize the distribution of determinants across treatment and control samples.” Such a statistical method identifies a control sample which is as close as possible to the treated sample in terms of observable covariates (McMullin & Schonberger, 2022). Similar to propensity score matching techniques, entropy balancing is a method designed to address covariates imbalance, but it has the advantage of not reducing sample size. In our study, we defined the control group as asset-heavy firms, and the treated group as fee-oriented firms.
Heckman Two-Stage Model and Entropy Balancing.
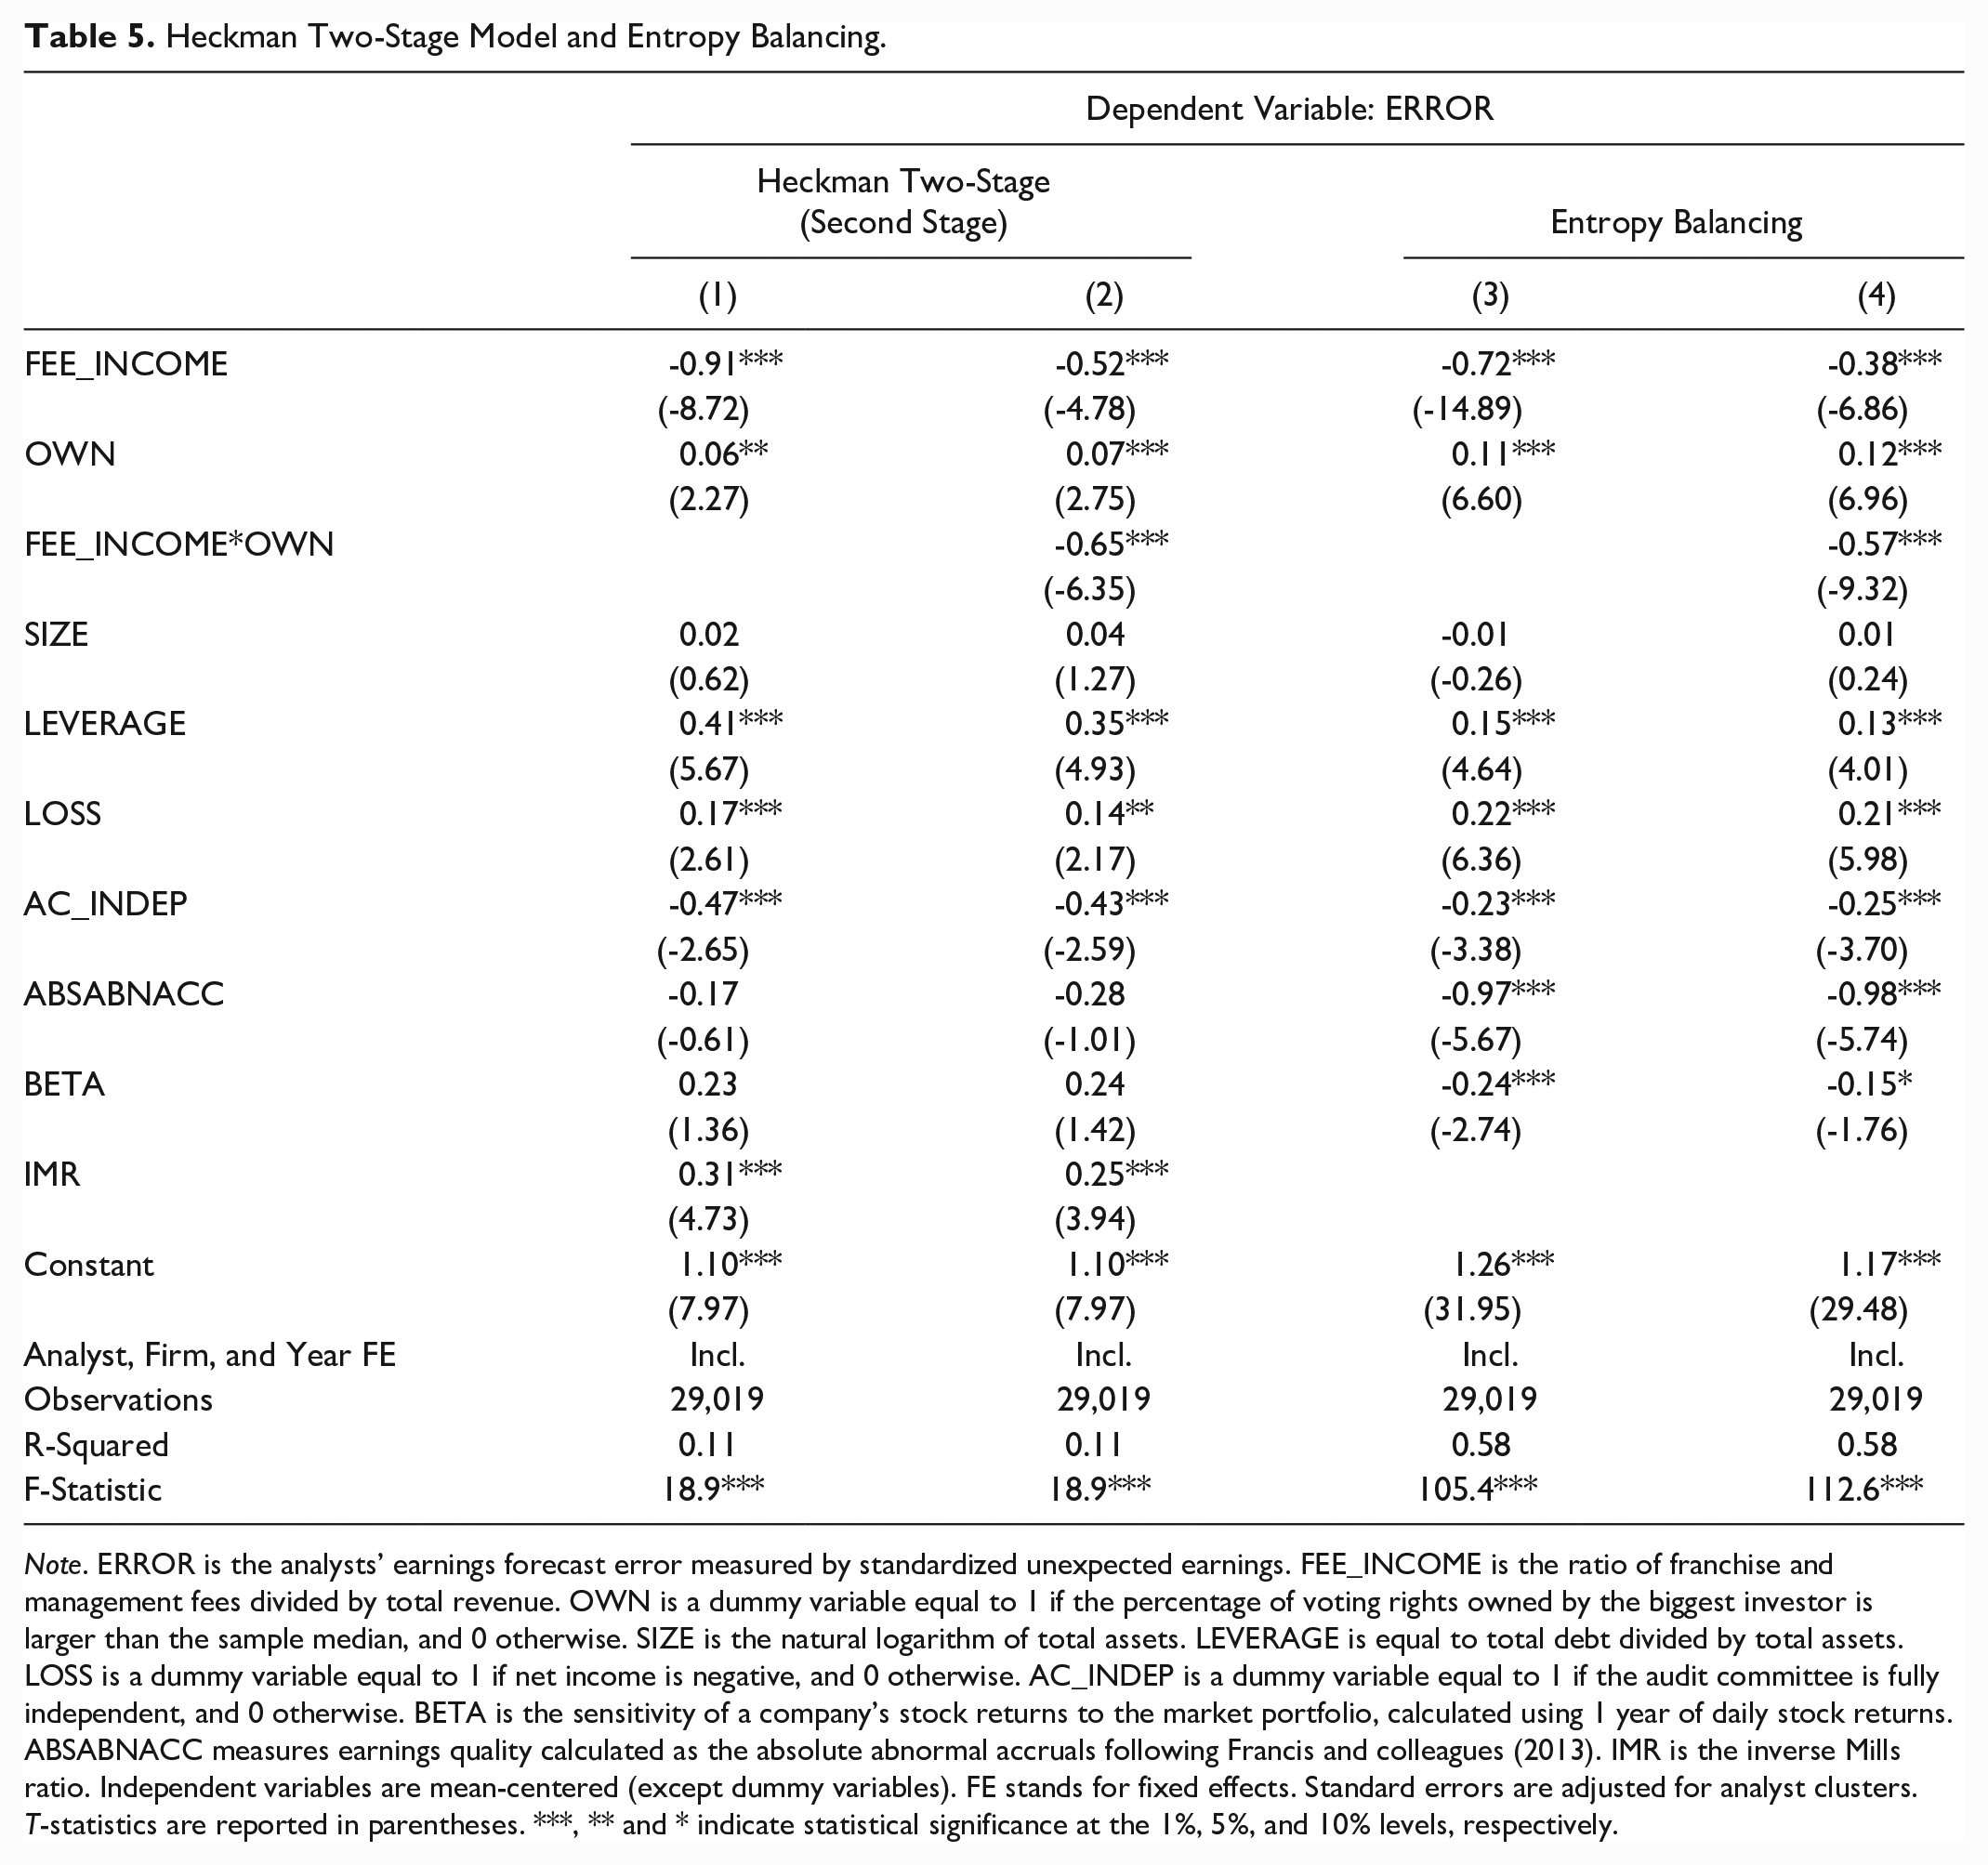
Note. ERROR is the analysts’ earnings forecast error measured by standardized unexpected earnings. FEE_INCOME is the ratio of franchise and management fees divided by total revenue. OWN is a dummy variable equal to 1 if the percentage of voting rights owned by the biggest investor is larger than the sample median, and 0 otherwise. SIZE is the natural logarithm of total assets. LEVERAGE is equal to total debt divided by total assets. LOSS is a dummy variable equal to 1 if net income is negative, and 0 otherwise. AC_INDEP is a dummy variable equal to 1 if the audit committee is fully independent, and 0 otherwise. BETA is the sensitivity of a company’s stock returns to the market portfolio, calculated using 1 year of daily stock returns. ABSABNACC measures earnings quality calculated as the absolute abnormal accruals following Francis and colleagues (2013). IMR is the inverse Mills ratio. Independent variables are mean-centered (except dummy variables). FE stands for fixed effects. Standard errors are adjusted for analyst clusters. T-statistics are reported in parentheses. ***, ** and * indicate statistical significance at the 1%, 5%, and 10% levels, respectively.
In Columns 1 and 2 (Heckman model) and 3 and 4 (entropy balancing) of Table 5, the results indicate that the coefficients on FEE_INCOME, OWN, and the interaction term are aligned with the main results of Table 3. We concluded that our main findings were robust to alternative statistical methods.
Conclusion, Contributions, and Implications
Our study addressed an important gap in the literature, namely how business strategies impact the ability of financial analysts—who are among the main intermediaries between publicly listed firms and investors—to forecast future performance across different ownership structures. Given that many hospitality companies have decided to shift their business model towards the plural form (following a mix between equity-based and fee-oriented strategies), we investigated whether this shift impacts analyst forecast accuracy, and if the effect of this change is conditional on the ownership structures of hospitality firms. Our findings support the view that more stable cash flows stemming from the fee-oriented strategy enable analysts to make more accurate forecasts, especially for firms with concentrated ownership, which tend to be associated with more information asymmetries.
This study makes several contributions. First, by documenting the impact of fee-oriented strategies on analyst forecast accuracy, we contribute to the literature analyzing the consequences of business strategies on various outcomes (e.g., Andrew et al., 2007; Choi et al., 2018; Dogru et al., 2020; Gim & Jang, 2019; Li & Singal, 2019; Poretti & Blal, 2020). Despite the potential increase in firm complexity related to the pursuit of ALFO strategies documented by Poretti and colleagues (2023), we show that fee-oriented strategies lead to more accurate analyst forecasts, meaning that from an outsider perspective, the benefits outweigh the costs. The findings also contribute to the debate around the pros and cons of fee-oriented strategies, and the fact that “considering this model as a one-size-fits-all solution is a fundamental flaw” (Blal & Bianchi, 2019, p. 40). From the perspective of a listed firm with significant analyst following, fee-oriented strategies might have the advantage of reducing earnings surprises, which would not be the case with a private company that is not followed. Second, we contribute to the literature on the economic consequences of concentrated ownership structures (Ajinkya et al., 2005; Anderson & Reeb, 2003; Ding et al., 2011; Schulze et al., 2003; Wang, 2006). The literature documents a negative relationship between ownership concentration and information disclosure (Eng & Mak, 2003). Our study indicates that fee-oriented strategies can mitigate the information asymmetry induced by ownership concentration, leading to a more favorable information disclosure environment. As such, we shed light on an unexpected “governance effect” induced by fee-oriented strategies. Third, we expand the literature on analyst forecast accuracy (e.g., Andersson & Hellman, 2007; Bradley et al., 2017; Chu & Zhai, 2021; Denis et al., 2003) by documenting the important role business strategies play in analyst forecast errors. Finally, by using an international sample of hospitality firms, our study answers the call from kim, noh, and lee (2019) asking for additional studies on fee-oriented strategies using international data, thus extending the contexts for research on fee-oriented strategies in hospitality firms.
From a practical perspective, this study provides useful information for hospitality firms’ investors by showing that business strategies have a direct effect on financial analysts’ work, who are important actors of capital markets. Our findings indicate that investors can trust analyst forecasts more for fee-oriented firms, as analysts make smaller forecasts errors for these firms. Furthermore, from a firm’s stakeholder standpoint (i.e., investors, creditors), our findings shed light on the fact that for an asset-heavy firm with concentrated ownership, adopting or increasing the reliance on a fee-oriented strategy might enhance the firm’s information disclosure environment by providing more accurate and relevant information regarding future performance. Such effect might be particularly important to minimize the expropriation of private benefits by majority blockholders at the expense of minority shareholders. Also, an increased level of transparency regarding future performance due to the pursuit of fee-oriented strategies might play a role in improving CEO and CFO monitoring mechanisms and mitigate opportunistic behaviors such as earnings management practices.
For hospitality firms’ insiders, such as executives or board members, this study provides new insight into the consequences of pursuing a fee-oriented strategy. The literature documents that analysts play a crucial role as information intermediaries for investors, especially for more complex firms (e.g., Lehavy et al., 2011). For a listed company, the ability to disclose to stakeholders clearer information regarding future performance implies less reliance on analyst work, and potentially less uncertainty and less market pressure. Such reduced uncertainty might enable firms to attract investors more easily and, thus, reduce cost of capital. Furthermore, from a planning perspective, the ability to forecast future profitability more accurately is essential from a risk management standpoint. If fee-oriented strategies make analyst forecasts more accurate, the accuracy of the budgeting process within fee-oriented firms might also be improved. This point should not be neglected when deciding to pursue, or not, a fee-oriented strategy.
Our study is not without limitations. First, we focus on hotel and restaurant firms, which might limit the generalizability of our findings to other hospitality sub-industries, such as cruise liners, casinos and gaming, travel and leisure, or airlines. Nevertheless, the limited adoption of fee-oriented strategies by other hospitality sub-industries makes their inclusion in the analysis difficult and questionable. Moreover, the heterogeneity underlying our sample should be kept in mind. Significant differences exist when comparing hotel to restaurant firms, but also across restaurant firms. Future studies might contribute to ours by focusing on the restaurant industry specifically. Next, due to data availability, our sample exclusively focuses on Europe and North America, while future studies may include Asian countries to further understand how different institutional contexts impact our results. Last but not least, our sample period stops in 2019 to avoid the effect of the COVID-19 crisis. Future studies may include more recent years to investigate how the association between analyst forecast accuracy and business strategies was affected by the COVID-19 crisis.
Supplemental Material
sj-docx-1-jht-10.1177_10963480231179995 – Supplemental material for Fee-Oriented Strategies, Ownership Structure and Analyst Forecast Accuracy in the Hospitality Industry
Supplemental material, sj-docx-1-jht-10.1177_10963480231179995 for Fee-Oriented Strategies, Ownership Structure and Analyst Forecast Accuracy in the Hospitality Industry by Cedric Poretti, Adam Aoun and Manisha Singal in Journal of Hospitality & Tourism Research
Footnotes
Declaration of Conflicting Interests
The authors declared no potential conflicts of interest with respect to the research, authorship, and/or publication of this article.
Funding
The authors received no financial support for the research, authorship, and/or publication of this article.
Supplemental material
Supplemental material for this article is available online.
Notes
Author Biographies
References
Supplementary Material
Please find the following supplemental material available below.
For Open Access articles published under a Creative Commons License, all supplemental material carries the same license as the article it is associated with.
For non-Open Access articles published, all supplemental material carries a non-exclusive license, and permission requests for re-use of supplemental material or any part of supplemental material shall be sent directly to the copyright owner as specified in the copyright notice associated with the article.