
Abstract
In this article, we evaluate the relationship between quality investing combined with Economic Moat, ESG (Environmental, Social and Governance) and analyst opinions over the period 2014–2020 based on a data set comprising 803 US stocks. Performance is evaluated using several metrics (returns and alphas). Our results show that quality stocks measured by return on invested capital (ROIC) exhibit superior performance. The incorporation of competitive advantages allows a better discrimination among the classic high-quality strategies. Investment in stocks with quality and high ESG entails the payment of a premium but buying quality companies with Economic Moat makes up for this negative aspect. The results show how quality companies that have competitive advantages obtain a better future performance and are recognized by the market with a higher valuation. However, the markets may take time to recognize this value since the incorporation of the average Price-to-Price target (Analyst consensus) increases the future performance.
Introduction
Quality investing consists of selecting more solvent and less risky stocks according to a set of ratios, usually referring to financial strength (Novy-Marx, 2013). Asness et al. (2019) defined quality stocks as those that were “safe, profitable and growing,” and even if investors are willing to pay a higher price for quality shares, markets undervalue them. Quality metrics, based exclusively on financial information, have been proposed to assess the effect of quality. Based on these ideas, several indexes have been launched like the MSCI World Quality Index, which considers three main variables: return on equity (ROE), stable earnings growth (Earnings Variability), and low financial leverage (Debt to Equity). Taking the evolution from the period June 1994 to February 2021, there is a notable difference in the behavior of the Quality Index compared with the MSCI World Index. The profitability (gross returns annualized) of the Quality Index is greater than 300 basic points while the Beta with respect to MSCI World is only 0.88 (MSCI, 2021).
However, the use of exclusively financial information (backward looking) may not be enough to identify companies that can maintain their attributes over time. Hanson and Dhanuka (2015) redefined “quality companies” as those incorporating sustainable competitive advantages that can be maintained or increased in the future. Companies with durable franchises have a higher probability of maintaining their competitive advantages in the long term. In this sense, they proposed combining non-financial indicators with the quality financial metrics. The seminal papers of Deming (1982) and Juran (1982) indicated that quality is essential to have and maintain competitive advantages. Having these can generate superior performance (see Barney, 1991; Newbert, 2008; Porter, 1980, 1981, 1985) although the main difficulty is detecting when they exist. In this article, we explore the Economic Moat, popularized by Warren Buffett, as one possible option. Morningstar determines the Economic Moat based on qualitative and quantitative information and classifies companies according to their ability (wide moat), or inability (narrow moat or none moat) to have sustainable competitive advantages. The main attributes that determine the Economic Moat are the cost advantage, the efficient scale, intangible assets, network effects and switching costs (Morningstar, 2015). Several papers have studied the effect of the moat, with mixed results (Boyd, 2011; Gherde et al., 2010; Kanuri & McLeod, 2016; Liu & Mantecon, 2017; Morningstar, 2020). Morningstar has created an index called Morningstar Wide Moat Focus, with U.S. companies identified as having sustainable, competitive advantages and whose stocks are undervalued according to Morningstar Analysts. Recently, Morningstar (2020) showed how strong the Index performed even after a declining market, but there was no evidence of any effect from including the Economic Moat in the financial quality measures.
Other researchers proposed adding Environmental, Social and Governance (ESG) factors as a measure of quality. Indeed, some investors looked exclusively at ESG criteria to identify quality businesses (Hanson & Dhanuka, 2015). The ESG metrics play an important role as proxies of sustainability performance (Widyawati, 2020). Furthermore, ESG factors were also considered a proxy of financial health (La Torre et al., 2020; Lee et al., 2010) whereas quality companies were considered less risky and more solvent. The lack of reliable metrics in ESG has been overcome with the recent launch of ESG ratings by several data providers like Bloomberg, Thomson Reuters, Morningstar, and Morgan Stanley Capital International (MSCI). Nevertheless, so far, investment quality has not considered either the Economic Moat or ESG factors to discriminate between high- and low-quality companies.
In addition, the quality strategy should consider the valuation so as to avoid stocks which are appealing due to their quality but are overvalued. According to Mead et al. (2013), such a consideration is necessary so that a quality strategy can be implemented but that the combination of both criteria would be the best strategy to generate sustainable long-term performance. Asness et al. (2019) turned to the QARP (quality at a reasonable price), meaning that quality stocks could be highly priced as long as the margin was narrow. By the same token, the QARP philosophy proposes the combination of quality and undervaluation, blending a Quality indicator with the book-to-market ratio, showing a Sharpe ratio higher than that of the strategies based only on quality or value. The empirical results of QARP are mixed; several authors showed that the strategies which combined quality and value (low price), using market-to-book ratio, performed better than those based only on value or quality (Novy-Marx, 2014; Piotroski & So, 2012) or did not improve when both criteria were mixed together (Lalwani & Chakraborty, 2018). In addition, Asness et al. (2019) demonstrated that quality explained prices but only to a limited extent. In this article, we propose applying QARP using just the fundamental analyst valuations of the stocks to choose undervalued assets. Instead of book-to-price, we use the price-to-target ratio provided by Datastream.
Despite there being several studies about quality investment using financial indicators, little is known about the consideration of qualitative criteria, like competitive advantages and sustainability. Moreover, most of the strategies have been evaluated without considering the QARP principle. In this article, we suggest analyzing the effect of combining conventional quality strategies with Economic Moat and ESG criteria, considering at the same time the fair price. In particular, we endeavor to answer three essential questions: (1) Which quality strategies are useful for predicting stock returns? (2) Is it useful to redefine quality with qualitative information? And, (3) does considering QARP principle improve quality strategies?
There is a gap in the literature bearing in mind that, to our knowledge, there is yet no evidence about the combination of quality investment with ESG criteria, competitive advantages, and the analysts’ predictions. Our article significantly contributes by providing valuable insights into the impact of quality on stock performance. We build upon the work of prominent researchers like Greenblatt (2006, 2010), Piotroski (2000), Novy-Marx (2013), and Asness et al. (2019), who have proposed various quality indicators, such as return on invested capital (ROIC), F-Score, Gross profitability, and the “quality minus junk” (QMJ) strategy. By considering multiple quality indicators, we enhance the selection of appropriate financial measures to implement effective quality strategies. In addition, our research study offers empirical evidence on the effect of competitive advantages on a stock’s performance. Combining quality with the concept of “Economic Moat” allows for a better understanding of how competitive advantages influence stock returns. Furthermore, our study is relevant to the literature on sustainable investments and incorporates the valuation of business analysts, thereby contributing to the ongoing debate regarding the impact of their recommendations on stock selection.
Our results show that quality stocks measured by the ROIC exhibit superior performance. The quintile of high ROIC stocks provides an excess alpha of 2.11 daily basic points above the other quintiles. Our research supports the importance of considering competitive advantages, whereby the incorporation of Economic Moat allows a better discrimination between classic quality strategies. Related to ESG investment, buying stocks of high quality with high ESG scores implies paying a premium, although the Economic Moat compensates for this disadvantage. If combined with quality investing, the Morningstar Star Rating is not significant, even though it is the average Price-to-Price target (analyst consensus). Investing in companies with the biggest ROIC (top quintile) combined with wide or narrow Economic Moats and the greater potential for revaluation given by the analyst consensus provides an excess alpha. Our results show that conventional quality strategies (high ROIC, etc.) can be improved by incorporating companies’ competitive advantages (Economic Moats) and, above all, analyst consensus regarding the potential for stock revaluation (price-to-price target ratio). Therefore, quality companies which have competitive advantages will obtain a better future performance and are recognized by the market with a higher valuation. However, the markets may take time to recognize this value since the incorporation of the average Price-to-Price target (Analyst consensus) increases the future performance.
The remainder of the article is laid out as follows: “Hypothesis development data and methodology” section describes the data, the variables, and the main descriptive statistics. “Results” section discusses the methodology and the results. Finally, “Robustness” section conducts some robustness tests and the “Conclusions” section concludes the article.
Hypothesis development data and methodology
Hypotheses development
There have been several measures used as quality proxies, although the most appropriate metric and the effect on performance alike, are still open to debate. Grantham (2004) proposed an index based on low leverage, low earnings volatility, and high profitability. Later, Greenblatt (2010) mixed value with quality using ROIC in his strategy as the indicator of quality with good price, measured by EBIT/EV ratio (Earnings before interest and taxes divided by Enterprise value). Blackburn and Cakici (2017) found evidence of its usefulness in Europe, but not in the other markets throughout the period studied (1991–2016). The F-Score, proposed by Piotroski (2000), is an accounting measure that has been widely used as a quality indicator as well. Several studies have shown how useful this indicator is at identifying stocks likely to achieve higher performance (Fama & French, 2006; Ng & Shen, 2016, 2020; Piotroski & So, 2012), helping to improve the results of value strategies. This evidence is also supported in different geographical areas; Walkshäusl (2017, 2019) applied the F-score at European level, while Hyde (2018) and Ng and Shen (2020) showed the relationship between the F-score and yield in Australia and five Asian stock markets. Recently, Walkshäusl (2020) showed that the F-score was a good predictor of stock returns and profitability of companies using an international sample during the period 2000–2018. In addition, although it was initially applied to stock value, it has recently shown its effectiveness in all types of stocks (Hyde, 2018; Ng & Shen, 2020; Piotroski & So, 2012; Walkshäusl, 2020). Gross profitability was justified by Novy-Marx (2013) as a quality metric that had much greater predictive power than other accounting ratios like return on assets (ROA) or ROE. Many expenses included in the traditional profitability ratios, like Research and development or advertising, reduce the net income but increase expectations in future results. Kalesnik and Kose (2014) confirm that gross profitability can predict stocks returns in the US market, but the returns are higher for portfolios based on F-score for the Asian markets (Ng & Shen, 2020). Finally, Asness et al. (2019) combined multiple quality indicators to identify high-quality stocks by putting forward the “quality minus junk” (QMJ) strategy, which used 21 financial indicators and evidenced higher risk-adjusted returns. Considering several quality indicators, our article contributes to the selection of appropriate financial measures to implement quality strategies:
Future performance of companies would be conditioned by the ability to maintain their competitive advantages in the long term. Despite the scarcity of research, some studies indicate that stocks with wide moats maintain their competitive advantages in the long term and outperform those with low moats (Boyd, 2011). Kanuri and McLeod (2016) found that wide moat portfolios had outperformed the S&P 500 and Russell 3000 indices in terms of several performance measures, including the Carhart four-factor model. Also, Morningstar (2020) analyzed the performance of the Morningstar Wide Moat Index, stating that since its inception in 2007, it had generated an annual outperformance of 363 basic points relative to the benchmark along with better behavior during falls. Nevertheless, Liu and Mantecon (2017), when comparing the performance of wide moat and narrow moat or no moat, saw an unexpected result whereby firms without any competitive advantage outperformed those with wide moats. So our second hypothesis is as follows:
Given that sustainability is now an essential element, it is difficult to justify classifying a company as “quality” without also considering sustainability criteria. Some investors consider ESG factors to be proxies of financial soundness with a significant amount of the literature on SRI and performance pointing toward a positive effect on financial performance (Eccles et al., 2014; Schramade, 2016). The meta-analysis conducted by Friede et al. (2015) using 2,200 empirical studies showed that a significant percentage of the papers supported a positive relationship between ESG and financial performance. However, the results using ESG ratings to evaluate stock performance are mixed. Glossner (2018) discovered that ignoring ESG risk had a negative impact on the portfolio performance of the U.S. market, with a four-factor alpha of –3.5% per year, after monitoring for industry and company characteristics. The author pointed to the unexpected ESG incidents and negative earnings as the factors for such a result to have occurred. Also, Kao et al. (2018) show that the relationship of corporate social responsibility (CSR)–performance is not constant, recognizing the long-term benefits of CSR and Huang et al. (2020) do not find any effect of ESG on the value of the firms. But, Durán-Santomil et al. (2019) demonstrated that the level of performance for mutual funds with higher sustainability scores had risen. Also, Soler-Domínguez et al. (2021), find a positive effect of sustainable stocks or mutual funds on performance and Mervelskemper and Streit (2017) show a positive valuation of the firms with an ESG report. On the contrary, Hübel et al. (2019) using the S&P 500 ESG Factor-Weighted Index understood that the reason that it outperformed the S&P 500 was due to the weighting methodology and exposure to size, investment and momentum factors, as opposed to ESG ratings. Finally, investors paid premiums for investing in high ESG stocks in the European market (La Torre et al., 2020), as in the case of green energy mutual funds (Martí-Ballester, 2019; Reboredo et al., 2017). Our third hypothesis is as follows:
Some previous research has shown that analyst recommendations are useful for predicting stock returns on profitability. Thus, the purchase of shares with a high favorable consensus can generate an excess return (Barber et al., 2001); the quarterly selection based on analyst consensus also predicts the performance of shares (Jegadeesh et al., 2004); the recommendations can help predict future returns (Howe et al., 2009); certain analysts possess skills (Crane & Crotty, 2020; Loh & Stulz, 2018) and give more favorable recommendations to under-priced stocks, leading to highly significant results in the US market (Azevedo & Müller, 2020). On the flip side, there are some authors who fail to find a positive relationship between recommendations and long-term yields (Altinkili et al., 2016; Da & Schaumburg, 2011), claiming that analysts can actually contribute to mispricing, even if the undervalued stocks with high mispricing and low consensus have positive future returns (Engelberg et al., 2020; Guo et al., 2020). In this article, analyst recommendations are used in the QARP context, showing their suitability in designing quality strategies at a reasonable price. Our last hypothesis is as follows.
Data
Our data consist of stocks with Morningstar Star Ratings from the U.S. market covering all quarters within the period 2014–2020 (28 in total). The stocks returns and the accounting data come from the merging of Morningstar and Eikon-Datastream databases. Following Asness et al. (2019), the accounting variables are at the end of the quarter/fiscal year. We focus on U.S. stocks rated by Morningstar Analysts. Our final sample is comprised of 803 stocks listed in the US market. 1
Dependent variables
We have used several measures for stock return. From the Morningstar Database, we have utilized the quarterly return (Return), and different factor models. We estimate the following factor alphas with these models: the four-factor alpha (4F Alpha) with Carhart’s (1997) model; the five-factor alpha (5F Alpha) with the time series regression model, as proposed by Fama and French (2015, 2017); and the six-factor alpha (6F Alpha), with the model considered by Fama and French (2018), which is the 5F model augmented by Carhart’s momentum factor:
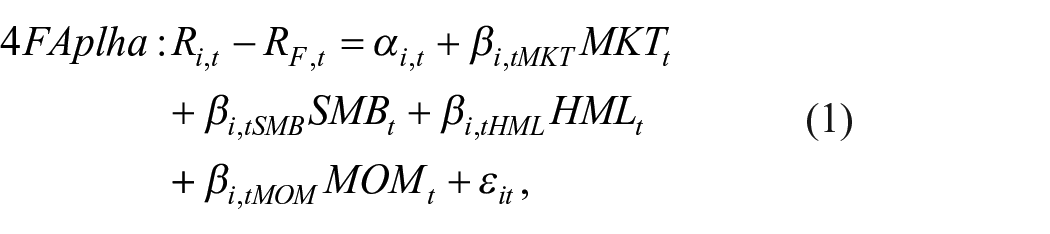
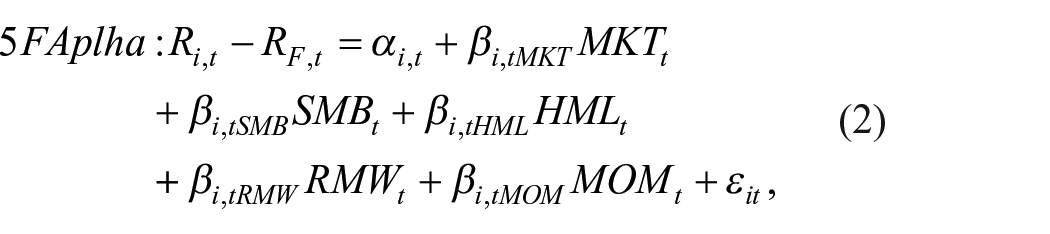
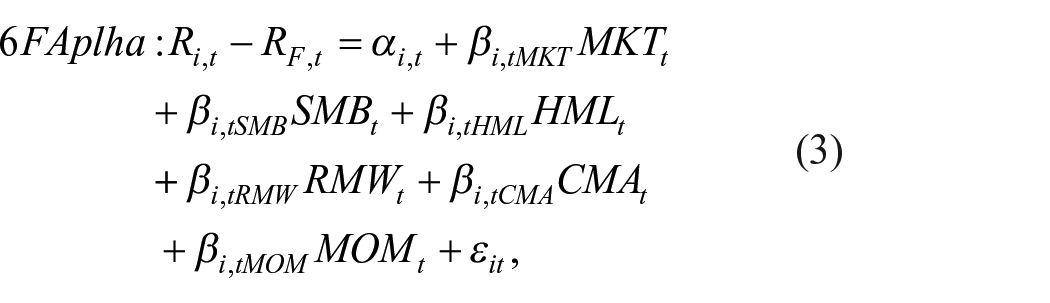
where
Independent variables
Quality measures
First of all, based on Greenblatt (2010) we use the ROIC as the first measure of quality. Second, we employ the F-score proposed by Piotroski (2000) based on accounting information as the sum of nine binary variables relative to profitability, liquidity, and operating efficiency. The higher the F-score value, the higher the quality assigned to the firm. The estimation has been performed with quarterly information from Eikon-Datastream financial statements. Third, gross profitability, proposed as a quality measure by Novy-Marx (2013), has also been included. Finally, the Quality minus Junk strategy is considered. Proposed by Asness et al. (2019), the measure combines multiple quality indicators to identify high-quality stocks. The authors created a quality control, namely, “quality minus junk” (QMJ), which combines 21 indicators: profitability (six variables), ROA, ROE, gross profit on assets (GPOA), cash flow on assets (CFOA), gross margin (GMAR), and the fraction of earnings composed of cash (i.e., minus accruals, ACC). Growth is defined as the total growth rate of five variables (the profitability variables with the exception of ACC); Asness et al. (2019) defined growth companies as those whose ROA, ROE, CFOA, GPOA, and GMAR had grown to a greater degree in the last 5 years. Safety was defined as companies that had low beta (BAB), low indebtedness (LEV), low bankruptcy risk (O-score and Z-score), and low ROE volatility (EVOL). Finally, quality was the sum of the indicators of profitability, growth, and safety. We estimate the QMJ measure regressing the excess returns of the stocks with the QMJ returns available in the AQR database. 3
Economic Moat
The competitive advantages of a firm are measured via the Economic Moat provided by Morningstar, an independent investment research firm widely used by investors. The Economic Moat is a structural feature that allows a business to sustain excess profits over a long period of time (Morningstar, 2020). Without the moat, profits are more exposed to competition. The five sources of the moat are intangible assets, switching costs, network effect, cost advantage, and efficient scale. Morningstar awards companies with wide moats when they are confident that excess return will be generated for the next 10 years and will likely be maintained for the next 20 years. A business is rated with the narrow moat if normalized excess returns are expected in the next 10 years, seeing them converge to around its cost of capital soon thereafter.
ESG measurement
Our sustainability variables have been obtained from the Refinitiv Eikon database on a quarterly basis, which is updated as soon as there is a fiscal year update or when a new controversy event is included (Refinitiv, 2021). The ESG Score is an overall company score based on the self-reported information in the environmental (E), social (S), and governance (G) pillars. The estimation has been performed with quarterly information from Eikon-Datastream financial statements.
Analyst valuation
Barber et al. (2010) and Vidal-Tomás and Alfarano (2021), among others, conclude that analysts’ stock recommendations and market sentiment can predict stock returns. To consider the effect of valuation on the analysis, we use the Morningstar Star Rating. This rating is based on the Price to Fair Value ratio (long-term intrinsic value). A stock rated with a 3-star means its market price is near its fair value, 4- or 5-star means the stocks are trading significantly below fair value, while 1- or 2-star means a stock with a quotation meaning fully above fair value. We employ the variable Stars in our analysis because it is widely known that investors focus on ratings to make their decisions. We also employ the price-to-price target (price-to-price consensus of the market) from Datastream.
Controls
In examining the effect of quality variables and the combinations with ESG scores, Economic Moat, and valuation analyst on a firm’s profitability, we monitor firm characteristics widely recognized to be related to profitability in the literature (see, for example, Fama & French, 2008). Thus, in subsection “Regression analysis” we monitor the following: firm size, measured as the natural logarithm of the book value of total assets; leverage, measured as debt over total assets; sales over total assets; dividend payments, measured with a dummy variable that takes the value 1 if the firm pays dividends or 0 otherwise; price-to-book value; and industry sector. Table 1 summarizes the abovementioned variables and the source of the data.
Variables and source of data.
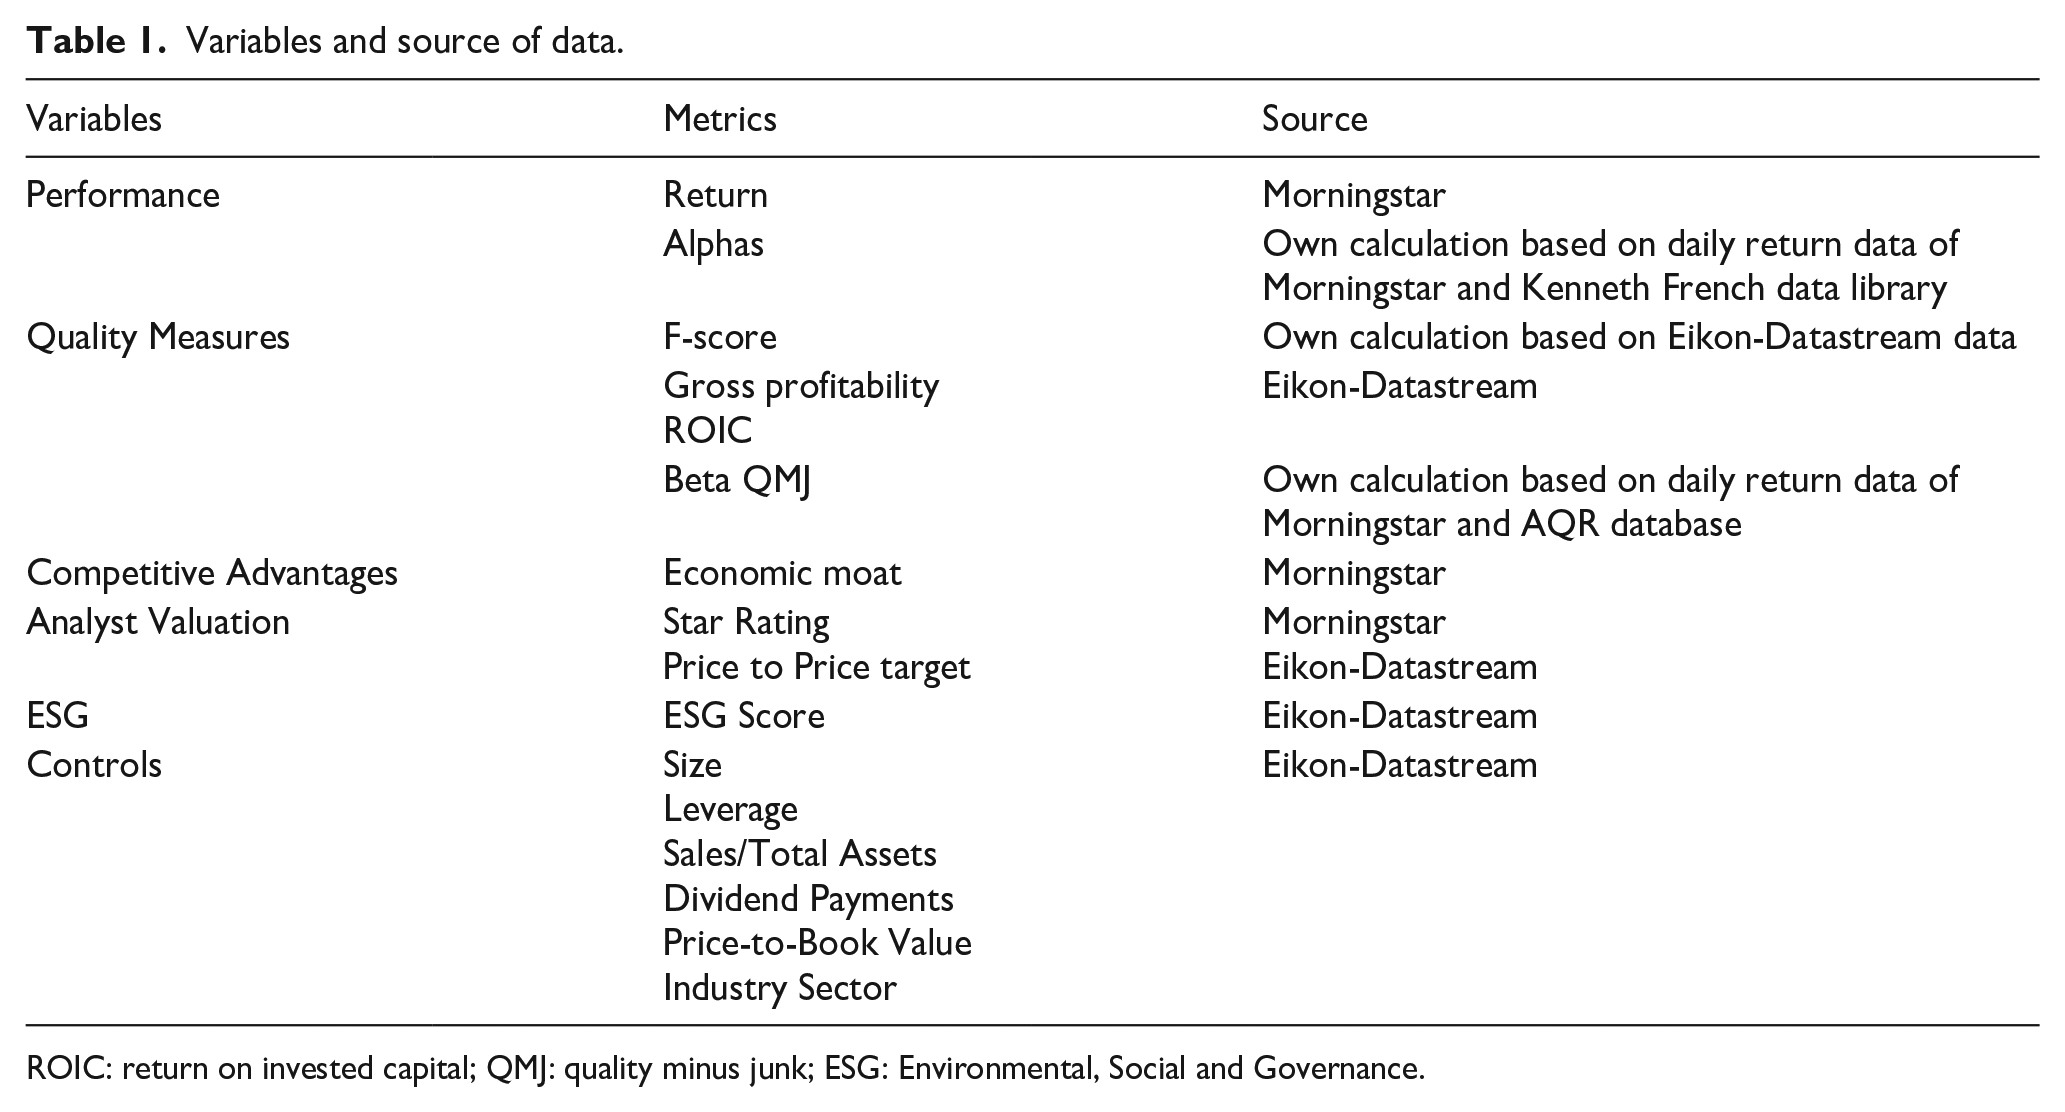
ROIC: return on invested capital; QMJ: quality minus junk; ESG: Environmental, Social and Governance.
Descriptive analysis
Table 2 shows the main statistics of the variables analyzed. Panel data are strongly balanced, due to there being relatively few companies that had not already started trading by the beginning of the period considered (2014). The mean value of the F-Score is 6.6, varying from a minimum value of 1 (0 is the theoretical minimum value) and a maximum of 9. This value means that the companies in the sample are considered to have a high average value of F-Score, which is explained by the sample selection (stocks with Morningstar Analyst ratings). Mean ROIC and the Gross margin to assets ratio take the values 1.7% and 7.9%, respectively. The average valuation of the Morningstar Analyst shares is close to the actual quotation, the average value of the price-to-fair value ratio being 0.987; this means that stock prices are very close to their intrinsic values in mean although there are undervalued (ratio less than 1) and overvalued (ratio greater than 1) stocks in the sample. The distribution of the stocks is 4.83% of the stocks in the overall sample with 1-star, 23.17% with 2-star, 44.48% with 3-star, 23.16% with 4-star, and 4.36% with 5-star. The average value of the variable Price-to-Price target (0.911) is lower compared with the one derived from Morningstar’s ratings. This suggests that the market consensus views stocks as being more undervalued on average than what Morningstar Analysts estimate.
Descriptive statistics.
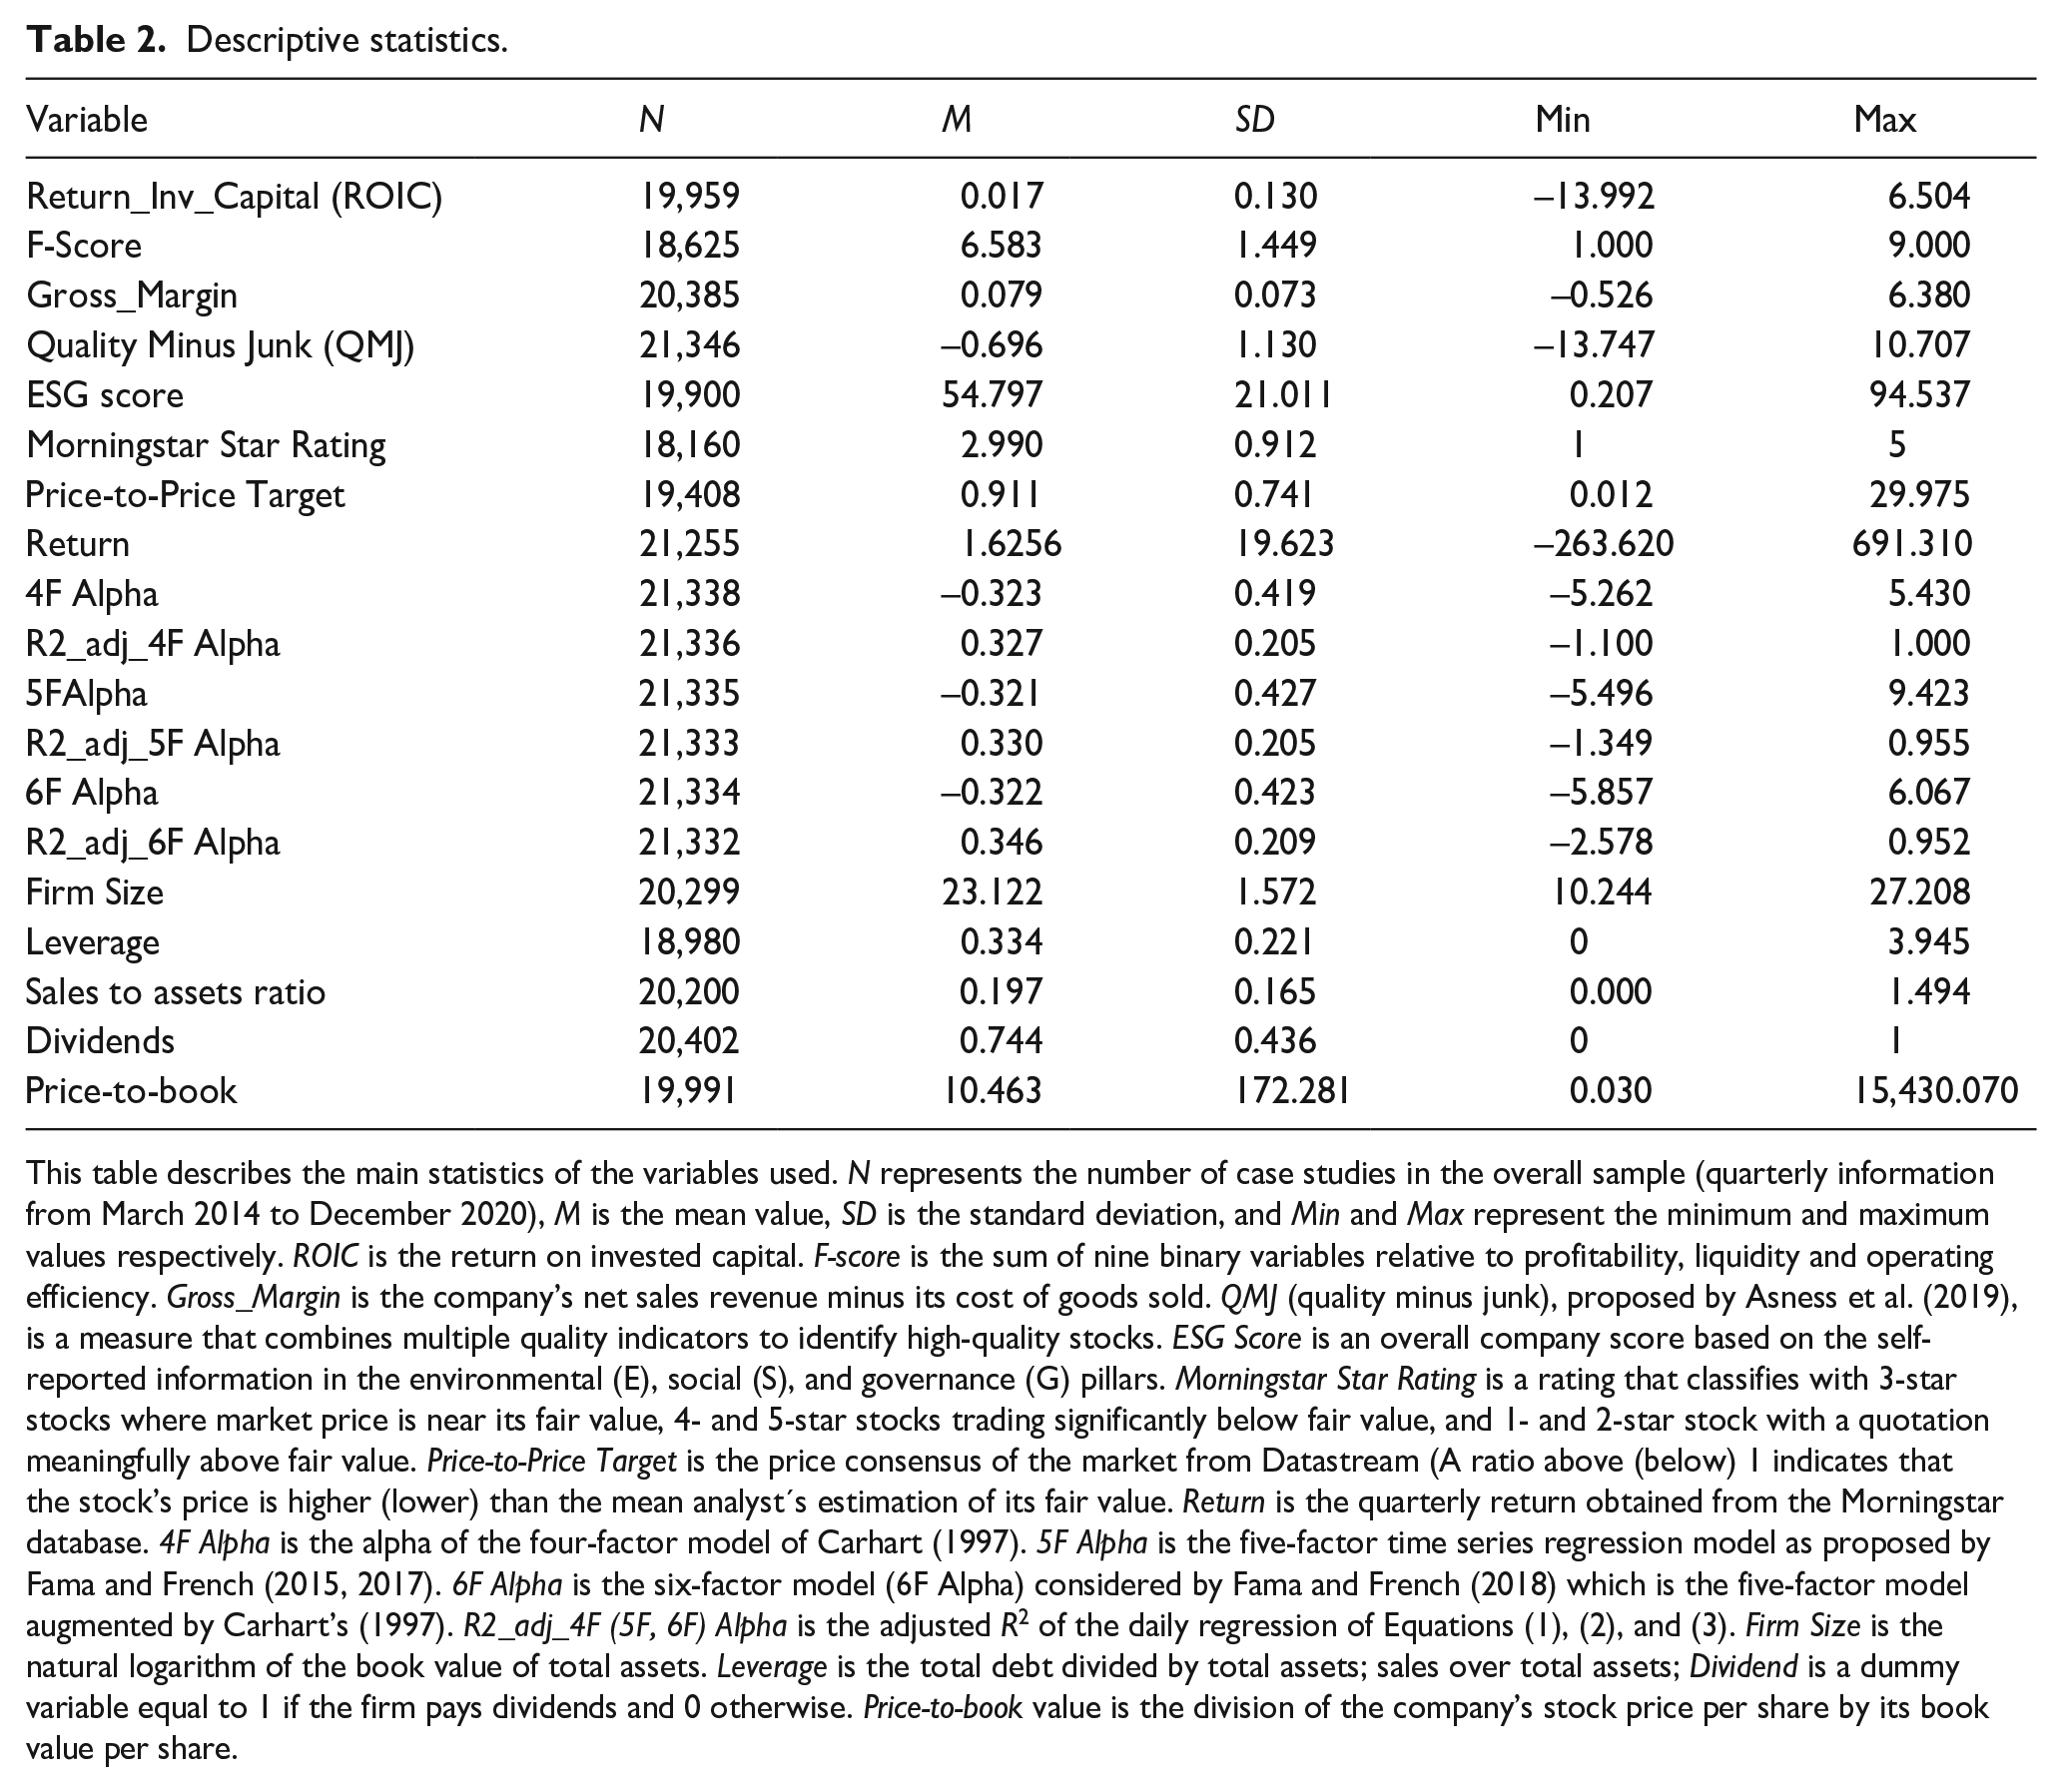
This table describes the main statistics of the variables used. N represents the number of case studies in the overall sample (quarterly information from March 2014 to December 2020), M is the mean value, SD is the standard deviation, and Min and Max represent the minimum and maximum values respectively. ROIC is the return on invested capital. F-score is the sum of nine binary variables relative to profitability, liquidity and operating efficiency. Gross_Margin is the company’s net sales revenue minus its cost of goods sold. QMJ (quality minus junk), proposed by Asness et al. (2019), is a measure that combines multiple quality indicators to identify high-quality stocks. ESG Score is an overall company score based on the self-reported information in the environmental (E), social (S), and governance (G) pillars. Morningstar Star Rating is a rating that classifies with 3-star stocks where market price is near its fair value, 4- and 5-star stocks trading significantly below fair value, and 1- and 2-star stock with a quotation meaningfully above fair value. Price-to-Price Target is the price consensus of the market from Datastream (A ratio above (below) 1 indicates that the stock’s price is higher (lower) than the mean analyst′s estimation of its fair value. Return is the quarterly return obtained from the Morningstar database. 4F Alpha is the alpha of the four-factor model of Carhart (1997). 5F Alpha is the five-factor time series regression model as proposed by Fama and French (2015, 2017). 6F Alpha is the six-factor model (6F Alpha) considered by Fama and French (2018) which is the five-factor model augmented by Carhart’s (1997). R2_adj_4F (5F, 6F) Alpha is the adjusted R2 of the daily regression of Equations (1), (2), and (3). Firm Size is the natural logarithm of the book value of total assets. Leverage is the total debt divided by total assets; sales over total assets; Dividend is a dummy variable equal to 1 if the firm pays dividends and 0 otherwise. Price-to-book value is the division of the company’s stock price per share by its book value per share.
Quarterly excess (log) returns over risk-free interest rate (which is generally 0 or close to 0 in the period analyzed) is 1.62%. The daily four-factor alpha is –0.32. The values obtained from the four-, five-, and six-factor alphas are very similar. However, in terms of adjusted R2, the model that performs the best fit, with no major differences (mean values ranging from 0.327 to 0.346), is the six-factor model. In terms of Economic Moat, 21.68% of the sample (3,999 quarter observations) have a Wide Economic Moat, 5,335 have no Economic Moat, and 9,108 have a Narrow Economic Moat. The mean size of the companies is US$11 billion; leverage is nearly 33% and 74% of companies pay dividends.
Methodology
Our framework of analysis is inspired by Fama and French (2008) and employs the two most common techniques in studying variable–return relations: portfolio sorts and firm-level cross-sectional regressions in the same way as Fama and MacBeth (1973). The first approach gives a good impression of how average returns and alphas vary with different quality variables. The second approach helps assess the incremental power of the quality variables for predicting subsequent stock returns in the presence of established determinants of the cross section.
Sorting methodology
The methodology of sorting stocks into quintiles of variables is common in equity performance literature (see, for example, Asness et al., 2019; Fama & French, 2008; Ng & Shen, 2020). First, we sort the stocks into quintiles based on their quality variables. Next, we repeat the process, including ESG and Economic Moat, considering the valuation. After that, we compare the differences between the highest and the lowest quintiles as well as the associated p values.
Regression analysis
The previous portfolio analysis ignores cross-section information and fails to monitor many factors that could simultaneously impact the relationship between performance and quality. In this section, we analyze the effect of quality, both including Economic Moat and ESG, on performance, measured with six-factor alphas monitoring size, leverage, sales to assets, and price to book. We also examine the relationship among QARP using several metrics (Morningstar Star Rating, Price-to-Price target consensus and price to book). We look into the cross-section relationship between quality and risk-adjusted returns at stock level using the Fama and MacBeth (1973) regression of the one-quarter-ahead six-factor alphas. This methodology has been very common for evaluating quality strategies (Hyde, 2018; Ng & Shen, 2020; Walkshäusl, 2020). In the regression, we use various lagged dummies relating to the fourth and fifth quintiles to analyze whether the investment in the highest quality stocks allows a higher alpha to be obtained. To evaluate the impact of Quality on the performance of U.S. stock returns, we have used the following model:
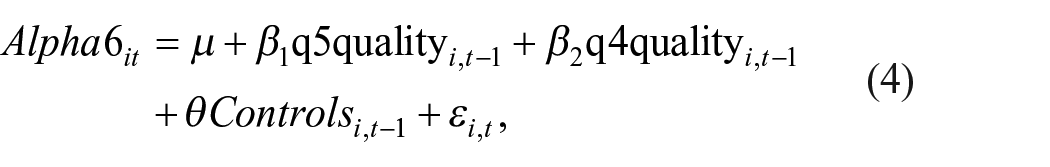
where
Results
Do companies with high quality perform better than those with low quality?
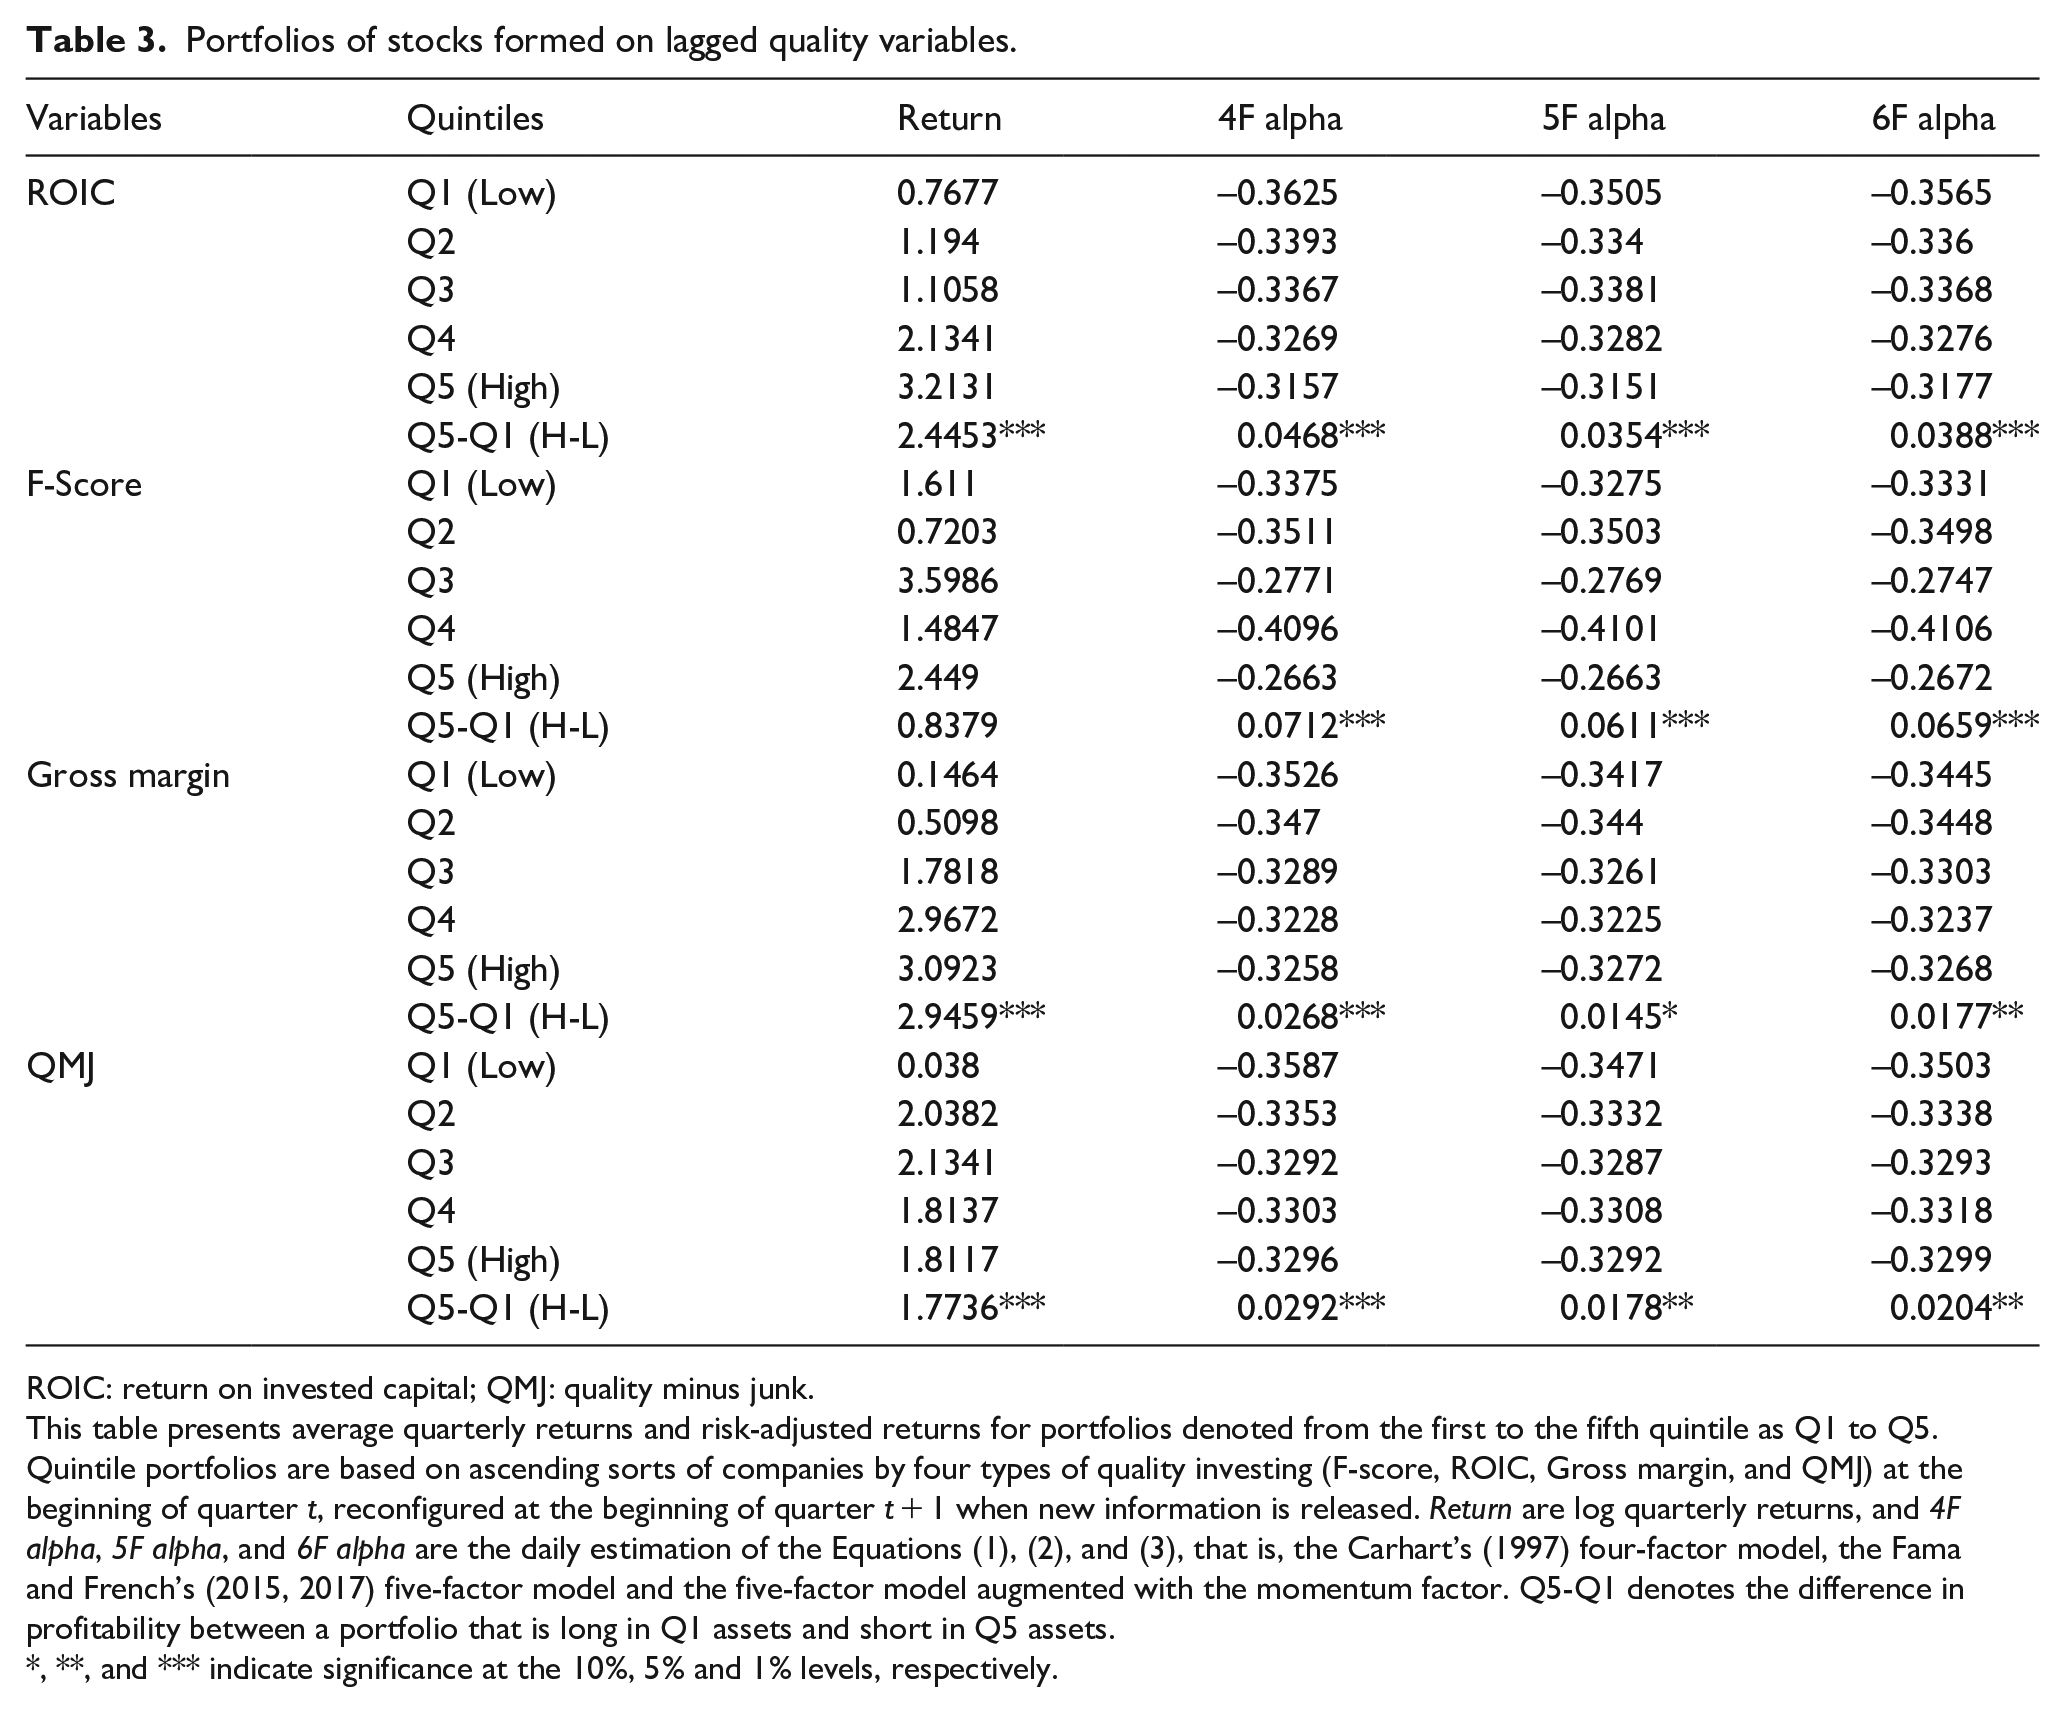
Table 3 shows the mean values of the different performance metrics (returns, of four-, five-, and six-factor alpha) for the quintiles of the four quality variables used (QMJ, F-score, Gross margin, and ROIC). For each quality variable, we divide the sample into five groups so that there are an equal number of companies for each quarter. This gives five ordered quintiles, where the first quintile (or Q1) represents the quantity of companies with the worst/low-quality ratios in each quarter and the fifth quintile (or Q5) is the group with the highest values for the selected quality indicator. Row Q5-Q1 (H-L) represents the mean difference in values for the different performance metrics for the upper quintile (High) minus the lower quintile (Low). There are significant positive differences in performance for the different metrics analyzed for the four quality metrics used, unlike F-score and return where the differences are positive but not significant. For example, an investor who invests long on a diversified portfolio of stocks from the top quintile (Q5) of ROIC and goes short on a diversified portfolio of stocks from the bottom quintile (Q1) of ROIC obtains on average quarterly return of more than 2.45% (Q5-Q1, H-L). The daily four-factor alpha difference is 0.0468 basic points. The variable that has the greatest effect on Q5-Q1 for return is the Gross margin to assets ratio, while in alphas it is the FSCORE.
Portfolios of stocks formed on lagged quality variables.
ROIC: return on invested capital; QMJ: quality minus junk.
This table presents average quarterly returns and risk-adjusted returns for portfolios denoted from the first to the fifth quintile as Q1 to Q5. Quintile portfolios are based on ascending sorts of companies by four types of quality investing (F-score, ROIC, Gross margin, and QMJ) at the beginning of quarter t, reconfigured at the beginning of quarter t + 1 when new information is released. Return are log quarterly returns, and 4F alpha, 5F alpha, and 6F alpha are the daily estimation of the Equations (1), (2), and (3), that is, the Carhart’s (1997) four-factor model, the Fama and French’s (2015, 2017) five-factor model and the five-factor model augmented with the momentum factor. Q5-Q1 denotes the difference in profitability between a portfolio that is long in Q1 assets and short in Q5 assets.
, **, and *** indicate significance at the 10%, 5% and 1% levels, respectively.
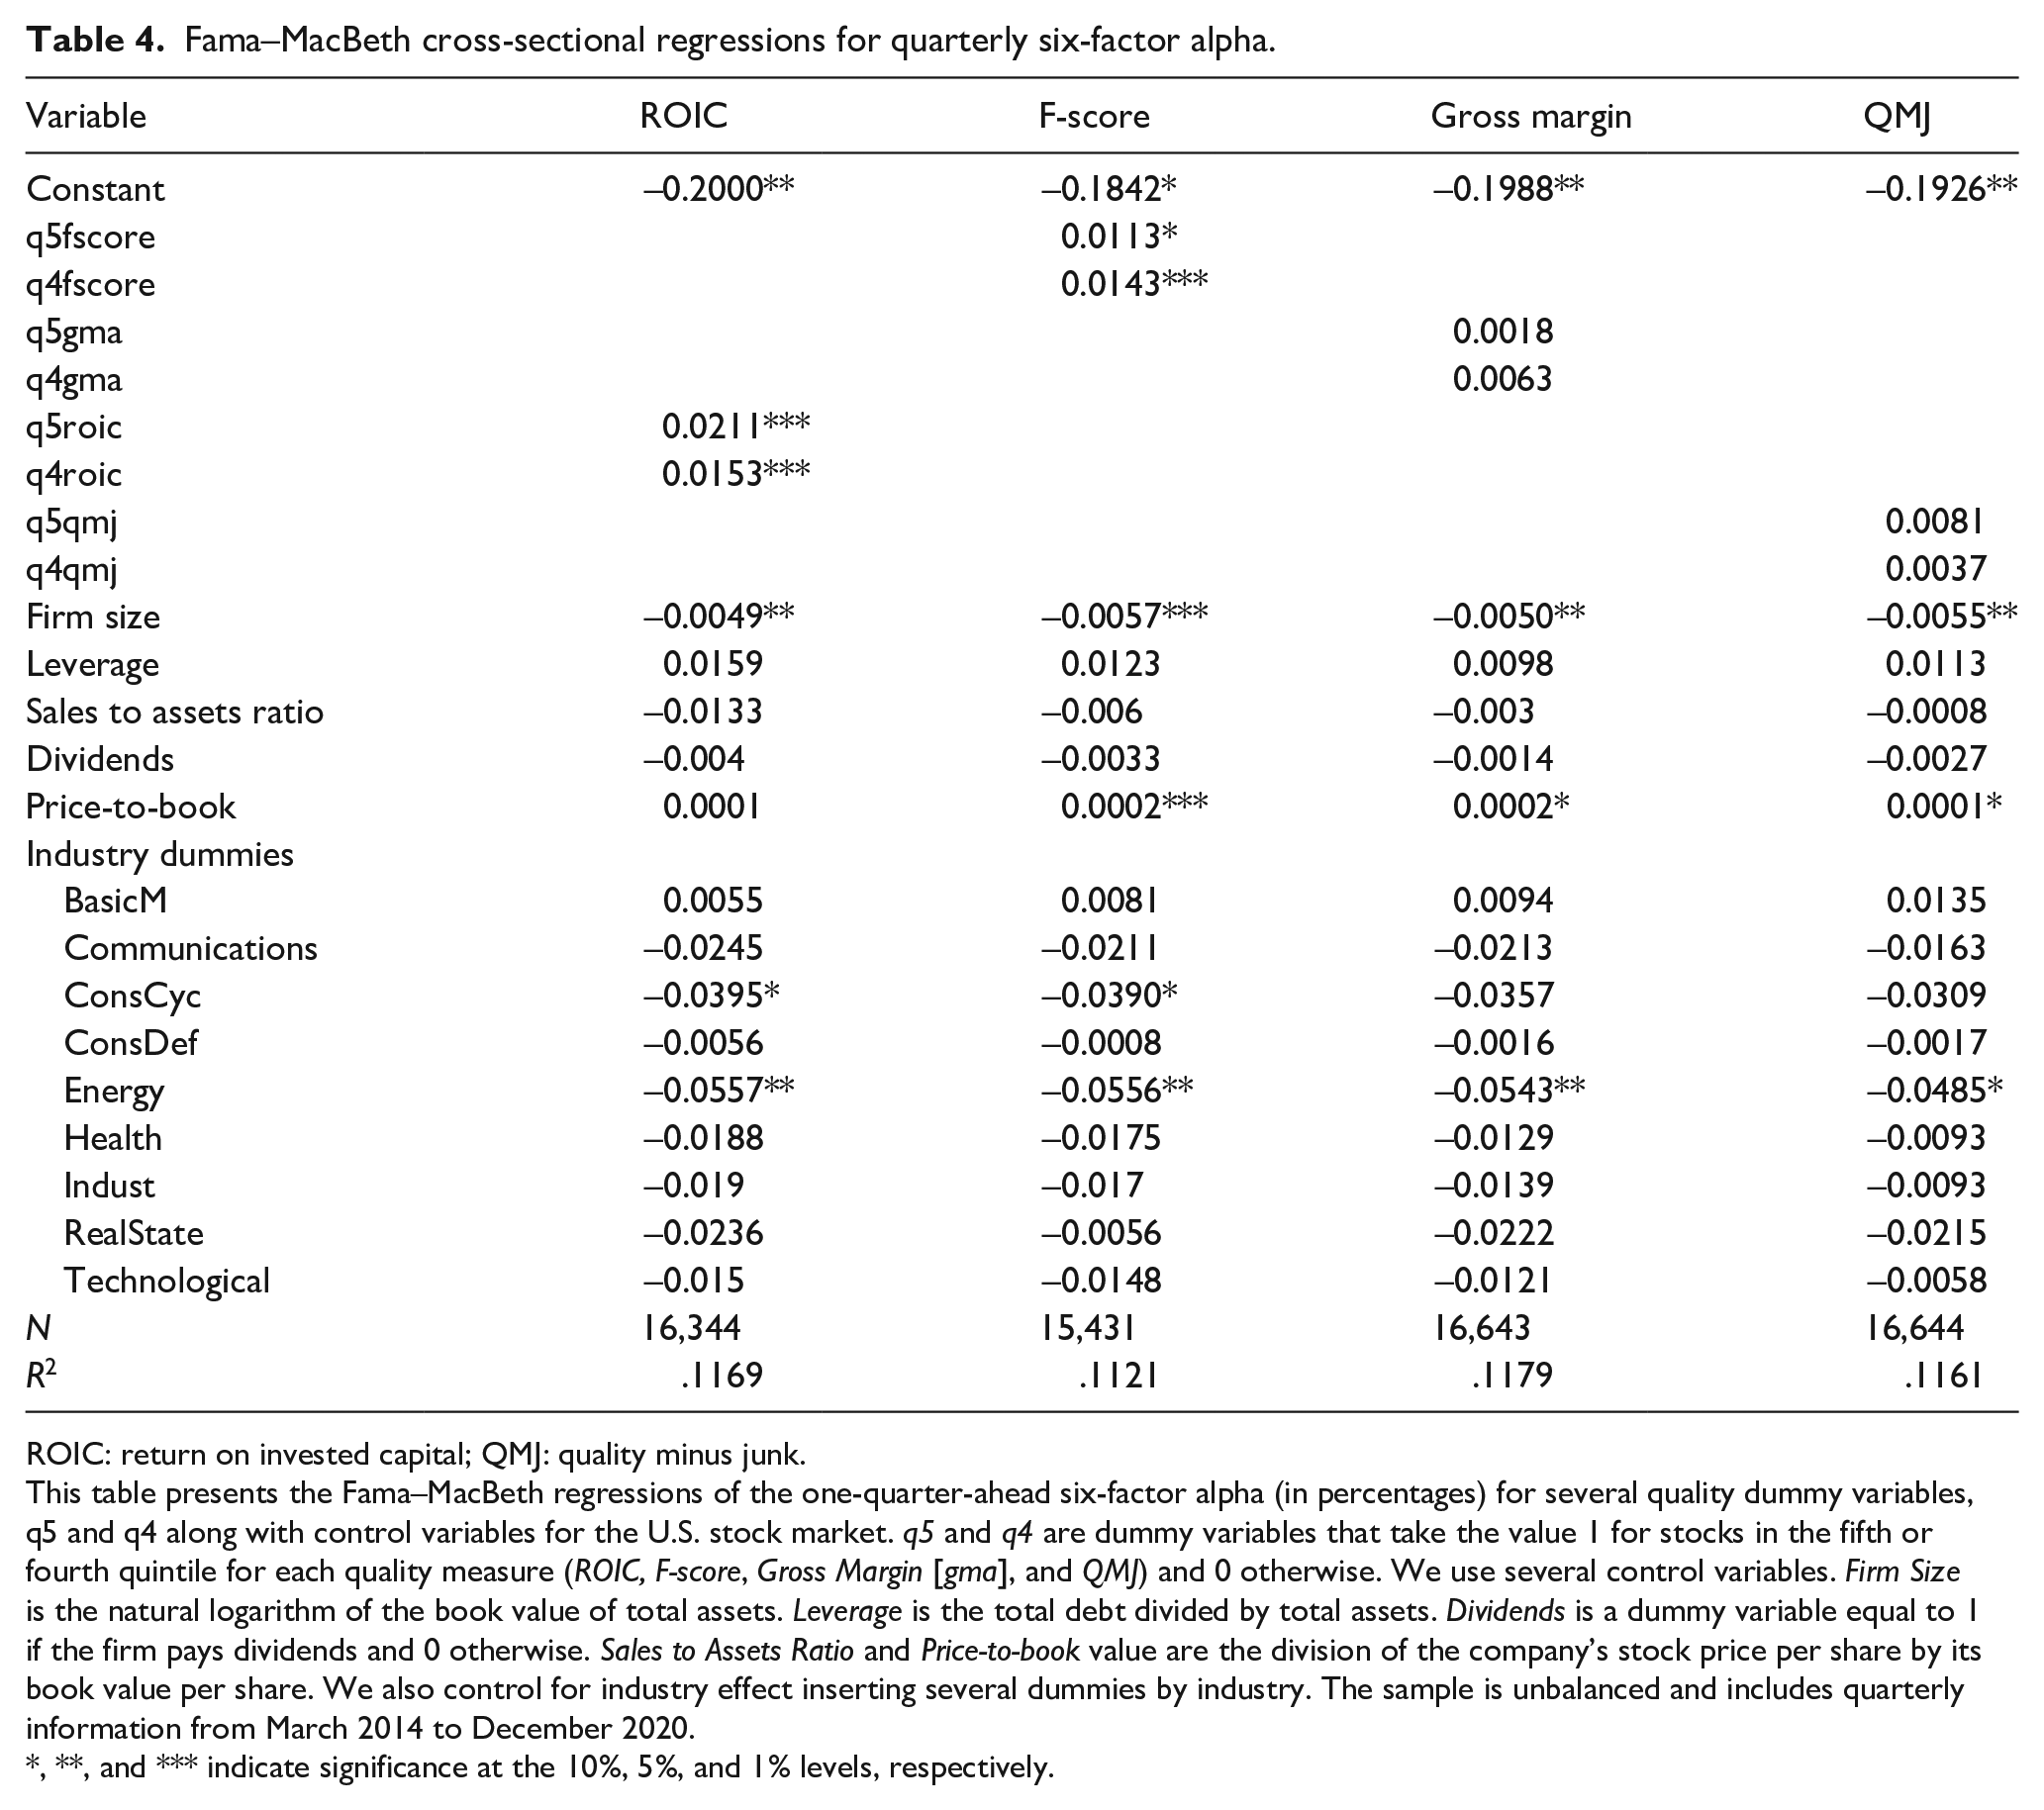
Following with the regression analysis, as can be seen in the first model estimated in Table 4, the average coefficients of the cross-sectional regressions are significant in strategies which choose companies in the highest quintiles classified by the F-score (q5fscore and q4fscore) or, alternatively, high ROIC (q5roic and q4roic). 4 In particular, the strategies based on picking high ROIC companies provide the most excess alpha, namely, 2.11 daily basic points and 1.53, respectively. However, both gross margin (GM) and quality minus junk (QMJ) are not significant. The results obtained for ROIC support the empirical evidence found by Blackburn and Cakici (2017) while the higher performance of the stocks with higher F-score support Fama and French (2006), Piotroski and So (2012), and Ng and Shen (2016). Nevertheless, the gross margin to total assets (GM) and QMJ are not significant, implying that our results do not support quality strategies based exclusively on these indicators, unlike what Novy-Marx (2013) or Asness et al. (2019) find. Our results partially support Hypothesis 1, as not all quality indicators enable the design of outperforming quality strategies, limited to those based on ROIC and F-Score. Thus, this study contributes to providing evidence about the indicators that allow for configuring more consistent strategies.
Fama–MacBeth cross-sectional regressions for quarterly six-factor alpha.
ROIC: return on invested capital; QMJ: quality minus junk.
This table presents the Fama–MacBeth regressions of the one-quarter-ahead six-factor alpha (in percentages) for several quality dummy variables, q5 and q4 along with control variables for the U.S. stock market. q5 and q4 are dummy variables that take the value 1 for stocks in the fifth or fourth quintile for each quality measure (ROIC, F-score, Gross Margin [gma], and QMJ) and 0 otherwise. We use several control variables. Firm Size is the natural logarithm of the book value of total assets. Leverage is the total debt divided by total assets. Dividends is a dummy variable equal to 1 if the firm pays dividends and 0 otherwise. Sales to Assets Ratio and Price-to-book value are the division of the company’s stock price per share by its book value per share. We also control for industry effect inserting several dummies by industry. The sample is unbalanced and includes quarterly information from March 2014 to December 2020.
, **, and *** indicate significance at the 10%, 5%, and 1% levels, respectively.
Does the combination of quality and economic moat increases the performance of traditional quality strategies?
Table 5 shows the portfolio investment strategies that combine the four quality indicators and their quintiles (Q1 and Q5) with the Economic Moat. Since Economic Moat can take only three possible values (wide, narrow, and none), the investment in a portfolio of companies with wide or narrow competitive advantages has been compared with others that do not have them. In general, there are significant and positive differences between the alpha obtained from a portfolio of companies with a wide or narrow Economic Moat and those that do not have a moat. For example, in the top quintile of the QMJ indicator, stocks with competitive advantages have, on average, 0.0855 more six-factor alpha than those without advantages, and this difference is significant at the 99% level. In the case of returns, the difference is only significant and positive in the case of gross margin. An investment strategy in companies of the top quintile of gross margin and competitive advantages (wide or narrow) reports an average quarterly return 1.08% higher than an investment strategy in companies of the top quintile of gross margin but without competitive advantages. When we look at the difference between Quintiles 1 and 5 of a quality variable, we find that in most cases the quality metrics continue to differentiate the performance of a stock portfolio.
Portfolios of stocks formed on lagged quality variables and Economic Moat.
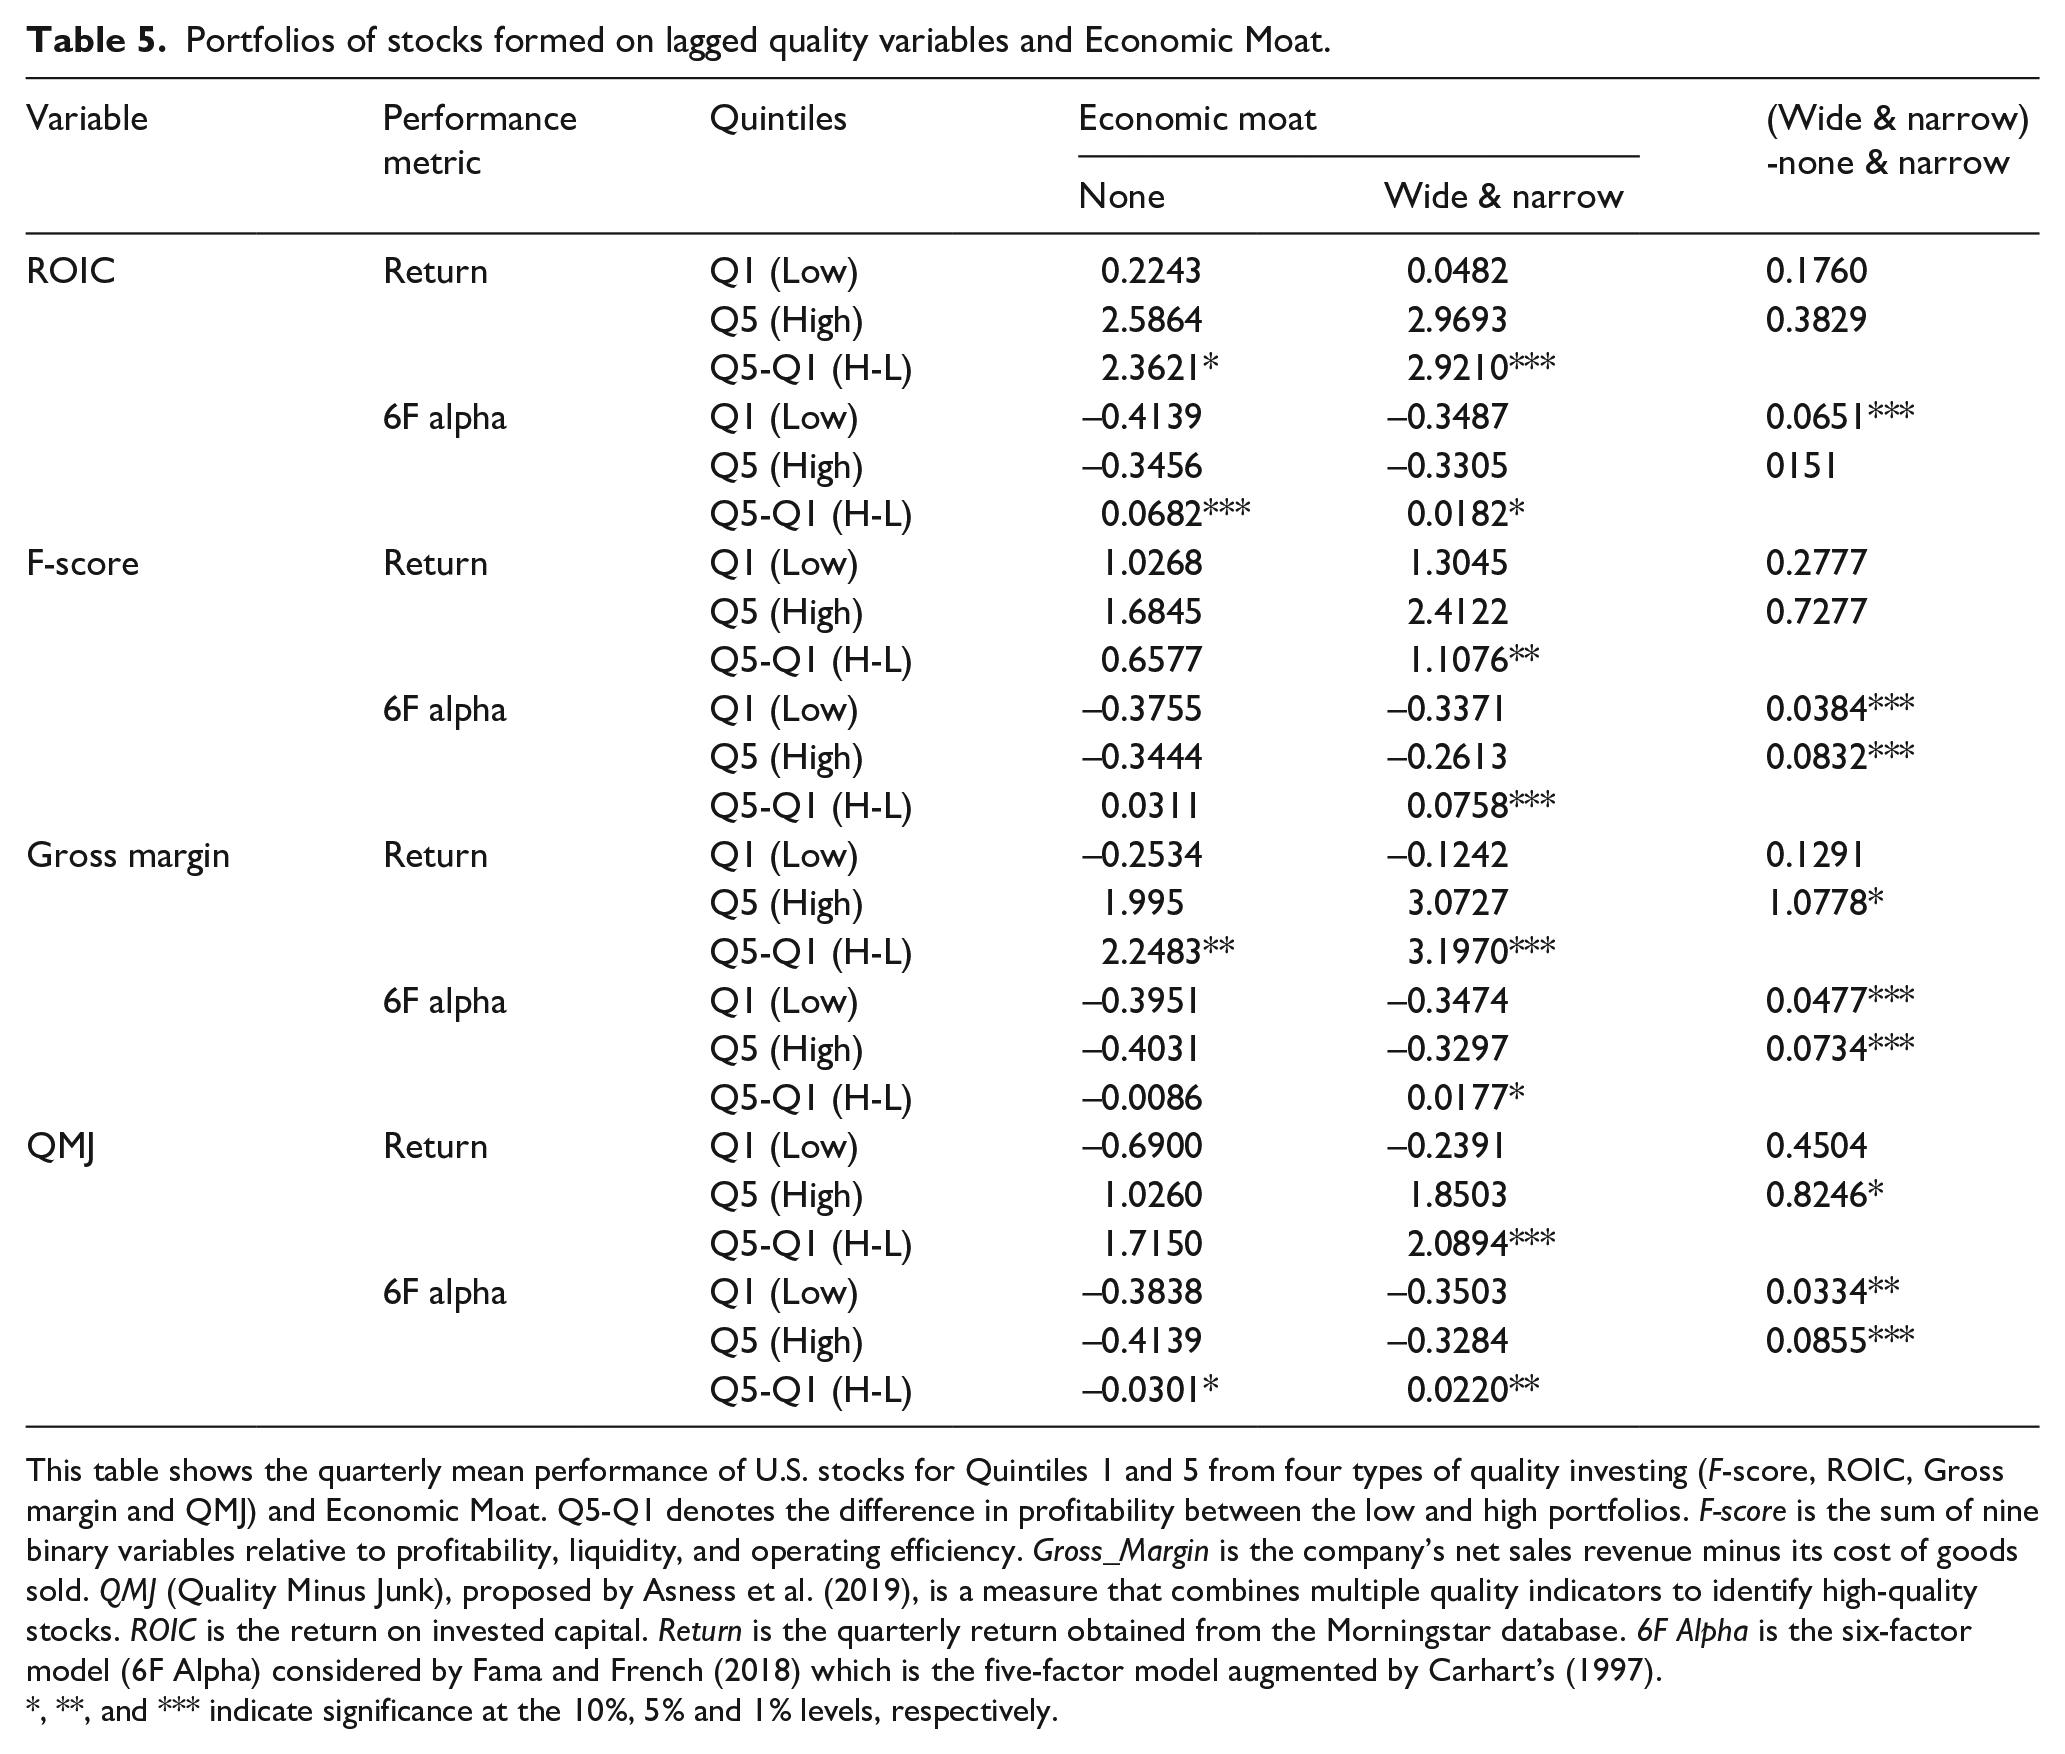
This table shows the quarterly mean performance of U.S. stocks for Quintiles 1 and 5 from four types of quality investing (F-score, ROIC, Gross margin and QMJ) and Economic Moat. Q5-Q1 denotes the difference in profitability between the low and high portfolios. F-score is the sum of nine binary variables relative to profitability, liquidity, and operating efficiency. Gross_Margin is the company’s net sales revenue minus its cost of goods sold. QMJ (Quality Minus Junk), proposed by Asness et al. (2019), is a measure that combines multiple quality indicators to identify high-quality stocks. ROIC is the return on invested capital. Return is the quarterly return obtained from the Morningstar database. 6F Alpha is the six-factor model (6F Alpha) considered by Fama and French (2018) which is the five-factor model augmented by Carhart’s (1997).
, **, and *** indicate significance at the 10%, 5% and 1% levels, respectively.
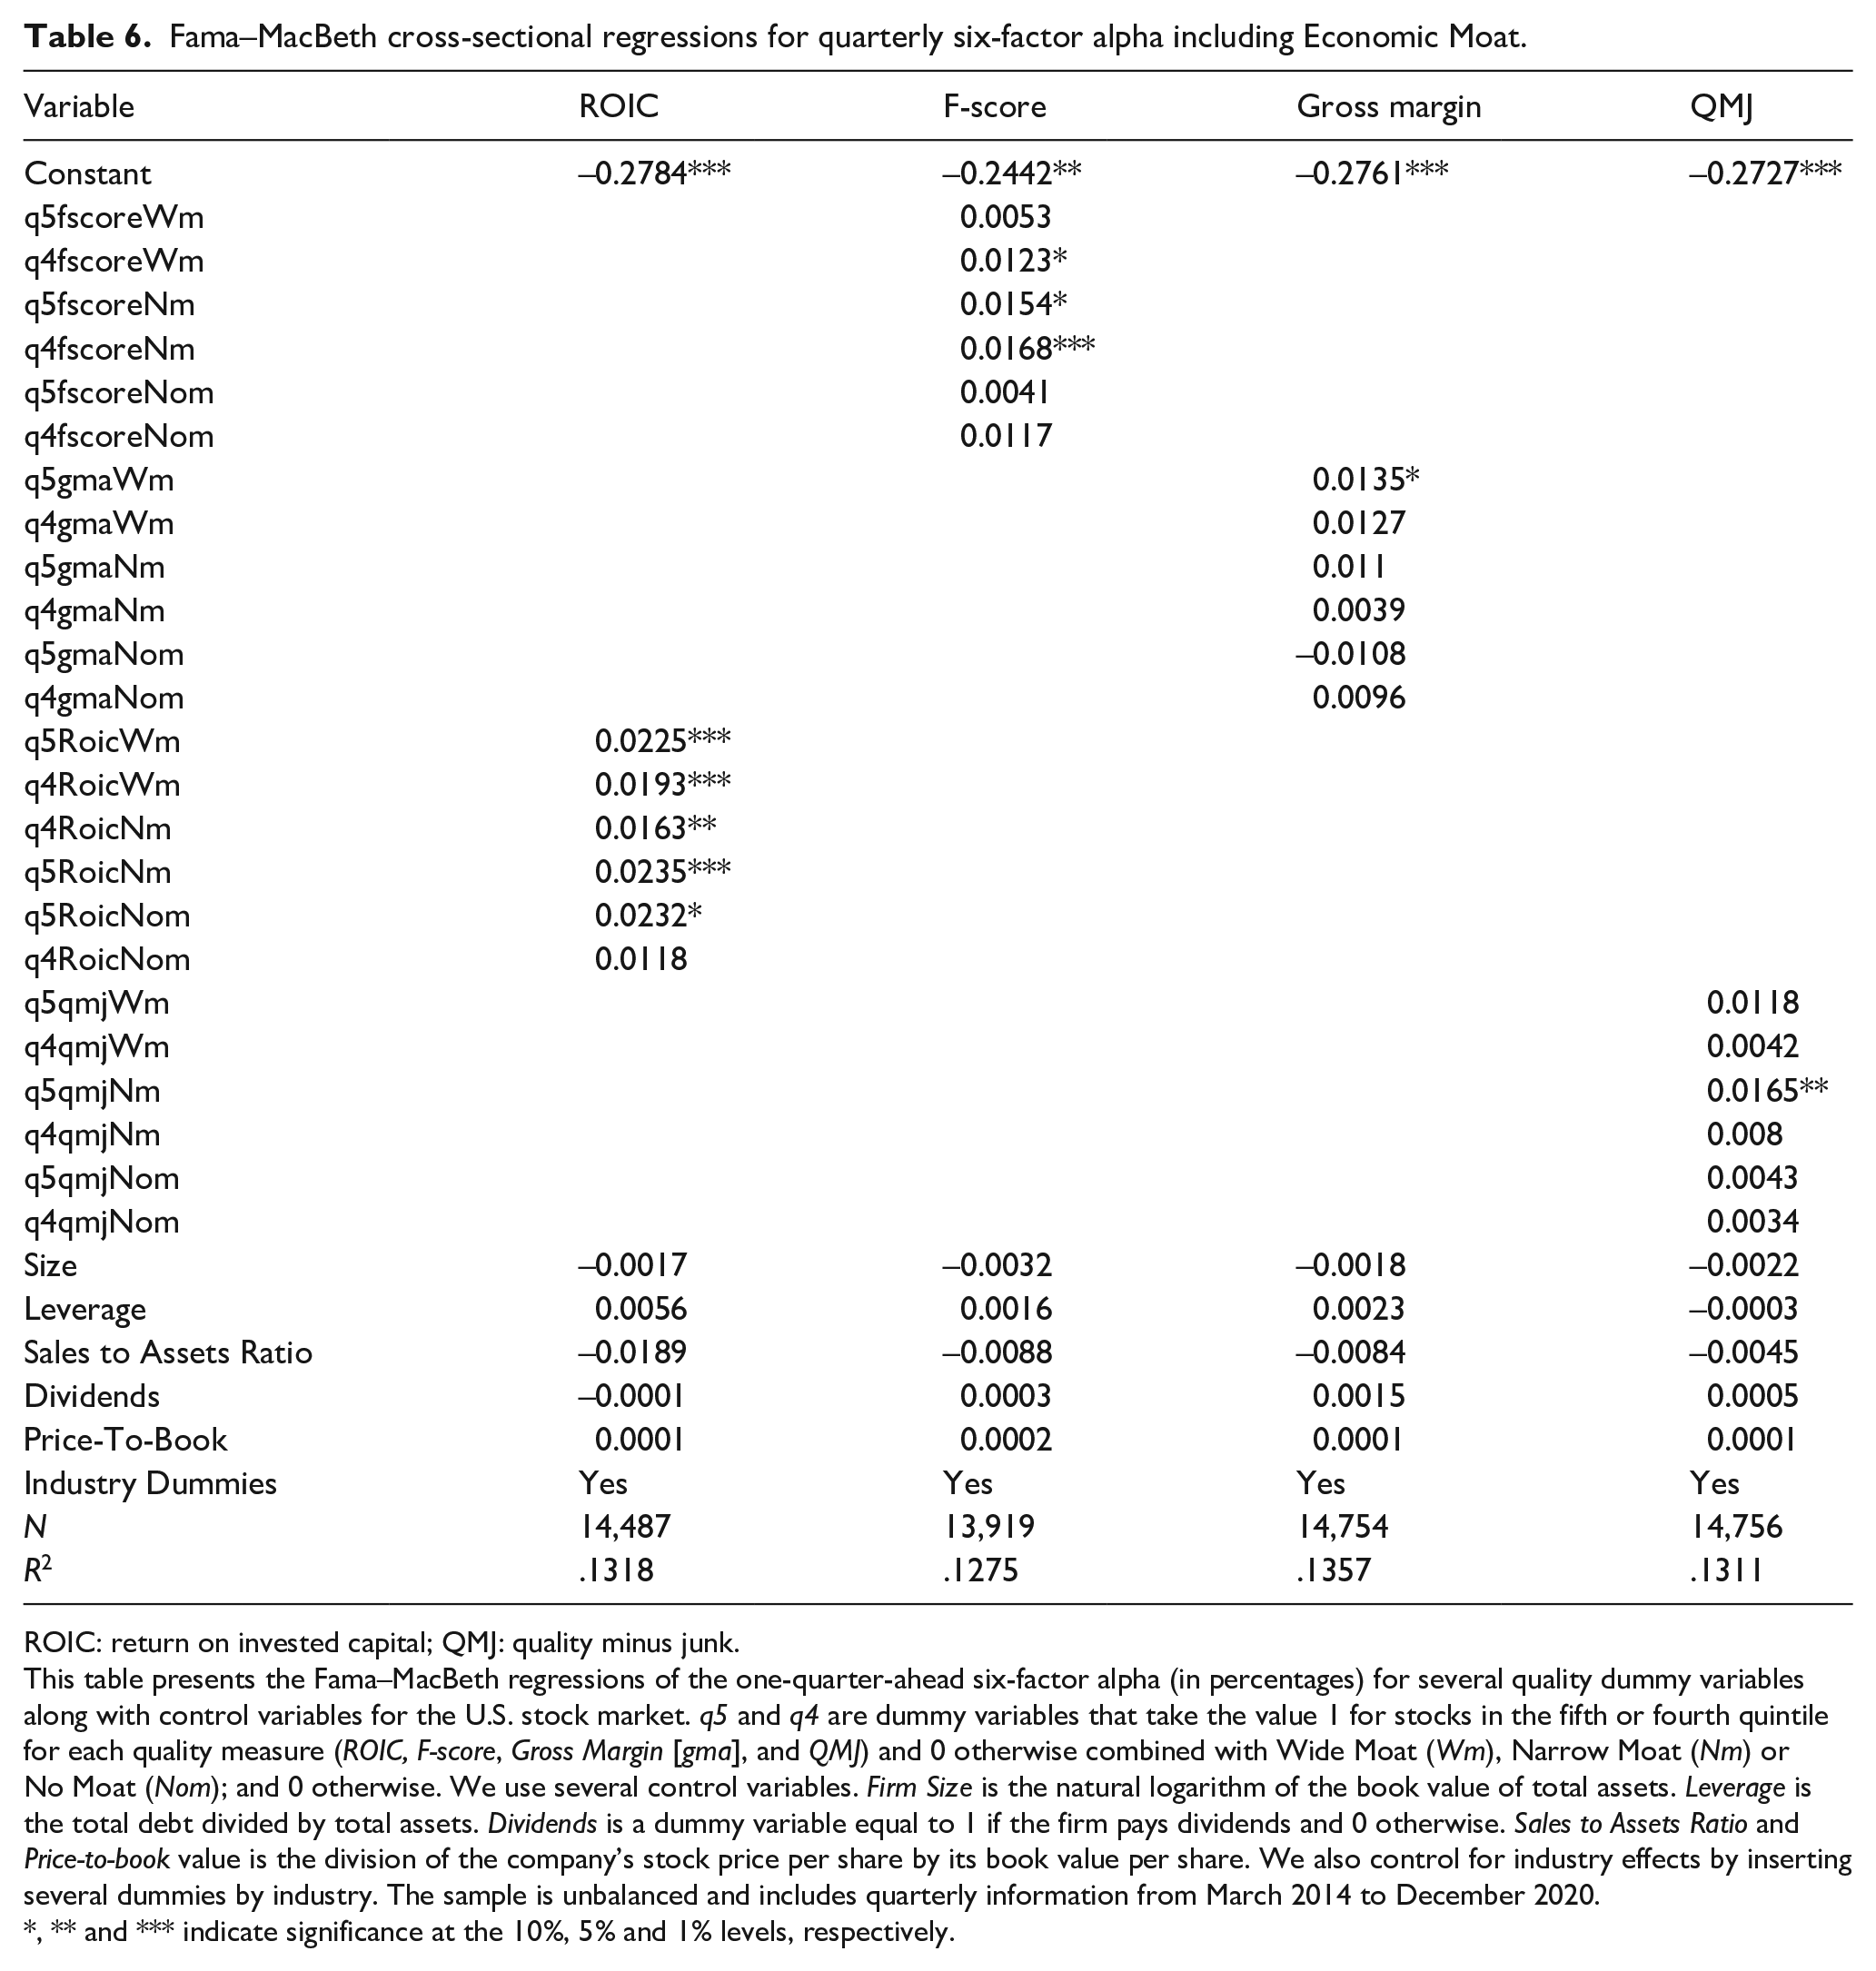
Now, we analyze the effect of combining the profitability of the best quintiles from the various quality indicators and the Economic Moat (Wm denotes Wide Moat, Nm means Narrow Moat and, No refers to No Moat). The results (Table 6) indicate that the incorporation of Moat allows for better discrimination between the classic high-quality strategies that provide excellent performance and those that do not. In particular, the strategies of investing in companies with a high F-score but without Moat do not result in a greater alpha, unlike those of the fourth quintile of the ROIC. It can also be seen how alpha increases to a greater extent in the combinations of high ROIC with wide or narrow moat, when compared with selecting companies based exclusively on ROIC. In addition, new strategies are also identified using gross margin and QMJ, which after considering the competitive advantages provides a greater alpha. Therefore, our research supports the second hypothesis, showing that the economic moat can help to improve the configuration of quality-based strategies that outperform those based exclusively on financial measures. Also, this research is in line with the empirical evidence about the importance of considering competitive advantages to achieve better performance in line with Boyd (2011), Gherde et al. (2010), Kanuri and McLeod (2016), and Morningstar (2020). Nevertheless, in this case, we show that in the context of quality strategies they help perform the better screening, identifying those that provide better performance.
Fama–MacBeth cross-sectional regressions for quarterly six-factor alpha including Economic Moat.
ROIC: return on invested capital; QMJ: quality minus junk.
This table presents the Fama–MacBeth regressions of the one-quarter-ahead six-factor alpha (in percentages) for several quality dummy variables along with control variables for the U.S. stock market. q5 and q4 are dummy variables that take the value 1 for stocks in the fifth or fourth quintile for each quality measure (ROIC, F-score, Gross Margin [gma], and QMJ) and 0 otherwise combined with Wide Moat (Wm), Narrow Moat (Nm) or No Moat (Nom); and 0 otherwise. We use several control variables. Firm Size is the natural logarithm of the book value of total assets. Leverage is the total debt divided by total assets. Dividends is a dummy variable equal to 1 if the firm pays dividends and 0 otherwise. Sales to Assets Ratio and Price-to-book value is the division of the company’s stock price per share by its book value per share. We also control for industry effects by inserting several dummies by industry. The sample is unbalanced and includes quarterly information from March 2014 to December 2020.
, ** and *** indicate significance at the 10%, 5% and 1% levels, respectively.
Does the combination of quality and ESG increase the performance of traditional quality strategies?
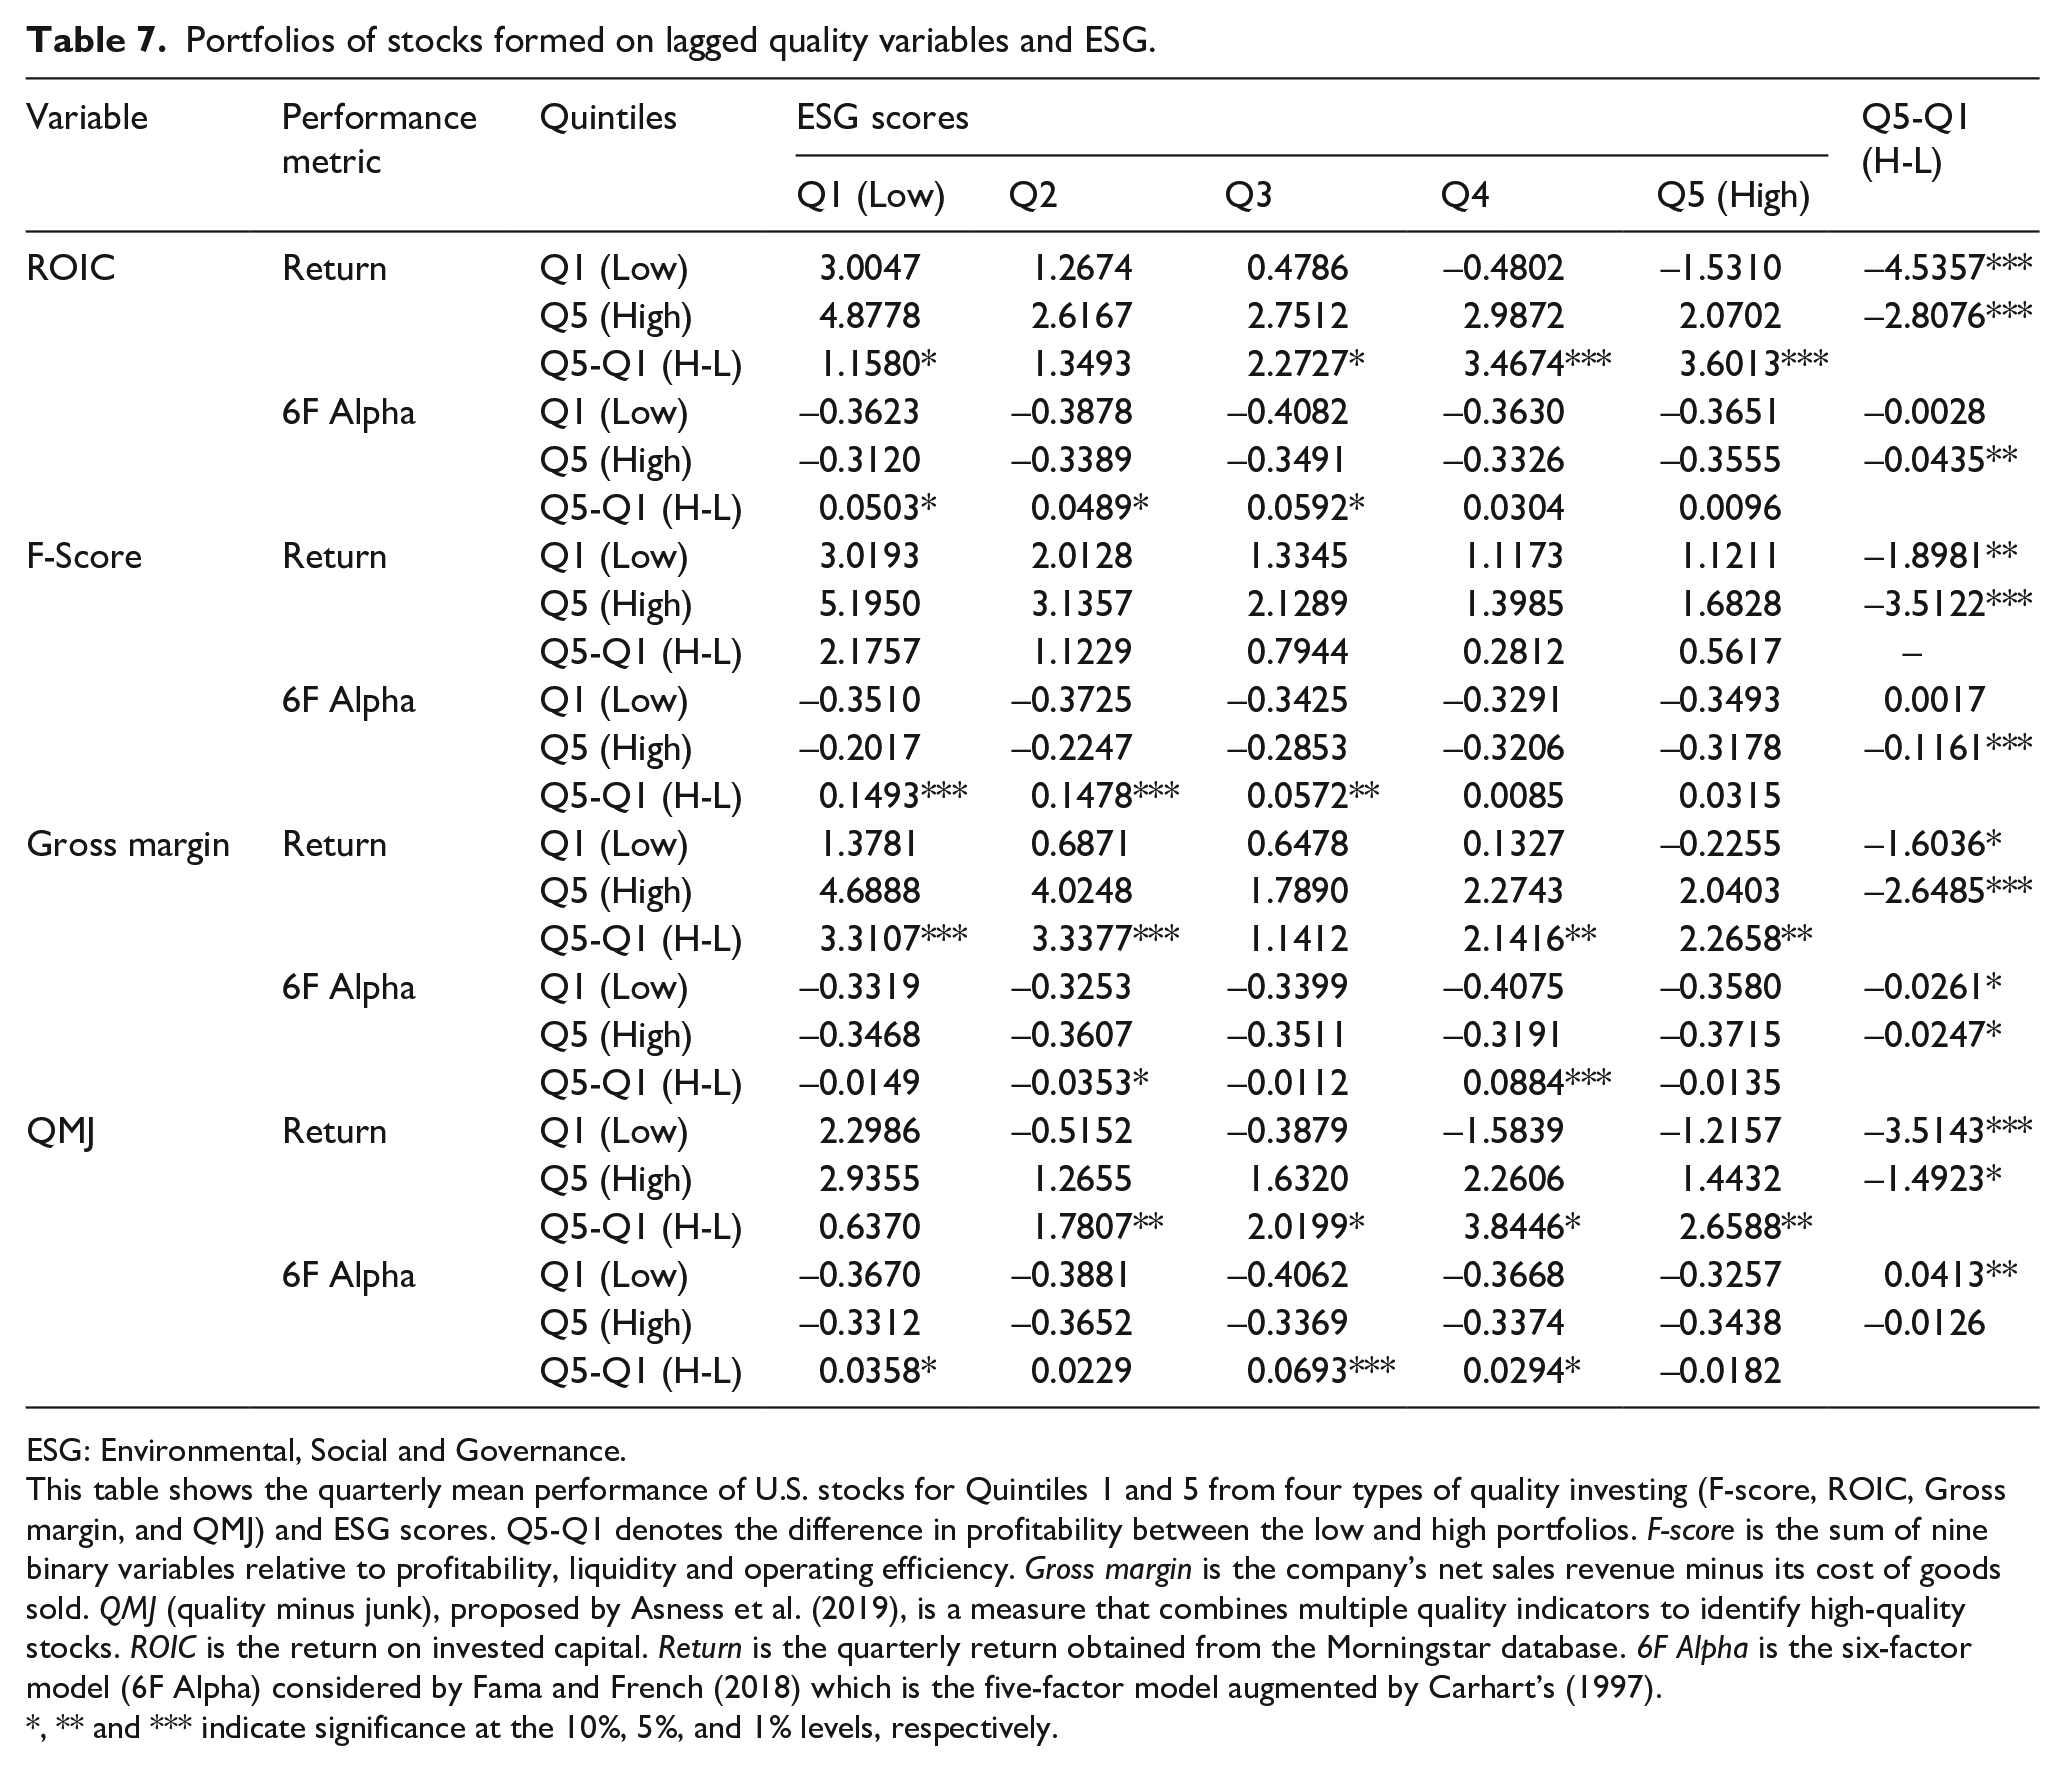
Given that from a theoretic perspective, ESG investment can improve the selection of assets, in Table 7 the portfolio investment strategies that combine the four quality indicators and their quintiles (Q1 to Q5), along with the quintile results of ordering the shares for each 4-month period based on ESG score are shown. It can be observed that the previous performance differences for Quintiles 5 minus 1 as a function of the four quality variables are generally consistent for the different ESG quintiles. However, when we look at the differences between the ESG quintiles (last column), on average, the selection of portfolios adopting these criteria once quality has been used can worsen performance results. For instance, within the top quintile of the ROIC indicator, stocks with high ESG Scores exhibit, on average, 0.0435 less six-factor alpha compared with those with low scores, and this difference is statistically significant at the 95% confidence level. In general, the Q5-Q1 investment in ESG factors, previously considering the quintiles formed by the quality measures, destroys value (negative and significant coefficients).
Portfolios of stocks formed on lagged quality variables and ESG.
ESG: Environmental, Social and Governance.
This table shows the quarterly mean performance of U.S. stocks for Quintiles 1 and 5 from four types of quality investing (F-score, ROIC, Gross margin, and QMJ) and ESG scores. Q5-Q1 denotes the difference in profitability between the low and high portfolios. F-score is the sum of nine binary variables relative to profitability, liquidity and operating efficiency. Gross margin is the company’s net sales revenue minus its cost of goods sold. QMJ (quality minus junk), proposed by Asness et al. (2019), is a measure that combines multiple quality indicators to identify high-quality stocks. ROIC is the return on invested capital. Return is the quarterly return obtained from the Morningstar database. 6F Alpha is the six-factor model (6F Alpha) considered by Fama and French (2018) which is the five-factor model augmented by Carhart’s (1997).
, ** and *** indicate significance at the 10%, 5%, and 1% levels, respectively.
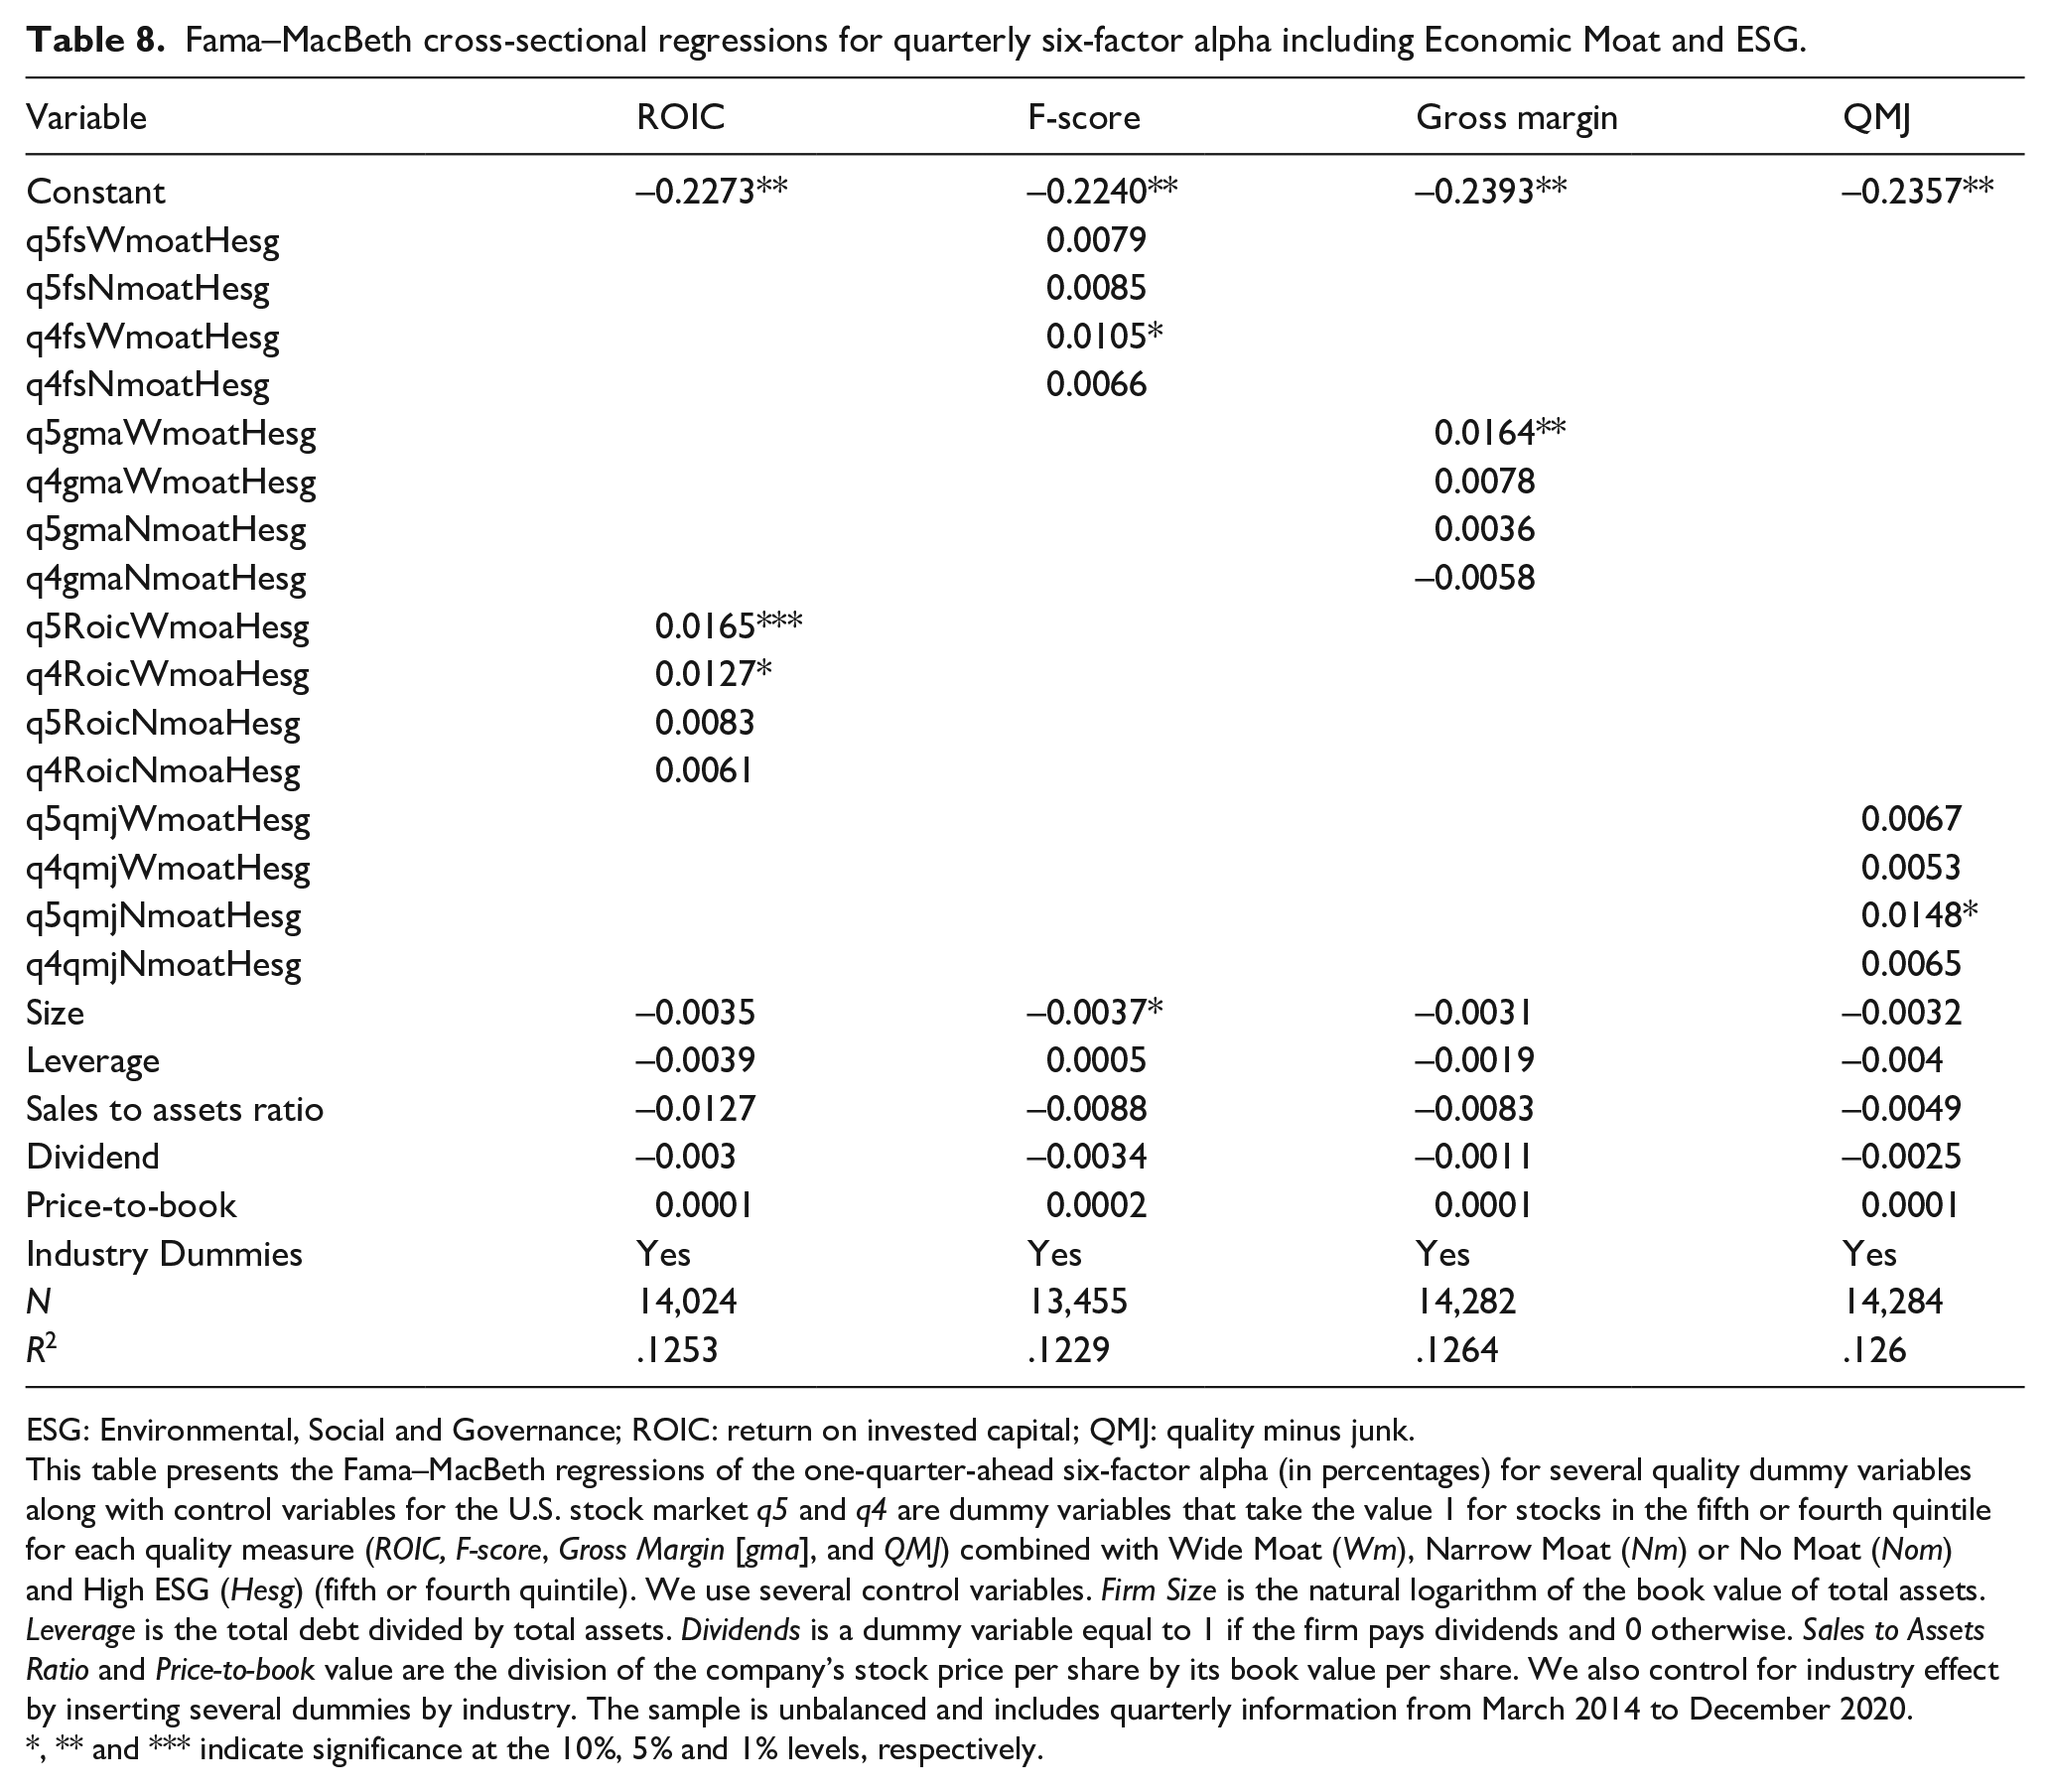
Once we have analyzed the combination of Quality and Moat, we can then proceed to evaluate the effect of incorporating the ESG factors (see Table 8). The results in this case show a negative effect on performance that counteracts the positive effect of quality and moat, totally or partially. The results, while significant, present a contrary sign to what was proposed in Hypothesis 3, which suggests that considering sustainability criteria can increase the level of performance. Similarly, the results indicate that investing in stocks with high ESG entails paying a premium, in line with La Torre et al. (2020) and Reboredo et al. (2017). To put it another way, we could say that a way of investing in ESG without assuming the premium that goes with it would be to opt for quality companies with a wide or narrow moat, since the excess of profitability would compensate for the negative effect of the ESG.
Fama–MacBeth cross-sectional regressions for quarterly six-factor alpha including Economic Moat and ESG.
ESG: Environmental, Social and Governance; ROIC: return on invested capital; QMJ: quality minus junk.
This table presents the Fama–MacBeth regressions of the one-quarter-ahead six-factor alpha (in percentages) for several quality dummy variables along with control variables for the U.S. stock market q5 and q4 are dummy variables that take the value 1 for stocks in the fifth or fourth quintile for each quality measure (ROIC, F-score, Gross Margin [gma], and QMJ) combined with Wide Moat (Wm), Narrow Moat (Nm) or No Moat (Nom) and High ESG (Hesg) (fifth or fourth quintile). We use several control variables. Firm Size is the natural logarithm of the book value of total assets. Leverage is the total debt divided by total assets. Dividends is a dummy variable equal to 1 if the firm pays dividends and 0 otherwise. Sales to Assets Ratio and Price-to-book value are the division of the company’s stock price per share by its book value per share. We also control for industry effect by inserting several dummies by industry. The sample is unbalanced and includes quarterly information from March 2014 to December 2020.
, ** and *** indicate significance at the 10%, 5% and 1% levels, respectively.
Does the consideration of QARP improve the performance of quality strategies?
In Table 9, we show the portfolio investment strategies that combine the four quality indicators and their quintiles (Q1 and Q5), with the undervaluation/overvaluation from the consensus of the market. In general, there are differences in the profitability obtained from a portfolio of companies between Quintiles 1 and 5 regardless of the quality metric used and across the different quintiles of the Price-to-Price target variable. Most importantly of all, however, are the findings obtained in the last column. Since the Q1 portfolio in the Price-to-Price target variable is made up of the quintile of companies with the lowest value of the ratio, investing in the most undervalued companies (long Q1 position and short Q5 position) provides great results for investors.
Portfolios of stocks formed on lagged quality variables and price-to-price target.
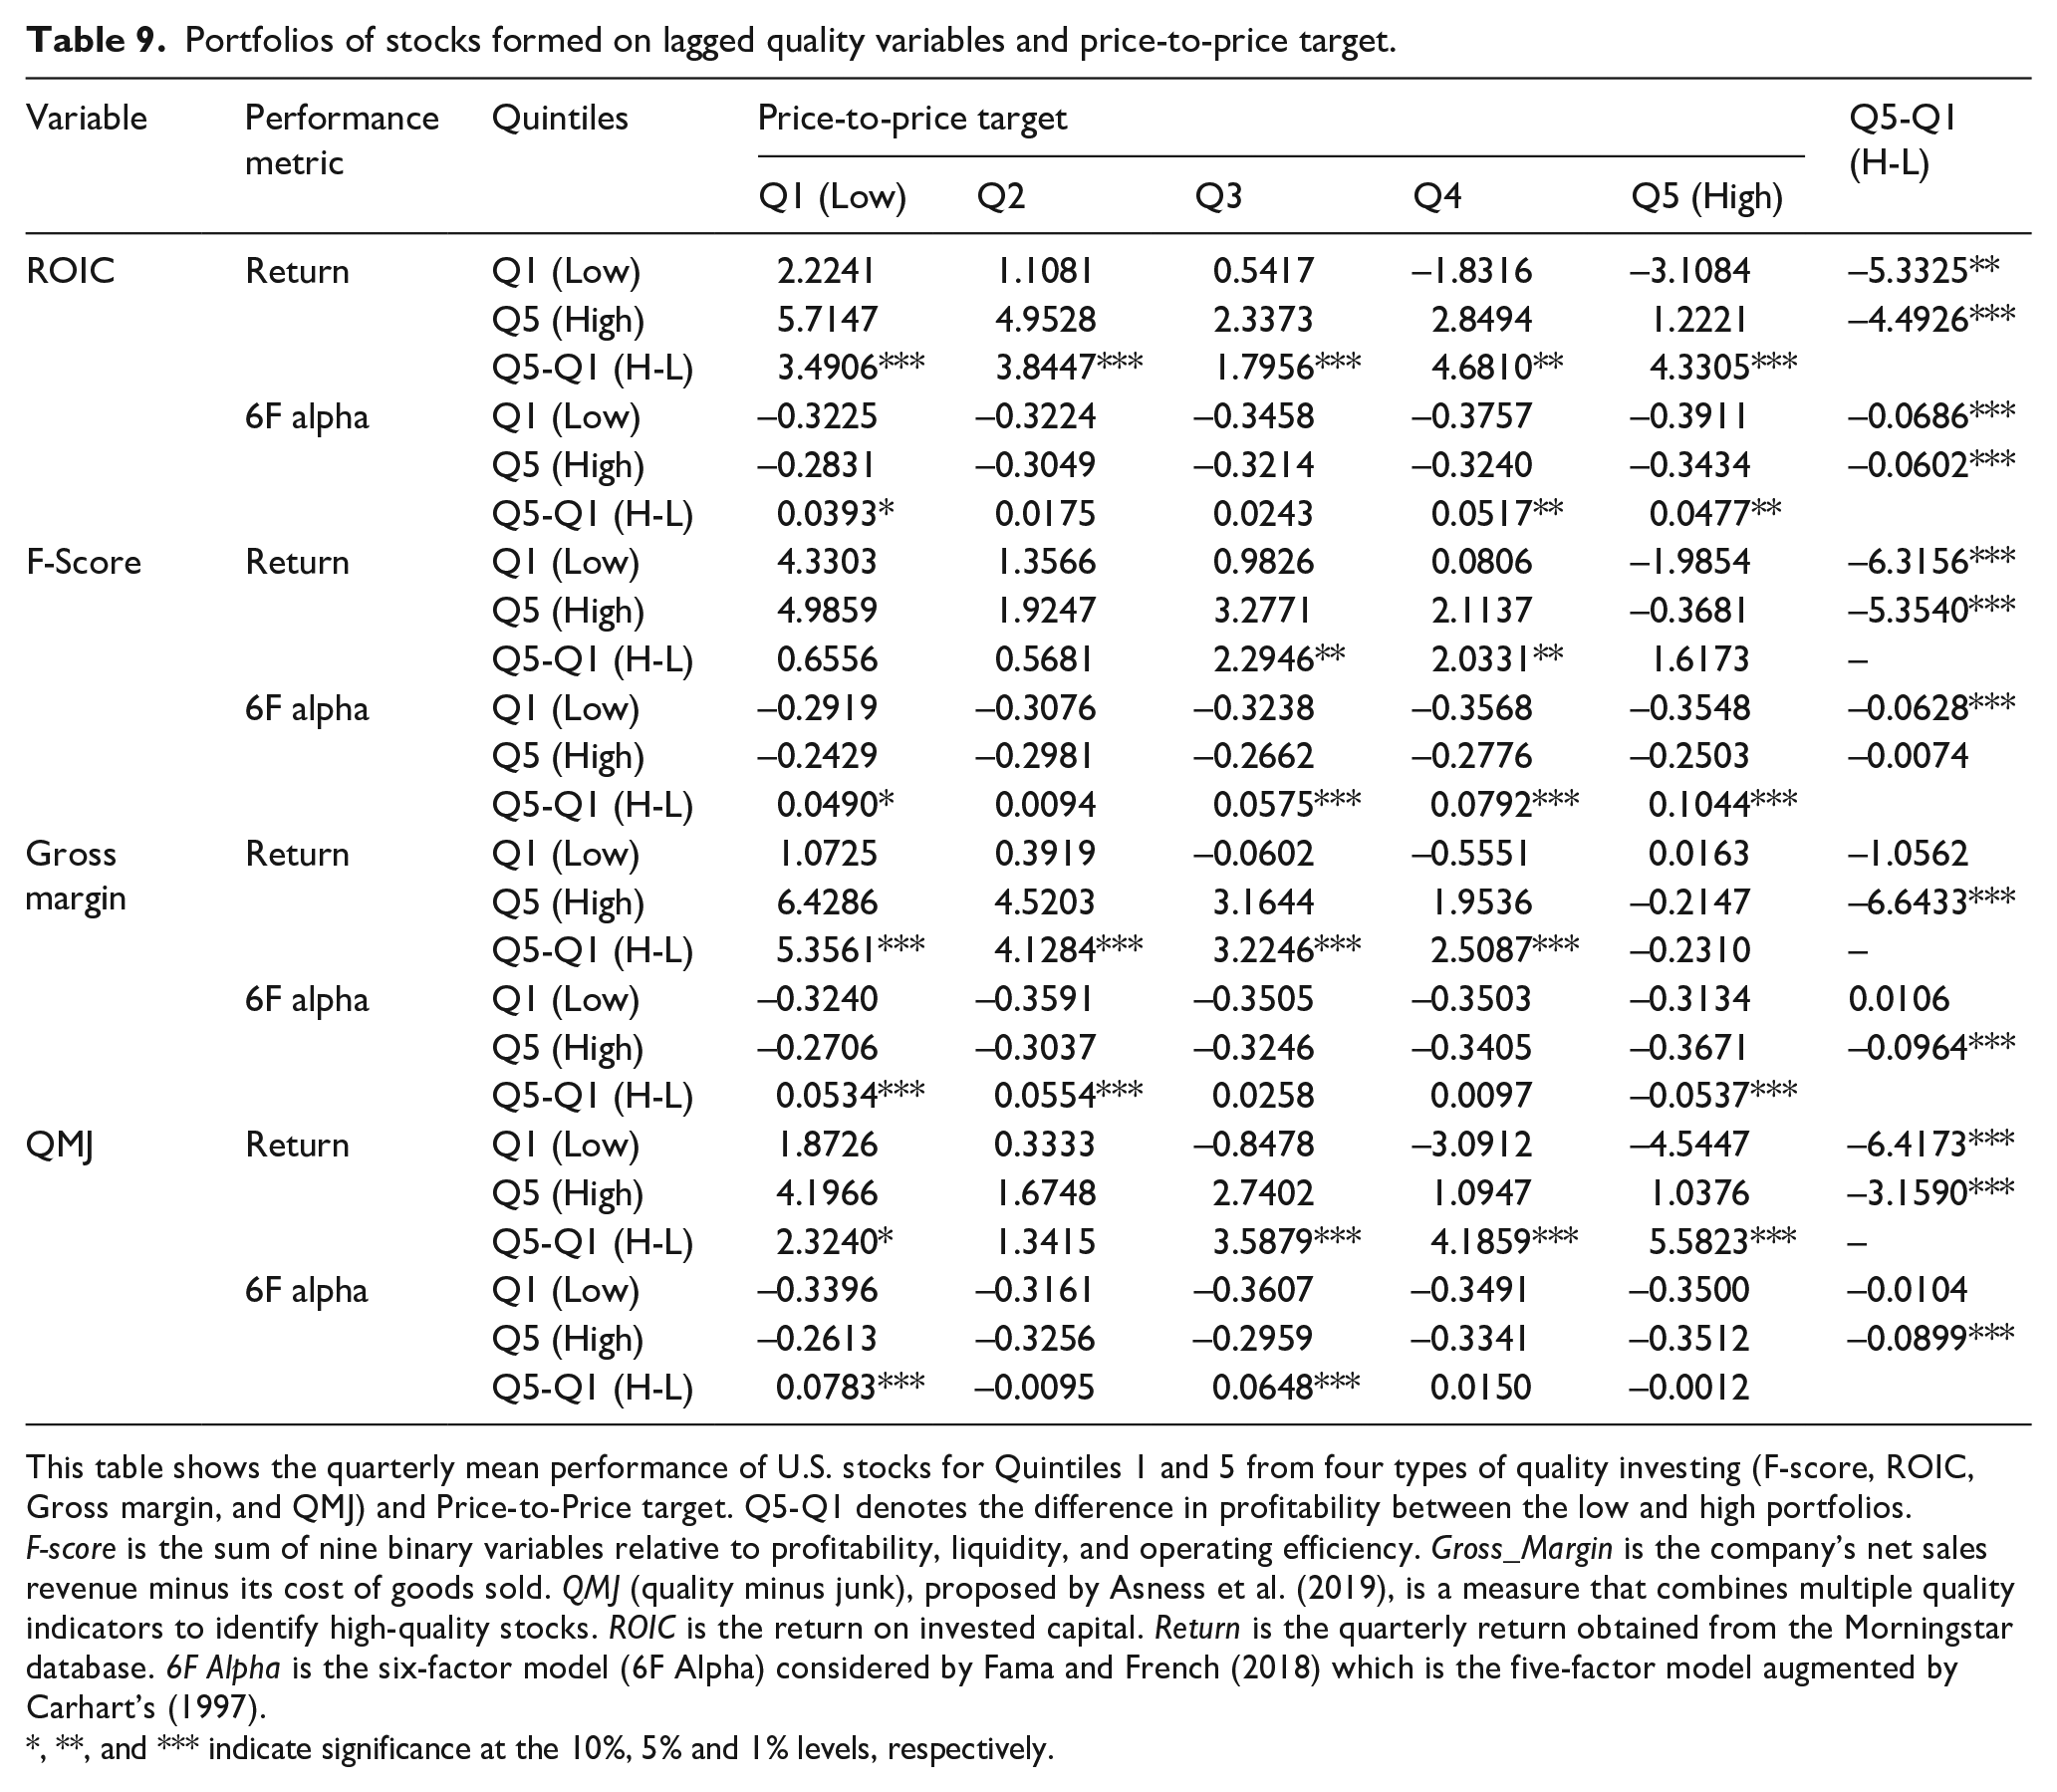
This table shows the quarterly mean performance of U.S. stocks for Quintiles 1 and 5 from four types of quality investing (F-score, ROIC, Gross margin, and QMJ) and Price-to-Price target. Q5-Q1 denotes the difference in profitability between the low and high portfolios. F-score is the sum of nine binary variables relative to profitability, liquidity, and operating efficiency. Gross_Margin is the company’s net sales revenue minus its cost of goods sold. QMJ (quality minus junk), proposed by Asness et al. (2019), is a measure that combines multiple quality indicators to identify high-quality stocks. ROIC is the return on invested capital. Return is the quarterly return obtained from the Morningstar database. 6F Alpha is the six-factor model (6F Alpha) considered by Fama and French (2018) which is the five-factor model augmented by Carhart’s (1997).
, **, and *** indicate significance at the 10%, 5% and 1% levels, respectively.
Now, in Table 10 we analyze the combination of the four quality indicators and their quintiles (Q1 and Q5) with the Morningstar Star Ratings. Bolster et al. (2016) found that Morningstar ratings are effective for distinguishing between the most overvalued (1-star) and undervalued (5-star) equities for the US market. Our study shows that once the stocks have been ordered according to the quality metrics in quintiles, the stars are still useful for improving the performance of an investment portfolio in terms of returns. However, when we observe the coefficients associated with the six-factor alpha metric, in general, stars are less effective because most of the coefficients are not significant.
Portfolios of stocks formed on lagged quality variables and Morningstar Star Rating.
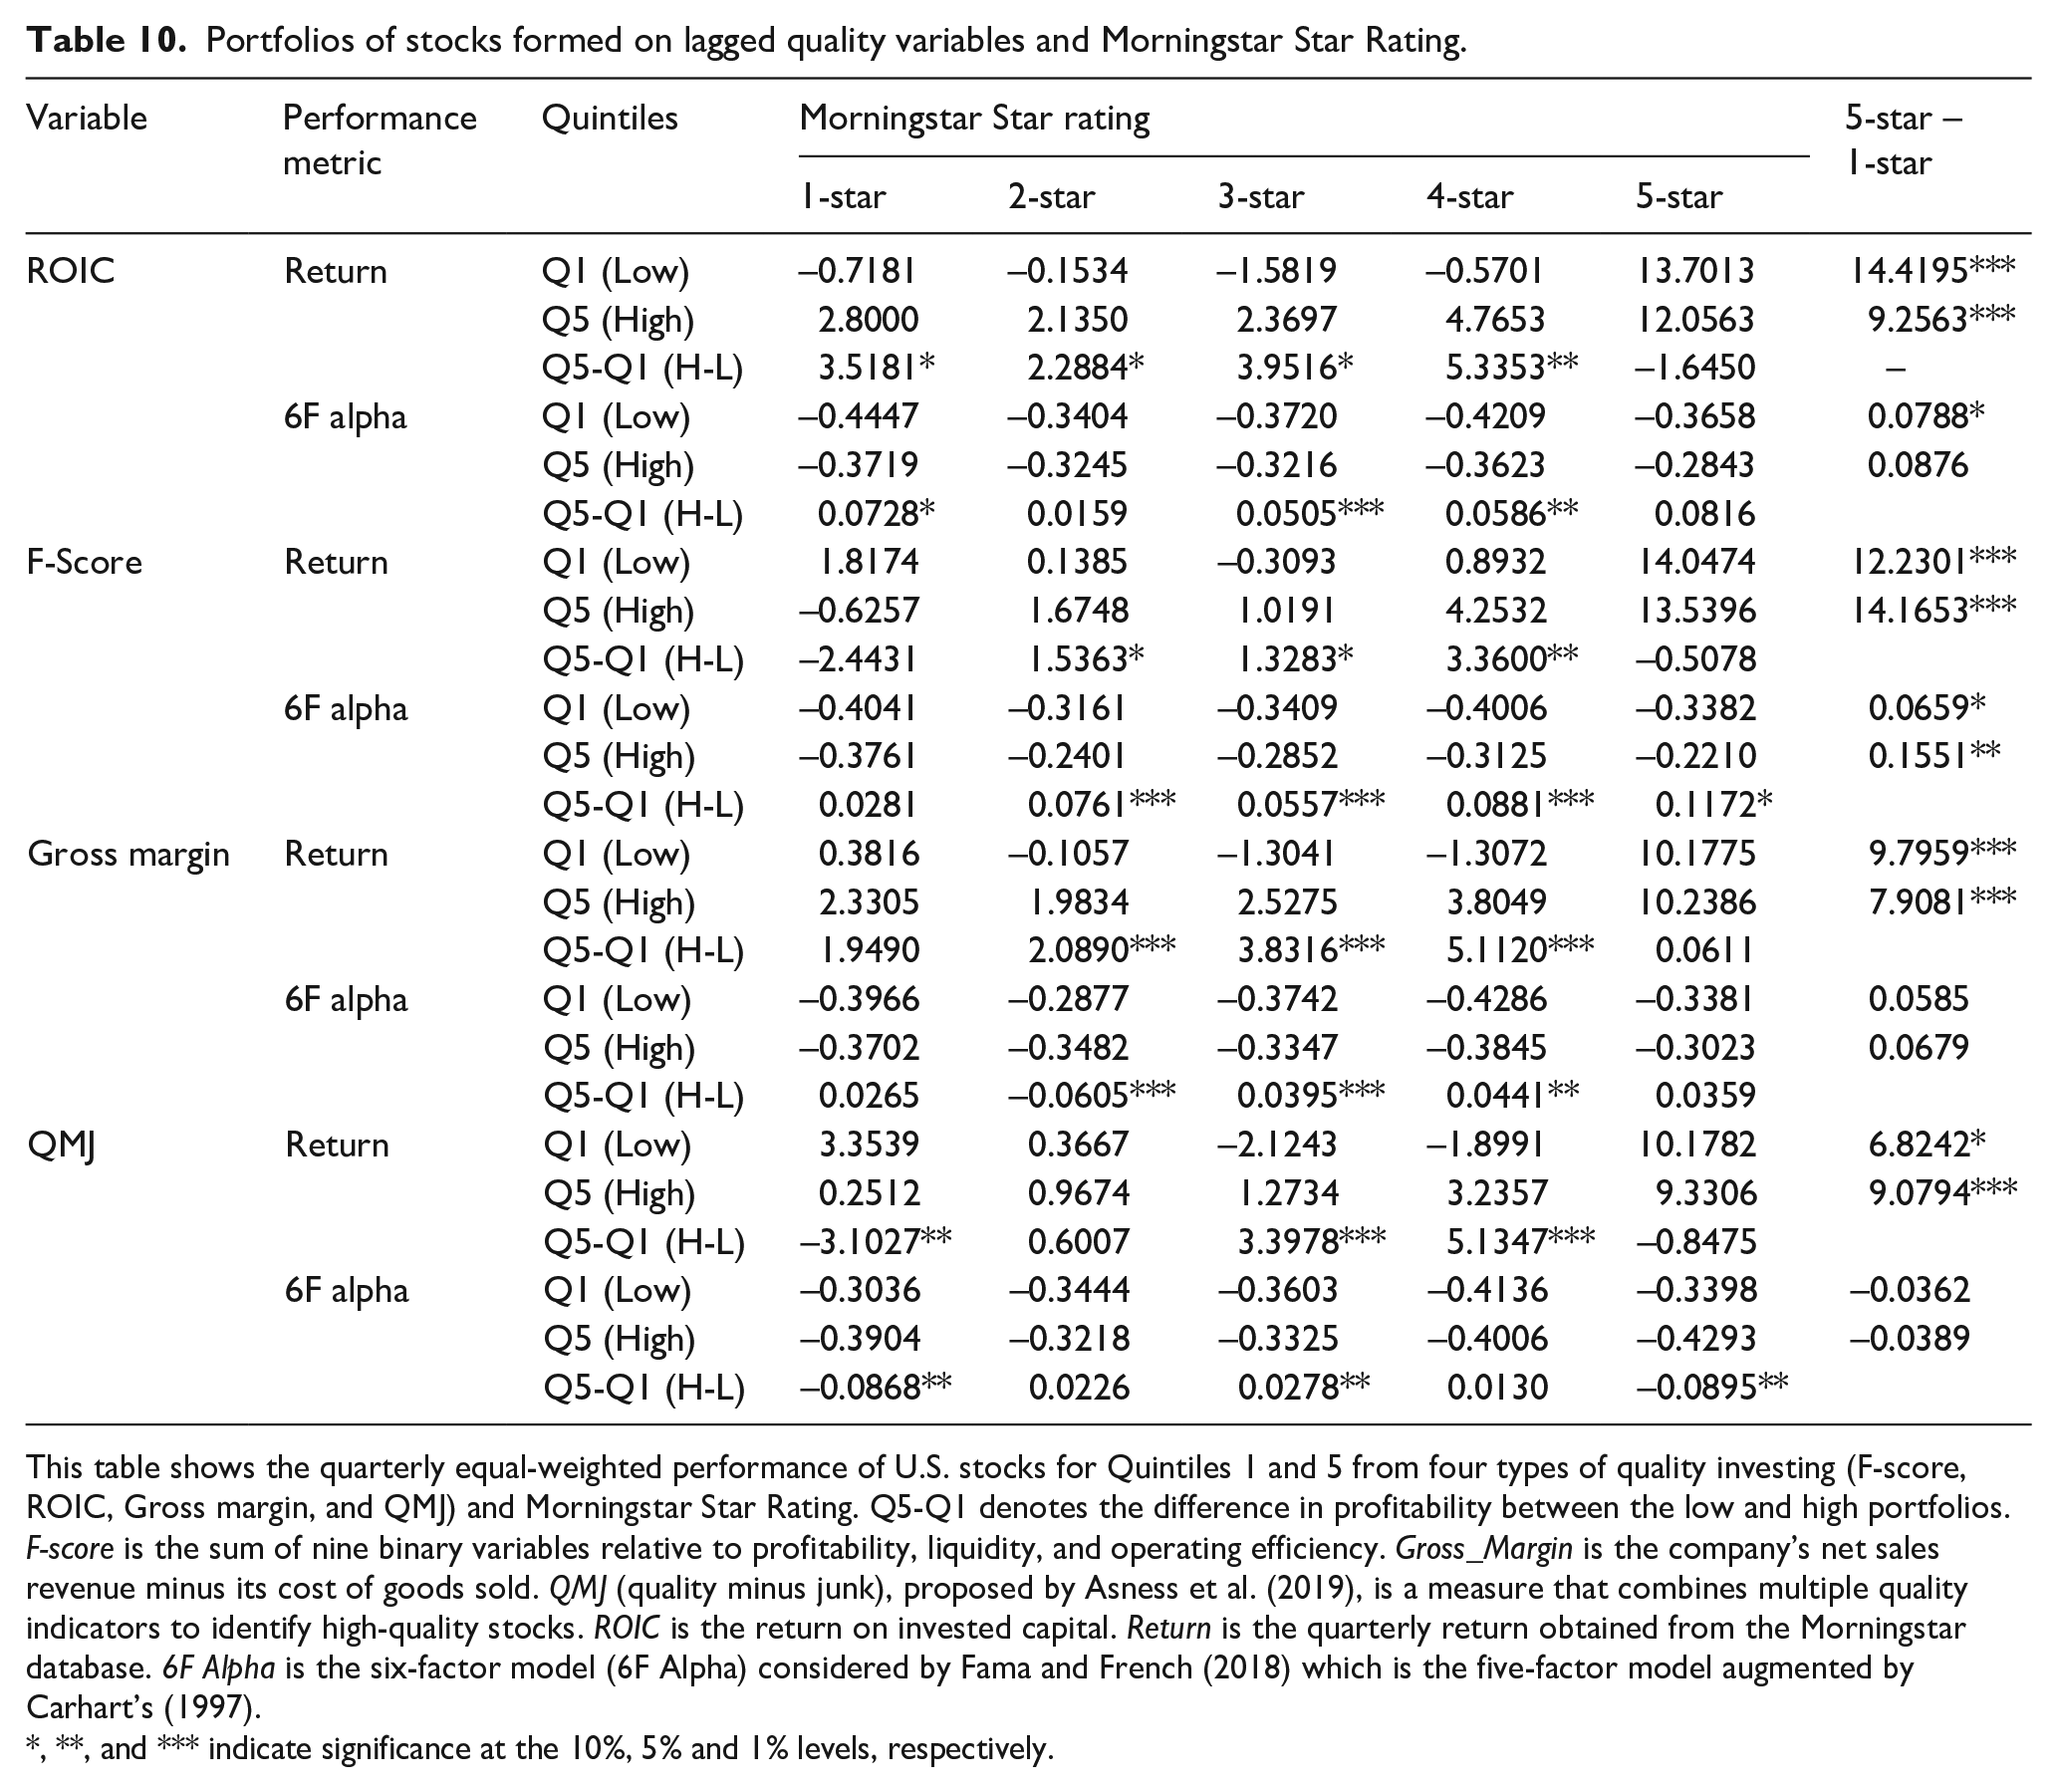
This table shows the quarterly equal-weighted performance of U.S. stocks for Quintiles 1 and 5 from four types of quality investing (F-score, ROIC, Gross margin, and QMJ) and Morningstar Star Rating. Q5-Q1 denotes the difference in profitability between the low and high portfolios. F-score is the sum of nine binary variables relative to profitability, liquidity, and operating efficiency. Gross_Margin is the company’s net sales revenue minus its cost of goods sold. QMJ (quality minus junk), proposed by Asness et al. (2019), is a measure that combines multiple quality indicators to identify high-quality stocks. ROIC is the return on invested capital. Return is the quarterly return obtained from the Morningstar database. 6F Alpha is the six-factor model (6F Alpha) considered by Fama and French (2018) which is the five-factor model augmented by Carhart’s (1997).
, **, and *** indicate significance at the 10%, 5% and 1% levels, respectively.
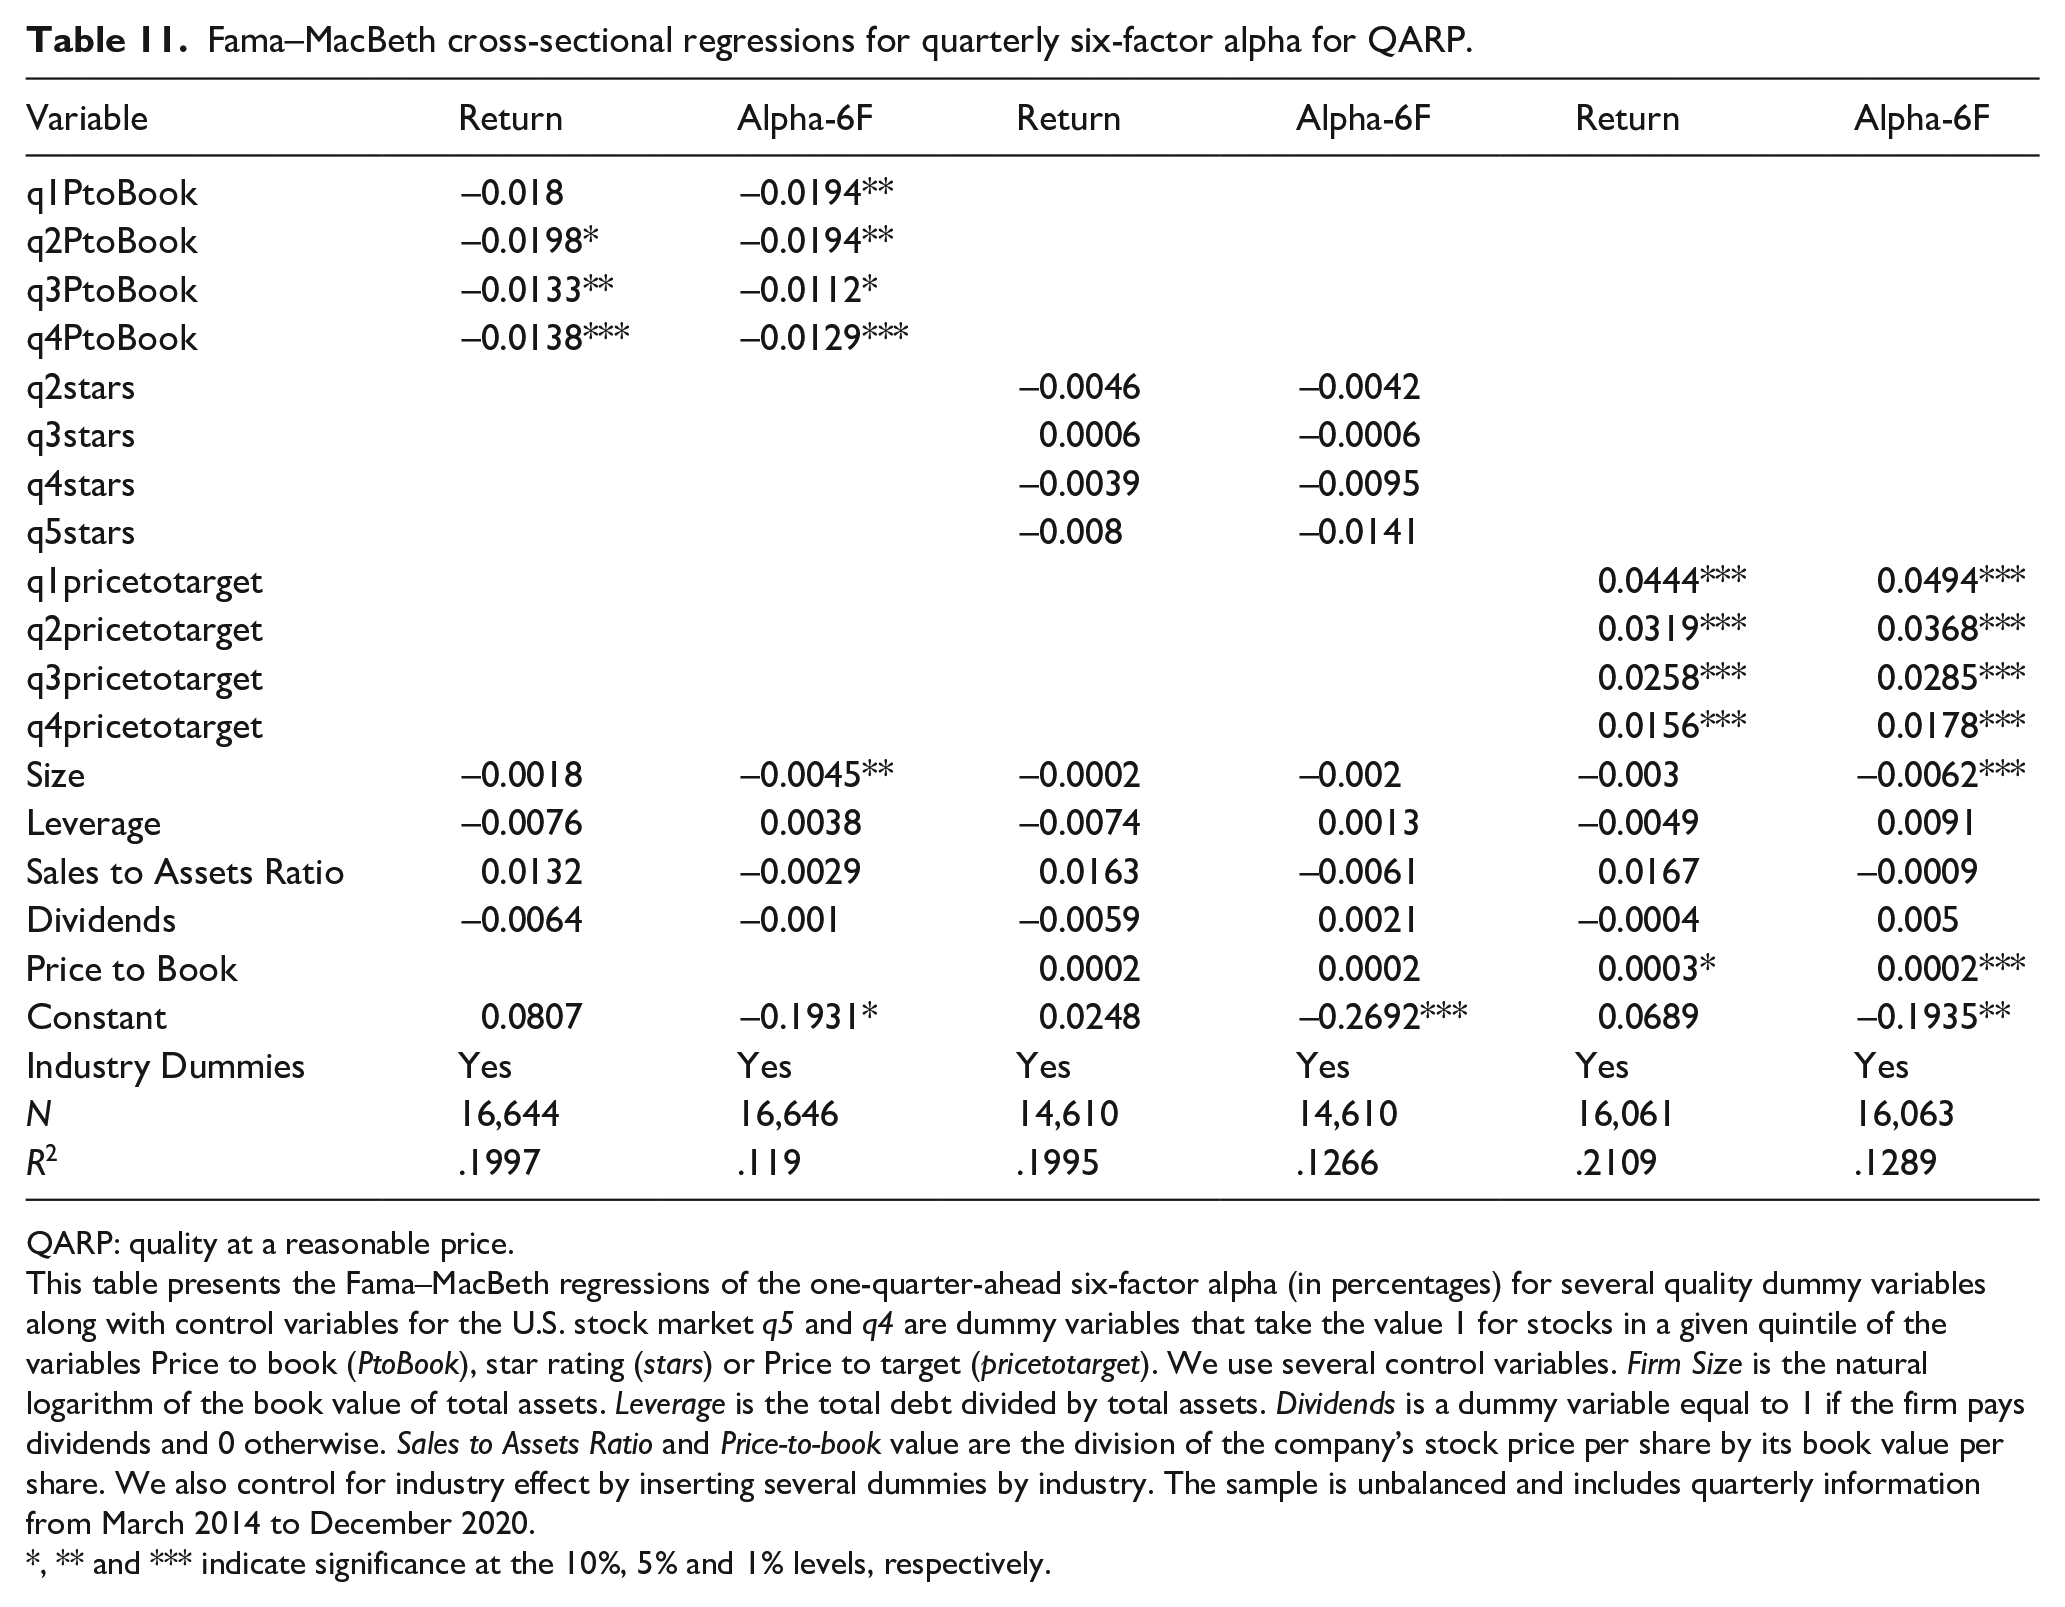
Now, we address the effect of considering QARP in the regression models. To do this, we include three variables, namely, Price to book (PtoBook), as in previous studies about quality investment such as Novy-Marx (2014) and Asness et al. (2019), the Morningstar Star Rating (Stars), which takes into account the relationship between price and fair value and which represents a greater undervaluation the higher the rating, and, finally, the Price-to-Price target (Pricetotarget) of the market consensus, provided by Datastream. First, we analyze the effect on return and six-factor alpha (Alpha6) of strategies based on choosing stocks in each quarter within a given quintile. The results obtained (Table 11) show that in the case of the most common ratio (Price to book), the effect on both indicators is negative and significant in contrast with Asness et al. (2019), Novy-Marx (2014), and Piotroski and So (2012). In addition to this, the star ratings are not significant, but it is the average price to target (consensus of analysts) where a positive and greater effect is clearly observed for stocks with a greater potential of appreciation according to the analysts’ predictions. With this in mind, we can deduce that the average analyst recommendations can help predict future returns (Azevedo & Müller, 2020; Howe et al., 2009) and to improve traditional quality strategies. Taking this into consideration, we can observe that analysts’ opinions regarding asset valuation are valuable information for designing investment strategies, in line with what we proposed in Hypothesis 4. In addition, our study suggests that other indicators such as the Price to Book ratio or Morningstar’s rating have not demonstrated predictive ability on future performance, questioning their validity in identifying undervalued quality assets.
Fama–MacBeth cross-sectional regressions for quarterly six-factor alpha for QARP.
QARP: quality at a reasonable price.
This table presents the Fama–MacBeth regressions of the one-quarter-ahead six-factor alpha (in percentages) for several quality dummy variables along with control variables for the U.S. stock market q5 and q4 are dummy variables that take the value 1 for stocks in a given quintile of the variables Price to book (PtoBook), star rating (stars) or Price to target (pricetotarget). We use several control variables. Firm Size is the natural logarithm of the book value of total assets. Leverage is the total debt divided by total assets. Dividends is a dummy variable equal to 1 if the firm pays dividends and 0 otherwise. Sales to Assets Ratio and Price-to-book value are the division of the company’s stock price per share by its book value per share. We also control for industry effect by inserting several dummies by industry. The sample is unbalanced and includes quarterly information from March 2014 to December 2020.
, ** and *** indicate significance at the 10%, 5% and 1% levels, respectively.
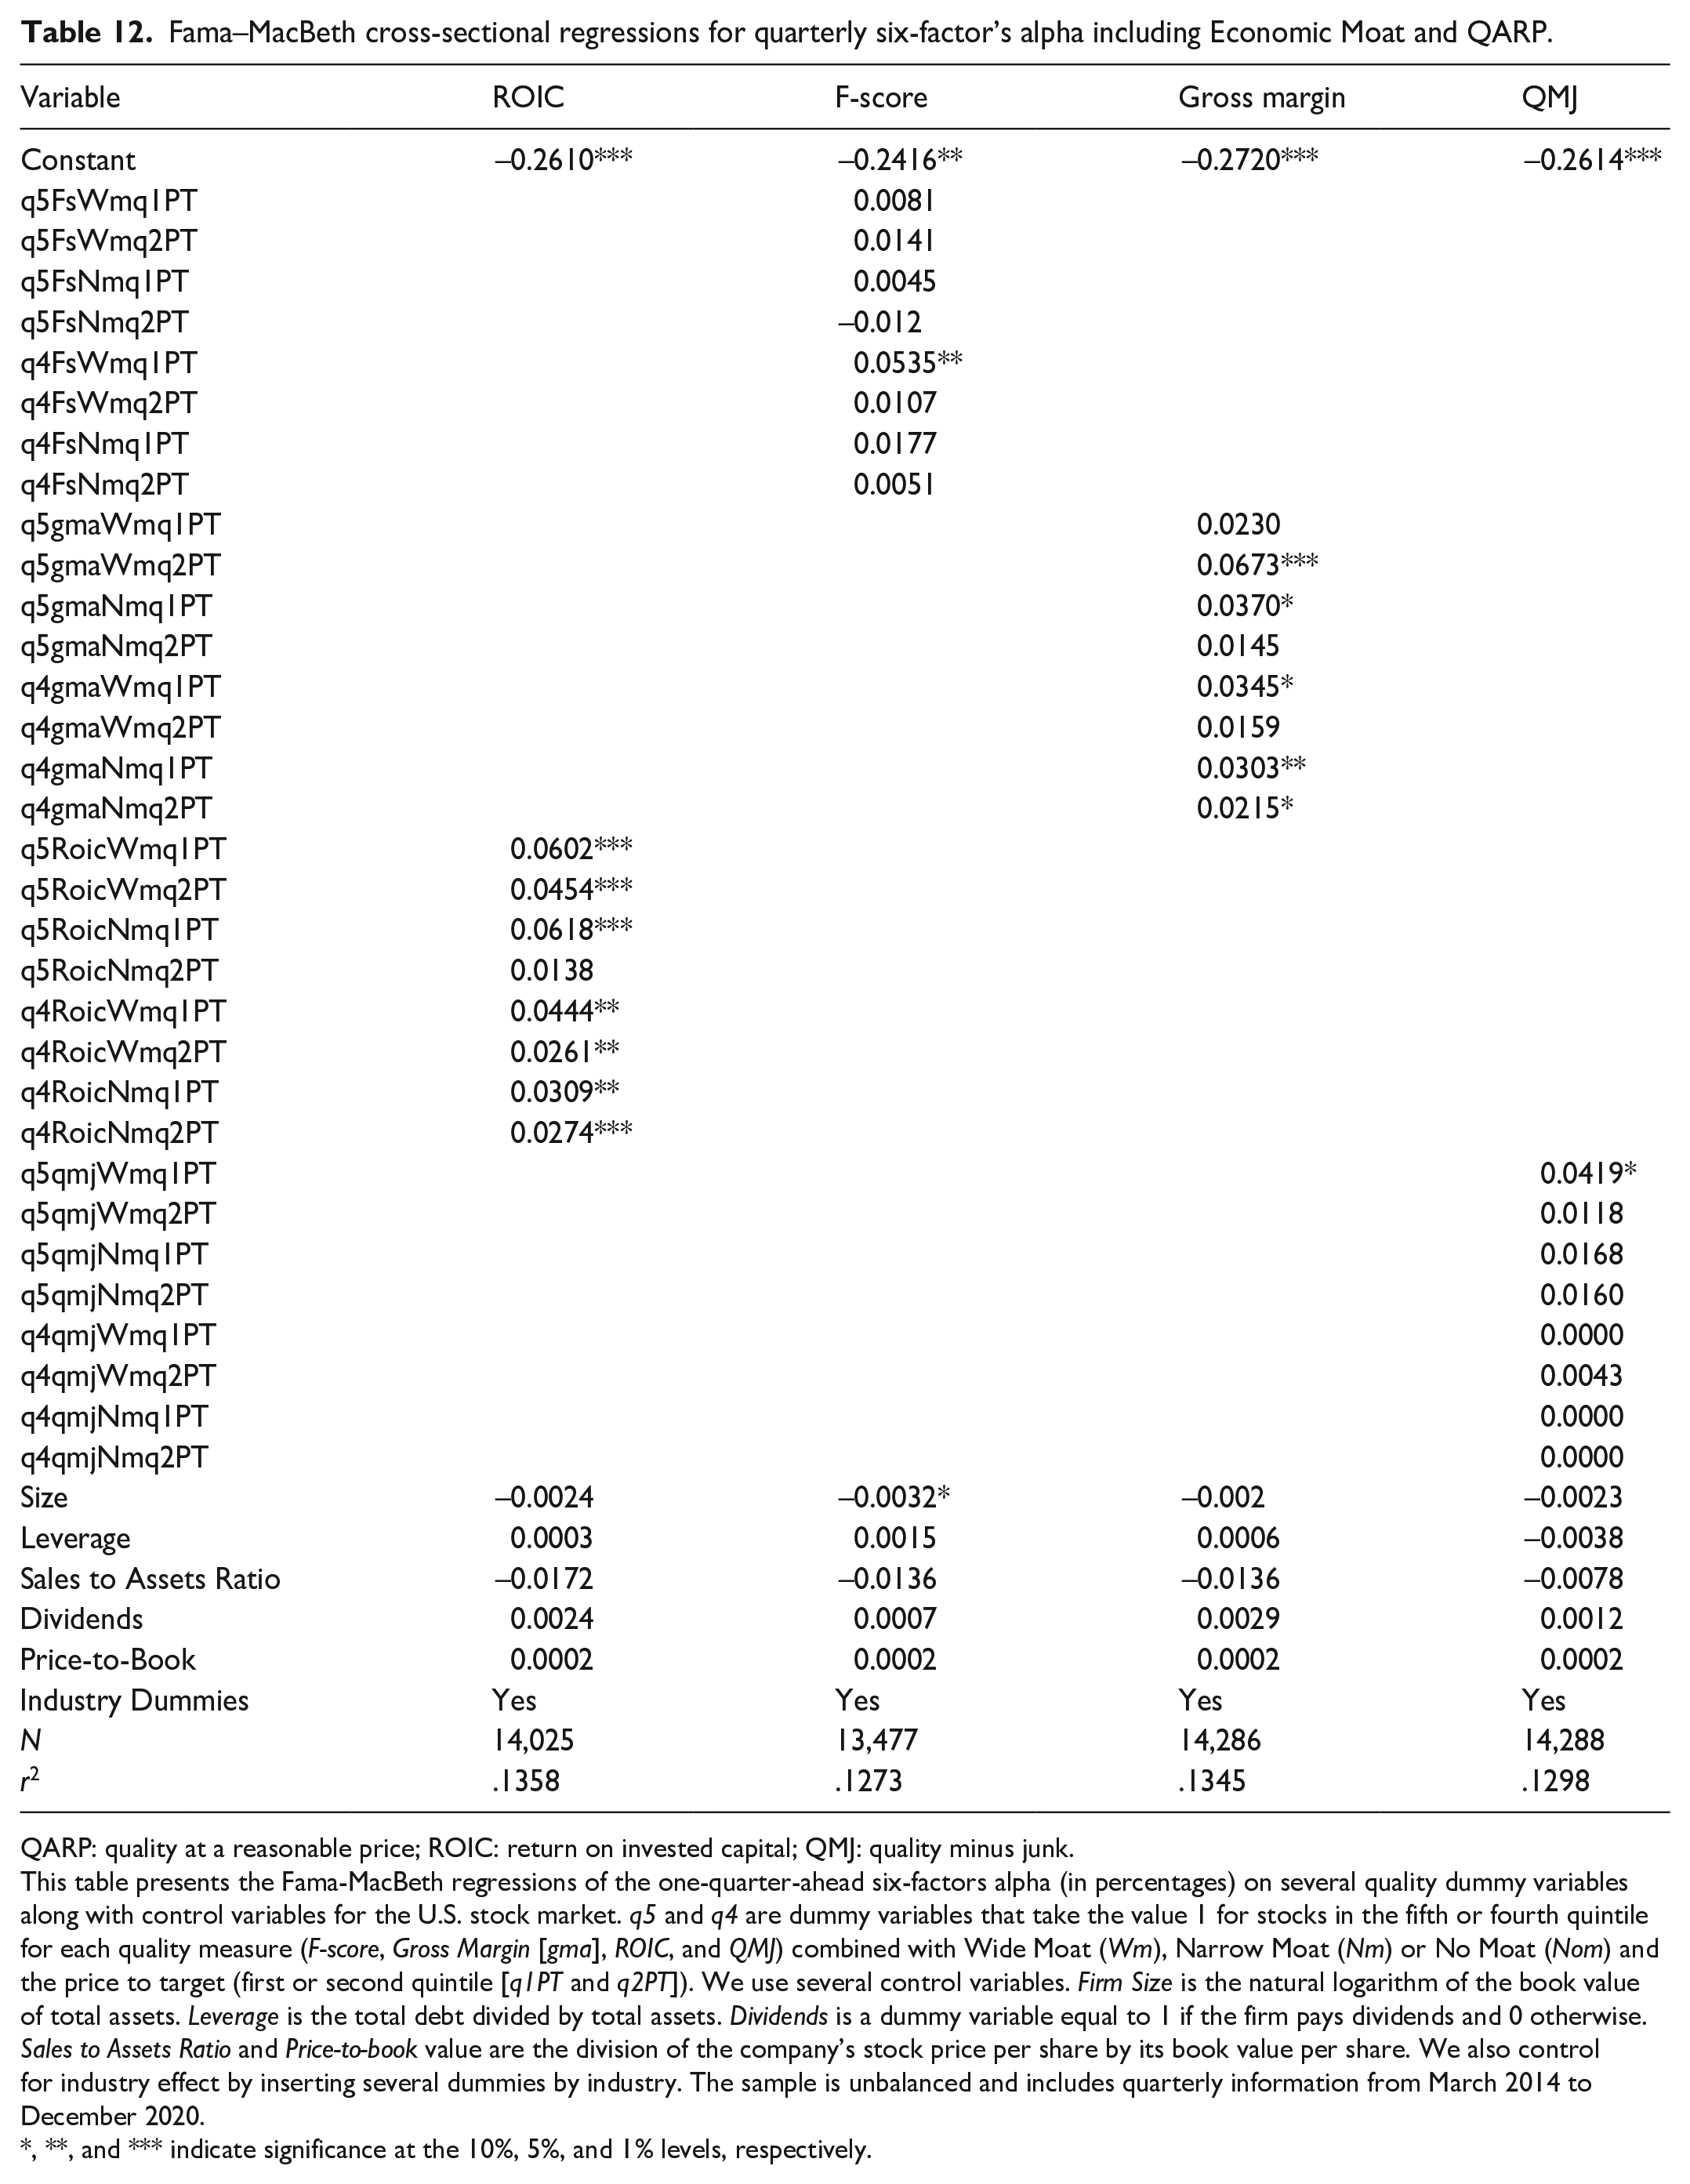
Finally, in Table 12 we show the results of the quality and moat strategies combined with the Pricetotarget, as they were the only ones that were significant in the previous models. The results show an increase in abnormal returns for certain strategies that bet on quality and Moat, combined with the smallest Price to target, that is, the biggest difference between the market price and the objective price. In particular, ROIC is the quality indicator that provides the greatest excess alpha, together with gross margin, while F-score and QMJ have most of their coefficients non-significant. The results obtained indicate that conventional quality strategies can be improved through the incorporation of the company’s competitive advantages, as measured by the Economic Moat, and, above all, by the consensus of analysts regarding the potential for stock revaluation. The ROIC is the most consistent measure because it is significant in all the models and achieves the higher difference in performance. Our results are consistent with the “magic formula” proposed by Greenblatt (2010), which emphasizes buying stocks with high ROIC.
Fama–MacBeth cross-sectional regressions for quarterly six-factor’s alpha including Economic Moat and QARP.
QARP: quality at a reasonable price; ROIC: return on invested capital; QMJ: quality minus junk.
This table presents the Fama-MacBeth regressions of the one-quarter-ahead six-factors alpha (in percentages) on several quality dummy variables along with control variables for the U.S. stock market. q5 and q4 are dummy variables that take the value 1 for stocks in the fifth or fourth quintile for each quality measure (F-score, Gross Margin [gma], ROIC, and QMJ) combined with Wide Moat (Wm), Narrow Moat (Nm) or No Moat (Nom) and the price to target (first or second quintile [q1PT and q2PT]). We use several control variables. Firm Size is the natural logarithm of the book value of total assets. Leverage is the total debt divided by total assets. Dividends is a dummy variable equal to 1 if the firm pays dividends and 0 otherwise. Sales to Assets Ratio and Price-to-book value are the division of the company’s stock price per share by its book value per share. We also control for industry effect by inserting several dummies by industry. The sample is unbalanced and includes quarterly information from March 2014 to December 2020.
, **, and *** indicate significance at the 10%, 5%, and 1% levels, respectively.
Robustness
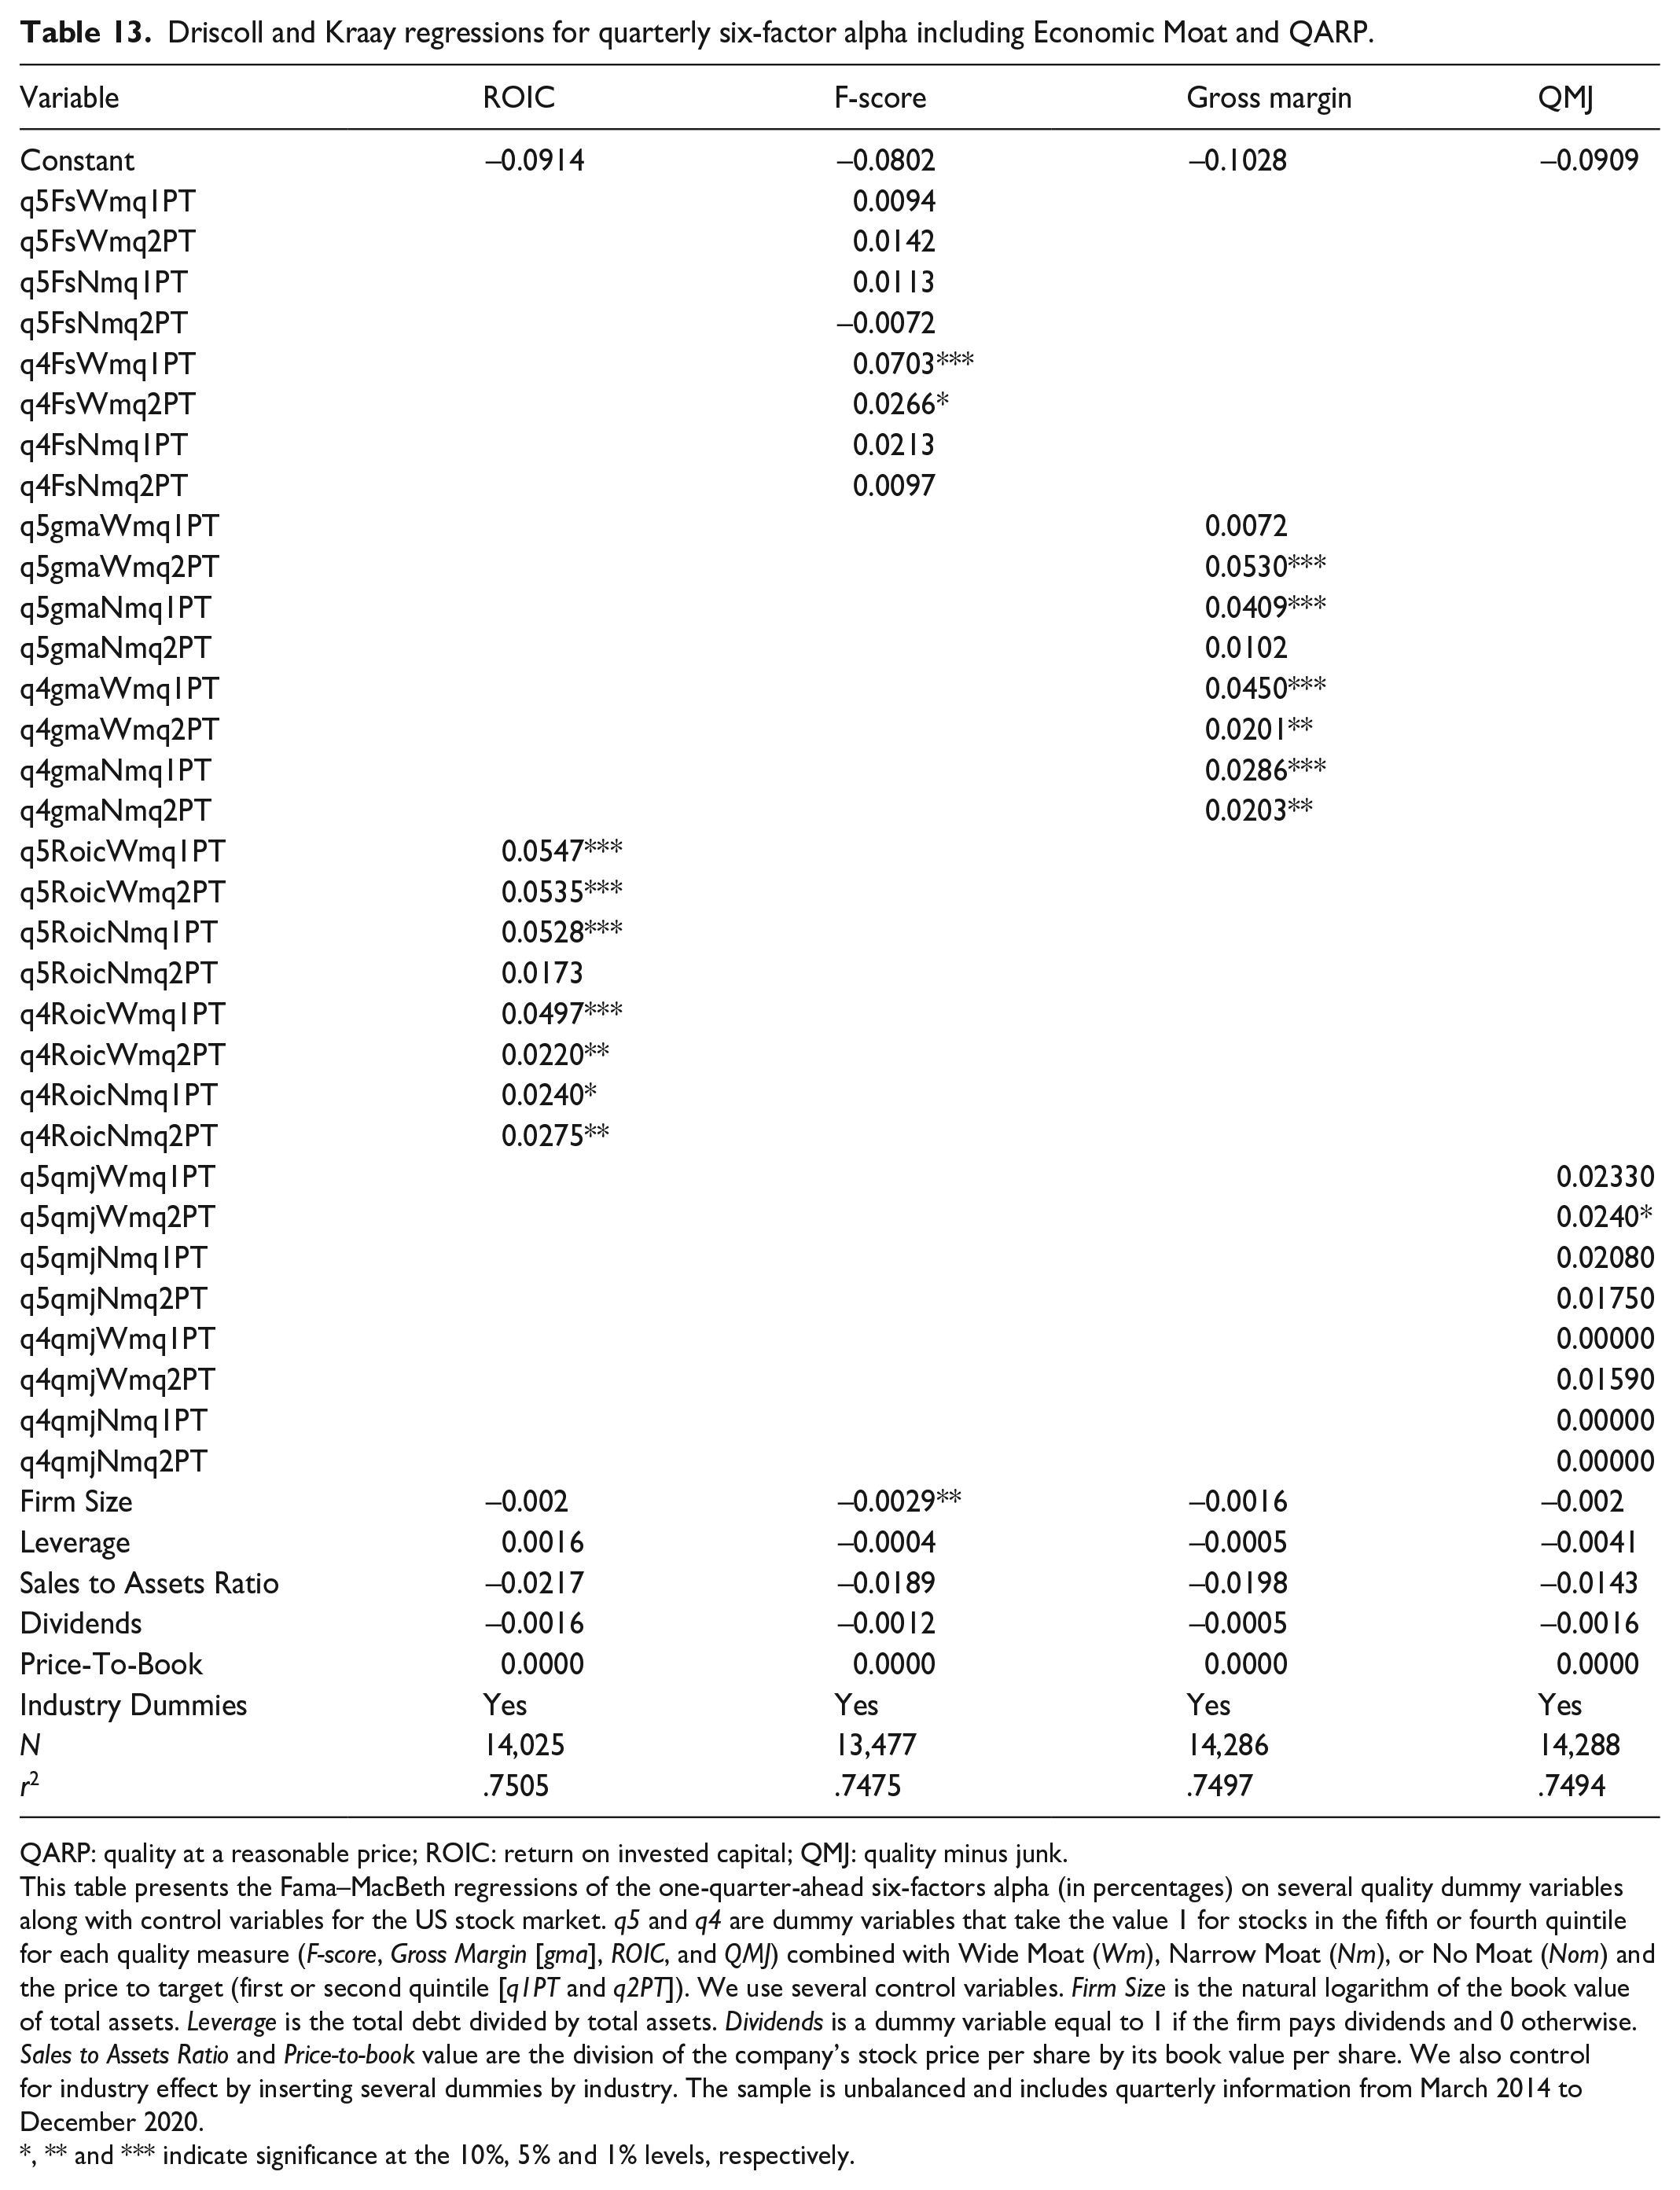
We have controlled for unobserved heterogeneity by cross-section and over time by including year-by-year fixed effects. In addition, due to control by heteroskedasticity and autocorrelation, we have used clustered standard errors by year and fund (Petersen, 2009), and estimated the Driscoll and Kraay (1998) standard errors correction, which is consistent with the two abovementioned situations as well as with cross-sectional dependence. In Table 13, we only show the results of the Driscoll and Kraay (1998) because the results are quite similar when Petersen (2009) is used. As can be seen, gross margin and ROIC continue to be the only significant variables in combination with the economic moat and the analyst price consensus, and the coefficients remain significant and with values very similar to those of the Fama–MacBeth estimations.
Driscoll and Kraay regressions for quarterly six-factor alpha including Economic Moat and QARP.
QARP: quality at a reasonable price; ROIC: return on invested capital; QMJ: quality minus junk.
This table presents the Fama–MacBeth regressions of the one-quarter-ahead six-factors alpha (in percentages) on several quality dummy variables along with control variables for the US stock market. q5 and q4 are dummy variables that take the value 1 for stocks in the fifth or fourth quintile for each quality measure (F-score, Gross Margin [gma], ROIC, and QMJ) combined with Wide Moat (Wm), Narrow Moat (Nm), or No Moat (Nom) and the price to target (first or second quintile [q1PT and q2PT]). We use several control variables. Firm Size is the natural logarithm of the book value of total assets. Leverage is the total debt divided by total assets. Dividends is a dummy variable equal to 1 if the firm pays dividends and 0 otherwise. Sales to Assets Ratio and Price-to-book value are the division of the company’s stock price per share by its book value per share. We also control for industry effect by inserting several dummies by industry. The sample is unbalanced and includes quarterly information from March 2014 to December 2020.
, ** and *** indicate significance at the 10%, 5% and 1% levels, respectively.
As seen in Table 14, the positive effect of quality investing on performance is confirmed for all the performance indicators, but partially (only F-score and ROIC) in the regression models (H1). Therefore, our work verifies the positive impact of implementing quality strategies, but not all the metrics. The consideration of moat contributes to increase the quality strategies performance supporting Hypothesis 2, but again only for the F-score and ROIC measures. Contrary to hypothesis 3, our results show that the consideration of ESG reduces the performance and in general investors pay a premium investing in ESG. Nevertheless, the combination of ESG with quality and moat strategies is a way of investing without assuming the premium and, in some cases, achieving a positive result. Finally, the consideration of QARP principle, using the analyst’s recommendations based on the consensus of the market, improves the performance of traditional quality strategies, supporting H4.
Summary of results and hypothesis testing.
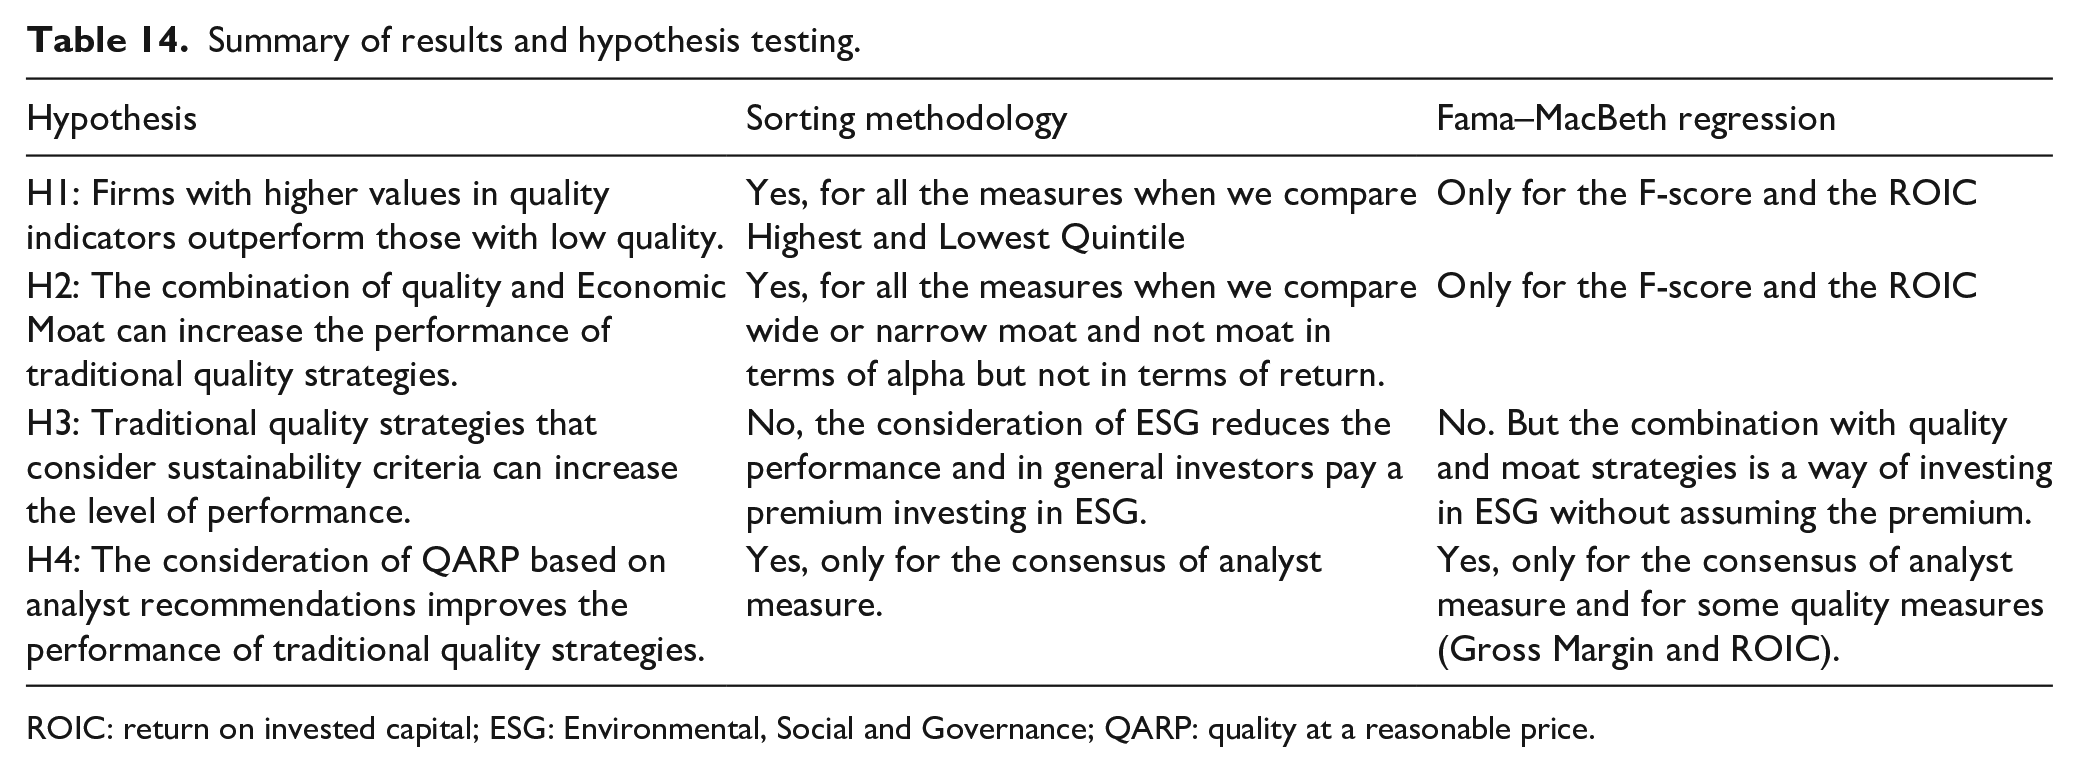
ROIC: return on invested capital; ESG: Environmental, Social and Governance; QARP: quality at a reasonable price.
Conclusions
Many investors select their investments in stocks based on quality indicators. One open question in the literature is the following: Which investing metrics and ratios are the best for stock selection? In this article, we focus on four well-known metrics (F-score, ROIC, Gross margin, and the QMJ factor). However, picking stocks based exclusively on quality indicators excludes a set of factors that can explain future performance. Our results show that, among the four metrics analyzed, the one that can improve the stock selection when it is analyzed in isolation is the ROIC indicator. In the literature, the ROIC metric does not usually attract the same level of interest as other indicators like the ROA or ROE ratios. When we analyze the effect of combining the profitability of the best quintiles of the various quality indicators (ROIC and the other three metrics) and the Economic Moat, our results show that all the combinations of high ROIC (top quintile) and Wide or Narrow Economic Moat obtain a positive and significant excess of alpha, but in general not in terms of return.
In recent years, some researchers and asset managers have proposed including ESG factors as a measure of quality or combining them in quality investing. Investing in quality companies with high ESG causes a lower alpha. Consequently, investors in the U.S. market would be willing to accept lower performance in companies with high ESG; in other words, they would be paying an ESG premium. However, if, in addition to the previous two criteria, we select companies that have wide competitive advantages, it is possible to invest in quality companies and high ESG without sacrificing profitability.
The combination of quality investing, competitive advantages, and price valuation shows that when both criteria are combined, it is possible to pick stocks that outperform the rest of the sample in the period analyzed. To find outperformers, it is necessary to combine quality especially with undervalued stocks.
Our article shows that solvent and profitable companies are recognized with a value premium that increases for those with competitive advantages but decreases for more sustainable ones. These results, in addition to being important for investors, are also important for guiding managers on the drivers that create value in the company.
Our article has some limitations. We measure the effect of performance using lagged variables on t – 1 and 28 quarters of data. In addition, we have focused on analyzing the U.S. equity market, so other markets should be studied for greater robustness with results or, on the contrary, to obtain disparate results by markets (absence of ESG premium, etc.).
Footnotes
Declaration of conflicting interests
The author(s) declared no potential conflicts of interest with respect to the research, authorship, and/or publication of this article.
Funding
The author(s) disclosed receipt of the following financial support for the research, authorship, and/or publication of this article: We acknowledge the funding of: (1) the Galician Regional Government [ED431C 2020/18] co-funded by the European Regional Development Fund (ERDF/FEDER) for the period 2020–2023 and (2) the Ministry of Economy and Competitivity (PID2021-1243360B-100).