
Abstract
Cisplatin (CDDP) is known to produce renal proximal tubule injury. Various renal biomarkers have been related to CDDP nephrotoxicity in previous research, but the temporal and spatial relationship of these biomarkers to injury reversal has not been well defined. In this study, the progression and reversal of renal histopathology findings relative to serum and urinary biomarker changes were examined during a 4-week postdose period following single intraperitoneal administration of CDDP (1 mg/kg) or 0.9% saline. Degeneration, vacuolation, inflammation, and regeneration of the S3 segment of proximal tubules were evident 72 hours following CDDP administration. Tubular degeneration and regeneration were also observed at 1 and 1.5 weeks but at lower incidences and/or severity indicating partial reversal. Complete histologic reversal was observed by 2 weeks following CDDP administration. Urinary kidney injury molecule 1 (KIM-1), α-glutathione-S-transferase (α-GST), and albumin levels increased at 72 hours postdosing, concurrently with the earliest histologic evidence of tubule injury. Changes in urinary KIM-1 correlated with KIM-1 immunostaining in the proximal tubular epithelial cells. No significant changes in serum biomarkers occurred except for a minimal increase in urea nitrogen at 1.5 weeks postdosing. Of the novel renal biomarkers examined, urinary KIM-1, α-GST, and albumin showed excellent concordance with CDDP-induced renal injury progression and reversal; and these biomarkers were more sensitive than traditional serum biomarkers in detecting early, acute renal tubular damage confirmed by histopathology. Furthermore, urinary KIM-1, α-GST, and albumin outperformed other biomarkers in correlating with the time of maximum histologic injury.
Introduction
Cisplatin (CDDP) was the first platinum-containing cancer chemotherapeutic agent. 1 Its mechanism of action involves the formation of platinum complexes in cells and subsequent inhibition of DNA synthesis, eventually triggering apoptosis. 2 The CDDP therapy is often complicated by dose-limiting drug-induced kidney injury (DIKI). 3 In both the clinical setting and the preclinical studies in rats, CDDP-induced acute kidney injury (AKI) progression is often undetectable by noninvasive methods such as measurement of serum creatinine (sCr) or blood urea nitrogen (BUN) levels, which represent traditional renal biomarkers. Both sCr and BUN lack sensitivity and specificity for monitoring alterations in glomerular filtration rate, which is the best indicator of kidney function.
The United States Food & Drug Administration, European Medicines Agency, and Pharmaceuticals Medical Devices Agency, Japan, have acknowledged the qualification of 8 novel, urinary protein biomarkers that are highly sensitive and specific for monitoring DIKI progression in rats. 4 The qualified renal biomarkers include urinary kidney injury molecule 1 (KIM-1), urinary trefoil factor 3, urinary clusterin, urinary renal papillary antigen 1 (RPA-1), urinary total protein (TP), urinary albumin, urinary β2 microglobulin, and urinary cystatin C. It is of particular interest to further characterize biomarker profiles in situations where early, reversible DIKI is present but not detectable by traditional serum biomarkers in particular sCr and BUN.
In this study, various traditional and novel biomarkers were evaluated for monitoring the progression of subclinical DIKI in male Sprague-Dawley rats using CDDP as a model nephrotoxicant. Changes in biomarkers were related to histopathology findings, and where available, immunohistochemical changes in the kidney. The temporal relationship between the biomarker changes and the onset and reversal of histopathology findings was also examined. The sensitivity and specificity of different biomarkers to identify CDDP-induced proximal tubule injury are discussed.
Materials and Methods
Statement of Ethical Approval
All animal procedures were conducted in an Association for Assessment and Accreditation of Laboratory Animal Care International-accredited facility under an Institutional Animal Care and Use Committee approved protocol. Standard procedures and conditions for animal care, feeding, and maintenance of room, caging, and environment were used.
Experimental Design
Male Sprague-Dawley rats, 7 to 8 weeks old and weighing 265 to 300 g, were purchased from Charles River Laboratories. Animals were randomly assigned to either a vehicle control or a test article group. Cisplatin USP (CDDP, 51R U134357; Fitzgerald Industries International, Acton, Massachusetts) was formulated in 0.9% physiologic saline USP. Rats (56 total animals; assigned as N = 4 per experimental group per time point) were administered a single intraperitoneal (ip) injection of 0.9% saline or 1 mg/kg CDDP and necropsied approximately 6 hours (groups A1-A2), 72 hours (groups B1-B2), 1 week (groups C1-C2), 1.5 weeks (groups D1 D2), 2 weeks (groups E1-E2), 3 weeks (groups F1-F2), or 4 weeks (groups G1-G2) postdose (Table 1). Animals were fasted overnight for approximately 16 to 18 hours prior to the scheduled necropsy. During the time of fasting, urine samples were collected (on wet ice) from animals that were housed individually in metabolic cages. Total urine output volumes (over the 16- to 18-hour fasting period) were recorded. Urine samples were subaliquoted and subsequently stored at approximately 80°C until the time of analysis. Blood was collected at the time of necropsy and processed to obtain serum that was subsequently stored at approximately −80°C until the time of analysis.
Experimental Design.a
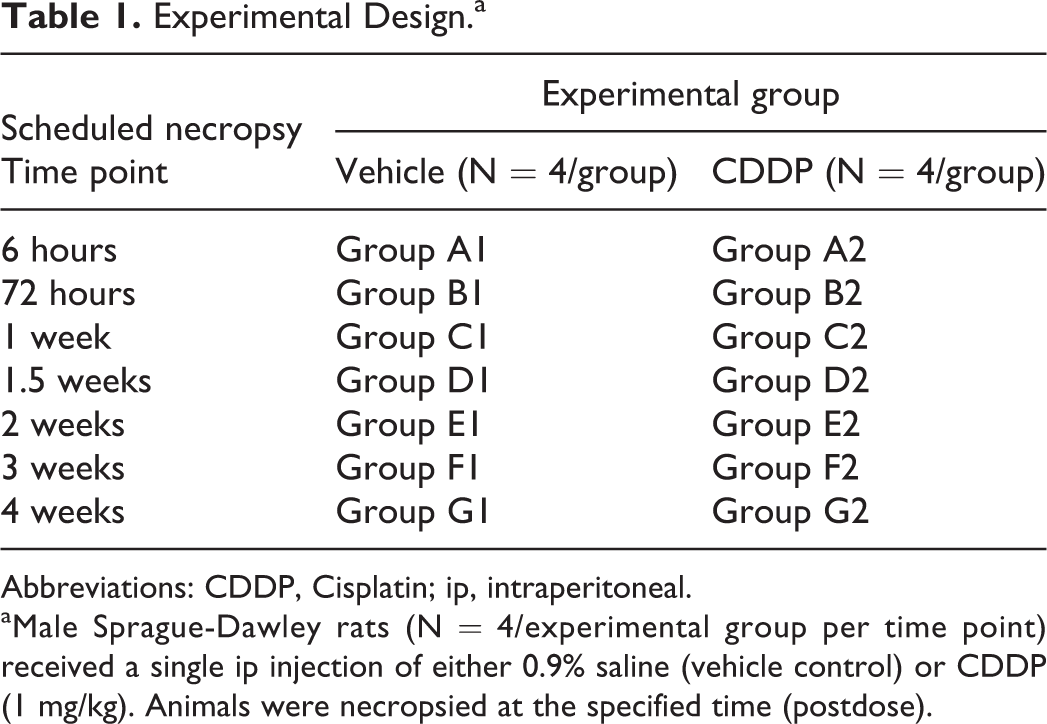
Abbreviations: CDDP, Cisplatin; ip, intraperitoneal.
aMale Sprague-Dawley rats (N = 4/experimental group per time point) received a single ip injection of either 0.9% saline (vehicle control) or CDDP (1 mg/kg). Animals were necropsied at the specified time (postdose).
Traditional Serum and Urinary Parameter Analysis
Serum and urine samples generated at each time point for all animals per experimental group were measured using the Advia 1800 automated chemistry system and Siemens reagents (Siemens Corporation, Washington, District of Columbia). The sCr, BUN, and glucose were measured in serum. The TP, glucose, N-acetyl-β-
Novel Urinary Biomarker Analysis
Urine samples generated at each time point for all the animals per experimental group were measured using the reagents indicated as follows: standard rat-specific enzyme-linked immunosorbent assay kits were used to measure the urinary levels of β2 microglobulin (ALPCO Diagnostics, Salem, New Hampshire) and cystatin C (BioVendor R&D, Candler, North Carolina). The Sector Imager-type instrument and Meso Scale Discovery reagents (Meso Scale Discovery, Gaithersburg, Maryland) were used to measure the urinary levels of KIM-1, lipocalin 2, osteopontin, and albumin in a multiplex assay, Rat Kidney Injury Panel 1. Urinary levels of α-glutathione-S-transferase (α-GST), μ-GST/GSTYb1, and RPA-1 were measured in a multiplex assay, Rat Acute Kidney Injury Test (Meso Scale Discovery). Urinary levels of clusterin were measured using the Rat Clusterin Assay Kit (Meso Scale Discovery). All novel urinary biomarkers were normalized to concurrent urinary creatinine concentration.
Histopathology
Representative kidney (left and right) samples generated at each time point for all the animals per experimental group were fixed in 10% neutral-buffered formalin for approximately 48 hours and subsequently processed, embedded in paraffin, sectioned at 4 μm, mounted on glass slides, deparraffinized, and stained with hematoxylin and eosin (H&E). Histopathological characterization of CDDP-induced renal tubule injury was performed by a pathologist in a blinded fashion using a semiquantitative scale. Renal tubule injury was characterized as tubule vacuolization, tubule degeneration, tubule regeneration, and/or interstitial inflammation. The distribution and increased number of cells affected were assigned a quantitative severity score, 0 = no abnormality noted, 1 = slight (minimal, <25%), 2 = mild (25%-50%), 3 = moderate (>50%), and 4 = severe (>75%).
Immunohistochemistry Staining
Representative kidney (left and right) generated at each time point for all animals per experimental group were formalin fixed, paraffin embedded, and sectioned at 4 μm, mounted on glass slides, deparraffinized, and hydrated in phosphate-buffered saline followed by blocking the endogenous peroxide with 3% hydrogen peroxide. Immunostaining was performed using the DAKO Autostainer (DAKO Cytomation, Carpinteria, California). For KIM-1 immunostaining, the slides were pretreated with 10% normal donkey serum before incubation with primary antibody to avoid nonspecific reaction with primary antibody. Goat affinity purified polyclonal anti-rat KIM-1 (AF3689; R&D Systems, Minneapolis, Minnesota) was used as the primary antibody at a concentration of 4 μg/mL. Normal goat immunoglobulin G (IgG; Santa Cruz Biotechnology, Dallas, Texas) was used as a negative control for the primary antibody at a concentration of 4 μg/mL. Donkey anti-goat biotinylated IgG (EMD Millipore, Billerica, Massachusetts) was used as the secondary antibody at a dilution of 1:200. For α-GST immunostaining, the slides were pretreated with 10% normal donkey serum before incubation with primary antibody. Rabbit polyclonal anti-rat α-GST (AML001; EFK Diagnostics, Cardiff, United Kingdom) was used as the primary antibody at a concentration of 4.9 μg/mL. Normal rabbit IgG (EMD Millipore) was used as a negative control to the primary antibody at a concentration of 4.9 μg/mL. Goat anti-rabbit biotinylated IgG (EMD Millipore) was used as the secondary antibody at a dilution of 1:2000. For RPA-1 immunostaining, the slides were pretreated with 10% normal donkey serum before incubation with primary antibody produced in goat. Mouse monoclonal anti-rat RPA-1 (AML006; EFK Diagnostics) was used as the primary antibody at a concentration of 11.7 μg/mL. Normal mouse IgG (Santa Cruz Biotechnology) was used as a negative control to the primary antibody at a concentration of 11.7 μg/mL. Goat anti-mouse biotinylated IgG (EMD Millipore) was used as the secondary antibody at a concentration of 1:2000. Immunostaining was visualized by VECTASTAIN Elite ABC Systems reagents (Vector Labs, Burlingame, California) and diaminobenzidine + Substrate Chromogen System reagents (DAKO) followed by counterstaining with hematoxylin.
Quantitative Image Analysis
Image (morphometric) analysis of positive KIM-1 immunostaining was performed using a Nikon E800 light microscope (Nikon, Melville, New York) equipped with Q imaging digital camera and Image Pro Plus 7.0 software (Media Cybermetrics, Bethesda, Maryland). The distribution and intensity of the staining were measured automatically using the area and intensity measurement features of Image Pro Plus 7.0 software. Measurements were performed under a 2× lens. The average of positively labeled area of immunostaining distribution per (mm2/section) of kidney (right and left) sections and intensity (integrated optical density/section) of immunostaining in both the kidneys were determined.
To quantify positive α-GST and RPA-1 immunostaining, the slides were scanned at 20× magnification using the NanoZoomer 2.0 HT Digital Pathology system scanner (Hamamatsu Photonics, Bridgewater, New Jersey). The distribution and intensity of immunostaining per kidney (right and left; mm2/section) were performed using the Visiopharm automated high-throughput image analysis system (Visiopharm, Broomfield, Colorado).
Image analysis numerical data were subjected to an unpaired t test that revealed significant positively labeled area/kidney in CCDP group animals when compared to controls as indicated by **P < .01 or *P < .05.
Statistical Analysis
Except where noted, otherwise, all means are presented as mean ± standard error of the mean; where applicable, fold-change from control is indicated. Clinical laboratory data were subjected to a 1-way analysis of variance (ANOVA) followed by a Bonferonni multiple comparison posttest if the ANOVA revealed statistical significance (P < .05). Statistical analysis was performed using GraphPad Prism software version 4.00 for Windows (GraphPad Software, San Diego, California).
Results
Traditional Serum and Urinary Parameters
Rats were administered a single ip injection of 0.9% saline or 1 mg/kg CDDP and necropsied at approximately 6 hours, 72 hours, 1 week, 1.5 weeks, 2 weeks, 3 weeks, or 4 weeks postdose (Table 1). There was no mortality in this study. The following serum and urinary parameters were significantly increased in the CDDP group: urinary glucose (2.8-fold above control, P < .001) at 72 hours postdose, urinary NAG (1.6-fold above control, P < .01) at 1 week (Table 2), and BUN (1.3-fold above control, P < .01) at 1.5 weeks (Table 3).
Changes in Traditional Urinalysis Parameters.a
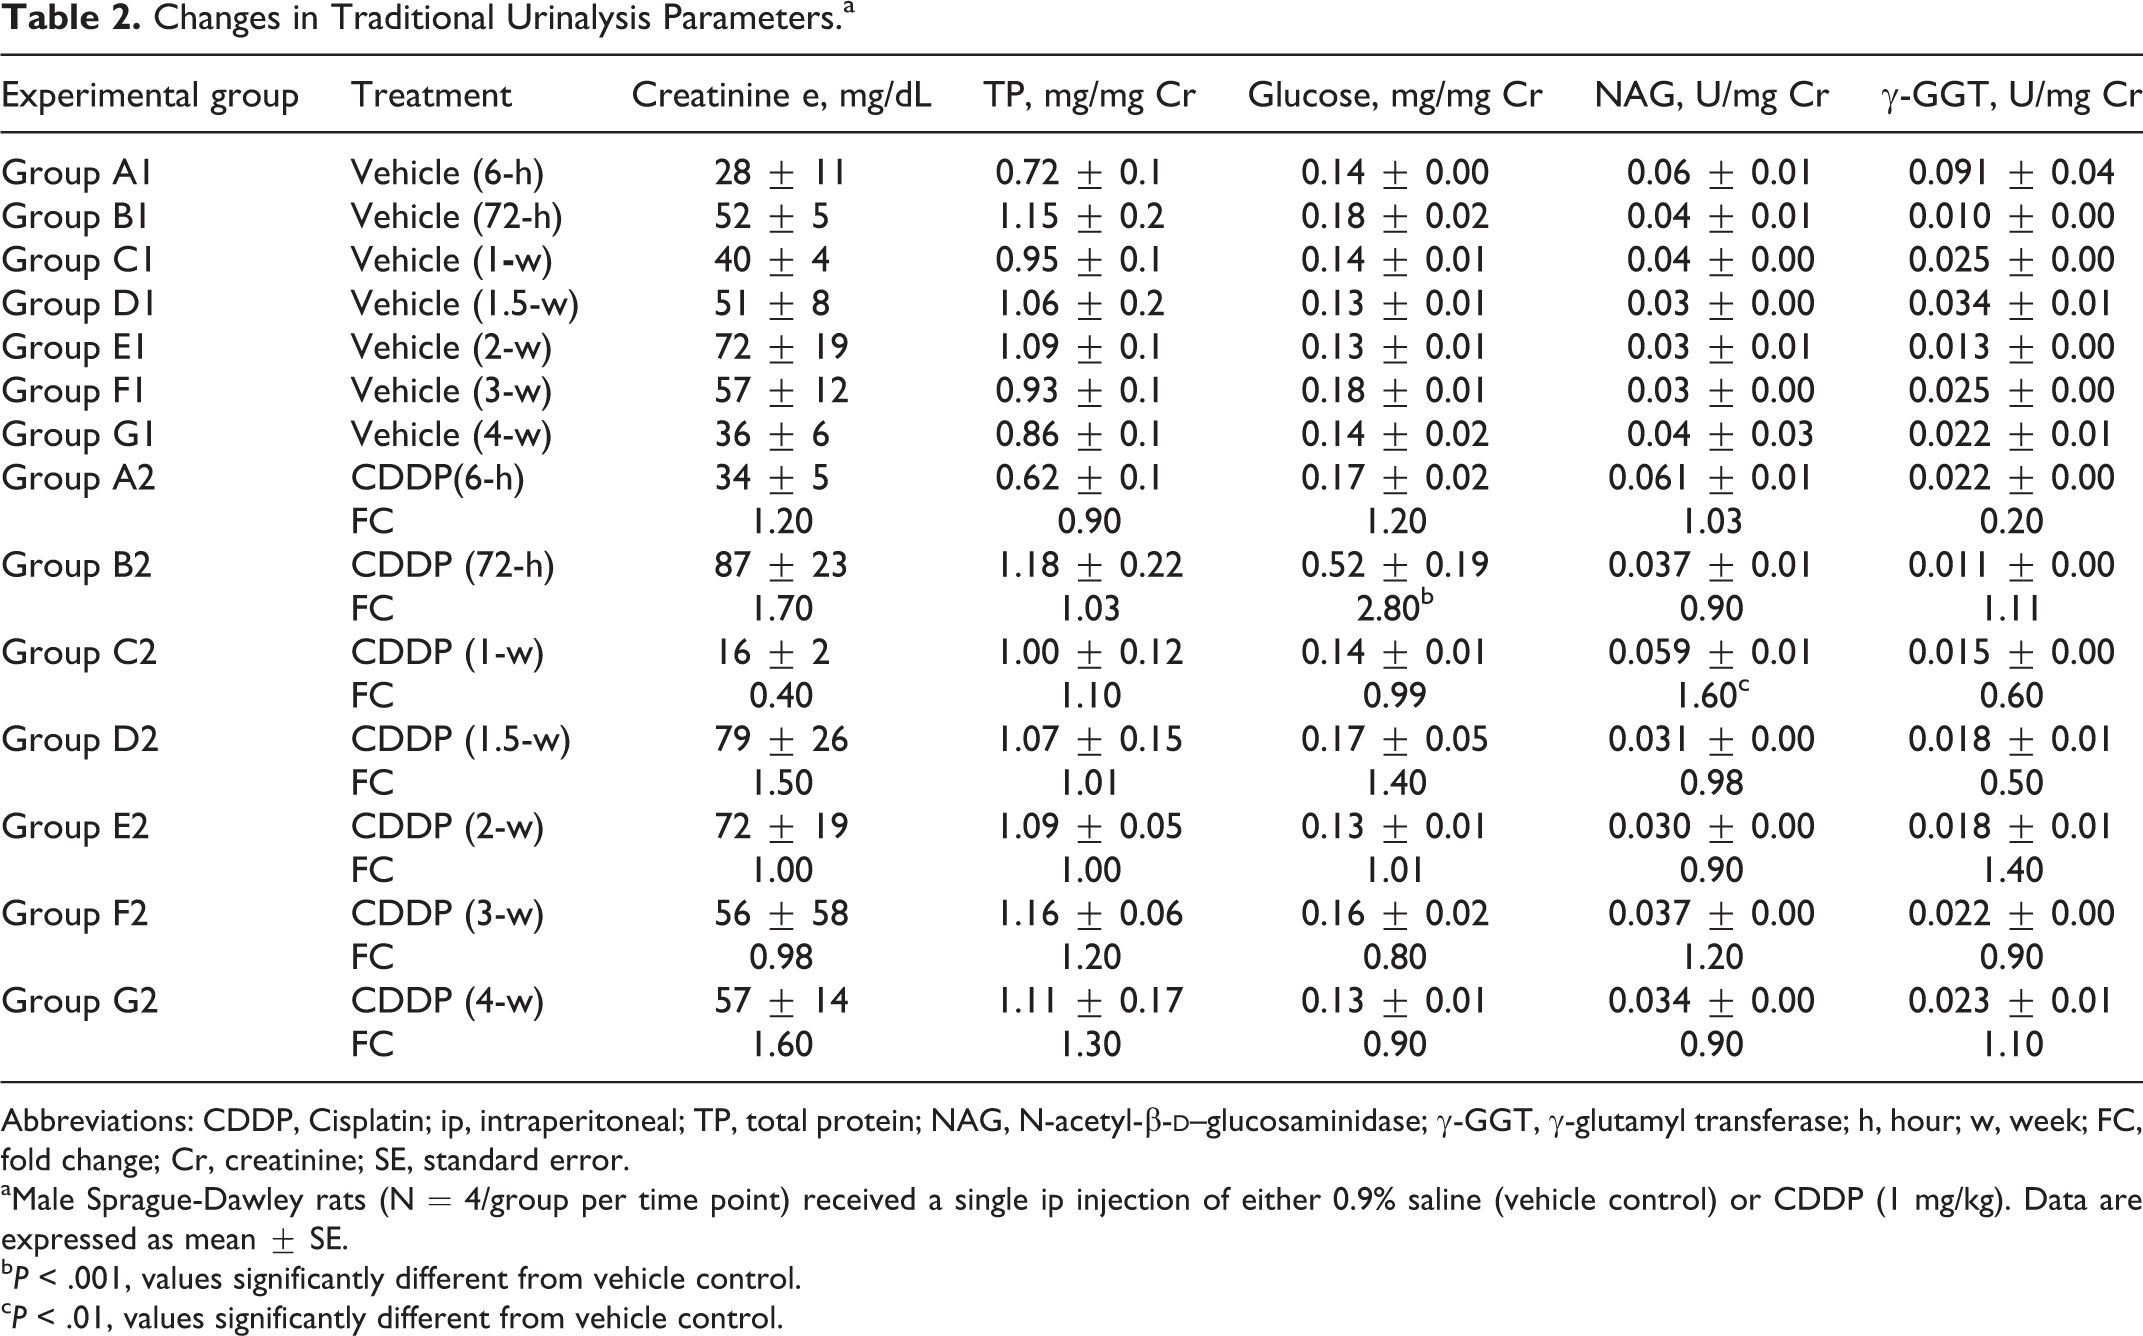
Abbreviations: CDDP, Cisplatin; ip, intraperitoneal; TP, total protein; NAG, N-acetyl-β-
aMale Sprague-Dawley rats (N = 4/group per time point) received a single ip injection of either 0.9% saline (vehicle control) or CDDP (1 mg/kg). Data are expressed as mean ± SE.
b P < .001, values significantly different from vehicle control.
c P < .01, values significantly different from vehicle control.
Changes in Traditional Serum Parameters.a
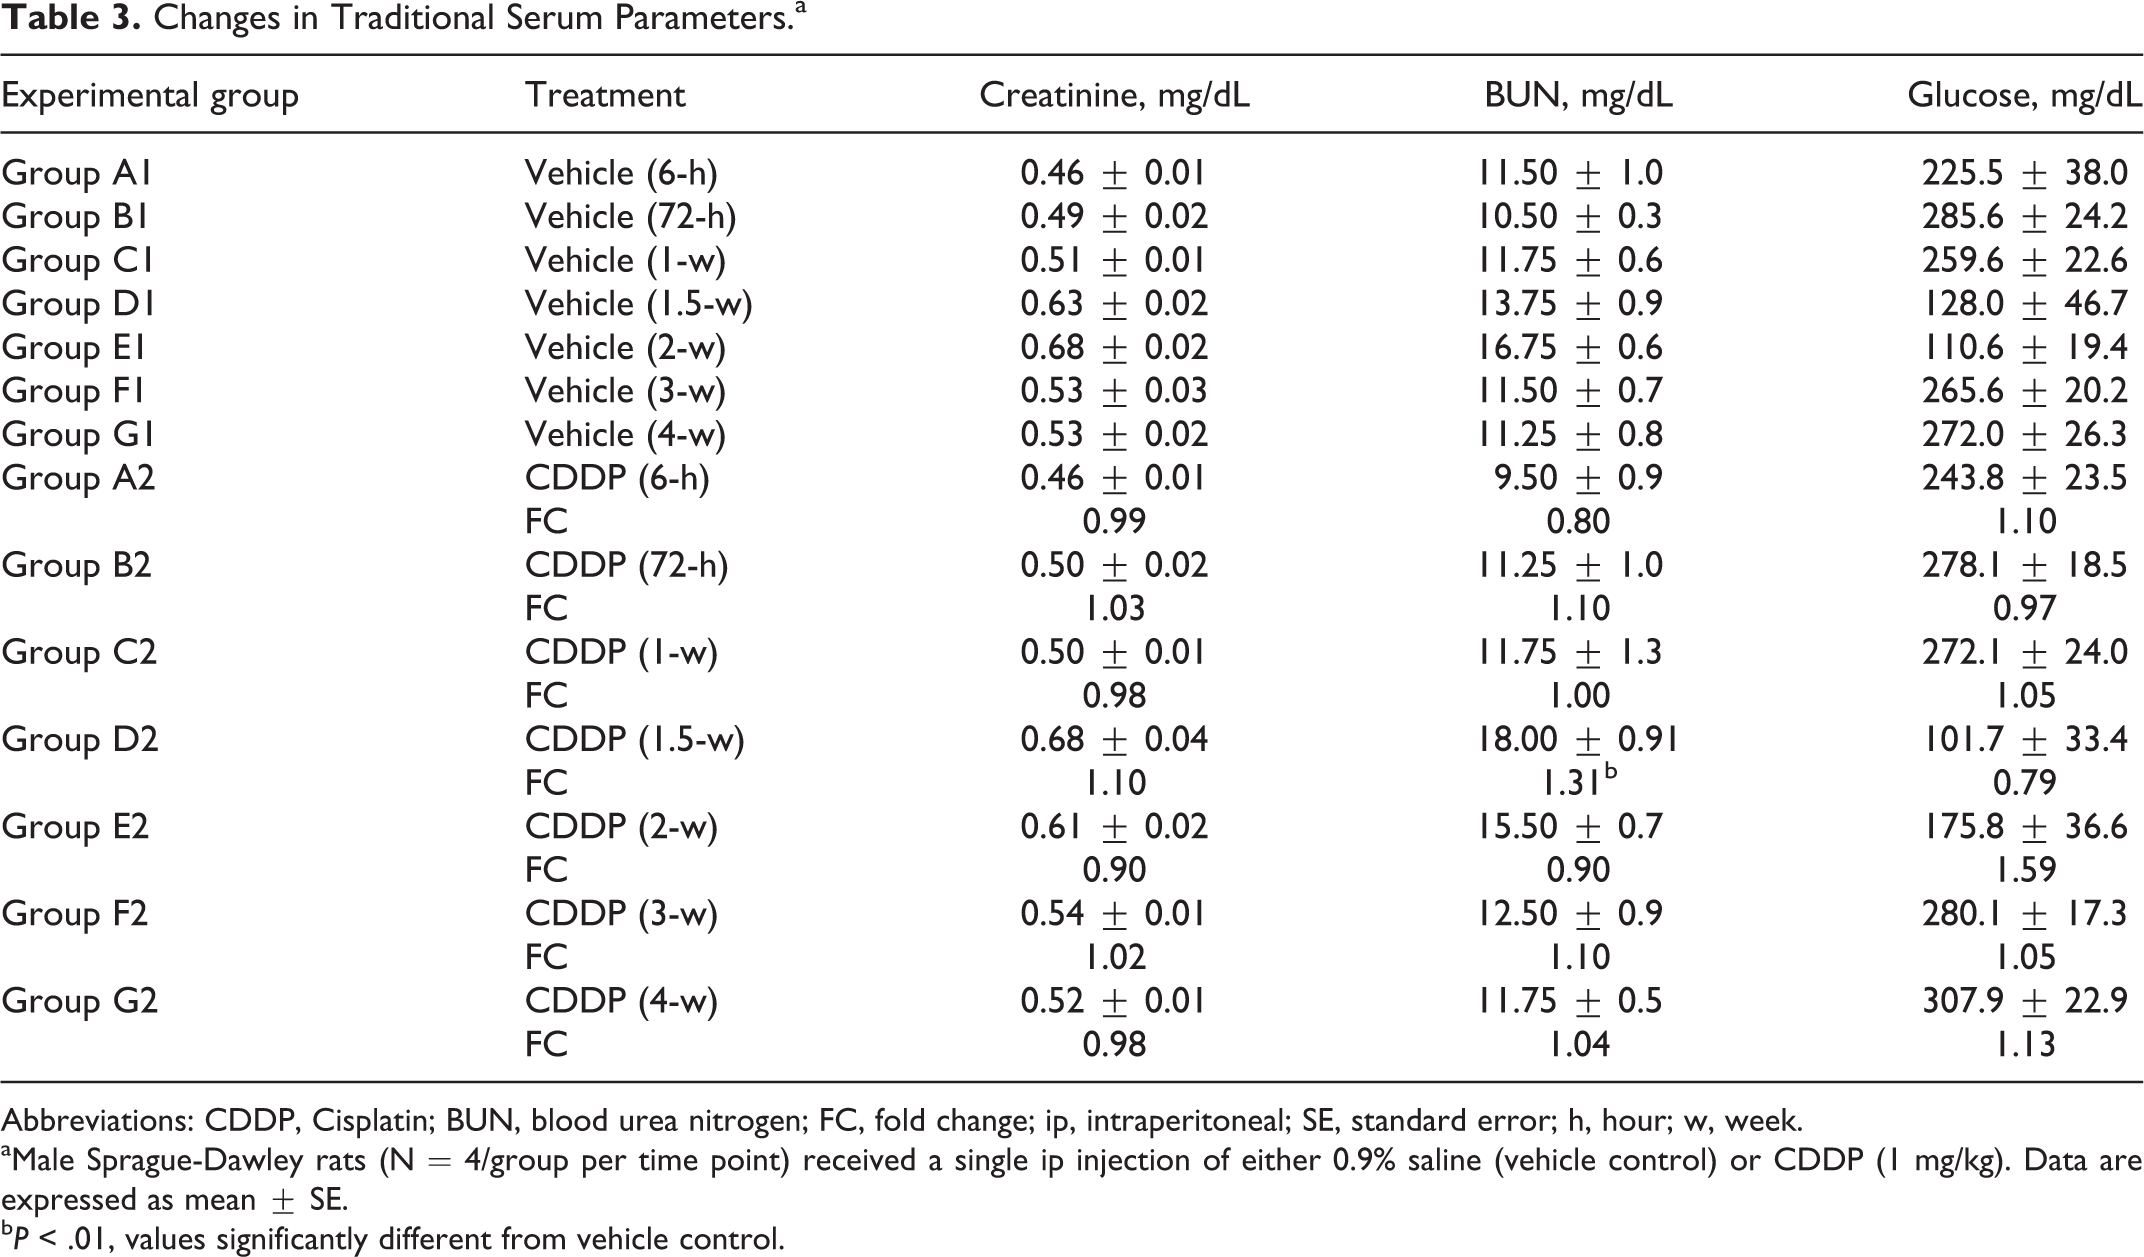
Abbreviations: CDDP, Cisplatin; BUN, blood urea nitrogen; FC, fold change; ip, intraperitoneal; SE, standard error; h, hour; w, week.
aMale Sprague-Dawley rats (N = 4/group per time point) received a single ip injection of either 0.9% saline (vehicle control) or CDDP (1 mg/kg). Data are expressed as mean ± SE.
b P < .01, values significantly different from vehicle control.
Novel Urinary Renal Biomarkers
In the CDDP group, urinary levels of α-GST were increased (11.6-fold above control group, P < .001) at 72 hours postdose; the levels were comparable to the control group at subsequent time points (Table 4). Urinary albumin levels were increased at 72 hours postdose (6.8-fold above control, P < .001); the levels remained slightly elevated at 1 week and returned to control levels thereafter (Table 5). Increased urinary KIM-1 was observed at 72 hours postdose (2.8-fold above control group, P < .001, Table 5), and increased urinary RPA-1 was observed at 1 week postdose (3.1-fold above control, P < .05, Table 5).
Changes in Urinary Levels of Selected Novel Renal Biomarkers.a
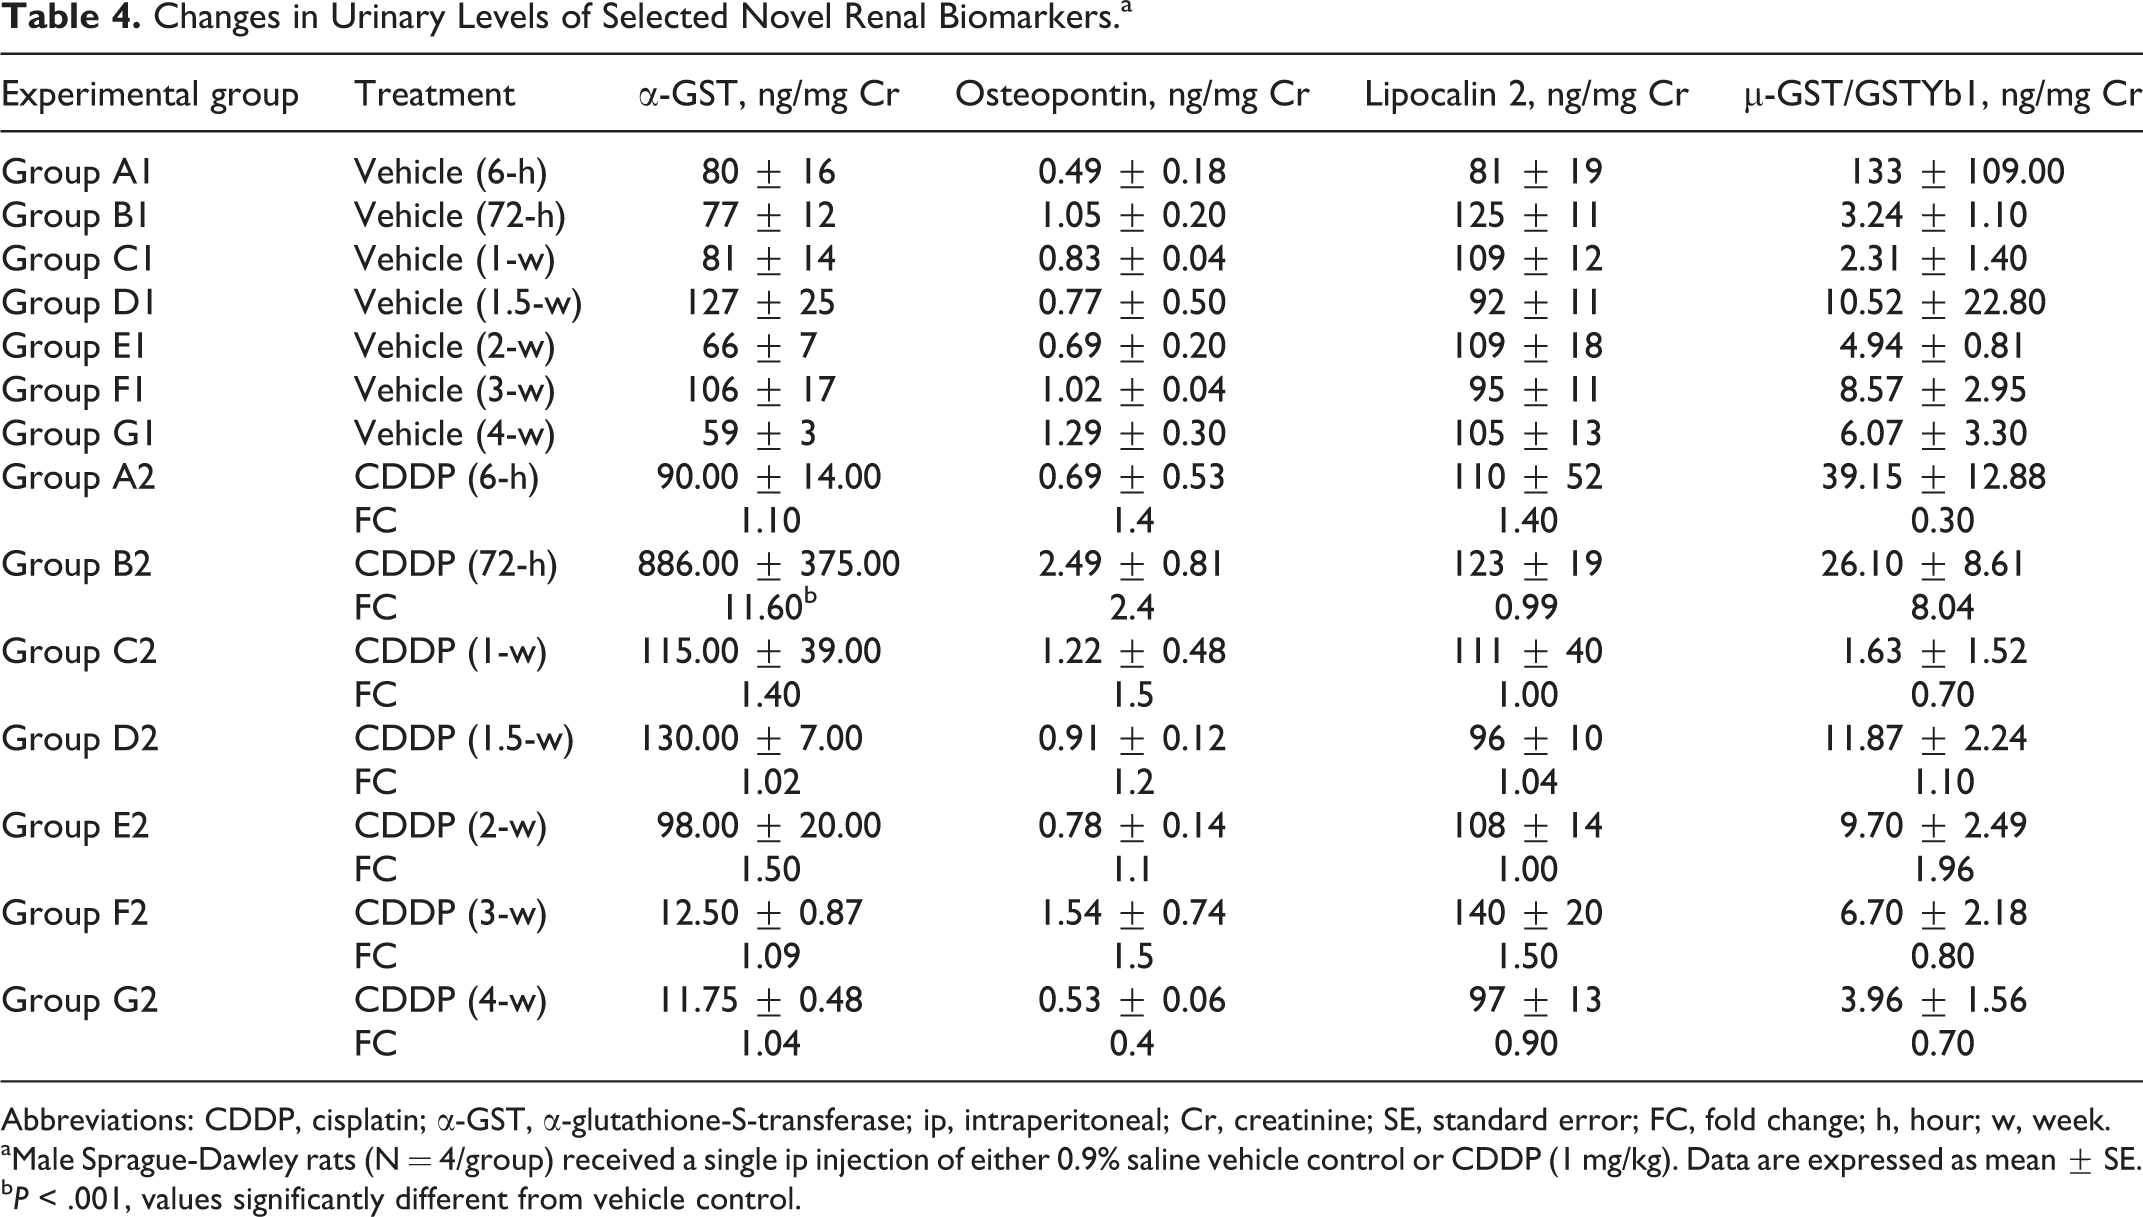
Abbreviations: CDDP, cisplatin; α-GST, α-glutathione-S-transferase; ip, intraperitoneal; Cr, creatinine; SE, standard error; FC, fold change; h, hour; w, week.
aMale Sprague-Dawley rats (N = 4/group) received a single ip injection of either 0.9% saline vehicle control or CDDP (1 mg/kg). Data are expressed as mean ± SE.
b P < .001, values significantly different from vehicle control.
Changes in Urinary Levels of Novel, Qualified Renal Biomarkers.a
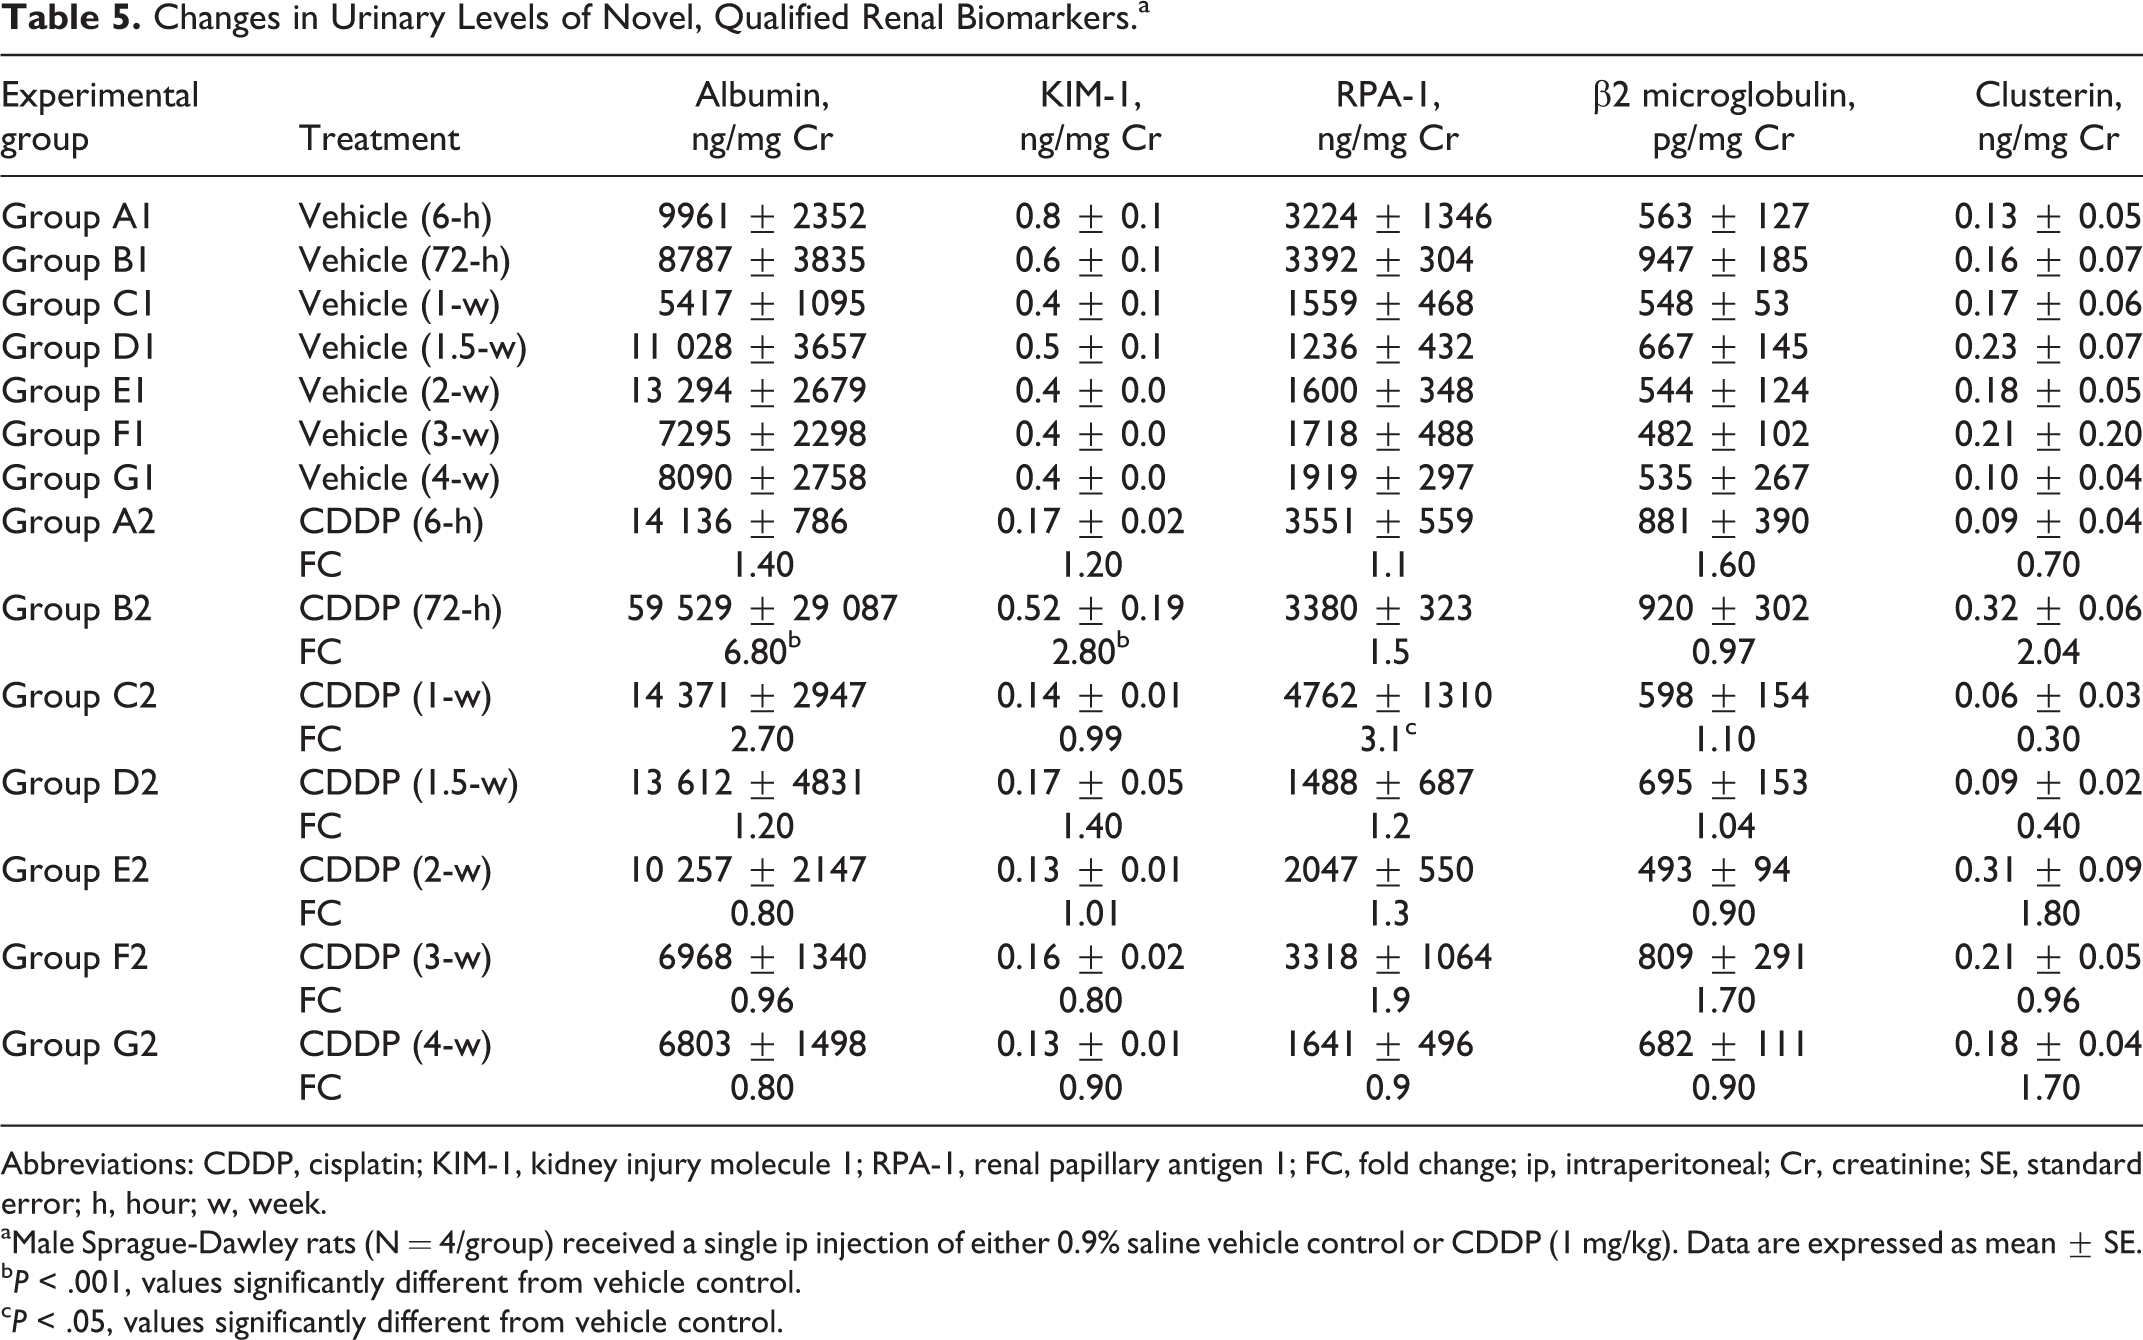
Abbreviations: CDDP, cisplatin; KIM-1, kidney injury molecule 1; RPA-1, renal papillary antigen 1; FC, fold change; ip, intraperitoneal; Cr, creatinine; SE, standard error; h, hour; w, week.
aMale Sprague-Dawley rats (N = 4/group) received a single ip injection of either 0.9% saline vehicle control or CDDP (1 mg/kg). Data are expressed as mean ± SE.
b P < .001, values significantly different from vehicle control.
c P < .05, values significantly different from vehicle control.
Histopathology
There were no histologic changes in the kidneys of CDDP group animals at 6 hours postdose (Table 6). By 72 hours postdose, AKI had developed in animals administered CDDP. Changes generally involved S3 segment of the proximal tubules and consisted of slight-to-mild tubular vacuolation, slight-to-moderate tubular degeneration, slight-to-mild tubular regeneration, and slight interstitial inflammation (Figure 1). Similar changes were observed in CDDP group animals at the 1, 1.5, and 2 weeks, but these changes were lower in incidence and severity (Table 6). With the exception of interstitial inflammation, histologic changes in the kidneys of CDDP group animals were not observed at 3 and 4 weeks.
Incidence of Renal Histopathology Changes in Rats Administered CDDP.a
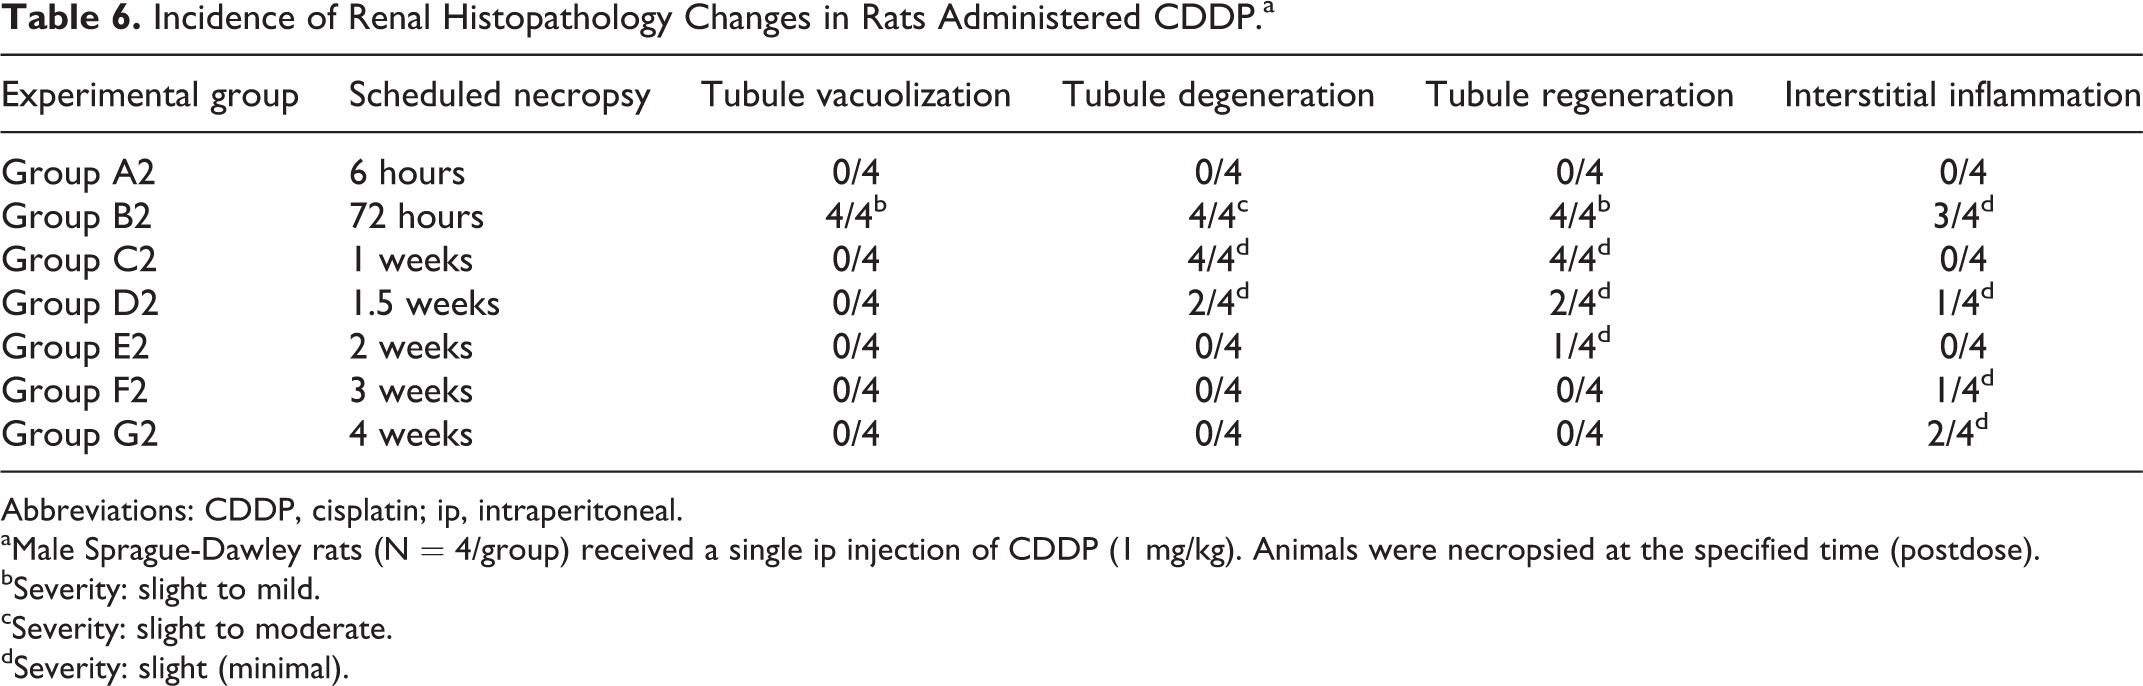
Abbreviations: CDDP, cisplatin; ip, intraperitoneal.
aMale Sprague-Dawley rats (N = 4/group) received a single ip injection of CDDP (1 mg/kg). Animals were necropsied at the specified time (postdose).
bSeverity: slight to mild.
cSeverity: slight to moderate.
dSeverity: slight (minimal).
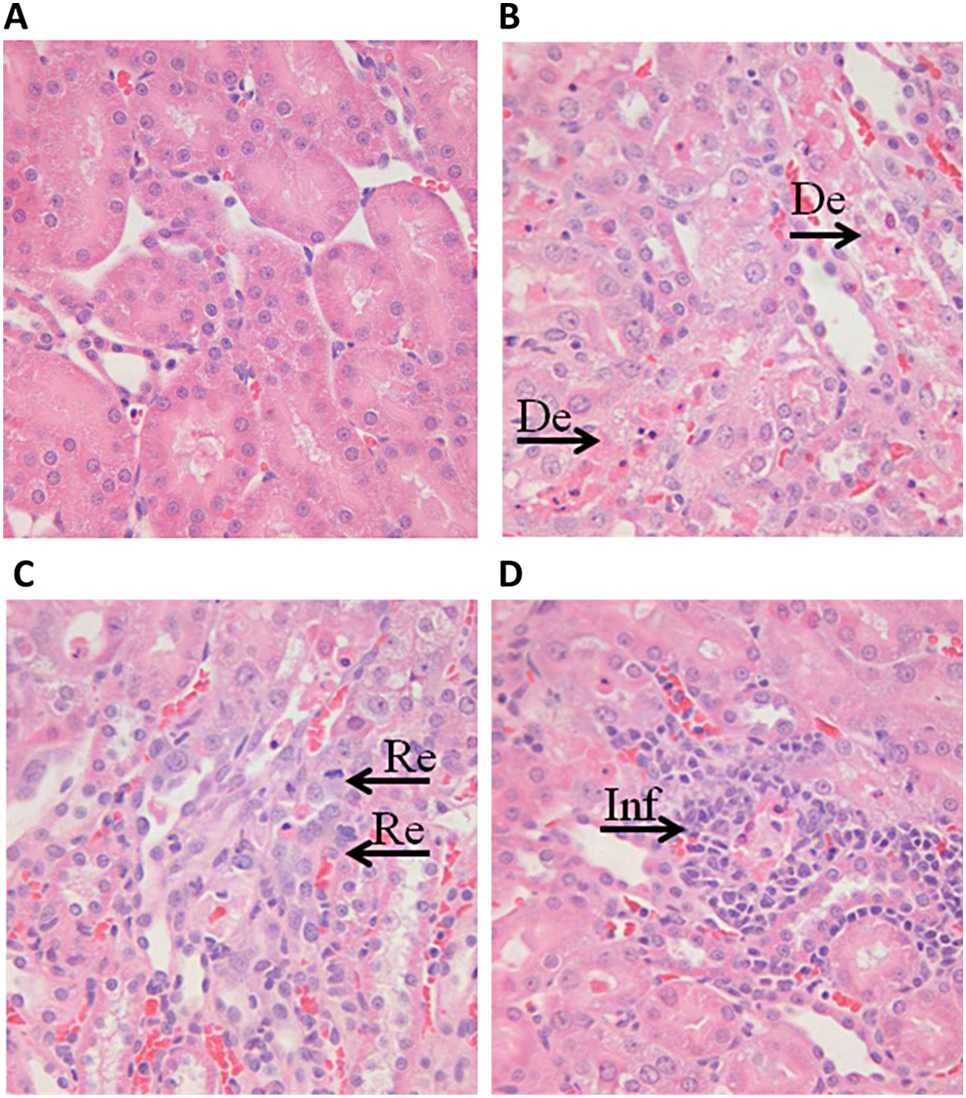
Representative photomicrographs of the left kidney from male Sprague-Dawley rats at 72 hours following single-dose administration of 0.9% saline (vehicle) or CDDP (1 mg/kg). There was no evidence of renal injury in vehicle control group rats (A). In CDDP group rats, changes in the S3 segment of the proximal tubule consisted of (B) degeneration (De, arrow), (C) regeneration (Re, arrow), (D) interstitial inflammation (Inf, arrow), and tubular vacuolization (not shown). ×400 magnification. CDDP indicates cisplatin.
Kidney Injury Molecule 1, α-GST, and RPA-1 Immunohistochemistry
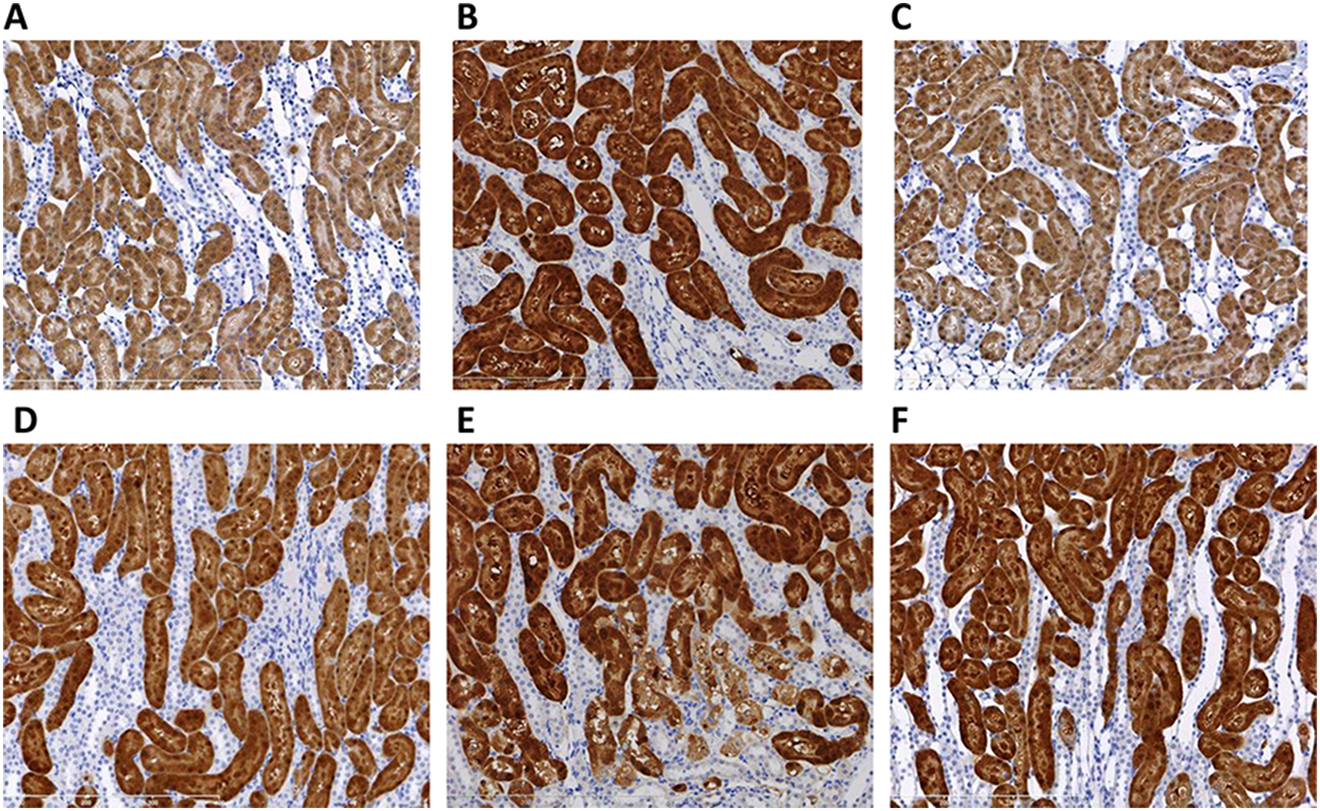
Immunostaining for KIM-1 was increased at 72 hours postdose in the kidneys of CDDP group animals (Figures 2 and 3); the increased KIM-1 expression was localized in the proximal tubular epithelial cells in the corticomedullary junction (Figure 2C). The CDDP group animals examined at subsequent time points showed progressively lower KIM-1 immunostaining (Figure 2D–F). The KIM-1 expression was absent in the control kidneys. Expression of α-GST was localized in the proximal tubular epithelial cells in the outer stripe of the outer medulla. Although slight increases in α-GST immunostaining was observed for CDDP group animals at some time points, the increases were less than 2-fold relative to controls, and interpretation is confounded by a relatively high level of α-GST expression in the kidneys of the control animals (Figures 4 and 5).
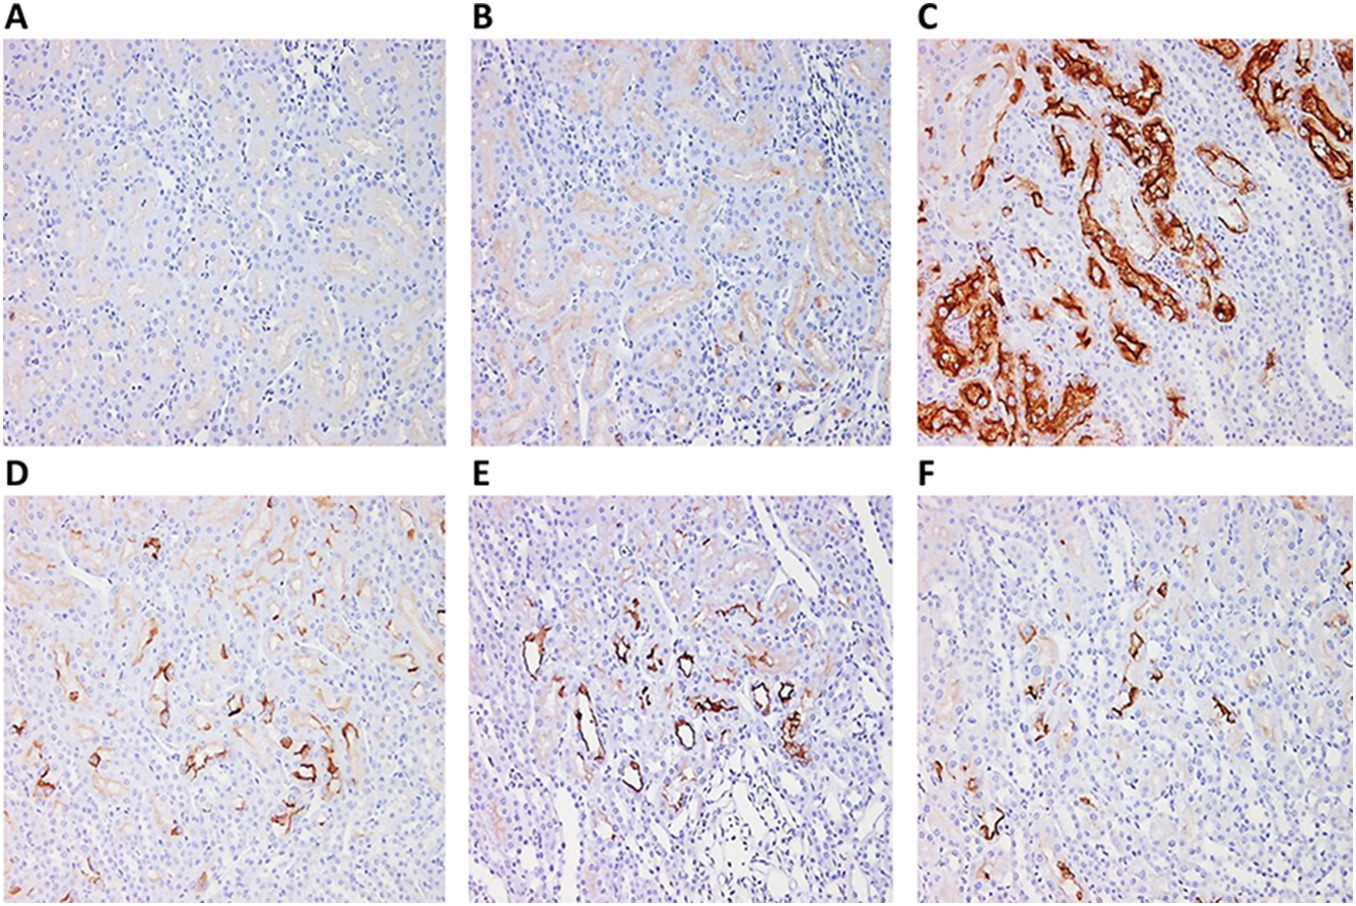
Representative photomicrographs of KIM-1 expression in the corticomedullary junction in left kidney from male Sprague-Dawley rats dosed with 0.9% saline (vehicle control [A]) or 1 mg/kg cisplatin (CDDP; B–F). Immunohistochemistry staining for KIM-1 protein expression in rats administered CDDP and sacrificed at 6 hours (B), 72 hours (C), 1 week (D) or 1.5 weeks (E), and 2 weeks (F) postdose showed decreased protein expression with time when compared to vehicle control group animals (A). ×100 magnification. KIM-1 indicates kidney injury molecule 1.
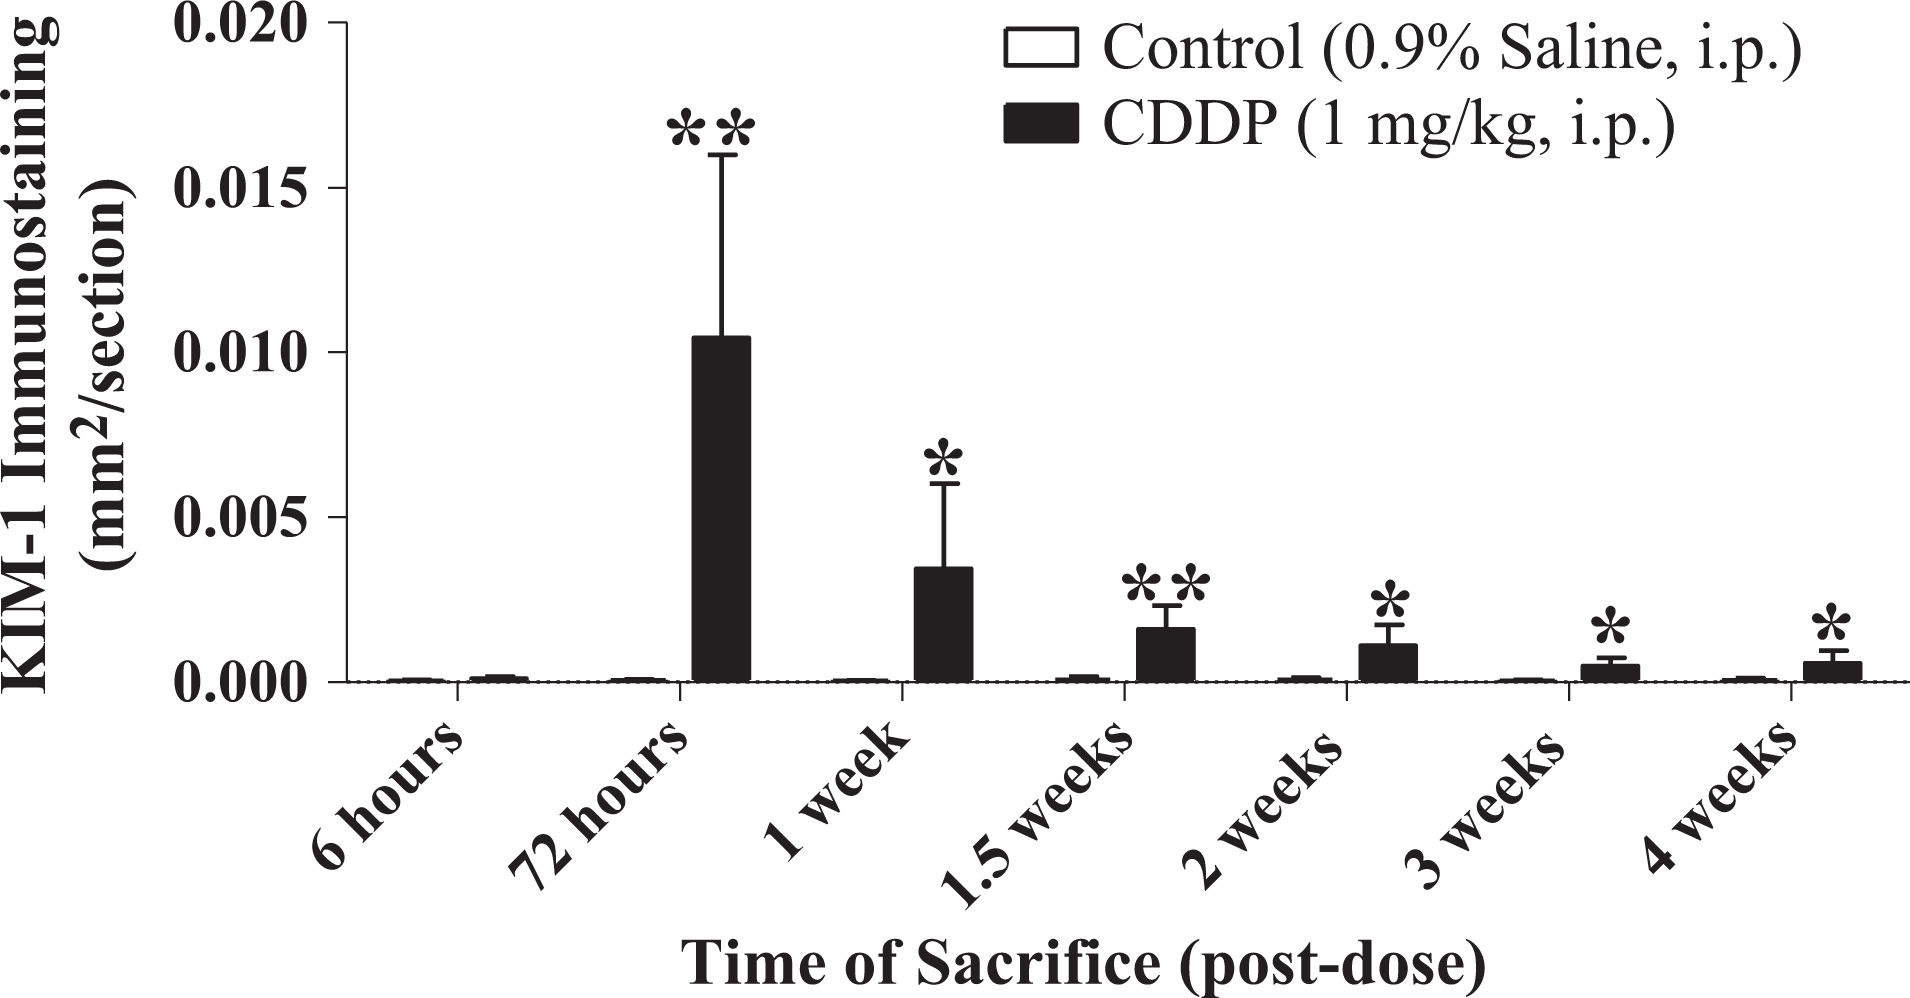
Temporal changes in renal kidney injury molecule 1 (KIM-1) immunostaining in male Sprague-Dawley rats administered 0.9% saline (vehicle) or 1 mg/kg cisplatin (CDDP) and sacrificed at various time points. Values significantly different from vehicle control are indicated as **P < .01 or *P < .05.
Representative photomicrographs of α-GST expression in left kidney from male Sprague-Dawley rats administered 0.9% saline (vehicle control (A–C]) or 1 mg/kg CDDP (D–F). Immunohistochemistry staining for α-GST was localized in the proximal tubular epithelial cells in the outer stripe of the outer medulla. Although slight increases in α-GST immunostaining was observed for CDDP group animals at 6 hours (D) and 3 weeks (F) postdose when compared to vehicle control group animals (A and C).
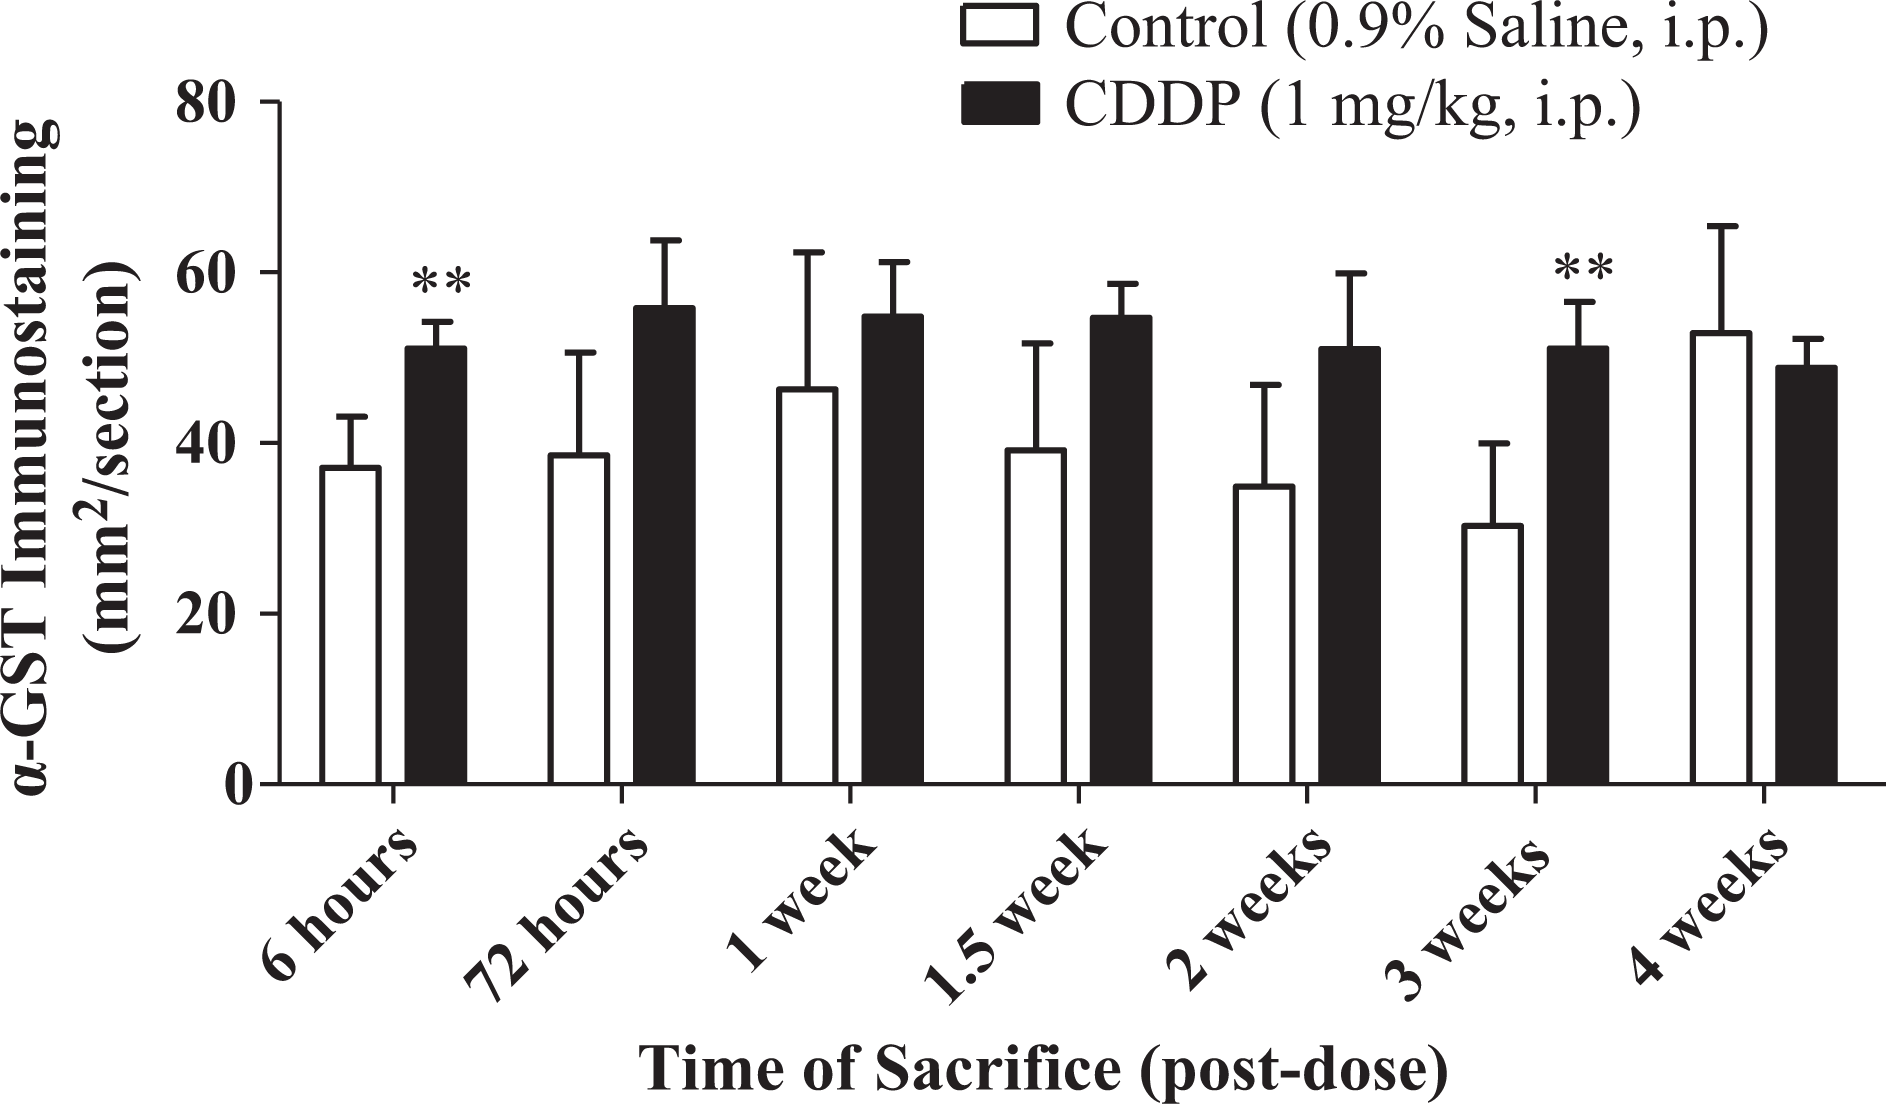
Time course of renal α-glutathione-S-transferase (α-GST) immunostaining in left and right kidney from male Sprague-Dawley rats administered 0.9% saline (vehicle) or 1 mg/kg cisplatin (CDDP) and sacrificed at various time points. Values significantly different from vehicle control are indicated as **P < .01.
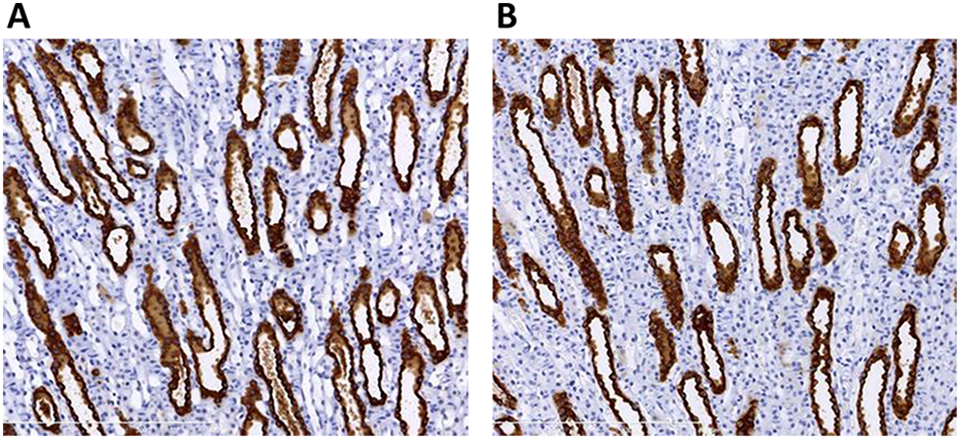
Representative photomicrographs of RPA-1 expression in left kidney from male Sprague-Dawley rats administered 0.9% saline (vehicle control [A]) or 1 mg/kg CDDP (B). Immunohistochemistry staining for RPA-1 protein expression in rats administered CDDP and sacrificed at 1 week postdose showed similar immunolabeling (B) localized in the epithelial cells of the renal papilla as when compared to vehicle control group animals (A). ×20 magnification. CDDP indicates cisplatin; RPA-1, renal papillary antigen 1.
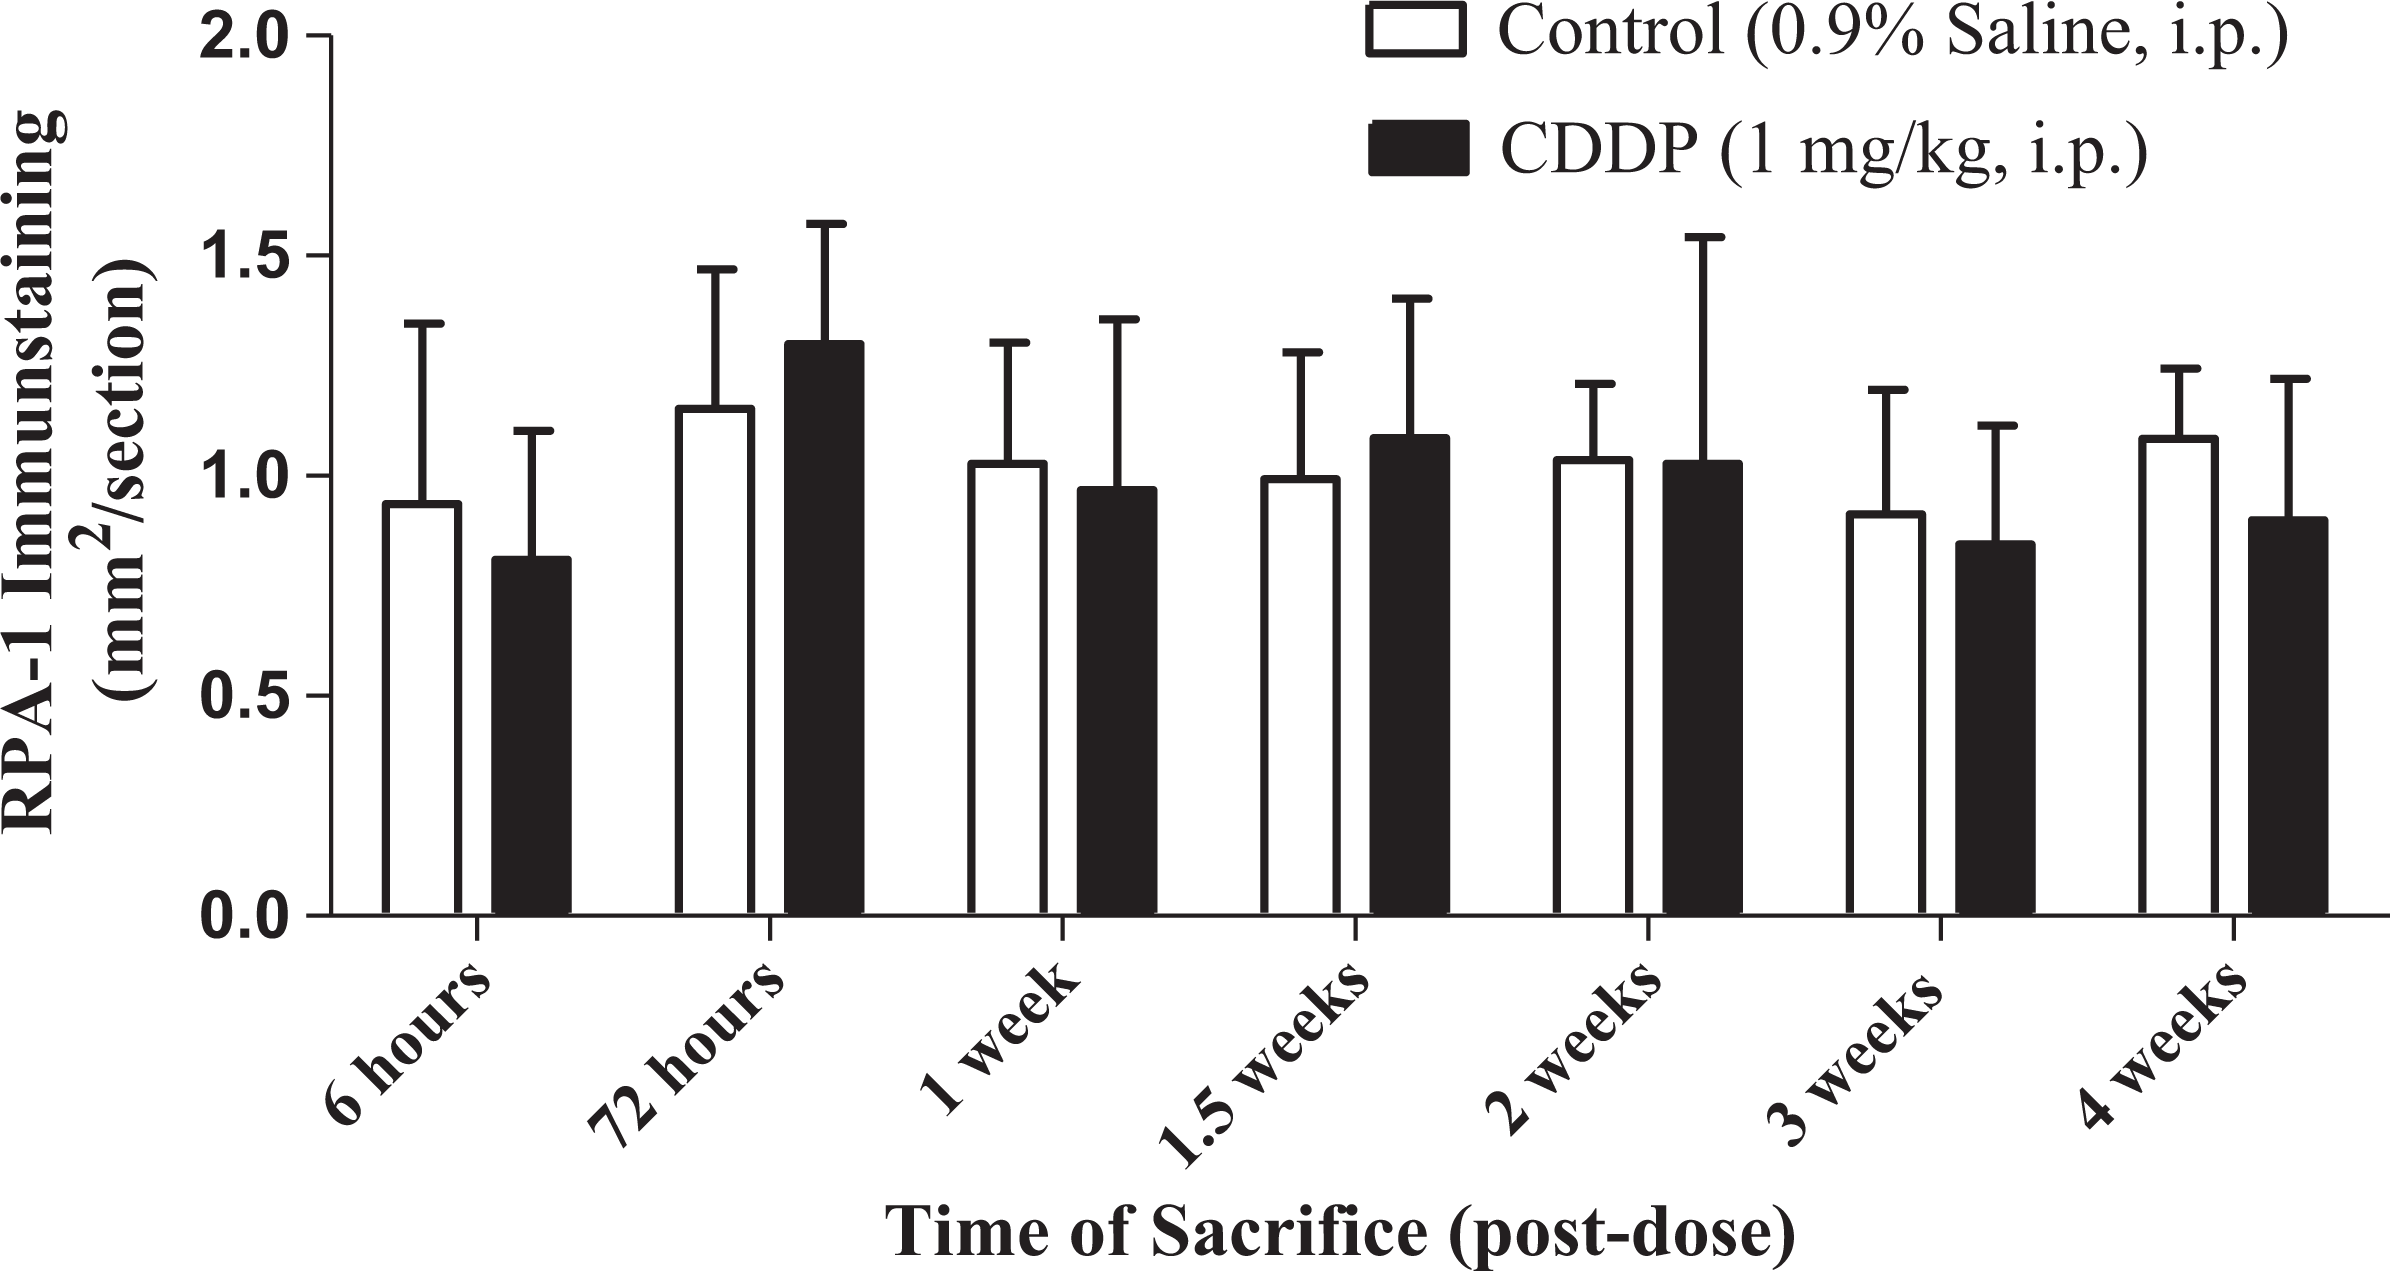
Time course of changes in renal papillary antigen 1 (RPA-1) immunostaining in left and right kidney from male Sprague-Dawley rats administered 0.9% saline (vehicle control) or 1 mg/kg cisplatin (CDDP) and sacrificed at various time points.
Discussion
Various traditional and novel renal biomarkers are available to monitor AKI. Because biomarkers vary in sensitivity and specificity, their ability to identify DIKI depends on the nature of the injury. The objective of this study was to evaluate the biomarkers for their ability to identify early, subclinical levels of DIKI characterized by histopathology findings in the absence of significantly elevated traditional renal biomarkers, specifically sCr and BUN. This study also compared the time course of biomarker changes with the onset, progression, and reversal of histologic changes. Current understandings relative to the pathophysiology, cellular uptake and metabolism, gene and protein expression profiles, and signaling pathways for CDDP nephrotoxicity have been reviewed previously. 5 In both preclinical and clinical settings, CDDP-induced proximal tubule dysfunction occurs between 48 and 72 hours postdose. In the previous studies in rats, sCr and BUN generally lacked sensitivity to identify early stages of CDDP nephrotoxicity, with sCr and BUN levels increasing only when renal histopathology severity scores were above grade 2. 6
In the present study, rats were administered either a single dose of CDDP (1 mg/kg, ip) or vehicle (0.9% saline, ip) and examined at 6 hours, 72 hours, 1, 1.5, 2, 3, and 4 weeks postdose. The CDDP-induced acute proximal tubule injury peaked at 72 hours postdose, when the injury was characterized histologically as slight-to-moderate degeneration, slight-to-moderate regeneration, slight-to-mild vacuolization, and slight interstitial inflammation in the S3 segment. At subsequent time points, similar changes were observed but at a lower incidence and/or severity indicating reversal of DIKI. The renal histopathological findings for the CDDP group animals are summarized in Table 6. There were no changes in the sCr levels at any time point and only marginally increased BUN levels at 1 time point, 1.5 weeks postdose which confirmed the unreliability of these traditional serum chemistry parameters for monitoring early, acute DIKI.
Of the various novel renal biomarkers examined relative to controls, increased urinary levels of KIM-1 and α-GST were observed at 72 hours postdose, increased urinary albumin at 72 hours and 1 week postdose, and urinary RPA-1 at 1 week postdose in the CDDP group animals. These findings support the use for noninvasively collected urinary albumin and urinary KIM-1 as qualified biomarkers that outperform sCr and/or BUN in diagnosing early, reversible DIKI in rats. 7 Urinary α-GST has not been qualified to date. Urinary RPA-1 has been previously qualified for detecting acute injury to the collecting ducts. 8
Increases in urinary KIM-1 correlated with increased KIM-1 immunostaining in the kidney. Constitutive KIM-1 is localized primarily in the pars recta (S3 segment) in the outer stripe of the outer medulla. 9 In the CDDP group animals, increased KIM 1 immunostaining was detected and localized to the proximal tubular epithelial cells in the corticomedullary junction. The onset of changes in renal KIM-1 expression levels occurred at 72 hours postdose, consistent with the occurrence of increased urinary KIM-1 and histologic changes observed with H&E staining. These findings were similar with those reported previously by Vinken et al. 10 At subsequent time points, the urinary KIM-1 levels returned to control levels, whereas increased KIM-1 immunostaining persisted up to 4 weeks. These data suggest that increases in urinary KIM-1 are transient in the absence of continued renal injury. In contrast, KIM-1 expression in renal tubular cells reverses more gradually.
In this study, increases in urinary α-GST at 72 hours postdose correlated with the onset of AKI in the CDDP group. These findings are consistent with those of Pinches et al, 11 where following single-dose administration of CDDP (1 mg/kg, ip) in male HAN Wistar rats, minor increase in urinary α-GST levels were noted at 120 hours postdose. In that study, the relative effects of 0.1 and 2.5 mg/kg CDDP on urinary α-GST levels were also evaluated at 72, 192, 360, and 528 hours postdose; and urinary α-GST levels were increased at both 72 and 120 hours postdose in the 2.5 mg/kg group and at 120 hours postdose in the 1 mg/kg group. The increased urinary α-GST levels were minor except in the 2.5 mg/kg group at 120 hours postdose, which indicated that the changes in urinary α-GST levels were both transient and dose dependent. The authors also indicated that constitutive α-GST immunostaining appeared uniform in the proximal tubules (S3 segment), while fragmented and heterogeneous immunostaining was observed in kidneys from animals in the 2.5 mg/kg group. In comparison to the early study reported by Pinches et al, 11 at each time point in this study, increased α-GST immunostaining in the male Sprague-Dawley CDDP (1 mg/kg) group was minor (<2-fold compared to the vehicle control group) in the presence of acute DIKI and confounded by the relatively diffuse and intense labeling in both control and treated animals. Taken together, early increased urinary levels of α-GST appeared as an indicator of proximal tubular leakage due to CDDP-induced acute structural damage, while no meaningful differences in α-GST immunolabeling were detected. Additional nephrotoxicity studies would be required to determine the use of this biomarker for monitoring DIKI reversal in rats.
Unlike KIM-1 and α–GST, which are expressed in the proximal tubules, RPA-1 expression is localized to the epithelial cells of the renal papillae in rats. 9,12,13 Therefore, RPA-1 is useful for detecting acute injury to the collecting ducts. 14 In the present study, there were no changes in immunostaining for RPA-1, which is consistent with localization of the CDDP-induced injury to the proximal tubules. Furthermore, urinary RPA-1 did not appear as a useful biomarker for identifying CDDP nephrotoxicity, because the extent of urinary RPA-1 increase was minor (∼3-fold) and occurred after the onset of DIKI, which was evident in proximal tubules only.
Urinary albumin levels were increased at 72 hours and 1 week postdose. Increases in urinary albumin could be due to impaired reabsorption of albumin by the proximal tubules. Ware et al 14 has shown that increased urinary albumin could also occur due to increased expression of the albumin gene. In this study, changes in gene expression profiles were not assessed; therefore, the etiology of the increased albumin is unknown.
Conclusion
Changes in renal histopathology findings and concurrent renal biomarkers expression profiles in serum and urine observed during a 4-week postdose period following single ip administration of CDDP (1 mg/kg) or 0.9% saline have been summarized (see Table 7). In conclusion, changes in urinary levels of albumin, KIM-1, and α-GST correlated with the progression of early proximal tubule injury following CDDP administration to rats. Urinary levels of albumin, KIM-1, and α-GST outperformed other biomarkers at correlating with the time of maximum histologic injury and returned to the baseline consistent with the reversal of CDDP-induced DIKI. For KIM-1, increased urinary levels were related to changes in KIM-1 expression in the proximal tubule. Because no meaningful increase in α-GST labeling was detected relative to the already high background expression, increased urinary α-GST levels likely resulted from leakage from structural damage to the cells. Changes in urinary albumin could be due to impaired reabsorption in the proximal tubules but could also relate to possible changes in gene expression. Although the etiologies for the increased albumin, KIM-1, and α-GST differed, all 3 of these urinary biomarkers showed greater sensitivity and specificity for identifying proximal tubule injury compared to other biomarkers including sCr and BUN.
Changes in Renal Histopathology and Concurrent Biomarkers in Rats.a
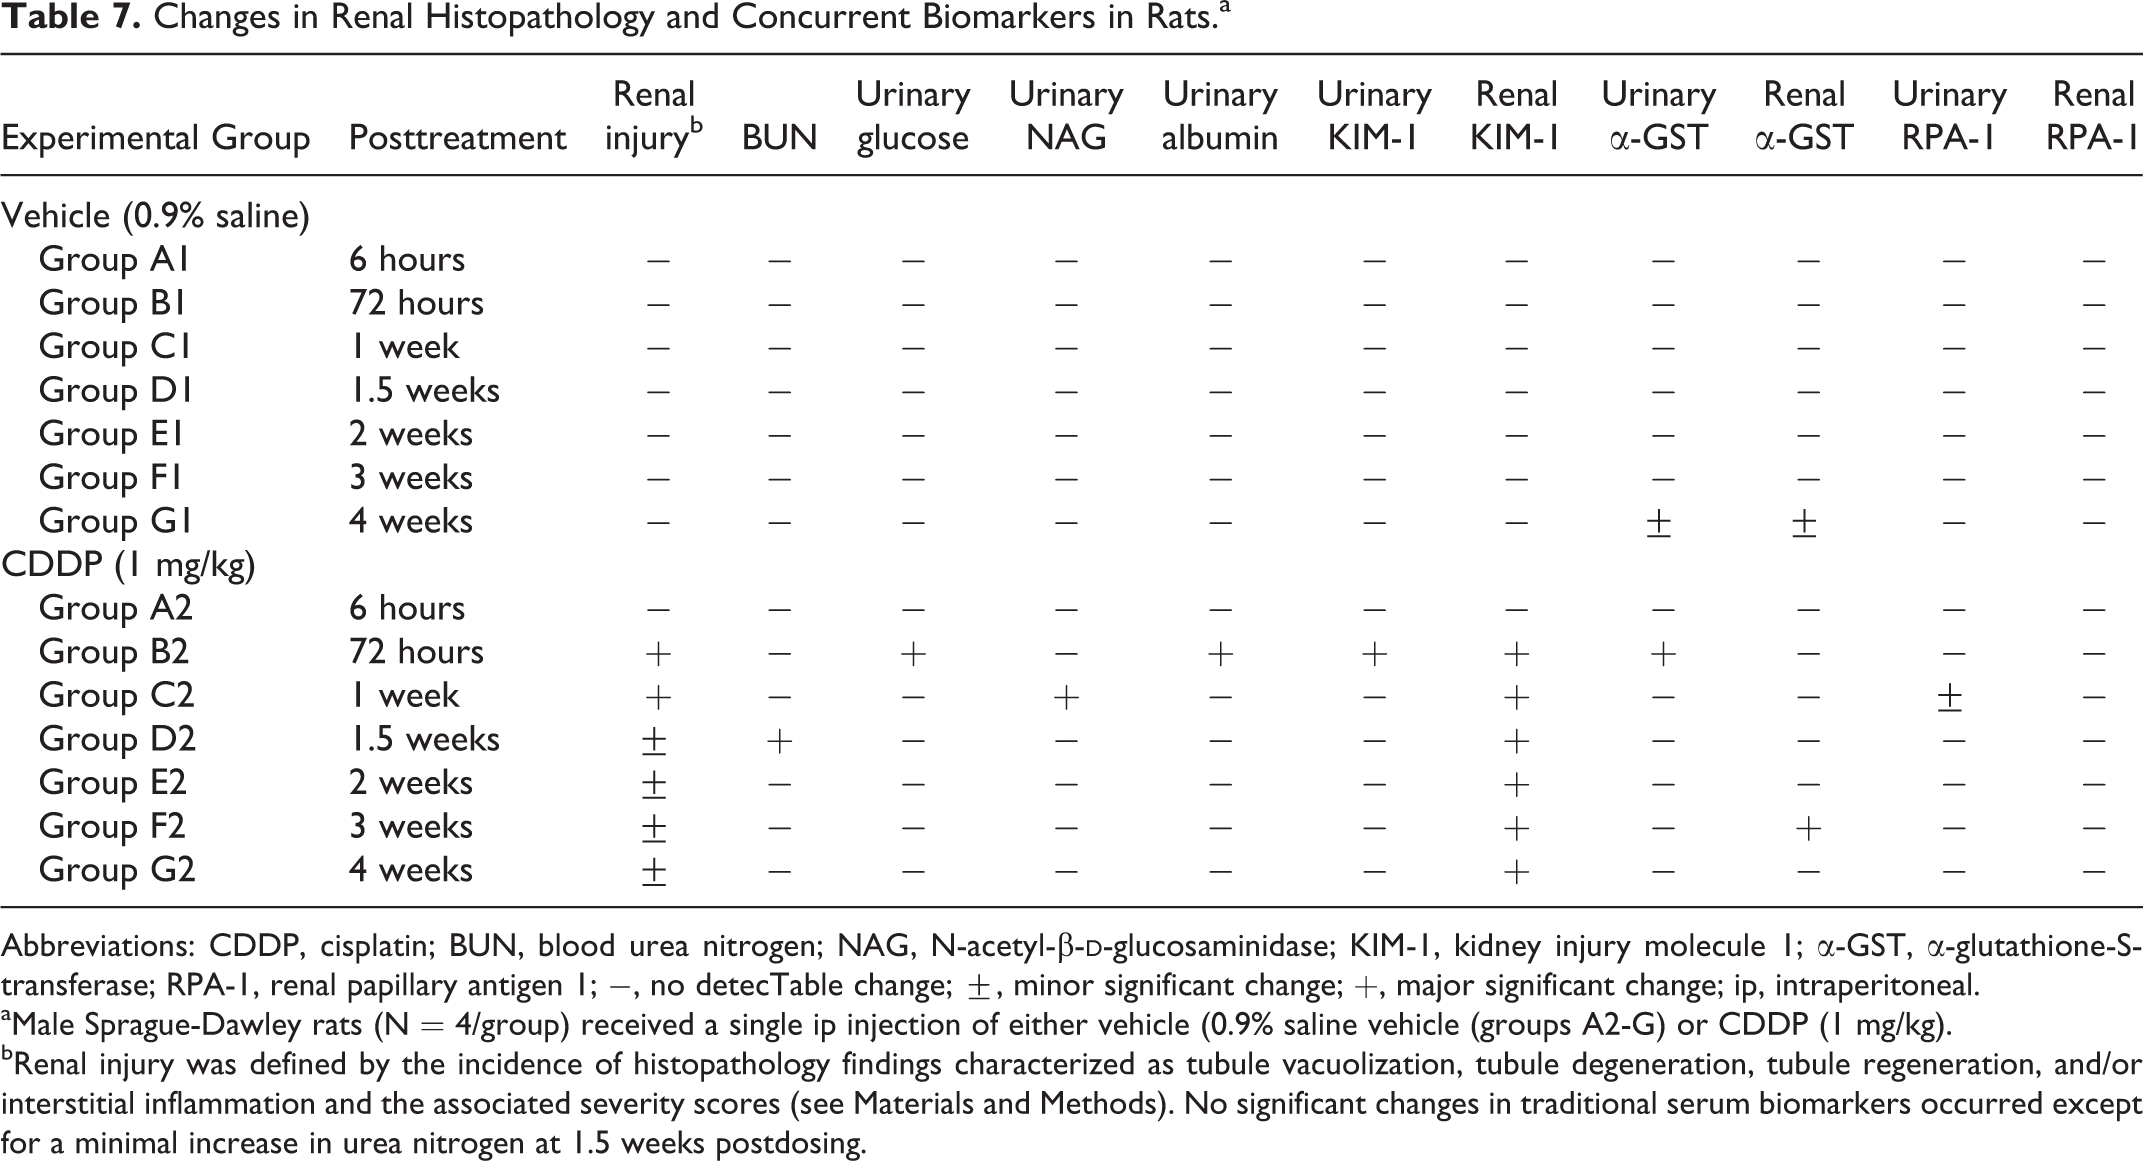
Abbreviations: CDDP, cisplatin; BUN, blood urea nitrogen; NAG, N-acetyl-β-
aMale Sprague-Dawley rats (N = 4/group) received a single ip injection of either vehicle (0.9% saline vehicle (groups A2-G) or CDDP (1 mg/kg).
bRenal injury was defined by the incidence of histopathology findings characterized as tubule vacuolization, tubule degeneration, tubule regeneration, and/or interstitial inflammation and the associated severity scores (see Materials and Methods). No significant changes in traditional serum biomarkers occurred except for a minimal increase in urea nitrogen at 1.5 weeks postdosing.
Footnotes
Acknowledgments
We would like to thank the Renal Integrated Safety Assessment (ISA) team and the Safety Biomarkers Center of Excellence (COE) within Janssen Research & Development, LLC for their support of this research.
Declaration of Conflicting Interests
The author(s) declared no potential conflicts of interest with respect to the research, authorship, and/or publication of this article.
Funding
The author(s) disclosed receipt of the following financial support for the research, authorship, and/or publication of this article: This work was solely funded by Janssen Research & Development, LLC.