
Abstract
Histological examination of the rat placenta and fetus is uncommon. Toxicological studies mainly rely on gross examination of the fetus and on fetal and placental weights. These are often insufficient to assess the fetal and placental toxicity of xenobiotics. The small size of the fetus makes its dissection labor-intensive. Thus, our objective was to develop a simple and accurate technique to evaluate the rat fetus and placenta. Sprague-Dawley rat fetuses at gestational day 19.5 (n = 18) and their placentas (n = 32) were fixed in formalin. Placentas were cut transversally in the center. Fetuses were cut following a freehand whole-body serial sectioning diagram adapted from Wilson’s method. Sections were stained with hematoxylin–eosin–phloxine–saffron, and histomorphometry was used to measure the area of the fetal placental region (27.2 ± 1.7 mm2), including the labyrinth (22.2 ± 1.0 mm2) and the basal zone (4.8 ± 0.8 mm2). Our whole-fetus serial sectioning technique resulted in 12 precise cutting planes that fit on 3 histological slides, enabling the examination of most organs without labor-intensive dissection. Quantitative analysis of placental areas improves the understanding of the pathogenesis of treatment-related changes. This technique provides a standardized method for future research in pertinent fields such as developmental biology and toxicology.
Introduction
Although the rat model is often used in toxicological, developmental, and reproductive studies, complete histological examination of the placenta and fetus is rarely performed. If the interest is on the placenta or the fetus, its counterpart is rarely examined as rigorously. However, since the placenta and the fetus share a developmental connection, neglecting one when studying the other may provide incomplete data and lead to an erroneous conclusion. The placenta is a unique temporary organ vital for the development of eutherian mammals, and it exhibits different morphologies, organization, and vascularization depending on the species. The placenta plays many roles, including endocrine, nutritional, and barrier functions, and also becomes a target for drug- or chemical-induced adverse effects (Furukawa et al. 2011). Placental weight can be used to assess placental toxicity, but this measurement does not necessarily provide valuable information on the potential pathogenesis of the treatment-related changes. Furthermore, fetal evaluation, in most toxicology studies, relies on gross examination of the whole fetus, while individual dissection of each organ is done in older animals prior to histopathologic examination. However, because of their very small size, dissection of fetuses is labor-intensive and hence not an optimal approach. Vital information can be obtained from histological examination of the placenta and fetus that could be useful in the overall safety assessment of pharmaceuticals in developmental toxicology studies. Therefore, we adapted a whole-fetus cutting schematic based on the subgross evaluation diagram by Wilson (1965).
Knowledge of normal tissue histomorphology of the fetal rat is scant. Since being familiar with the characteristics of normal fetal and placenta development is essential to recognize the effects of treatment, it is necessary to fully characterize these tissues in a normal state.
The main objectives herein are to describe the detailed qualitative and quantitative methodology that was developed to analyze fetal and placental histopathology and to present the histologic anatomy of the rat placenta and fetus at gestational day 19.5 (GD 19.5). This time point is very close to birth and hence is more closely representative of newborn rats while avoiding loss of animals for examination following potential cannibalism by the mother, which occurs with a higher frequency in abnormal or weak offspring.
Material and Method
Animal Handling and Care
All animal experiments were approved by the Laval University Animal Welfare Committee, in accordance with the Canadian Council on Animal Care (Rowsell 1991). Females Sprague-Dawley rats (aged 45 days and weighing 140–180 g) were purchased from Charles River Laboratories (Saint Constant, Quebec, Canada). After 10 days of acclimation, the female rats were mated overnight by pairing with males (aged 90 days and weighing 200–240 g), and confirmation of mating was done in the morning by evaluation of vaginal smear (presence of sperm in the vaginal smear = GD 0.5). Pregnant females were housed individually in standard rat cages under controlled lighting (12-hr light–dark cycle), humidity (50%), and temperature (22°C). They had access ad libitum to food (Dyets #110700, AIN-93G) and tap water. On the morning of GD 19.5, females were anesthetized with 3% isoflurane and euthanized in a CO2 chamber. Placentas and fetuses were collected, weighed (n = 98), sexed, and then fixed whole (n = 32 for placentas and n = 18 for fetuses) in neutral buffered 10% formalin for a week. Fetuses were decalcified in Decalcifier II (Leica Biosystems Canada, Winnipeg, Canada) for 24 hr before manual sectioning.
Embedding and Freehand Scalpel Blade Sections of Placentas and Fetuses
After fixation, placentas were sliced transversally through their center with a scalpel and fetuses were cut with a scalpel following a freehand whole-body serial sectioning schematic adapted from Wilson (1965), who used multiple 1-mm thick sections throughout the fetus and presented photomicrographs of the macroscopic observations, whereas the method presented herein is based on sections at anatomical hallmarks and hence implies less sectioning (Figure 1). The fetuses were sectioned caudally to the anatomic region of interest and embedded with the caudal surface down in the cassette, to ensure that the region of interest is shown on the slides. The slides were stained with hematoxylin–eosin–phloxine–saffron (HEPS).
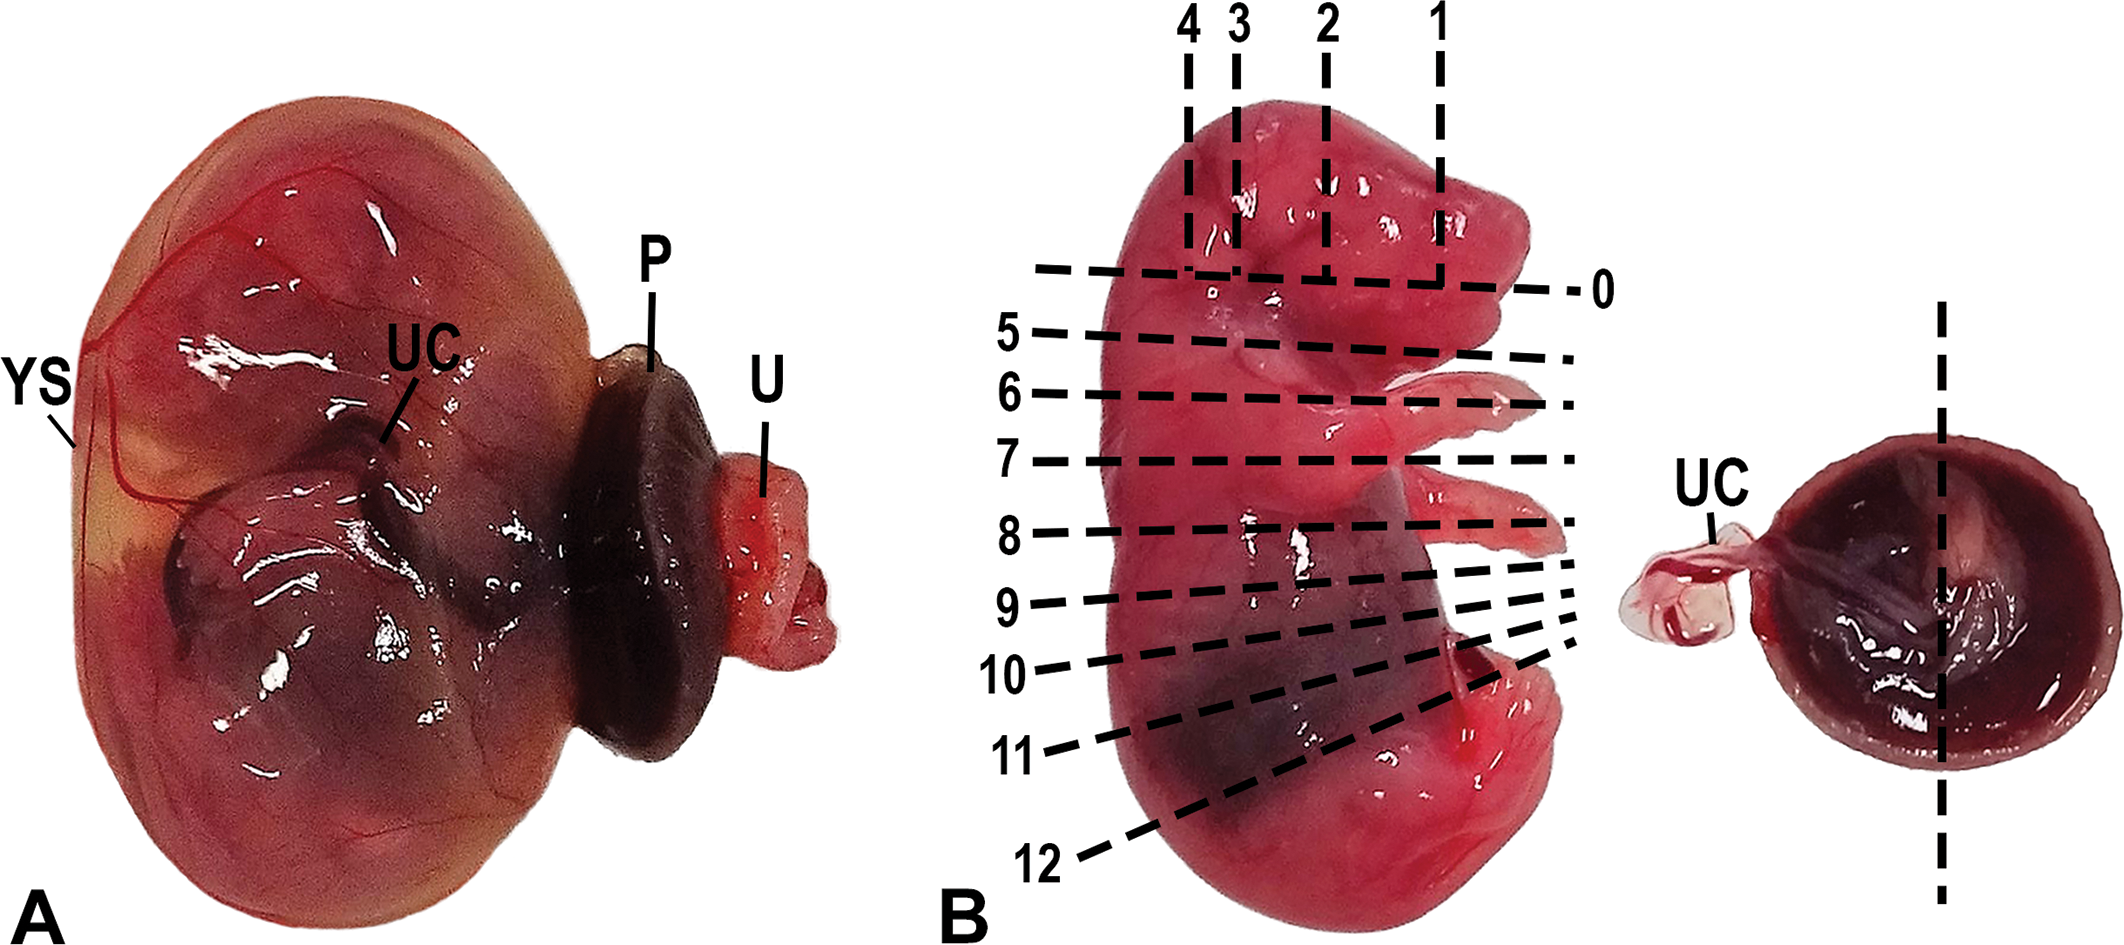
Photograph of the fetus and its placenta at gestational day 19.5. (A) Fetus after removal from the uterus. Note the extensive vascularization of the yolk sac (choriovitelline placenta), which acts as a transient placenta in the early stage of the gestation. YS = yolk sac; P = placenta; UC = umbilical cord; U = uterine wall (contains the metrial gland). (B) Freehand whole-body serial sectioning scheme representing the 13 transversal cuts (0–12) through the fetus and the fetal side of a placenta with its umbilical cord. The first cut (no. 0) served only to separate the top of the head to obtain the brain and does not yield a section per se. The placenta was cut along its center as represented by the dotted line.
Placental Histomorphometry
Placental data were collected using a Nikon eclipse Ni-E light microscope with a Nikon DS-Qi2 camera, and computer image analysis was done using Nikon NIS-Elements AR microscope imaging software version 4.30.02. The junctional and labyrinth zones were identified by comparing the different cells present based on the histological staining. The basal zone was defined as the area of the placenta consisting of spongiotrophoblast cells, which were identified as pale pink cells, with a large nucleus and with HEPS staining. The labyrinth zone conversely was defined as consisting primarily of branching trophoblast cells, which were identified as dark pink. The basal zone was measured, followed by the total area of the fetal placenta, and the labyrinth was calculated by subtracting the former from the latter.
Results and Discussion
The Rat Placenta
Early after implantation, the yolk sac, a fetal membrane also called the choriovitelline placenta, acts as a transient placenta during the development of the definitive chorioallantoic discoid placenta. A characteristic of the rodent yolk sac is that it persists until term and continues to transport nutrients through the yolk sac circulation (Figure 1). At midgestation, the definitive chorioallantoic placenta becomes fully functional and grows continuously, up until the last few days before birth, where the placental weight remains stable (Cline et al. 2014). The definitive placenta is then able to support the exponential fetal growth that occurs in the last days of gestation. The average weight of normal Sprague-Dawley rat fetuses and placentas that were analyzed at GD 19.5 is in Table 1, together with the placental:fetal weight ratio, which is considered an indicator of placental efficiency.
Placental and Fetal Weights from Gestational Day 19.5 Rats (Mean ± SD).
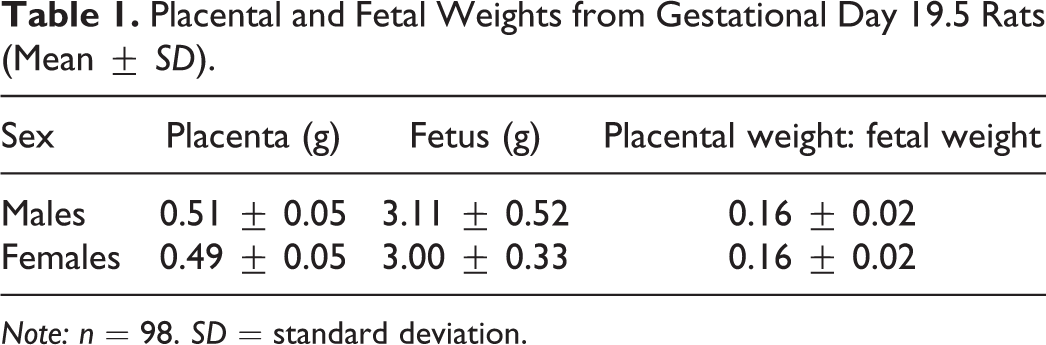
Note: n = 98. SD = standard deviation.
The rat chorioallantoic placenta at GD 19.5 is composed of 4 distinct parts (Figure 2), 2 with fetal origins, formed from the trophectoderm of the embryo (the labyrinth and the basal zone), and 2 with maternal origins, formed from the endometrium of the dam (the decidua and the metrial gland; Furukawa et al. 2011).
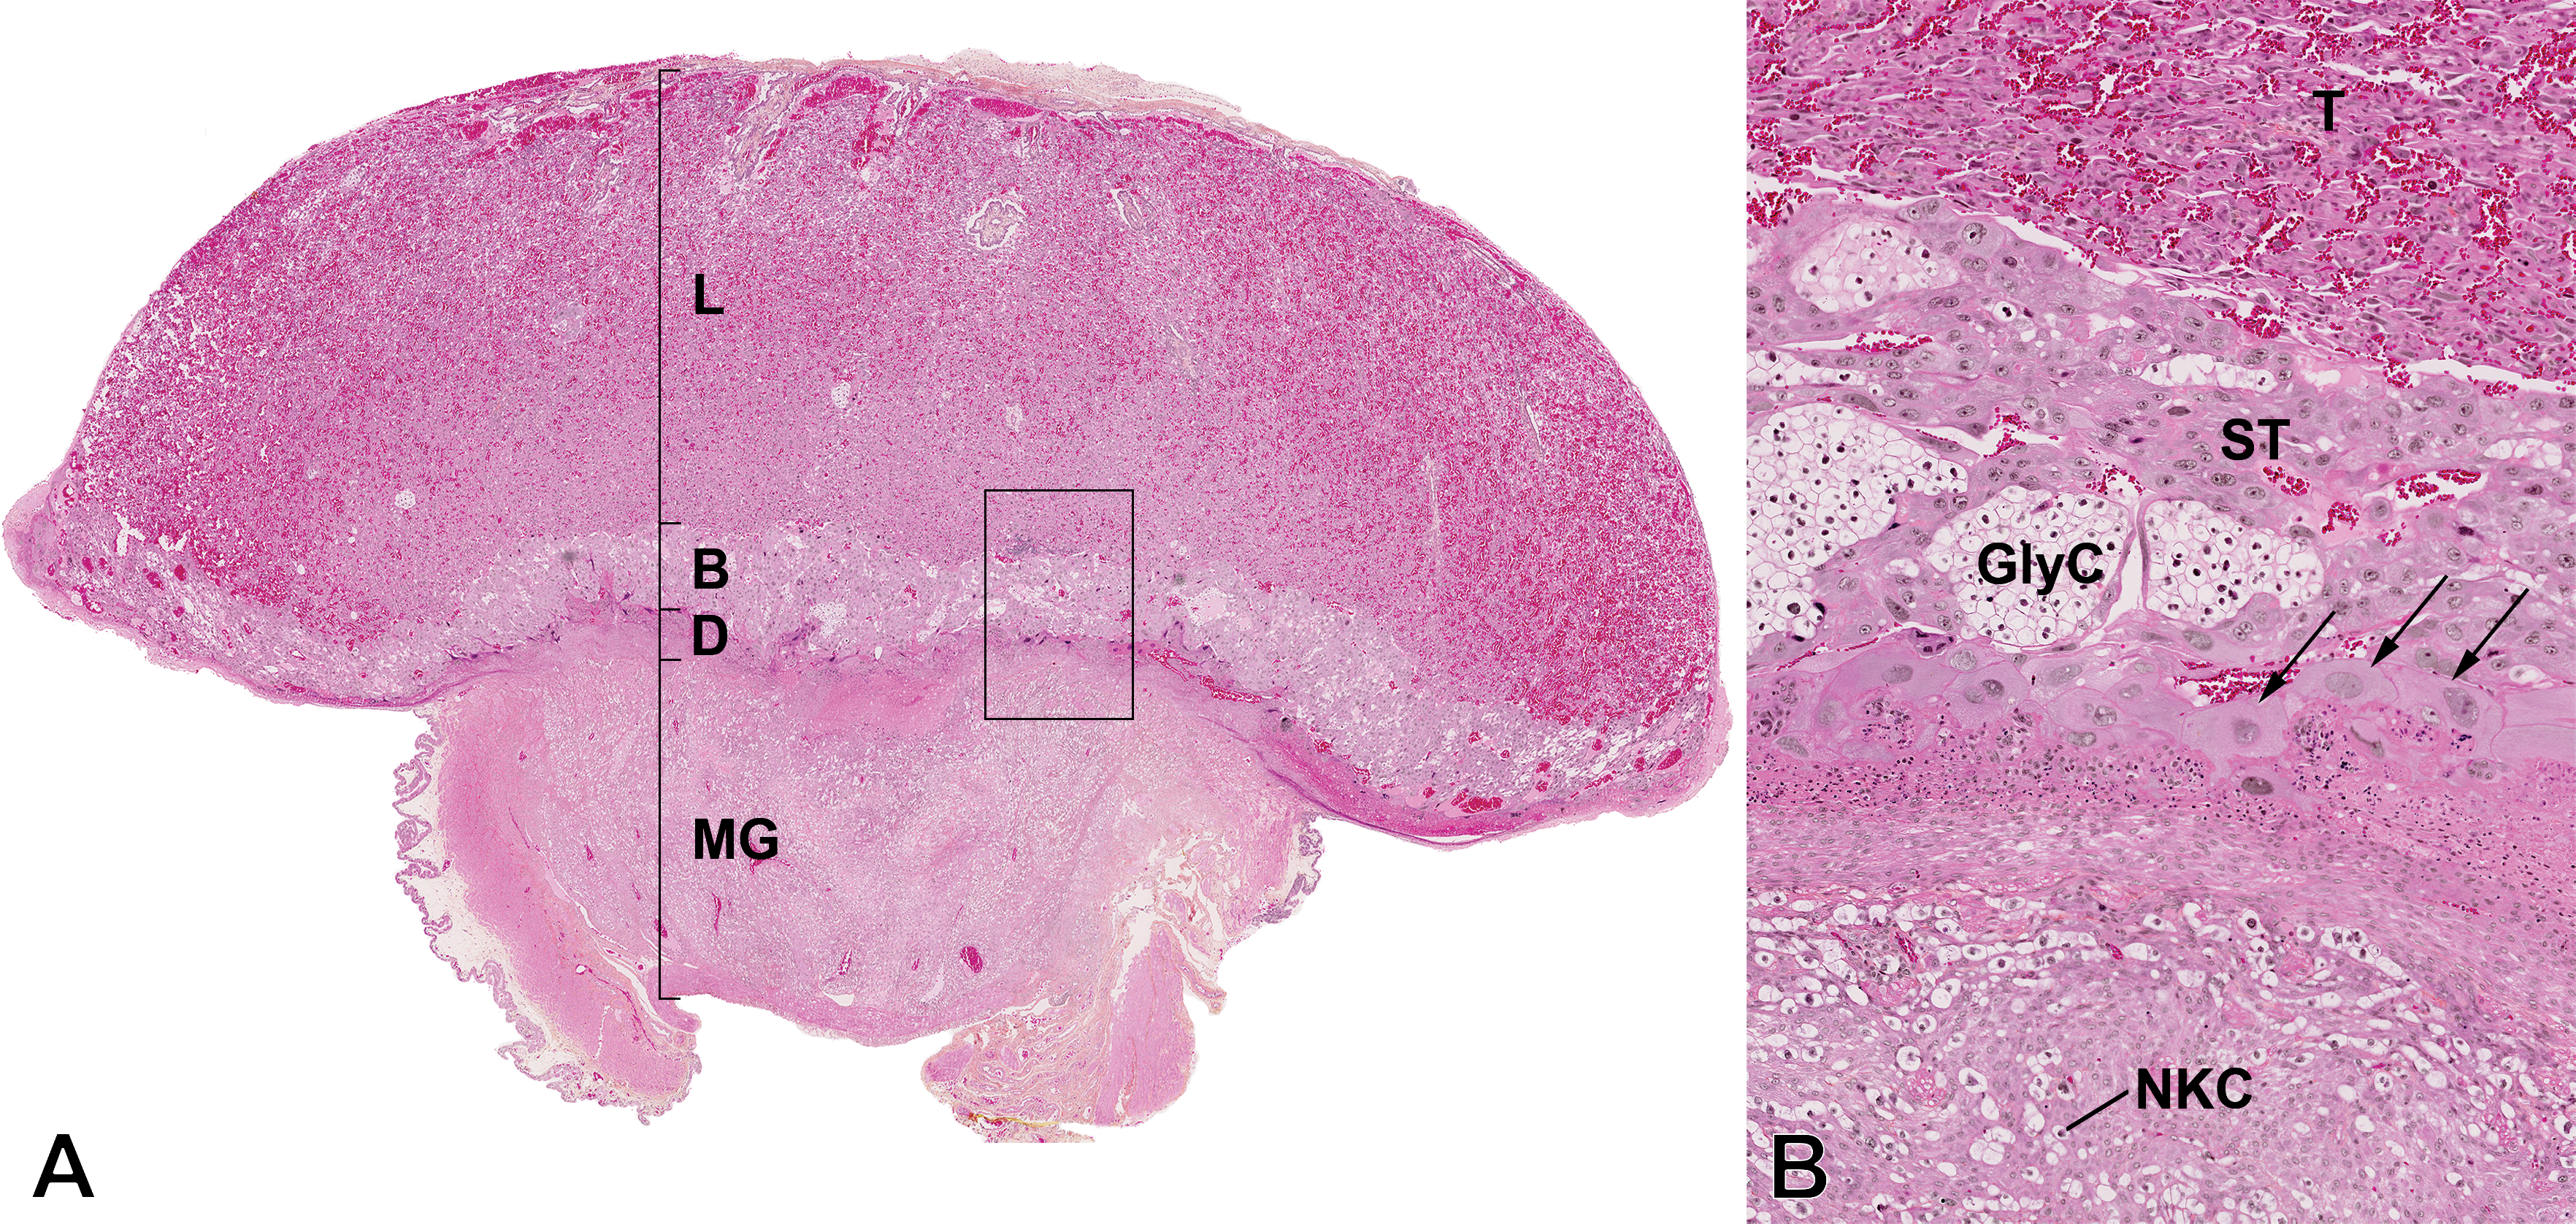
Photomicrograph of the central section of the placenta at gestational day 19.5. Hematoxylin–eosin–phloxine–saffron staining. (A) Subgross histologic anatomy of the rat placenta. L = labyrinth zone; B = basal zone; D = decidua; MG = metrial gland. (B) Higher magnification of the boxed region in part A to view the distinctions between cell layers. T = trophoblast cells; ST = spongiotrophoblast cells; GlyC = glycogen cells; arrows = trophoblastic giant cells; NKC = uterine natural killer cells.
Maternal and fetal exchange occurs principally through the labyrinth zone, which is highly vascularized and also comprises the placental barrier, formed of 3 layers of trophoblast cells: 1 layer of cytotrophoblast cells and 2 of syncitiotrophoblast cells (Wooding and Burton 2008). This organization is characteristic of the hemotrichorial placentation.
The basal zone, also called the junctional zone or the trophospongium, is located between the decidua and the labyrinth zone and is the principal endocrine layer of the placenta. It is comprised of 3 types of differentiated trophoblast cells: (1) the trophoblast giant cells, (2) the spongiotrophoblast cells, and (3) the glycogen cells (Figure 2). The trophoblast giant cells form a layer between the maternal and the fetal portions of the placenta. Giant cells are one of the major endocrine cells of the placenta, as they synthesize and secrete a variety of proteins, proteinases, cell adhesion molecules, hormones, and cytokines (prolactin family) that promote local and systemic physiological maternal adaptations to pregnancy (Hu and Cross 2010; Furukawa et al. 2011).
The decidua (Figure 2) is made of maternal endometrial stromal cells modified by the process of decidualization, in which stromal cells start with an elongated, fibroblastic shape and differentiate into densely packed decidual cells (Fonseca, Correia-da-Silva, and Teixeira 2012). The decidua produces different hormones, cytokines, and growth and immune factors. Its volume is largest after implantation and it degenerates progressively after midgestation to finally form only a thin layer at the base of the placenta at term called the decidua basalis (Furukawa et al. 2011).
The metrial gland (Figure 2) contains a mix of decidual cells and fibroblasts, uterine natural killer cells, and the maternal arteries. It forms early during gestation and is fully developed at midgestation, after which it regresses (Fonseca, Correia-da-Silva, and Teixeira 2012). The metrial gland is deeply invaded by trophoblasts, which is characteristic of the invasive rat placentation.
Measuring the area of each anatomical region of the placenta provides valuable data, as treatment can alter the size of a specific area and it is possible thereafter to interpret the physiological significance of this alteration. The average areas of the whole fetal placenta, the labyrinth, and the basal zone are presented in Table 2.
Areas of the Regions of the Placentae from Gestational Day 19.5 Rats (Mean ± SD).
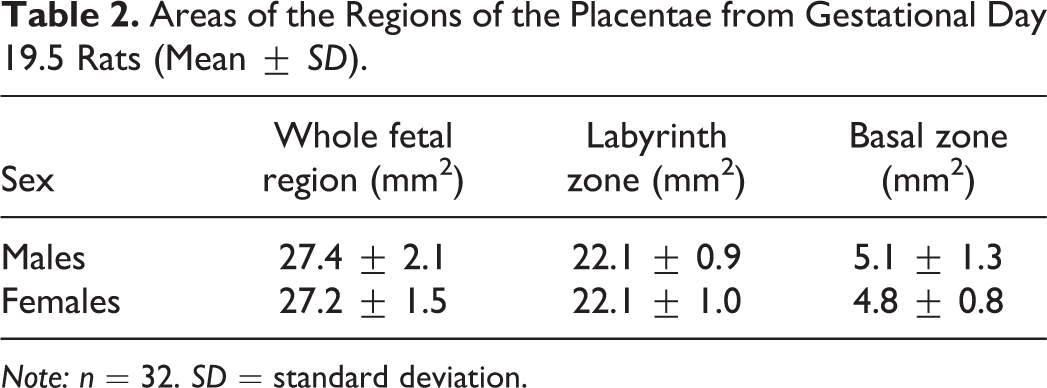
Note: n = 32. SD = standard deviation.
The Rat Fetus
A whole-fetus serial sectioning schematic was used to obtain 12 precise fetal sections to visualize most organs without the need for tedious dissection. This method gives consistent and high-quality slides where most tissues can consequently be examined. Each section in the figure enables the examination of a specific part of the fetus. In Figure 1, the dotted lines on the fetus represent the level of each fetal section and those levels are used to identify the sections in Figures 3 to 6. Most organs are still immature, although the fetuses were very close to term. The histomorphology of some developing organs is described in more detail in the following paragraphs.
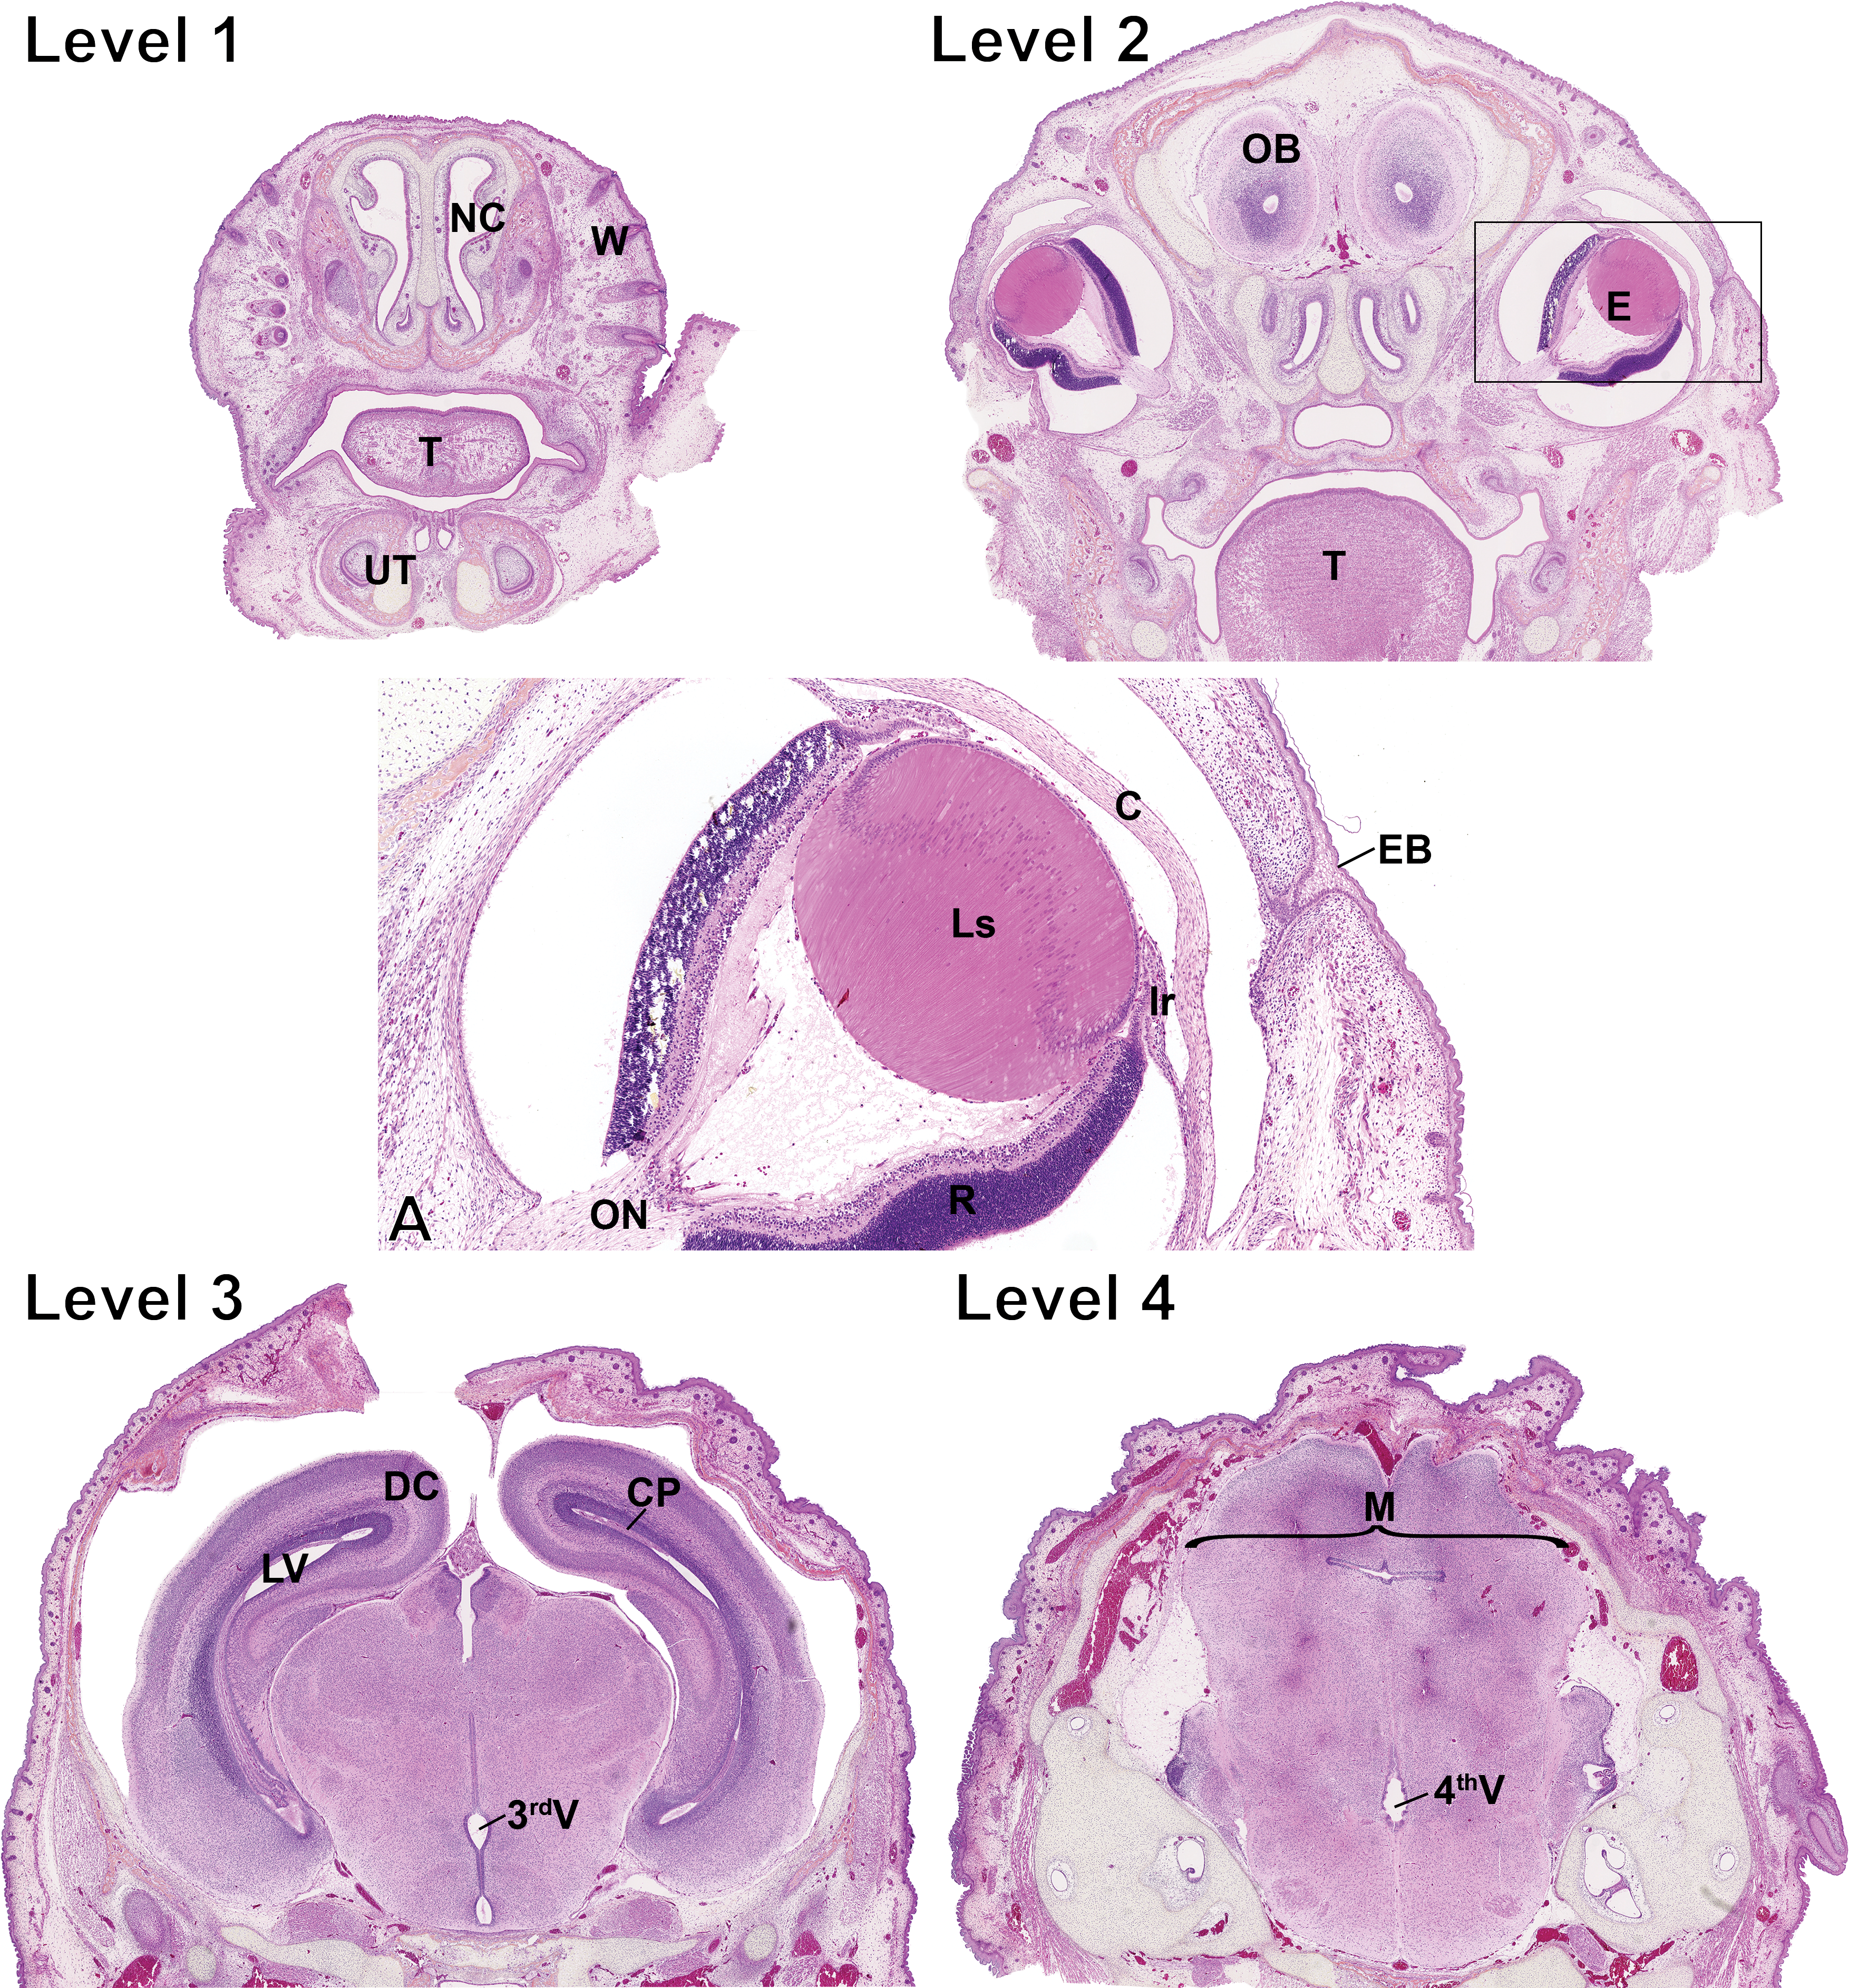
Photomicrograph of the fetal head. Level numbers represent the fetal sections shown in Figure 1. Hematoxylin–eosin–phloxine–saffron staining. Level 1: NC = nasal channels; W = whiskers; T = tongue; UT = unpierced tooth. Level 2: OB = olfactory bulb; E = eye; T = tongue. (A) Higher magnification of the boxed region around the eye in level 2. ON = optic nerve; R = retina; Ls = lens; Ir = iris; C = cornea; EB = epithelial bridge. Note that the epithelial bridge keeps the eyelids fused and disappears at 2 weeks of age. Level 3: DC = developing cortex; LV = lateral ventricle; CP = choroid plexus; 3rdV = third ventricle. Level 4: M = midbrain; 4thV = fourth ventricle.
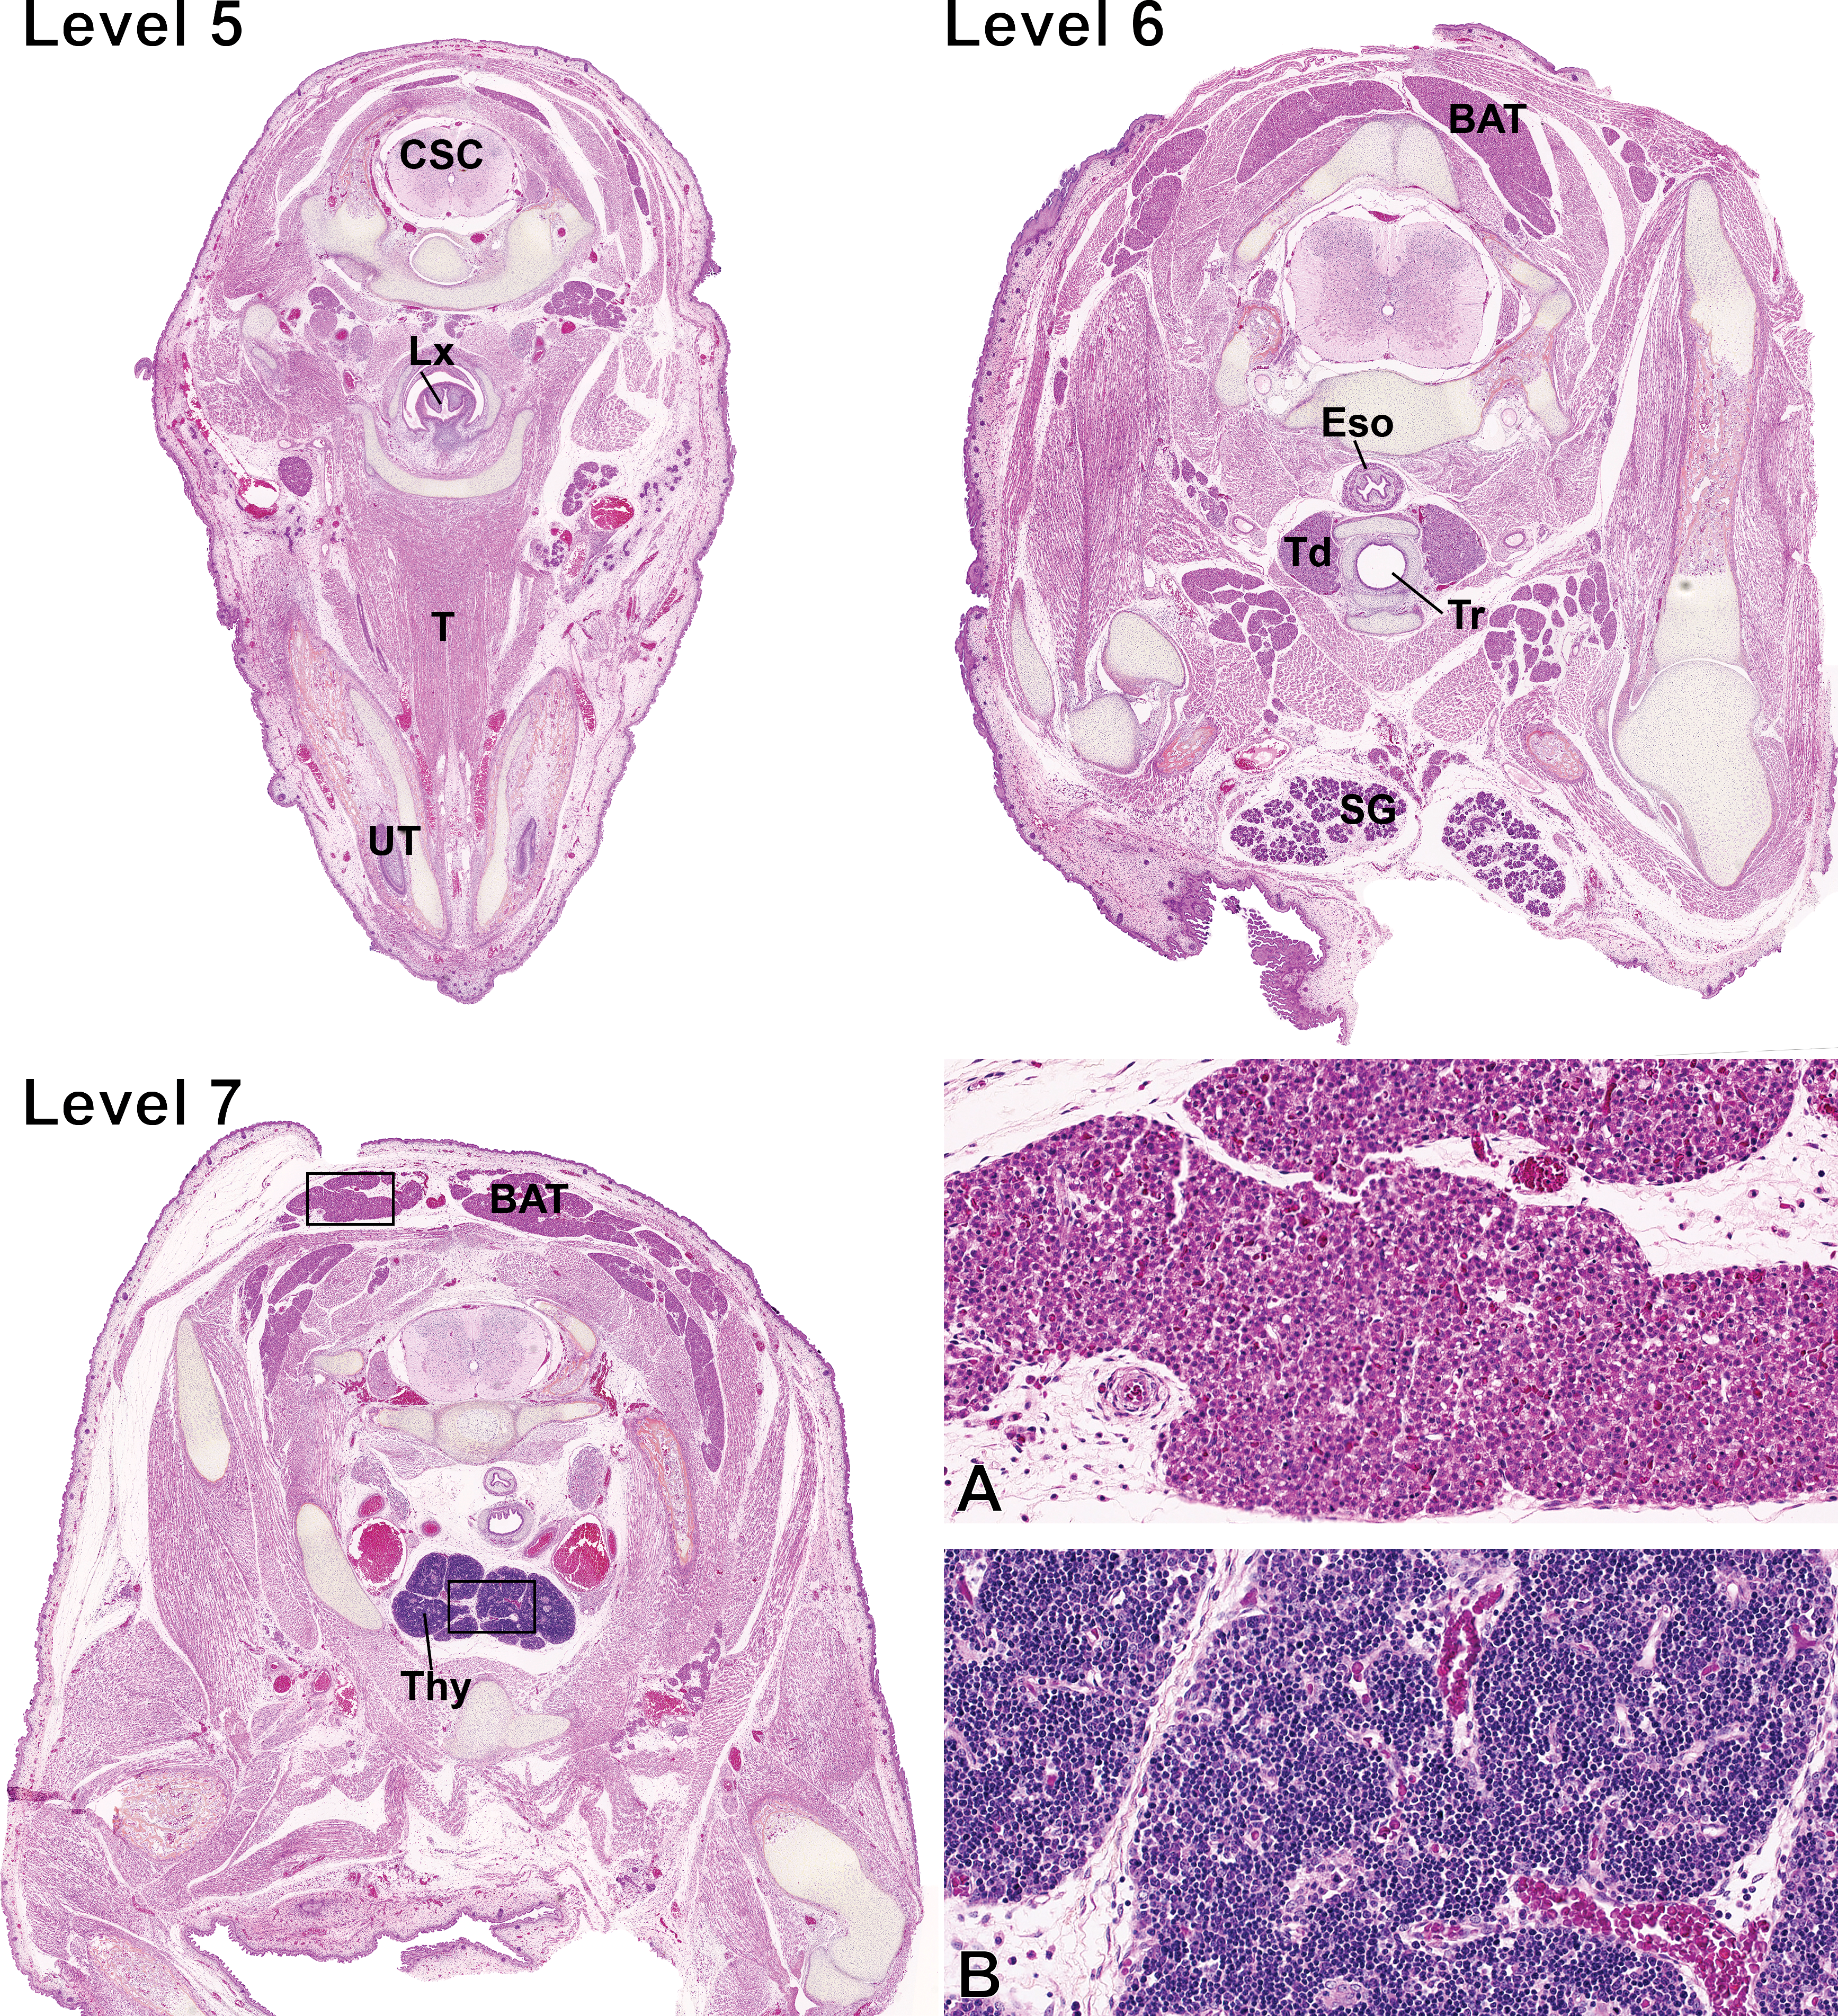
Fetal sections of the neck and the upper chest cavity. Level numbers represent the fetal sections shown in Figure 1. Hematoxylin–eosin–phloxine–saffron staining. Level 5: CSC = cervical spinal cord; Lx = larynx; T = tongue; UT = unpierced tooth. Level 6: BAT = brown adipose tissue; Eso = esophagus; Td = thyroid; Tr = trachea; SG = salivary gland. Level 7: BAT = brown adipose tissue; Thy = thymus. (A) Higher magnification of the BAT squared region on level 7. (B) Higher magnification of the thymus squared region on level 7.
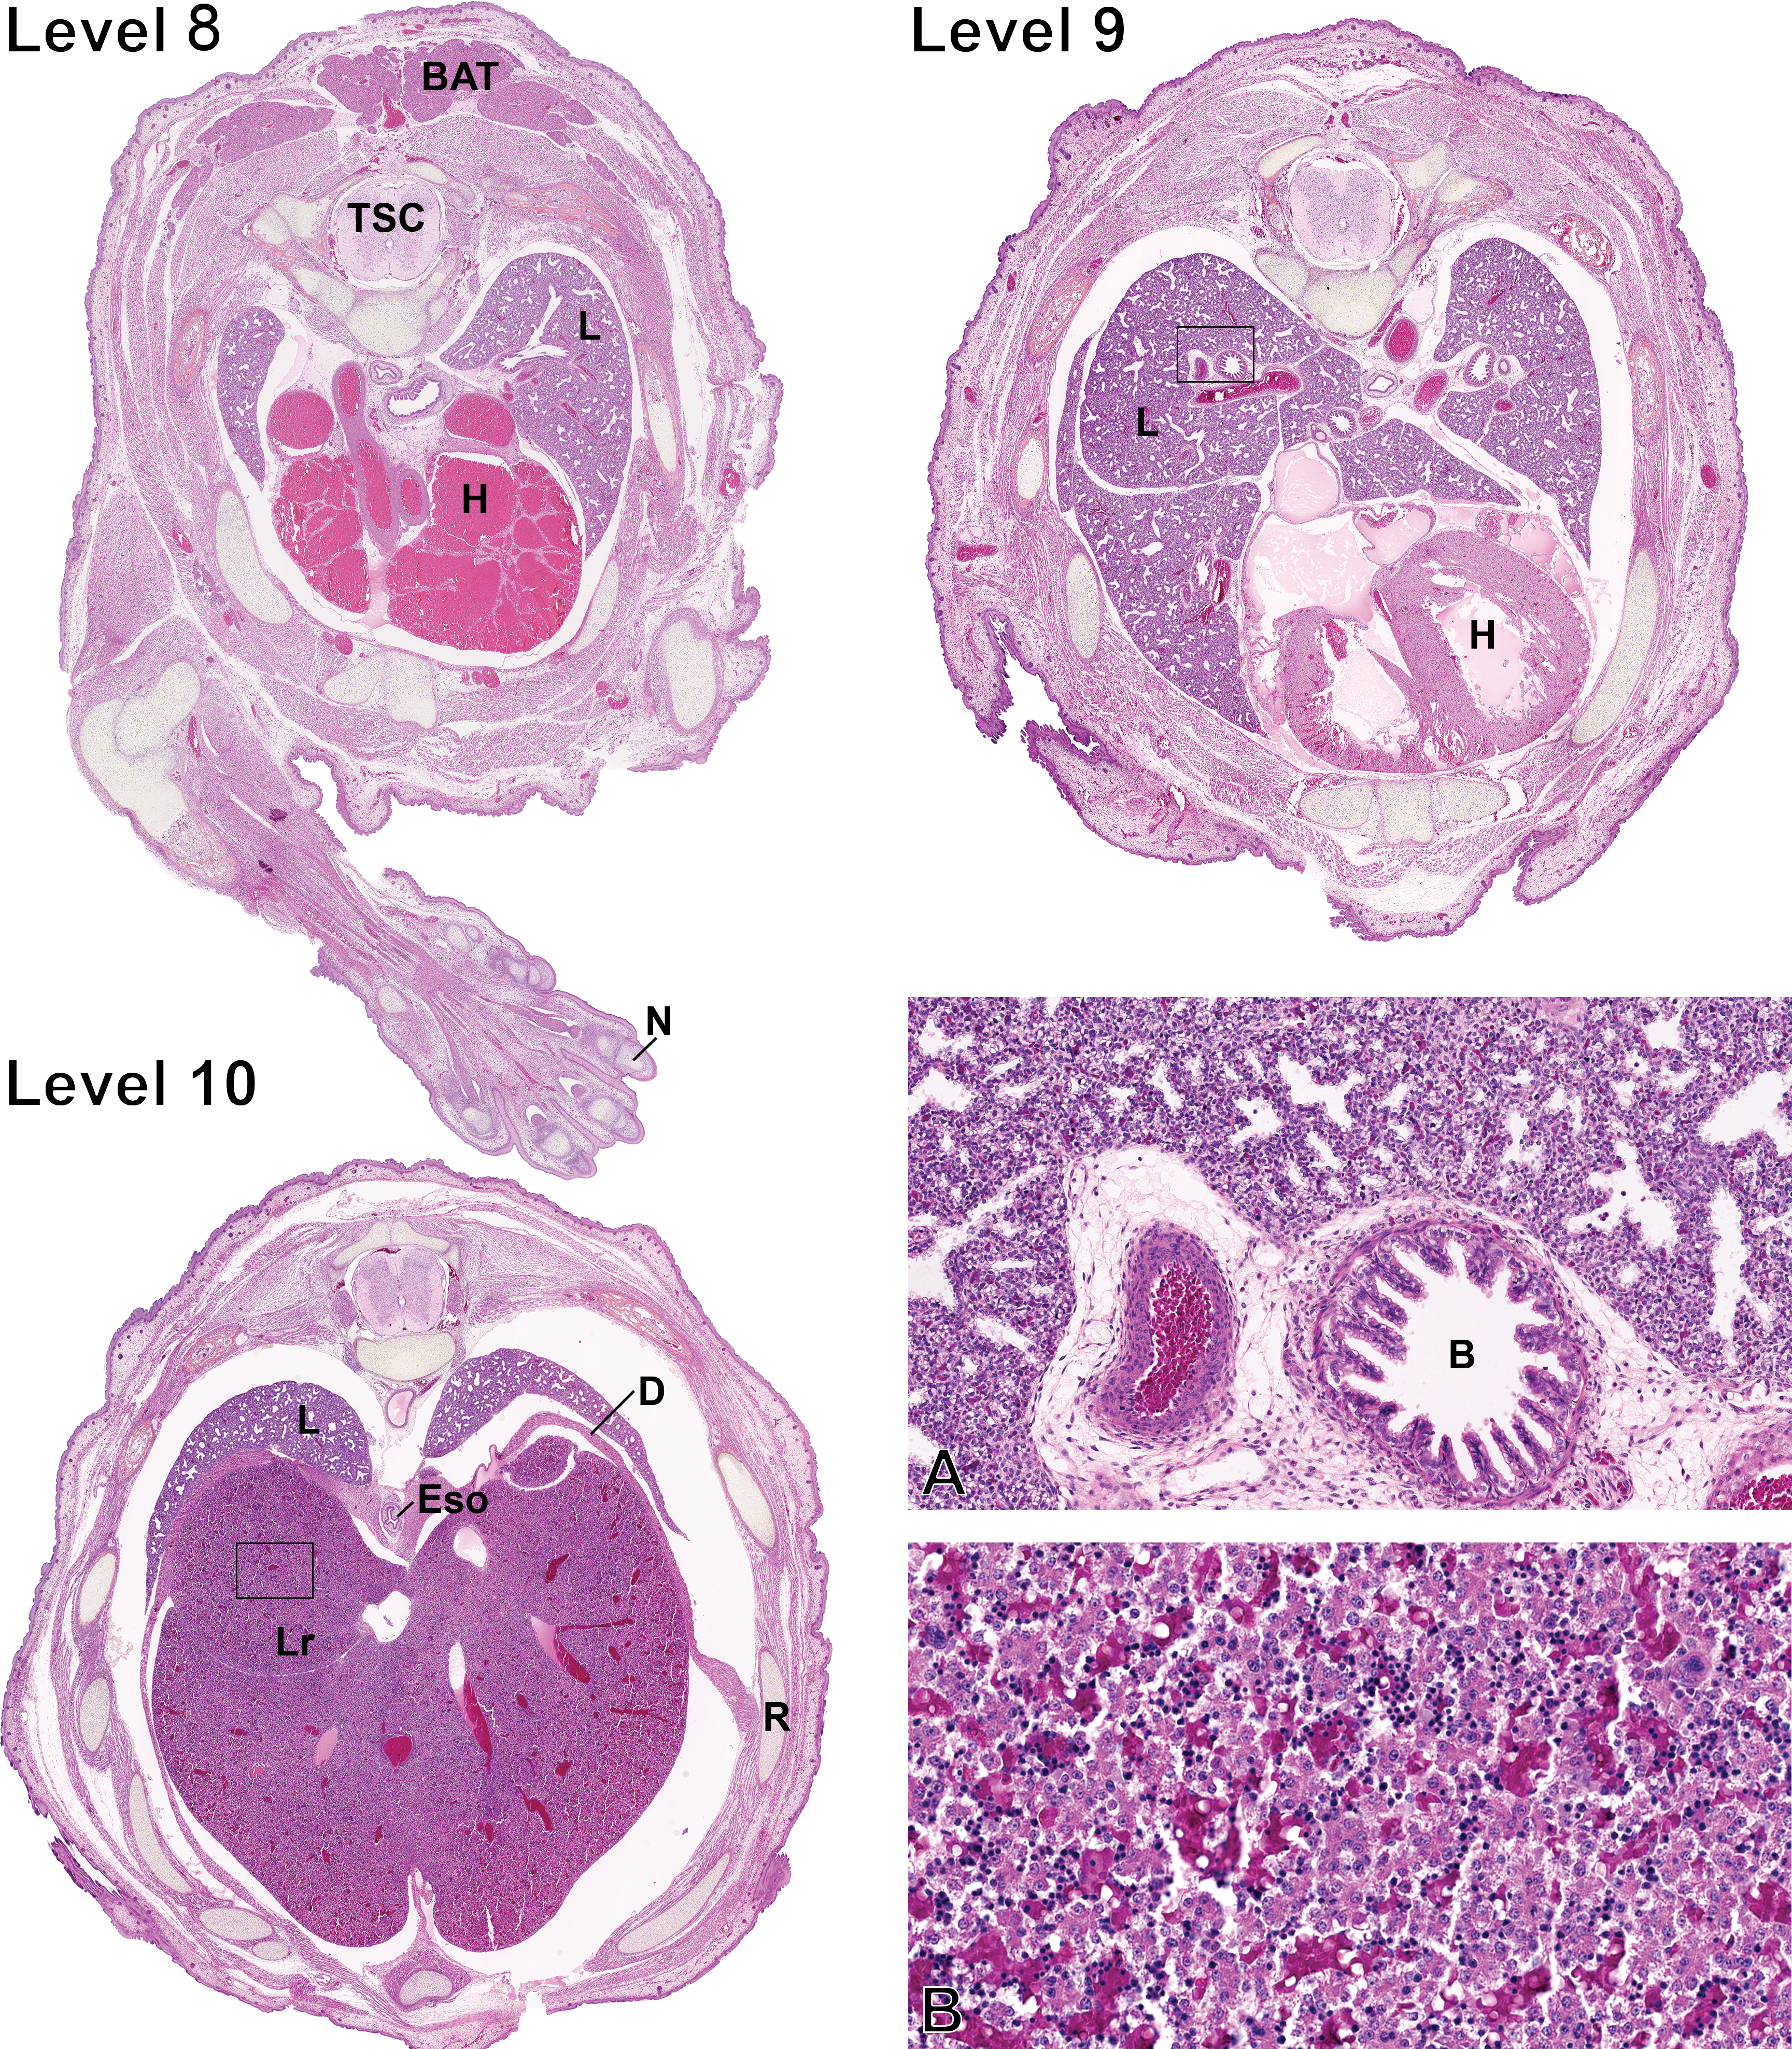
Fetal sections of the chest cavity and the upper abdominal cavity. Level numbers represent the fetal sections shown in Figure 1. Hematoxylin–eosine–phloxine–saffron staining. Level 8: BAT = brown adipose tissue; TSC = thoracic spinal cord; L = lungs; H = heart; N = nail. Level 9: L = lungs; H = heart. Level 10: L = lungs; D = diaphragm; Eso = esophagus; Lr = liver; R = rib. (A) Higher magnification of the lungs squared region on level 9. B = bronchus. (B) Higher magnification of the liver squared region on level 10.
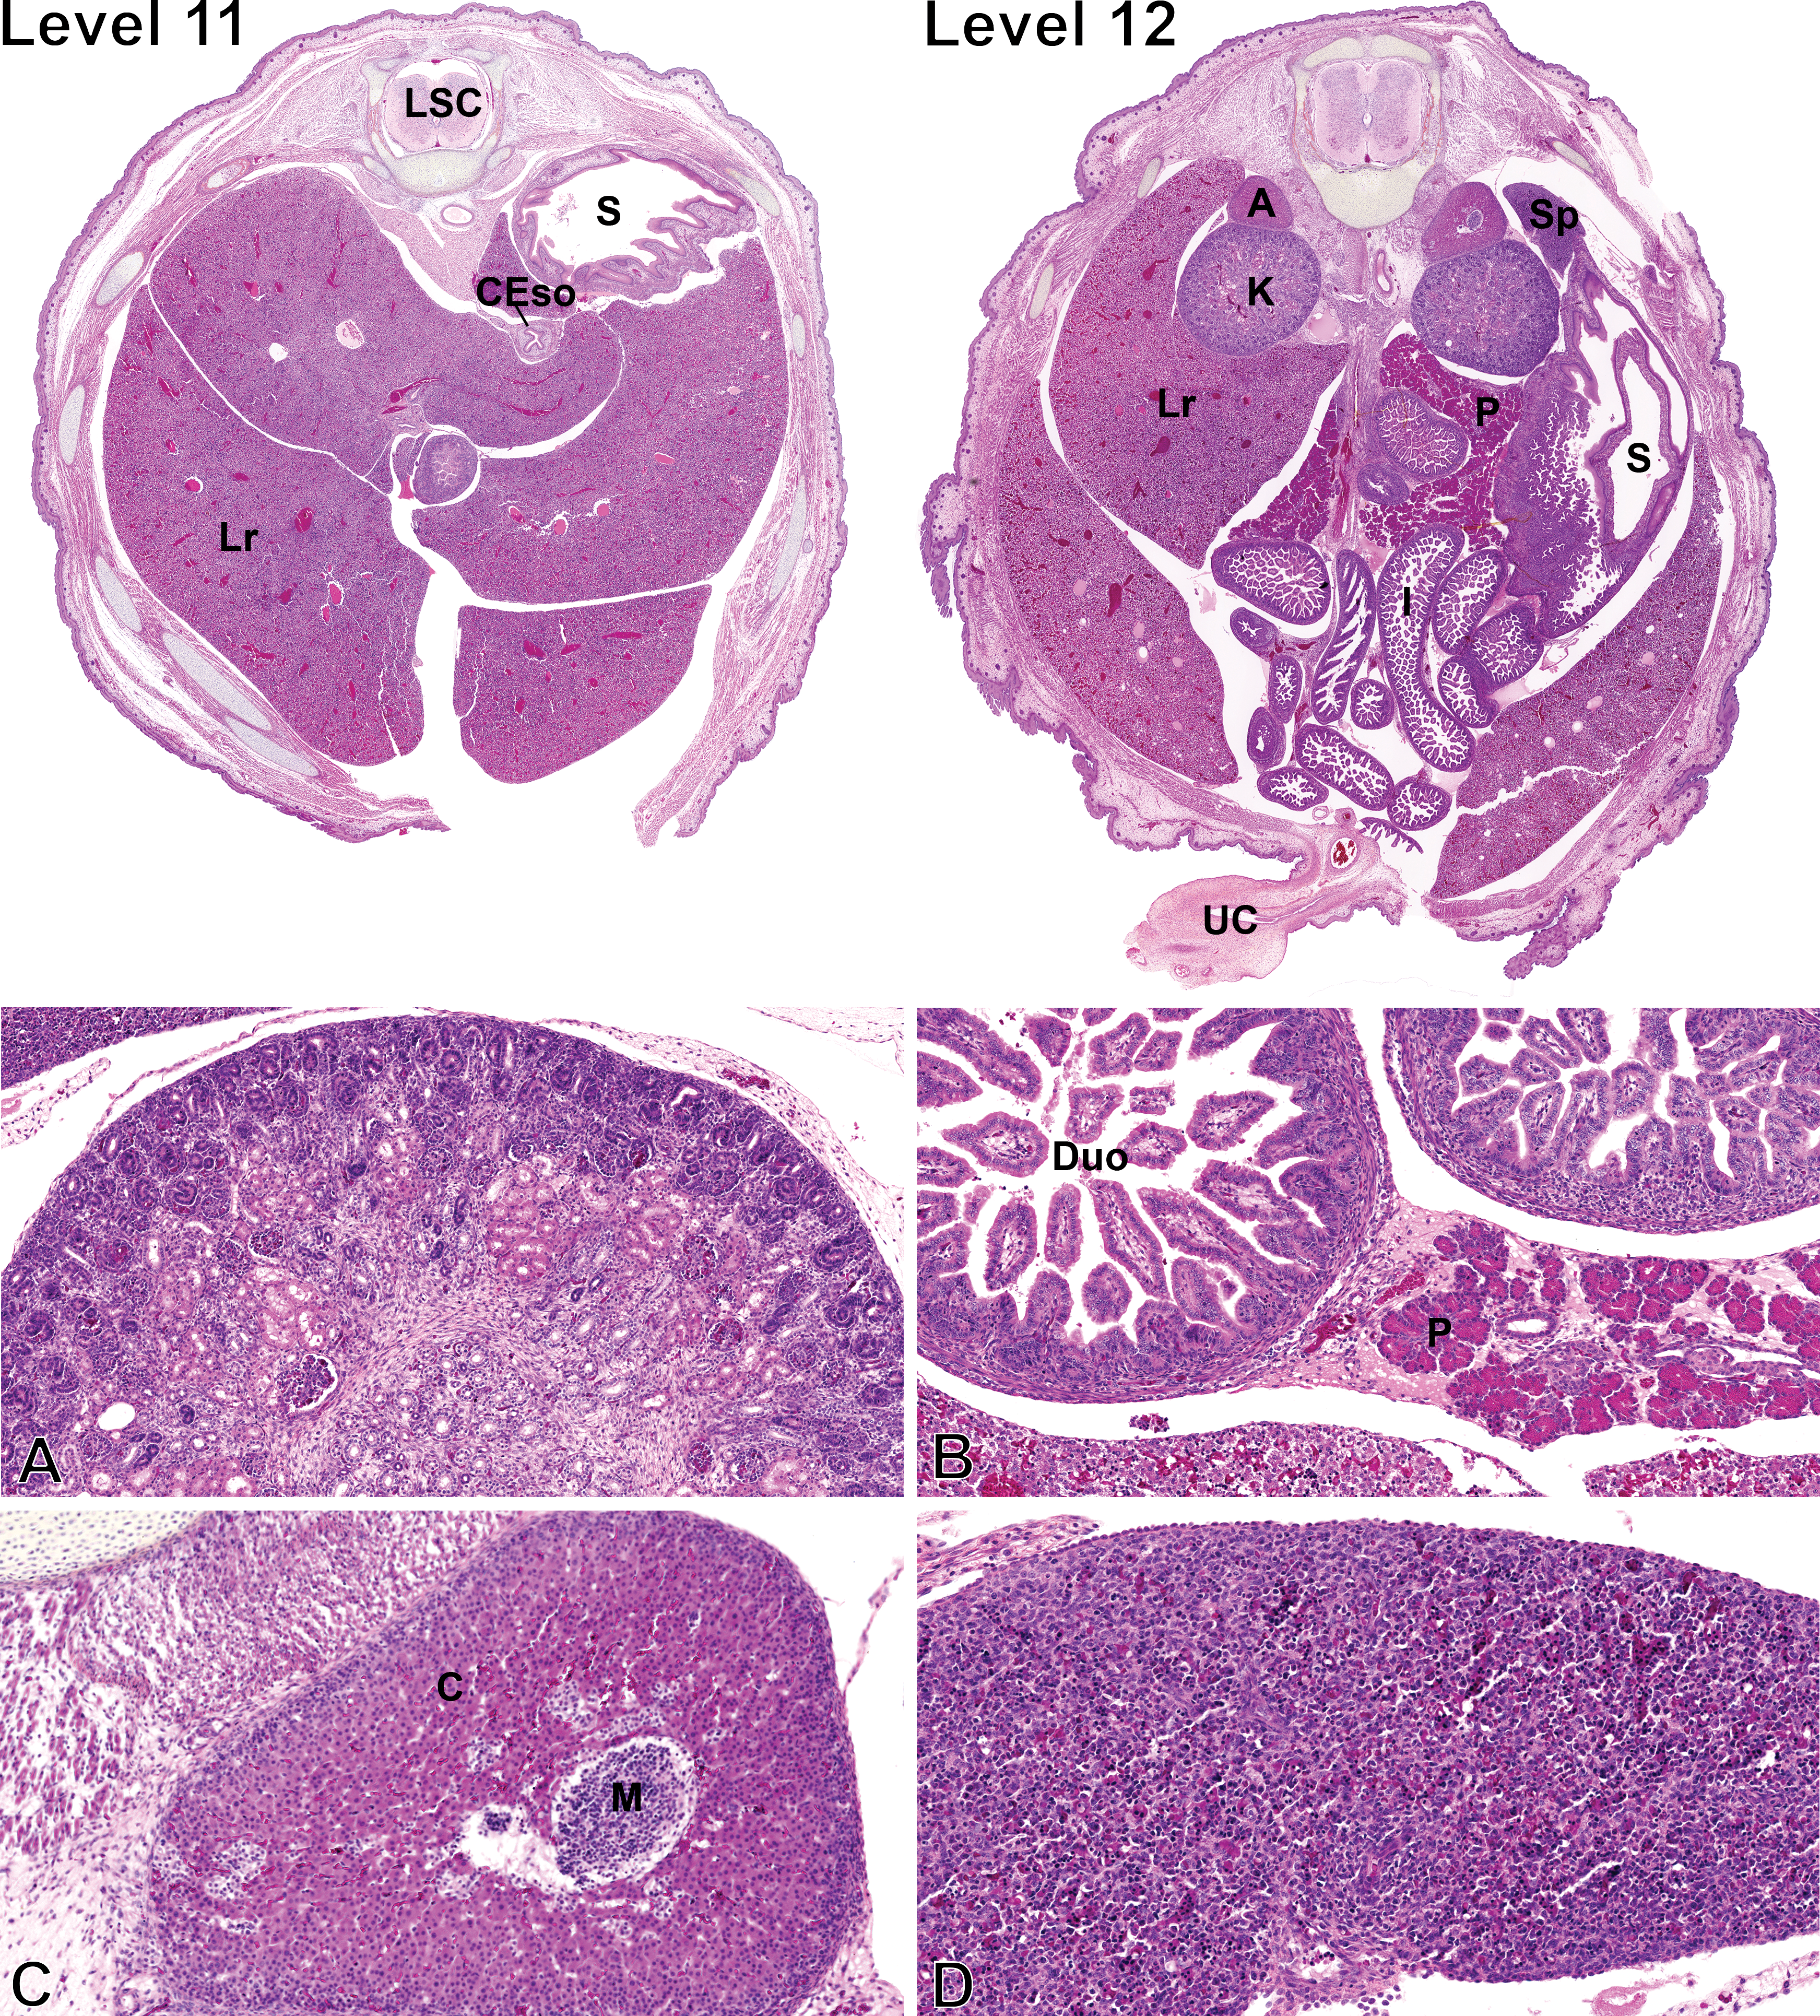
Fetal sections of the abdominal cavity. Level numbers represent the fetal sections shown in Figure 1. Hematoxylin–eosin–phloxine–saffron staining. Level 11: LSC = lumbar spinal cord; S = stomach; CEso = caudal esophagus; Lr = liver. Level 12: A = adrenal gland; Sp = spleen; K = kidney; Lr = liver; P = pancreas; S = stomach; I = intestines; UC = umbilical cord. (A) Higher magnification of the kidney. (B) Higher magnification of the pancreas attached to the duodenum. Duo = duodenum; P = pancreas. (C) Higher magnification of the adrenal gland. M = medulla; C = cortex. (D) Higher magnification of the spleen.
Eye
At level 2 (Figure 3), it is possible to visualize the fetal eyes (E). At GD 19.5, the eyelids are fused by an epithelial bridge, and the eyes are markedly underdeveloped. The corneal epithelium is composed of a monolayer of flattened to oval cells, while the corneal stroma is hypercellular and contains numerous plump fibroblasts, termed keratocytes. The immature corneal endothelial cells are rounded, and the Descemet’s membrane is undetectable. At this stage, the lens is composed of numerous secondary lens fiber cells, which results in a high density of nuclei in the bow region. Lens fiber cell nuclei are observed through the entire width of the lens. Capillaries from the hyaloid vascular system are easily noticeable. The iris is short, and the 2 epithelial cell layers composing its posterior epithelium are large and immature. The ciliary body is hardly distinguishable and appears only as one poorly developed and subtle ciliary process. The retina is very immature and consists of an innermost nerve fiber layer, a hypercellular ganglion cell layer, an inner plexiform layer, and a large neuroblastic layer composed of a prominent band of mitotically active neuroblastic cells at its outermost aspect. The optic nerve is composed of randomly arranged glial cells and nonmyelinated nerve fibers (Van Cruchten et al. 2017; Vrolyk, Haruna, and Benoit-Biancamano 2017).
Trachea
The trachea (T), seen on level 5 (Figure 4), is lined by 2–3 layers of immature, nonciliated, low columnar epithelial cells. Seromucous submucosal glands are absent and islets of primitive cartilage, which is highly cellular at this stage, are observed around the trachea. A small bundle of smooth muscle cells is noticeable at the dorsal aspect.
Thyroid
Thyroid glands (Td; level 6, Figure 4) are composed of cuboidal follicular cells forming mainly acini and very rare small follicles devoid of colloid. C cells are not apparent at this stage.
Thymus
The thymus (Thy) is visible on level 7 (Figure 4) and is proportionally larger in the fetus than in the adult due to subsequent involution. The thymus is divided into distinct lobules and is mainly composed of the cortex as the medulla is minimally noticeable. The corticomedullary demarcation is moderately well delineated.
Brown adipose tissue (BAT)
On levels 5 to 8 (Figures 4 and 5), the BAT is visible and abundant. This is a secretory organ that plays many roles but is mostly recognized for its function of thermoregulatory thermogenesis in mammals, in particular, during the infant stage (Cannon and Nedergaard 2004). BAT is highly cellular and is composed of numerous adipocytes with a scant to moderately abundant eosinophilic cytoplasm, which contains small and clear vacuoles. Nuclei are round, central to paracentral, and contain a finely granular chromatin and a nucleolus is rarely noted. Occasional mitotic figures are observed.
Heart
At this stage, the atria, visible on levels 8 and 9 (Figure 5), appear markedly dilated and the left and right ventricular walls and interventricular septum are of similar thickness. The developing ventricular myocardium is composed of cardiac muscle trabeculae separated by interconnected sinusoids, which are lined by endothelial cells, especially in the apex region and more notably, the right ventricular myocardium (Marcela et al. 2012). These sinusoids communicate with the heart chambers and allow blood nutrients to reach the myocardium, while the coronary circulation is being formed (Marcela et al. 2012). At this stage, the myocardium is hypercellular, composed of cardiomyocytes with primitive features including a high nuclear cytoplasmic ratio, poorly developed myofibrils, and rare cross-striations. Numerous mitotically active cardiomyocytes can be observed throughout the myocardium. The atrioventricular valve apparatuses as well as the aortic and pulmonary valves are formed but immature.
Aorta
The aortic wall (Figure 5) is hypercellular with the presence of numerous immature smooth muscle cells and very infrequent elastic fibers and is lined by plump endothelial cells.
Lungs
The lungs (L) are seen on multiple sections from levels 8 to 10 (Figure 5) and are collapsed since they are devoid of air. At 19.5 GD, the lungs of the rat fetus are in the pseudoglandular stage, which is characterized by a system of epithelial tubules lined by undifferentiated epithelial cells that are branching into the surrounding mesenchyme (Burri and Moschopulos 1992). At this stage, the epithelial tubules have small, usually rounded, lumina and are surrounded by the interstitial tissue, which contains capillaries as well as mesenchymal cells, including smooth muscle cell precursors. The tubules are lined by cuboidal or columnar epithelial cells, sometimes pseudostratified depending on the region. The cytoplasm of most epithelial cells contains glycogen, which is easily detectable. In the central region of the lung, the developing airways and vessels are surrounded by a sheath of loosely arranged adventitial cells. Bronchi and some bronchioles present a mucosal layer with longitudinal folds. Only rare ciliated epithelial cells are observed, as ciliogenesis begins at this stage (Burri and Moschopulos 1992). Small islets of primitive chondrocytes are observed around the larger bronchi.
Liver
In the fetus, the liver (Lr) is markedly voluminous, includes well-defined lobes, and occupies a major proportion of the abdominal cavity, and it is therefore seen on many sections from levels 10 to 12 (Figures 5 and 6). The fetal liver is composed of highly disorganized cords of immature hepatocytes separated by primitive sinusoids. The hepatocytes form 2-3 cell thick hepatocyte cords. The cytoplasm of hepatocytes contains numerous clear vacuoles corresponding to glycogen (Russo and Russo 2011). Portal tracts are barely distinguishable because of the absence of peripheral connective tissue and contain a portal vein as well as biliary epithelial precursor cells organized as single-layered sheets or bilayered structures lacking lumina, called ductal plates (Swartley et al. 2016). Hematopoiesis, including erythropoiesis, scattered megakaryocytes, and myelopoiesis, is observed multifocally in the liver parenchyma.
Kidneys
The kidneys (K), shown at level 12 (Figure 6), are very immature yet have initiated nephrogenesis. The cortex can be divided into a basophilic subcapsular nephrogenic zone, the juxtamedullary zone, and the intercortical zone (Dodge 1997). The subcapsular nephrogenic zone includes the 2 earliest stages of developing nephrons including vesicles (stage 1) and S-shaped structures (stage 2), while the juxtamedullary zone contains immature glomeruli (stage 3). Mature nephrons (stage 4) are not observed at GD 19.5. Other immature nephrons are in the superficial subcapsular zone. There is no distinction between the inner and outer medulla at this stage, and the outer aspect of the primitive medulla contains bundles of loose mesenchymal tissue. Renal tubules, including the loops of Henle, are lined by immature cuboidal cells, and medullary rays are scarcely distinguishable.
Spleen
The spleen can be seen at level 12 (Figure 6). The splenic parenchyma consists primarily of sheets of randomly distributed erythrocytes mixed with various hematopoietic precursor cells.
Pancreas
The pancreas (Figure 6) is composed of distinct acinar structures and immature islets of Langerhans. The cytoplasm of acinar cells is markedly distended by abundant zymogen granules, giving the acinar cells a bright eosinophilic appearance, and the nuclei are basally located. Mitotically active acinar cells are observed multifocally. At this stage, the islets of Langerhans correspond to small, pale and basophilic to amphophilic clusters of isomorphic cells.
Duodenum
At GD 19.5, the duodenal mucosa (Figure 6) presents numerous, thin, short to moderately tall villi, while the crypts are short and contain undifferentiated multipotent stem cells, which are occasionally mitotically active. The villi are lined with a simple columnar epithelium composed of enterocytes characterized by a bright eosinophilic cytoplasm with basally located rounded nuclei. Goblet cells are rare. The submucosa is hypercellular, and the muscular layer is thin.
Ovaries
The ovaries (Figure 7A) are composed of a sheet of germ cells, including oogonia and primary oocytes, arranged in cysts and poorly defined ovigerous nests characterized by a cluster of oocytes surrounded by pregranulosa cells (Pepling 2006). Germ cells in meiosis are observed multifocally. The surface of the immature ovaries is lined by a cuboidal pseudostratified epithelium. The immature oviduct is composed of a cuboidal to columnar pseudostratified epithelium and is embedded in a loosely organized and abundant peritubular stroma.
Testis
The testis (Figure 7B) consists primarily of immature seminiferous tubules embedded within a loose stroma. The tubules are composed of numerous large gonocytes located centrally and Sertoli cells present along the basement membrane and are surrounded by 1 layer of spindle cells; lumina are not observed. The stroma contains undifferentiated mesenchymal stem cells as well as numerous individual and grouped fetal Leydig cells presenting an eosinophilic and finely vacuolated (lipid inclusions) cytoplasm.
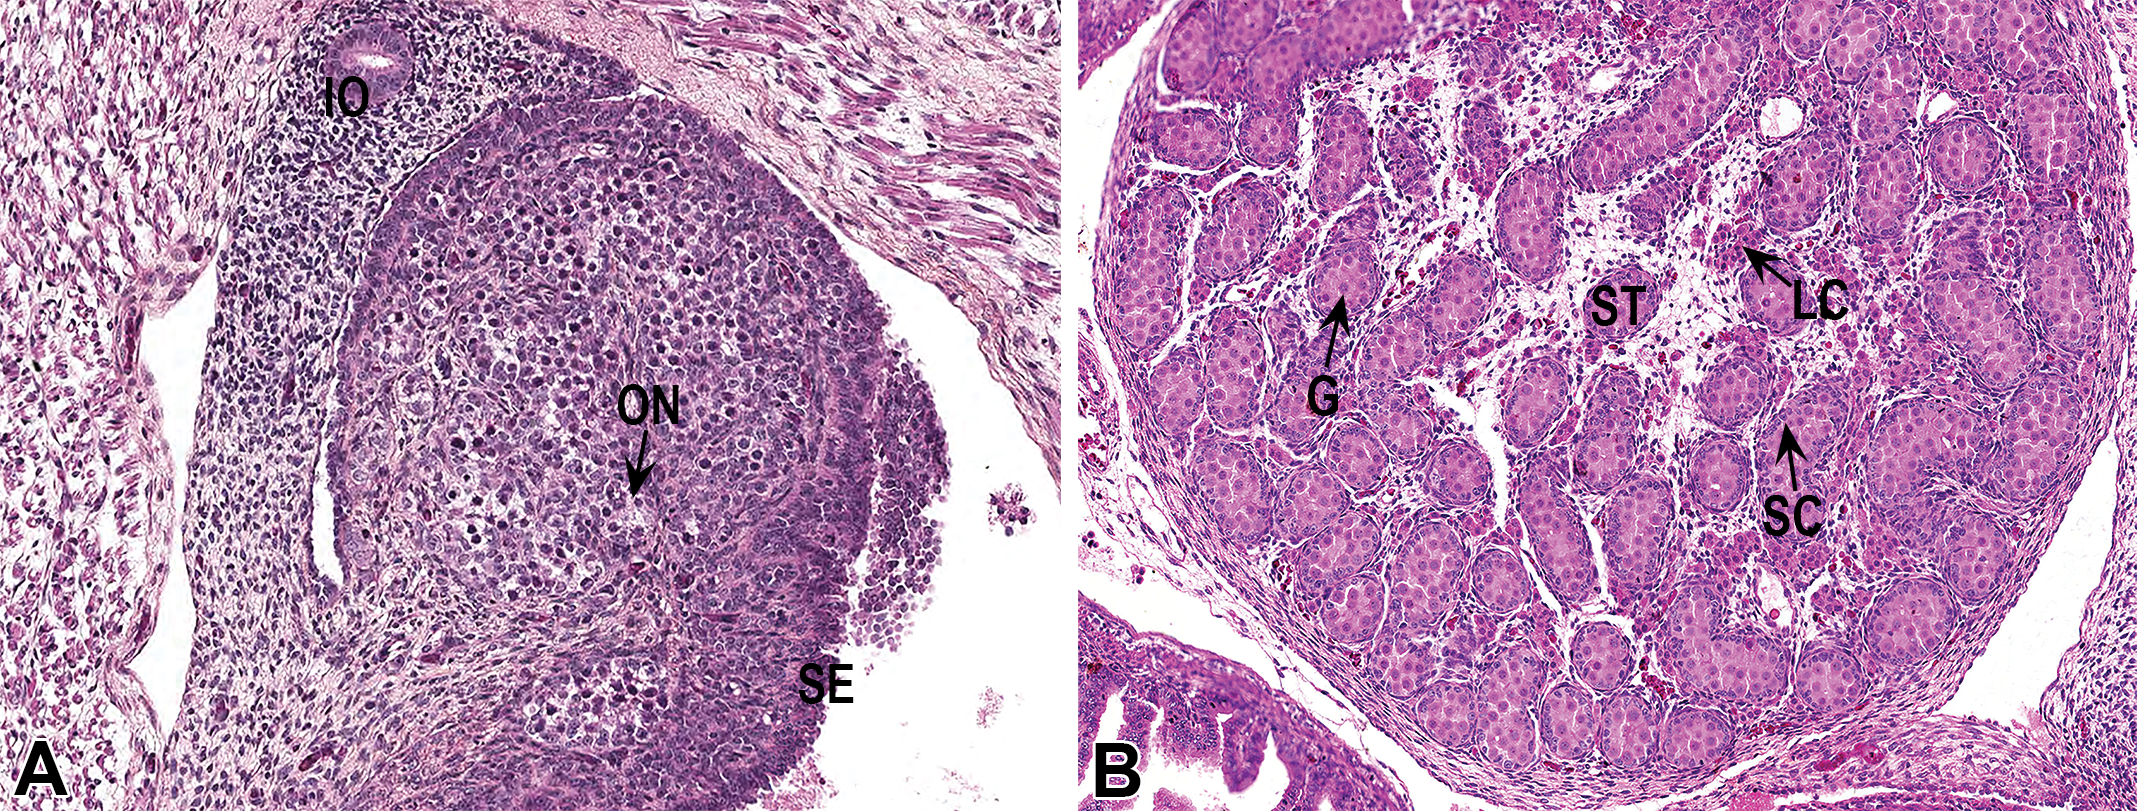
Fetal sections of 1 ovary and 1 testis. Hematoxylin–eosin–phloxine–saffron staining. (A) IO = immature oviduct; ON = poorly defined ovigerous nest; SE = surface epithelium. (B) G = gonocyte (germ cell); ST = seminiferous tubule; LC = Leydig cells; SC = sertoli cells.
Conclusion
Many publications have shown data characterizing the normal placenta (Cline et al. 2014; Fonseca, Correia-da-Silva, and Teixeira 2012; Furukawa et al. 2011); however, to the best of our knowledge, none has combined an analysis of both the placenta and fetus, for a more complete histological examination. The addition of placental histomorphometry greatly improves the precision of the analysis compared to placental weight alone. The histomorphometric data presented here can serve as a reference data set for future studies using Sprague-Dawley rat fetuses as a model, including safety evaluation of the effects of xenobiotics on the developing fetal organs. Furthermore, although technical skill is required to rigorously perform the freehanded whole-body serial sectioning on the fetuses, it significantly increases the speed and reduces costs as compared to traditional dissection, while providing more valuable information than gross or subgross examination. Importantly, this sectioning technique also has the advantage of providing the in situ positioning of the organs and their analysis.
Therefore, performing histopathological examination of fetuses using this method of whole-body serial sectioning is more efficient than individual organ dissection, while quantitative analysis of the placental areas improves understanding of the pathogenesis of treatment-related changes in a study. Therefore, this technique provides a standardized method for future research in pertinent fields such as toxicology and development.
Footnotes
Acknowledgments
The authors thank the histological technicians at the Faculté de Médecine Vétérinaire of the University of Montreal for their expertise.
Author Contribution
Authors contributed to conception or design (PLC, VV, MOBB); data acquisition, analysis, or interpretation (PLC, VV, PMH, ML, DMS, MD, JH, JLB, MOBB); drafting the manuscript (PLC, VV); and critically revising the manuscript (PLC, VV, PMH, ML, DMS, MD, JH, JLB, MOBB). All authors gave final approval and agreed to be accountable for all aspects of work in ensuring that questions relating to the accuracy or integrity of any part of the work are appropriately investigated and resolved.
Declaration of Conflicting Interests
The author(s) declared no potential conflicts of interest with respect to the research, authorship, and/or publication of this article.
Funding
The author(s) disclosed receipt of the following financial support for the research, authorship, and/or publication of this article: This research was financed by the Canadian Institutes of Health Research.