
Abstract
To support phase III testing of coenzyme Q10 (CoQ10) in humans, we conducted pharmacokinetic and toxicology studies in beagle dogs. Following single gavage administration of CoQ10 at 600, 1200, 1800, or 2400 mg/kg per d no obvious dose response was observed in maximum concentration (C max) or area under the curve (AUC) versus time curve at the 3 highest dosages. In a repeated-dose study of CoQ10 at 600, 1200, 1800, or 2400 mg/kg per d for 4 weeks, CoQ10 reached steady state in plasma by 2 weeks at all dosages. Both C max and AUC increased with increasing dosage of CoQ10. The highest plasma levels were recorded at 1800 mg/kg per d. In a 39-week chronic toxicity study of CoQ10 at 1200 and 1800 mg/kg per d or placebo, CoQ10 reached steady state in plasma by 13 weeks. Behaviors, blood chemistries, and detailed histopathology were normal. No deaths occurred. These results support the use of a 2400 mg/d dosage of CoQ10 in human clinical trials.
Introduction
To support the proposals for large phase 3 efficacy and long-term safety studies of coenzyme Q10 (CoQ10) treatment at 2400 mg/d in people with Huntington disease (HD) and Parkinson disease (PD), long-term toxicology testing in a nonrodent species was conducted. The HD study will treat people for 5 years and the PD study for 16 months. 1,2 A 39-week nonrodent animal chronic toxicity study was designed to identify any toxic effects of CoQ10 at the maximum feasible dosage. To determine the dosage and formulation of CoQ10 for the 39-week chronic toxicity study, single- and repeated-dose studies in dogs were first performed.
Coenzyme Q10 (2,3 dimethoxy-5-methyl-6-decaprenylbenzoquinone), also known as ubiquinone (the oxidized form of CoQ10), is a lipid-soluble vitamin-like benzoquinone derivative, structurally similar to vitamin K. 3 Found in the inner mitochondrial membrane of most eukaryotic cells, its function is to act as an electron acceptor and donor in the electron transport chain for adenosine triphosphate (ATP) production and to buffer free radical damage during oxidative phosphorylation. In many neurodegenerative disorders, including PD and HD, there is strong evidence to suggest that mitochondrial dysfunction may play a role in pathogenesis 4 and CoQ10 is neuroprotective in animal models of HD, 5,6 PD, 7 Alzheimer disease, 8 and amyotrophic lateral sclerosis (ALS). 9 In a number of phase 2 safety and tolerability studies in individuals with inherited defects in CoQ10 production, and in individuals with ALS, PD, or HD receiving dosages up to 3600 mg/d of CoQ10, no evidence of toxicity has been detected. 10 –15
Materials and Methods
Overall Design of Toxicology Program
Three studies in dogs were conducted by Bozo Research Center, Inc (Shizuoka, Japan), a contractor of Kaneka Corporation (Osaka, Japan), in compliance with good laboratory practice regulations for the conduct of nonclinical studies on the safety of drugs, guidelines for toxicity studies by the Ministry of Health and Welfare, Japan, and animal welfare guidelines formulated by the Ministry of Environment, Japan, and the Science Council of Japan. Pharmacokinetic investigations were performed in all 3 studies. Two preliminary dose-range-finding studies were conducted to select appropriate dosages for the chronic toxicity study in dogs. The definitive chronic toxicity study was designed to test CoQ10 up to a maximum tolerated or a maximum feasible dose. In all studies the oxidized form of CoQ10, ubiquinone, was administered by oral gavage, and herein will be referred to as CoQ10.
The purpose of the first study was to examine the total plasma concentration profile after single administration of CoQ10 by gavage in 8 beagle dogs, at one of the following dosages: 600, 1200, 1800, or 2400 mg/kg per d (2 dogs per dosage group). The results were used to simulate total plasma CoQ10 concentration curves to predict plasma concentration, if CoQ10 were repeatedly administered daily. Using these simulated curves, the appropriate treatment period length for the repeated-dose study was predicted. The purpose of the second study was to examine the steady state plasma total CoQ10 concentration profile for 4 weeks and to select the dosages for the 39-week chronic toxicity study. This study involved a repeated dose of CoQ10 in a total of 8 male beagle dogs at one of the following dosages: 600, 1200, 1800, or 2400 mg/kg per d (2 dogs per dosage group). The highest dose that can be administered to dogs at one time is 1200 mg/kg. For ease of administration, animals in the 1800 or 2400 mg/kg per d groups received CoQ10 by gavage in 2 equally divided doses daily, approximately 6 hours apart. The purpose of the third study was to determine any toxic effects of CoQ10 at the maximum feasible dosage over a 39-week period. This study involved a chronic, repeated dose of 1 of 2 dosages, low and high, of CoQ10 in a total of 24 beagle dogs. The low dosage level for the 39-week chronic toxicity study was chosen as 1200 mg/kg, along with a high dosage level of 1800 mg/kg per d and a placebo group (4 dogs of each sex per dosage group). For ease of administration the 1800 mg/kg per d dosage was given by gavage in 2 equally divided doses per day, 6 hours apart.
Materials
CoQ10 was used in all of the studies described below, and was both manufactured and supplied by Kaneka Corporation (Osaka, Japan). In the single- and repeated-dose studies the purity of CoQ10 was 99.7% and in the chronic toxicity study it was 100%. This is the same product as is being used in the clinical trials in individuals with HD and PD.
Animals
All 3 studies used the Hazelton Research Animal (HRA) strain of beagle dog (Covance Research Products Inc, Virginia). Both the single- and repeated-dose studies used 8 male dogs, aged between 10 and 12 months and weighing between 8 and 11 kg at initiation of the treatment. The chronic toxicity study used equal numbers of male and female dogs all (24 in total) at 7 months of age, at the initiation of treatment. The males weighed between 7 and 10 kg and the females between 6 and 8 kg at the initiation of treatment. Animals were housed in individual metallic cages (W 900 × D 850 × H 750 mm, Shinetsu-Kanaami Corporation, Niigata, Japan). Environmental conditions for the animal rooms were maintained at a temperature of 22°C ± 4°C, a relative humidity of 55% ± 15%, air ventilation at 13 to 15 times per hour and lighting for 12 hours a day (07.00-19.00). Animals were given 300 g/d of a pelleted diet DS-A (Oriental Yeast Co, Ltd, Tokyo, Japan), at set times, except when they were fasted. Quarantine and acclimation periods were 1 to 2 weeks long, during which time animals were weighed weekly and checked daily for their appetite and general condition, including nutritional and fecal. Animals were allocated to dosage group by a computer-generated assignment system based on stratified weight to achieve identical group weight averages and avoiding assigning litter mates to the same group.
Dose Preparation
Dose calculations in all 3 studies were based upon the most recent body weights of each animal. Test article was prepared by filling gelatin capsules (½ ounce, Torpac Inc, New Jersey) with CoQ10. Animals in the control group received placebo in the form of empty gelatin capsules. CoQ10 preparations were mixed once or twice a week, with capsules kept in cases arranged by animal number and stored either frozen (at −20°C or at −35°C) for the preliminary studies or refrigerated (4°C) for the chronic toxicity study. All capsules were used within 7 days of preparation. Stability of CoQ10 filled capsules was verified at the end of each study using ubiquinone as a reference standard and CoQ7 as an internal standard.
Dose Administration—Single- and Repeated-Dose Studies
Both the single- and repeated-dose studies used dosages at 600, 1200, 1800, and 2400 mg/kg per d. Animals in the low- (600) and low-middle (1200)-dose groups received gelatin capsules once daily. To maintain animal welfare, animals in the high-middle- (1800) and high-dose (2400) groups received capsules twice daily, once in the morning and then approximately 6 hours later, because it was technically difficult to give CoQ10 in a single dose by gavage at dosages greater than 1200 mg/kg per d. Animals in the repeated-dose study received CoQ10 for a total of 4 weeks.
Dose Administration—Chronic Toxicity Study
Animals in the chronic toxicity study were given gelatin capsules by gavage for a total of 39 weeks. Males and females were equally divided into 3 groups, receiving 1 of 2 dosages of CoQ10, either 1200 or 1800 mg/kg per d, or placebo (empty gelatin capsules). Those in the 1200 mg/kg per d group received capsules once daily. Animals in the 1800 mg/kg per d group received capsules twice daily, 900 mg/kg once in the morning and then approximately 6 hours later, and those in the placebo group received empty gelatin capsules twice daily. Divided doses were given where it was technically difficult to give the test article in a single dose by gavage.
Clinical Observation and Examination
Animals in all 3 studies were examined by a veterinarian and observed for morbidity, by visual inspection and palpation, and mortality. Body weight was monitored in the morning and on a dosing day, before the first dosing. Body weights were not intended to be used in the evaluation of CoQ10 toxicity but as a means by which to calculate the correct dose for administration. One-day food consumption was calculated as the difference between the amount of feed supplied and that left uneaten. Daily food consumption (weekly mean value) was calculated from the cumulative food consumption in a week.
Clinical Observation—Single-Dose Study
Animals were observed for clinical signs according to the following schedule: on the day of administration (day 0) prior to dosing, immediately after dosing, 1, 2, 3, 4, 5, 6, 7, and 8 hours after dosing, and once daily during the observation period (days 1 to 3). Body weight was measured 1 week prior to administration (day −7), on the day before administration (day −1), and on the day of administration (day 0) prior to dosing. Food consumption was measured daily from 1 week prior to administration until the end of the study.
Clinical Observation—Repeated-Dose Study
Animals were observed for clinical signs according to the following schedule: once daily during the week prior to administration (days −7 to −1), 2 to 3 times daily during the administration period (days 1-28), and once daily after the end of the administration period for 3 days (days 29-31). Body weight was measured once during the week prior to administration, once on the starting day of administration, and once weekly throughout the administration period. Food consumption was measured daily from 1 week prior to administration until the end of the study.
Clinical Observation—Chronic Toxicity Study
Animals were observed for clinical signs according to the following schedule: once daily during the week prior to administration (days −7 to −1) and 2 to 3 times daily during the administration period (days 1-273). Body weight was measured once during the week prior to administration, once on the starting day of administration, once weekly throughout the administration period, and once on the day of necropsy (day 274), prior to the procedure. Food consumption was measured daily from 1 week prior to administration until the end of the study.
Pharmacokinetic Analysis
To determine CoQ10 concentration in plasma, 1.5 mL of blood samples were collected from the cephalic vein of all animals at each sampling time point. As the bioavailability of CoQ10 is enhanced by food, samples were taken without prior overnight fasting of animals. Samples were collected in tubes containing heparin sodium (Venoject II, VP-H052K; Termo Corporation Ltd, Tokyo, Japan), cooled in ice, centrifuged (approximately 1600g for 10 minutes) to harvest plasma (0.5 mL), and stored frozen at −20°C until analysis. Plasma ubiquinone was then identified by a high-performance liquid chromatography (HPLC) method, modified and validated for support of this study. 16 Pharmacokinetic analysis of the data included, if appropriate, determinations of maximum concentration ([C max] μg/mL), time to reach the maximum concentration ([T max] hours), area under the curve (AUC0-72h) versus time curve (μg h/mL), and the elimination half-life (T ½; hours).
In the single- and repeated-dose studies, pharmacokinetic parameters were calculated using the one-compartment model of WinNonlin (version 5.0.1, Pharsight Corporation, Thousand Oaks, CA, USA). In the chronic toxicity study, the mean and standard deviation (SD) of these parameters were calculated for each group (placebo, low dose, and high dose) at each time point. On day 1 and at week 39 C max and T max were determined from the measured values, and the AUC0-72h was calculated by the trapezoidal method. 17
Pharmacokinetic Sampling Schedule
In the single-dose study, plasma samples for pharmacokinetic analysis were collected pre-dose and then at 2, 4, 8, 10, 24, 34, 48, 58, and 72 hours after dosing. In the repeated-dose study plasma samples were collected at the following time points: pre-dose and at 4, 8, and 24 hours after first capsule administration on days 1, 7, 21, and 24, and pre-dose and at 4, 8, 24, 34, 48, 58, and 72 hours after first capsule administration on day 28. In the chronic toxicity study plasma samples were collected on days 1 and 273 (week 39), at the following time points: pre-dose and 1, 4, 8, and 24 hours after first capsule administration of the day (ie, 5 sampling time points). On days 91 (week 13) and 182 (week 26) sampling time points were pre-dose and at 4 and 24 hours after first capsule administration of the day.
Standard Toxicological Examinations—Chronic Toxicity Study
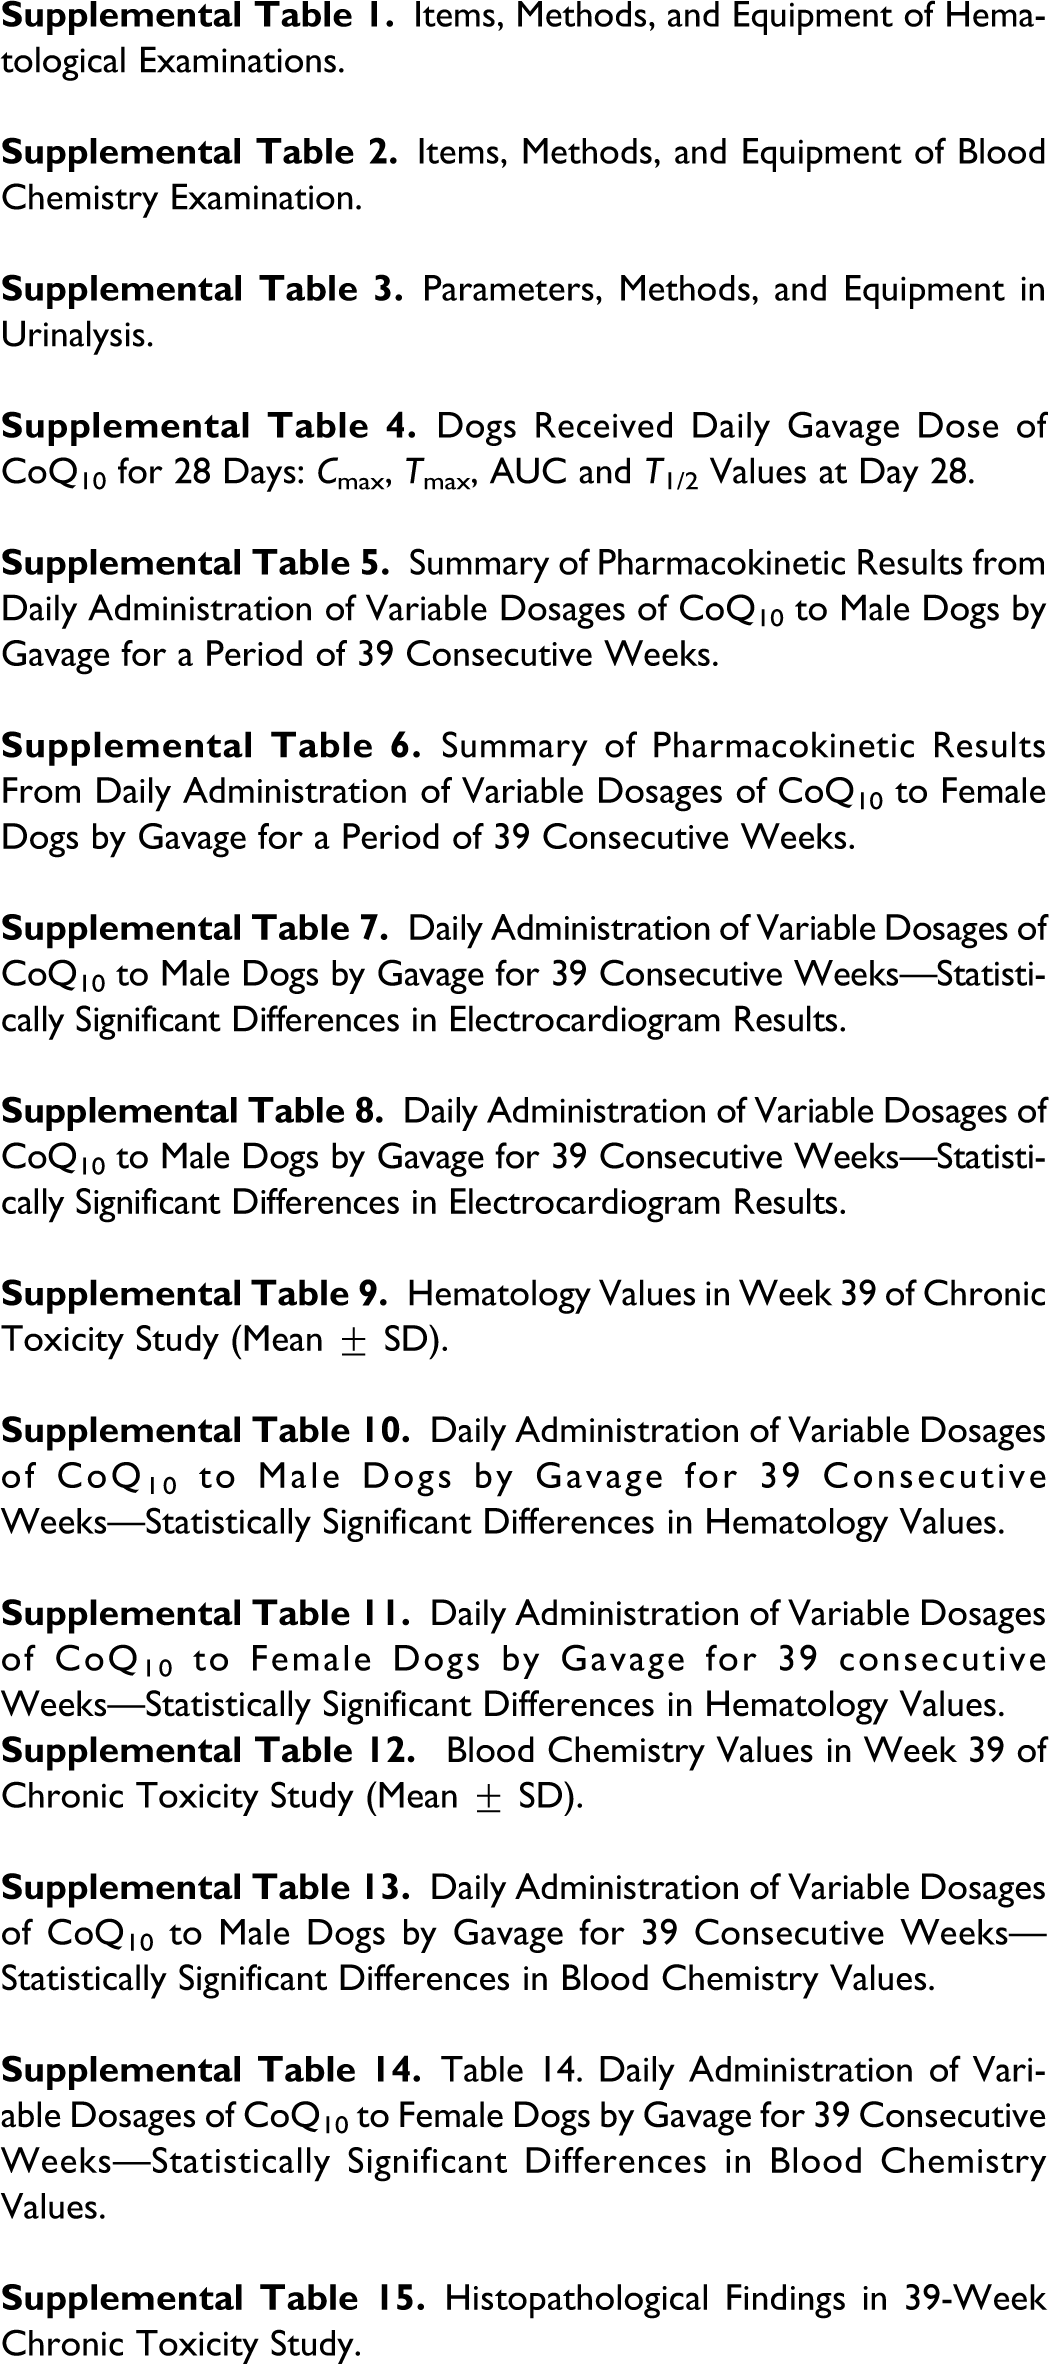
Additional monitoring performed in the chronic toxicity study consisted of standard toxicological examinations conducted in accordance with the guidelines formulated by the Ministry of Health and Welfare, Japan. 18 –20 These standard examinations included electrocardiographic (ECG) and ophthalmologic examinations, and standard laboratory tests for safety including urinalysis, hematological, and blood chemistry including liver enzyme analysis (Supplemental Tables 1, 2, and 3). All were performed once in a week prior to administration and 3 times during the administration period (weeks 13, 26, and 39) prior to the first dosing of the day. Continuously fresh urine was collected for about 4 hours prior to the first dosing, while the animals were deprived of food and water. Cumulative urine was collected for approximately 16 hours, with food and water being provided ad libitum. Blood samples for hematology and chemistry were collected from the cephalic vein of all animals after an overnight fast and before dosing. For hematological analysis blood was collected in tubes containing EDTA-2K (SB-41: Sysmex Corporation, Hyogo, Japan). For coagulation analysis, blood was collected in tubes containing 3.8% sodium citrate, and for chemistry analysis blood was collected in tubes containing heparin sodium (Ajinomoto Pharma Co, Ltd, Japan).
Anatomical Pathology
At the end of the chronic toxicity study all animals were sacrificed and a necropsy was performed. On the day of final administration, all surviving animals were fasted for at least 16 hours. On the day of necropsy (day 274), the animals were anesthetized with pentobarbital sodium solution (20-30 mg/kg; Tokyo Kasei Kogyo Co, Ltd, Tokyo, Japan) and pathological necropsy was performed as soon as possible after they die.
For all animals, brain (the cerebrum, cerebellum, and medulla oblongata), pituitary, thyroid, adrenal glands, thymus, spleen, heart, lungs, submandibular glands, liver with gallbladder, pancreas, kidneys, testes/ovaries, epididymis, and prostate/uterus were weighed. Paired organs were weighed separately. Organ weight/body weight ratio was calculated based on an animal’s terminal weight. Forty-four organs/tissues of male dogs and 44 organs/tissues of female dogs were fixed in phosphate buffered 10 v/v% formalin. Eyes and optic nerves were fixed in phosphate-buffered 3 v/v% glutaraldehyde/2.5 v/v% formalin. Testes and epididymis were fixed in Bouin solution. All organs were preserved in phosphate-buffered 10 v/v% formalin, embedded in paraffin, sectioned, stained with hematoxylin and eosin (H&E), and examined histopathologically.
Statistical Analyses—Single- and Repeated-Dose Studies
Statistical analysis was not performed in either preliminary study due to the small sample sizes. Evaluation was done on an individual basis in these studies.
Statistical Analysis—Chronic Toxicity Study
All data collected (body weight, food consumption, pharmacokinetic analysis, ECG [except electric axis], urinalysis [urine volume, osmolality, and urine electrolytes], hematology, blood chemistry, and organ weight) were recorded numerically. The numerical data were used to calculate the mean ± SD for each group (placebo, low dose, and high dose) at each time point and then statistically analyzed using multiple comparisons. Bartlett's test (analysis of variance [ANOVA] was initially performed to test the variance homogeneity. 21 If the ANOVA was significant Dunnett's multiple comparison t test was used to determine pairwise comparisons between the control group (placebo) and the treatment groups (low dose and high dose). 22 If samples were from heterogeneous populations, that is with unequal variances a Dunnett-type mean rank test was performed relative to the control group. In each of the statistical tests mentioned above, a 2-tailed test was used and P values of <.05 were considered statistically significant.
Results
Single-Dose Study—Pharmacokinetic Analysis
Prior to the single dosing, plasma total CoQ10 concentrations ranged from 0.3 to 0.8 μg/mL. After dosing, plasma total CoQ10 concentration increased in all animals, excluding 1 at 600 mg/kg. The reason for this is unclear as a dosing error was unlikely; and unchanged capsule, indicating lack of dissolution in the stomach or intestine, was not observed in the stools of these animals. The concentration of total CoQ10 in plasma reached C max between 8 and 24 hours and thereafter decreased, but higher than baseline levels were still detected in plasma 72 hours after dosing in all animals. There were no apparent dose responses in the C max and AUC0-72h in the 1200, 1800, and 2400 mg/kg per d groups (Figure 1 ), suggesting nonlinear kinetics and saturated gastrointestinal absorption. Based on the plasma concentrations measured, total CoQ10 concentration over time curves were simulated using the one-compartment model of WinNonlin (version 5.0.1; Pharsight Corporation) for a repeated dosing schedule at all dosages levels. The simulated curves predicted plasma CoQ10 should reach steady state after 3 or 4 weeks. It was therefore judged that the appropriate treatment period for the repeated-dose study should be 4 weeks.
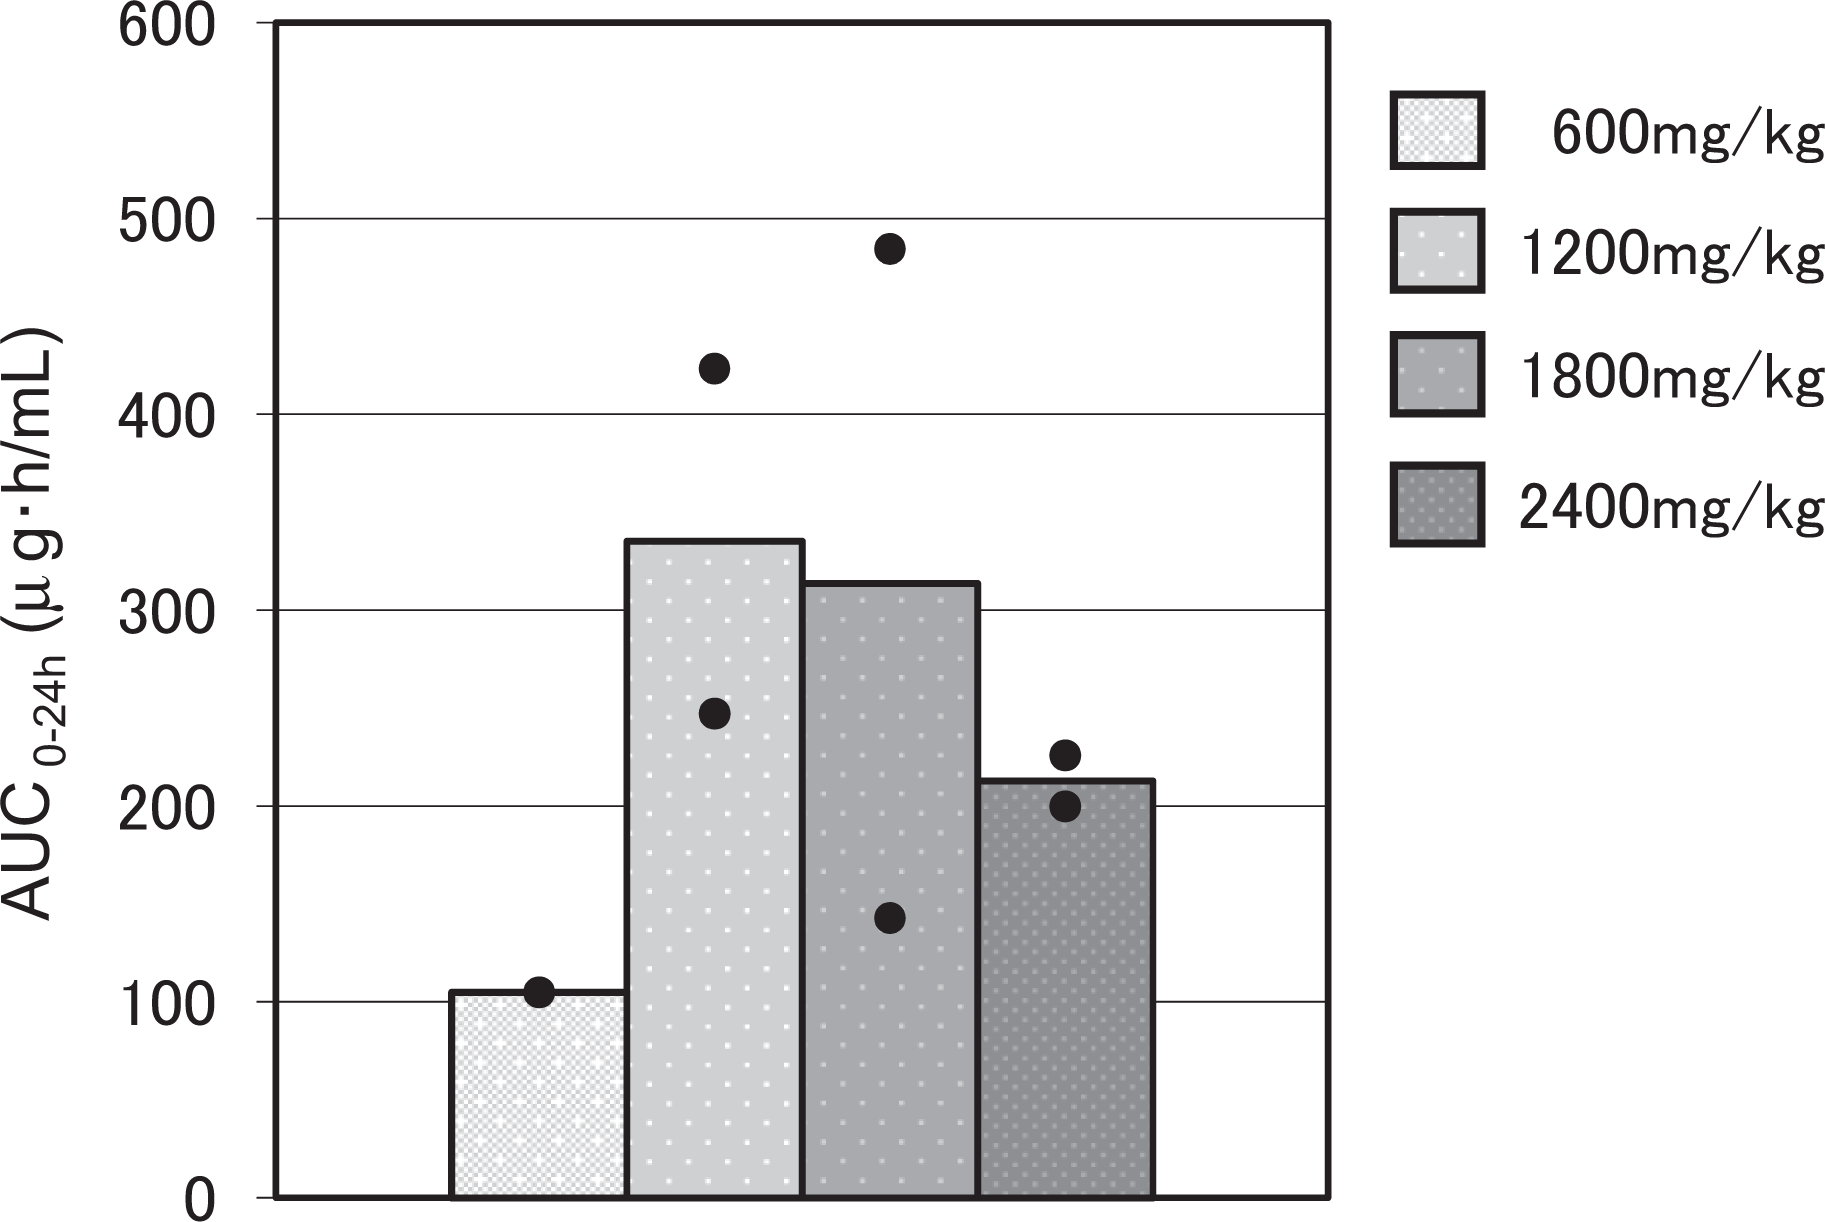
Area under the curve (AUC) values in dogs administered a single dose of coenzyme Q10 (CoQ10) at 600, 1200, 1800, and 2400 mg/kg by gavage. Bars denote mean value and dots denote individual values of 2 animals per dosage group, except in the 600 mg/kg dosage group where 1 animal showed abnormal plasma concentration, likely due to a dosing error (value not shown).
Single-Dose Study—Clinical Observations and Examinations
Stool containing test article-like material was observed only once in the time period between 6 hours after dosing on day 0 and the following day, day 1, in all animals excluding 1 in the 1800 mg/kg group. Body weights of the animals on the day of administration ranged from 8.5 to 10.3 kg. The orange color of stools was thought to be due to the presence of the orange-colored CoQ10 test article and was not considered to be a toxic response. This was noted by observation only and not by any further evaluation. No significant changes were noted in food consumption in any animal at any dose.
Repeated-Dose Study—Pharmacokinetic Analysis
Prior to the first dosing of the day, plasma total CoQ10 concentration was detected in all animals on days 1, 7, 14, 21, and 28. Steady state was reached after 2 weeks in all dosage groups (Table 1 ). The pharmacokinetic parameters C max and AUC0-72h on day 28 increased with increasing dosage of CoQ10, between 600 and 1800 mg/kg per d. No further increase was seen with the 2400 mg/kg per d dosage (Figure 2 and Supplemental Table 4). The highest plasma total CoQ10 levels were therefore recorded at 1800 mg/kg per d, with no apparent toxic changes observed in this group. A dose of 1800 mg/kg per d (900 mg/kg per d twice daily) was therefore considered to be the highest appropriate level for the chronic toxicity study. Levels of CoQ10 higher than those at baseline were still detected in plasma 72 hours after dosing in all animals. To check data variability, plasma CoQ10 concentrations were compared between animals within respective dosage groups using nonparametric ANOVA (Kruskal-Wallis). 23 All P values for H (Kruskal-Wallis) were estimated by a chi-square test (χ 2 ) with 3 degrees of freedom (df). The following nonsignificant P values were obtained: day 1, χ 2 = 5.17, with 3 df, P = .160, day 7, χ2 = 5.50, with 3 df, P = .139, day 14, χ2 = 5.17, with 3 df, P = .1600, day 21, χ2 = 6.00, with 3 df, P = .112, day 28, χ2 = 6.00, with 3 df, P = .112. The null hypothesis that samples came from identical populations could not be rejected; however, due to the small sample size (n = 2) in each dosage group the statistical validity of this data was not considered meaningful.
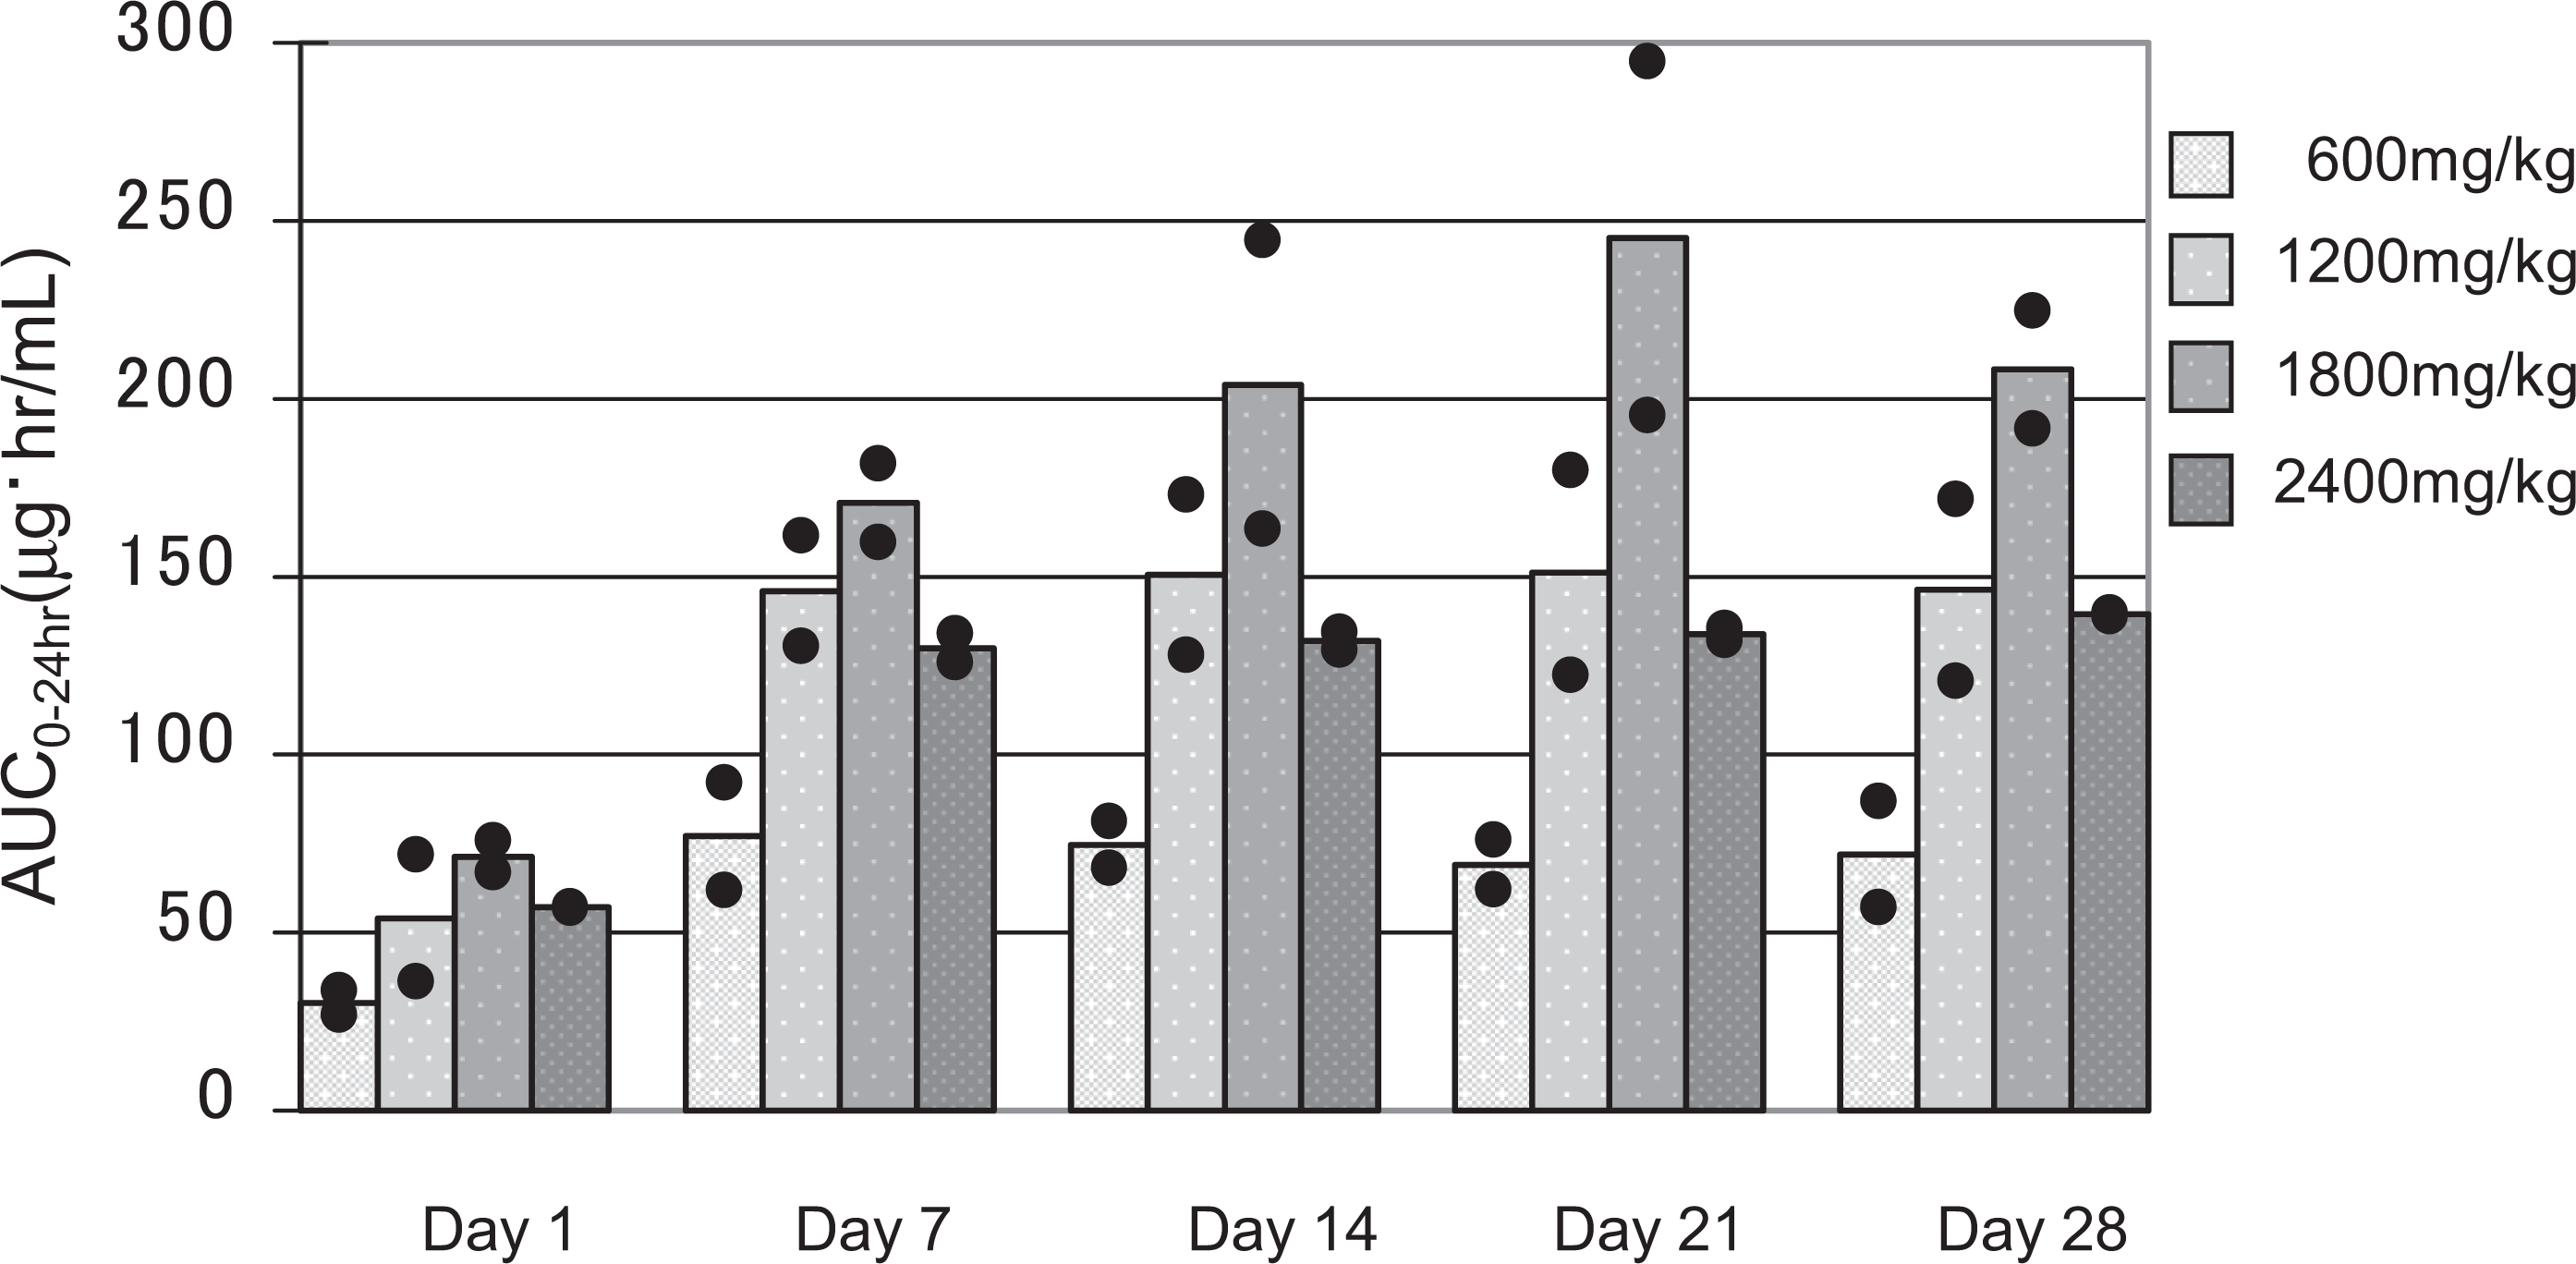
Area under the curve (AUC) values in dogs administered 600, 1200, 1800, and 2400 mg/kg of coenzyme Q10 (CoQ10) daily by gavage for 28 consecutive days. Bars denote mean values and dots denote individual values of 2 animals per dosage group.
Dogs Received Daily Gavage Dose of CoQ10 for 28 days: AUC0-24 h Determinations at Various Intervals a
Abbreviations: AUC, area under the curve; CoQ10, coenzyme Q10.
a Steady state AUC was reached after 2 weeks in all dosage groups. Each value shows the mean of 2 animals.
Repeated-Dose Study—Clinical Observations and Examinations
Stool containing test article-like material was observed in all animals from day 2 of administration throughout the administration period and 1 day after the end of administration. Mucous stool, that is stool containing a mucoid substance, but not orange in color, was observed in 2 animals in the 600 and 1800 mg/kg per d groups during the administration period and once in 1 animal in the 1800 mg/kg per d group on day 3 after the end of administration. Vomiting was noted in 3 animals during the administration period, 2 in the 600 mg/kg per day group and 1 in the 1200 mg/kg per d group. There were no significant changes noted in body weight or food consumption in any group.
Chronic Toxicity Study—Pharmacokinetic Analysis
Pretreatment plasma total CoQ10, on day 1 prior to first dosing, was detected in all animals in both treatment groups and the placebo group, with comparable levels in all groups. In the control group, plasma total CoQ10 was detected in all animals at all measurement time points at weeks 13, 26, and 39.
The mean T max in both sexes on day 1 ranged from 16.0 to 24.0 hours after administration of CoQ10, whereas the mean T max at week 39 was markedly shorter in both sexes, ranging from 2.0 to 6.0 hours. On day 1 both treatment groups had similar mean C max values and similar mean AUC0-72h values. There was no apparent dose dependency between the high-and low-dosage groups. At week 39, the mean C max and AUC0-72h were again similar in both treatment groups, but these pharmacokinetic parameters were 2 to 4 times higher than those on day 1 in both groups, indicating accumulation. In summary, after repeated dosing, the mean C max and AUC0-72h increased at both 1200 and 1800 mg/kg dosages and the T max shortened. No apparent gender differences were noted between the high-and low-dosage groups in mean T max, C max, or AUC0-72h throughout the study (Supplemental Tables 5 and 6 and Figures 3 to 5).
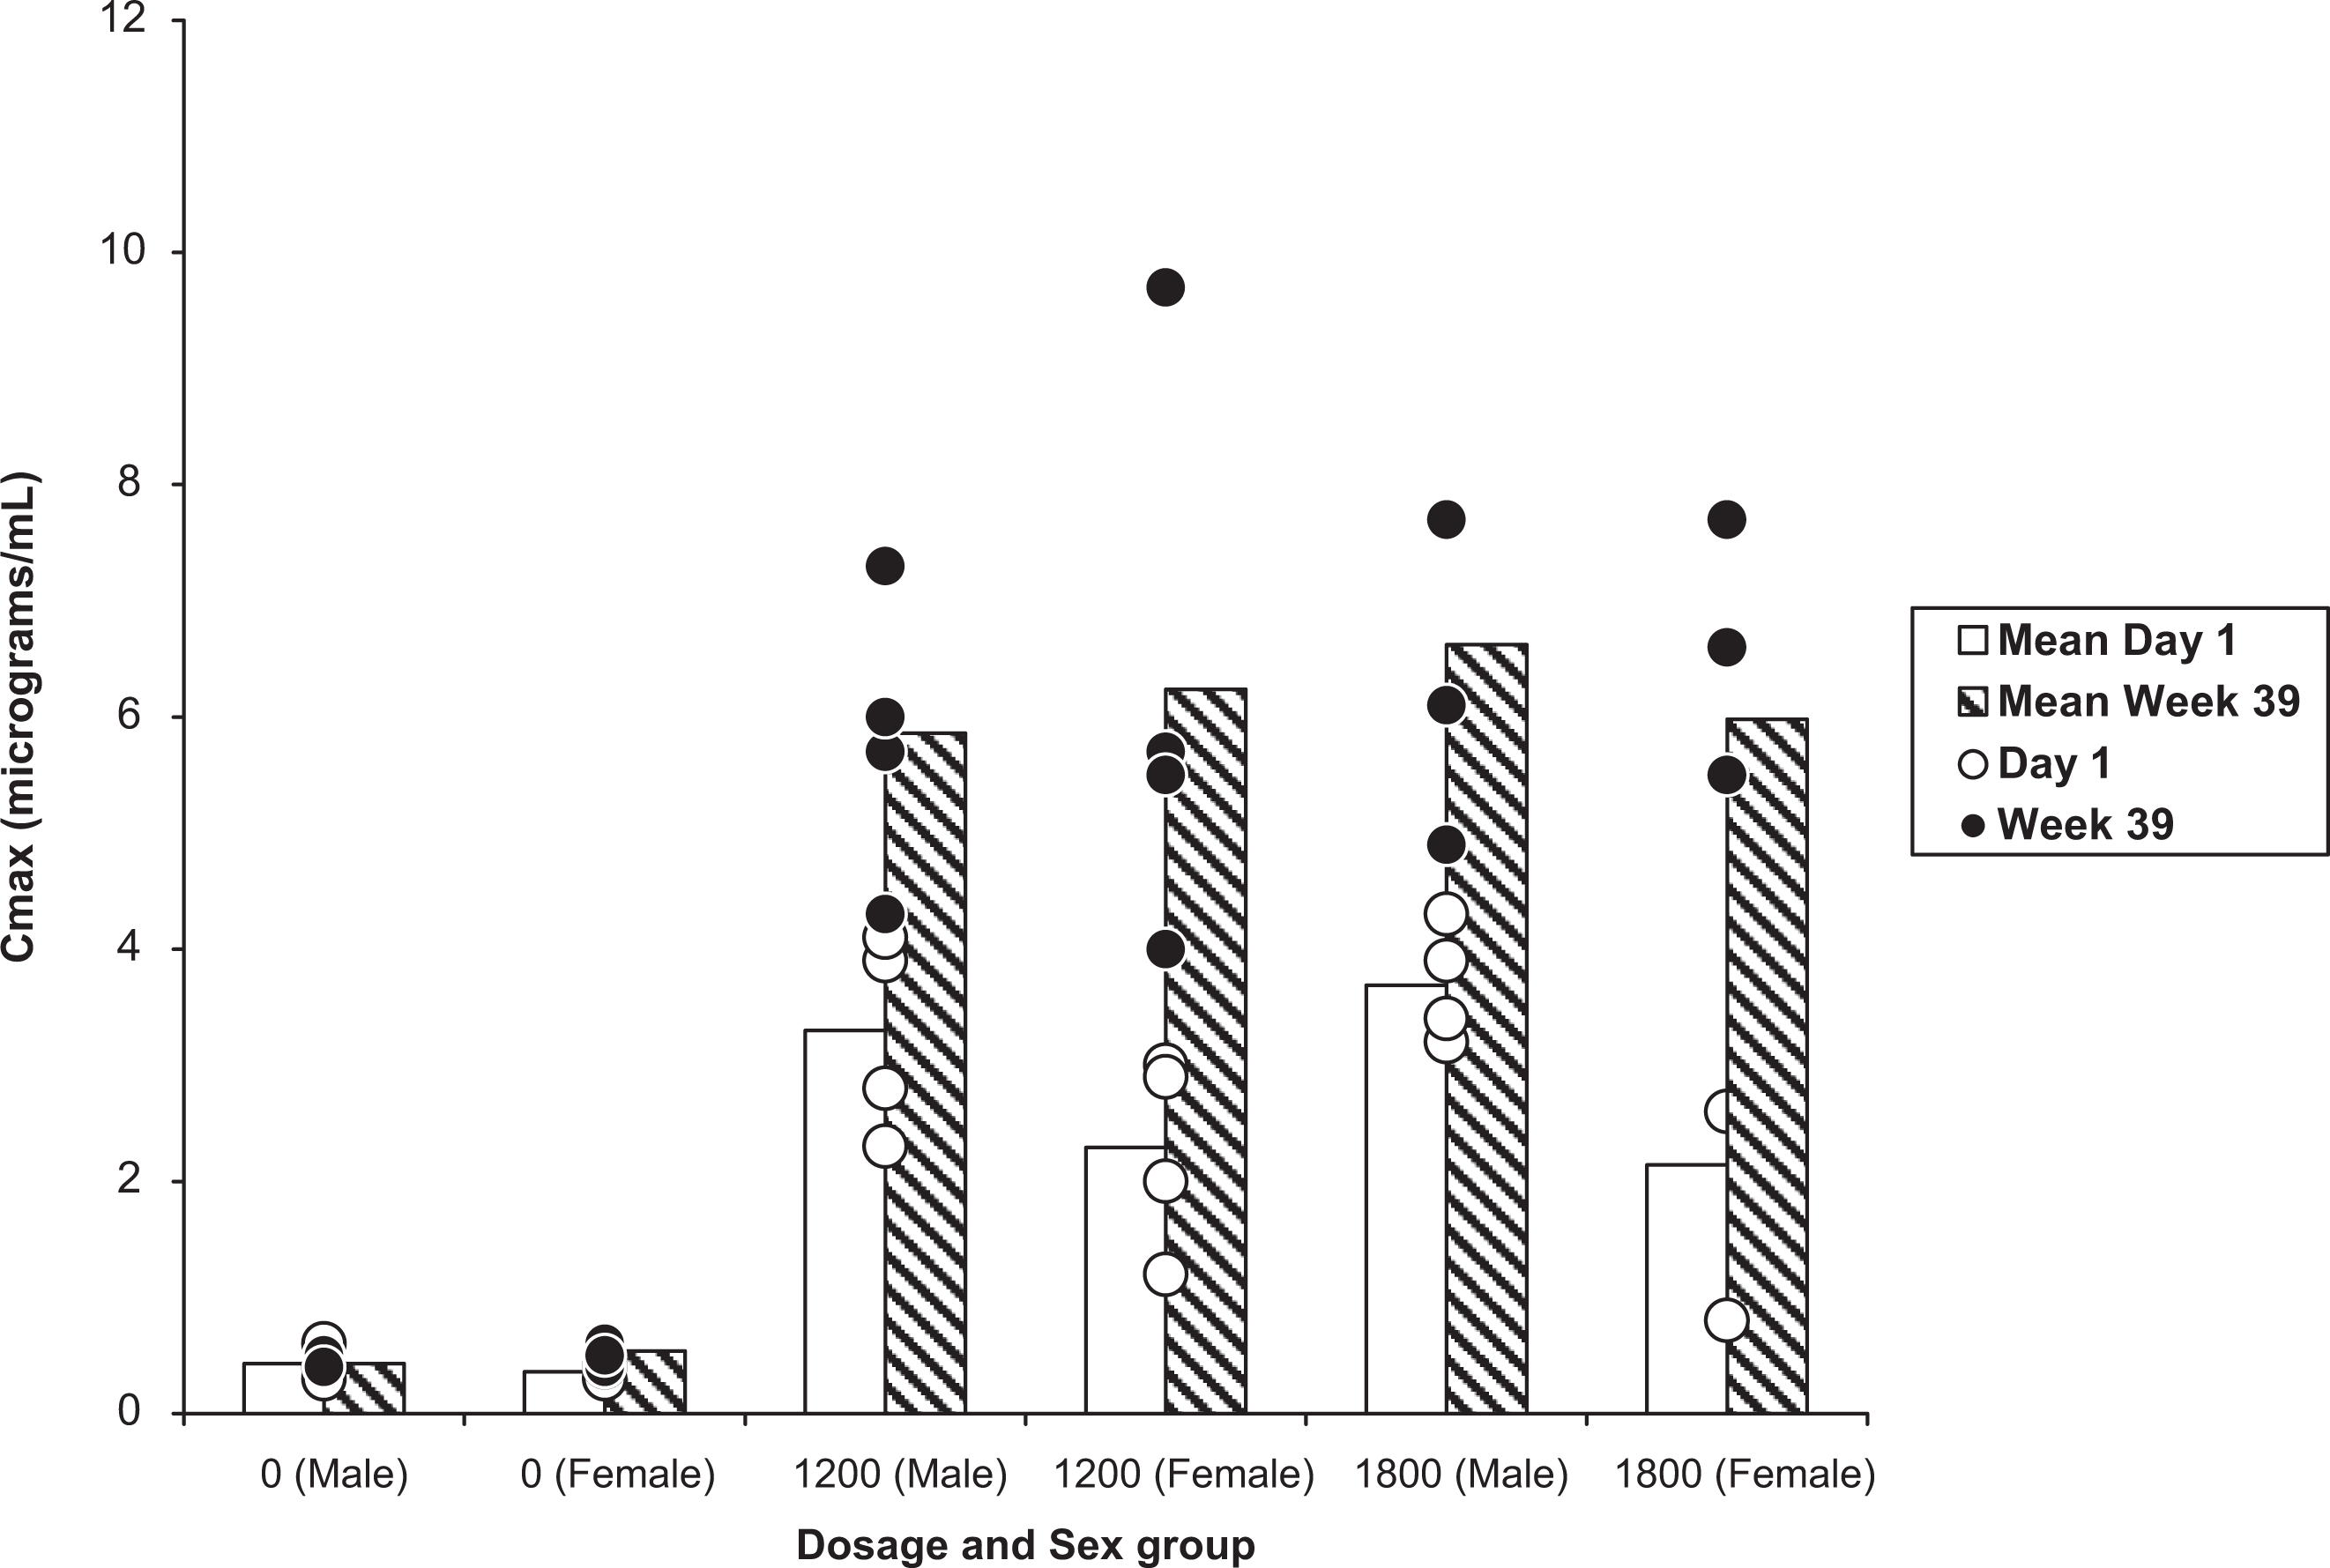
Maximum concentration (C max) values at day 1 and at week 39 in male and female dogs administered placebo, 1200 or 1800 mg/kg of coenzyme Q10 (CoQ10) daily by gavage for 39 weeks. C max was greater at week 39 than at day 1. Bars denote mean values and dots denote individual values of 4 animals per dosage group.
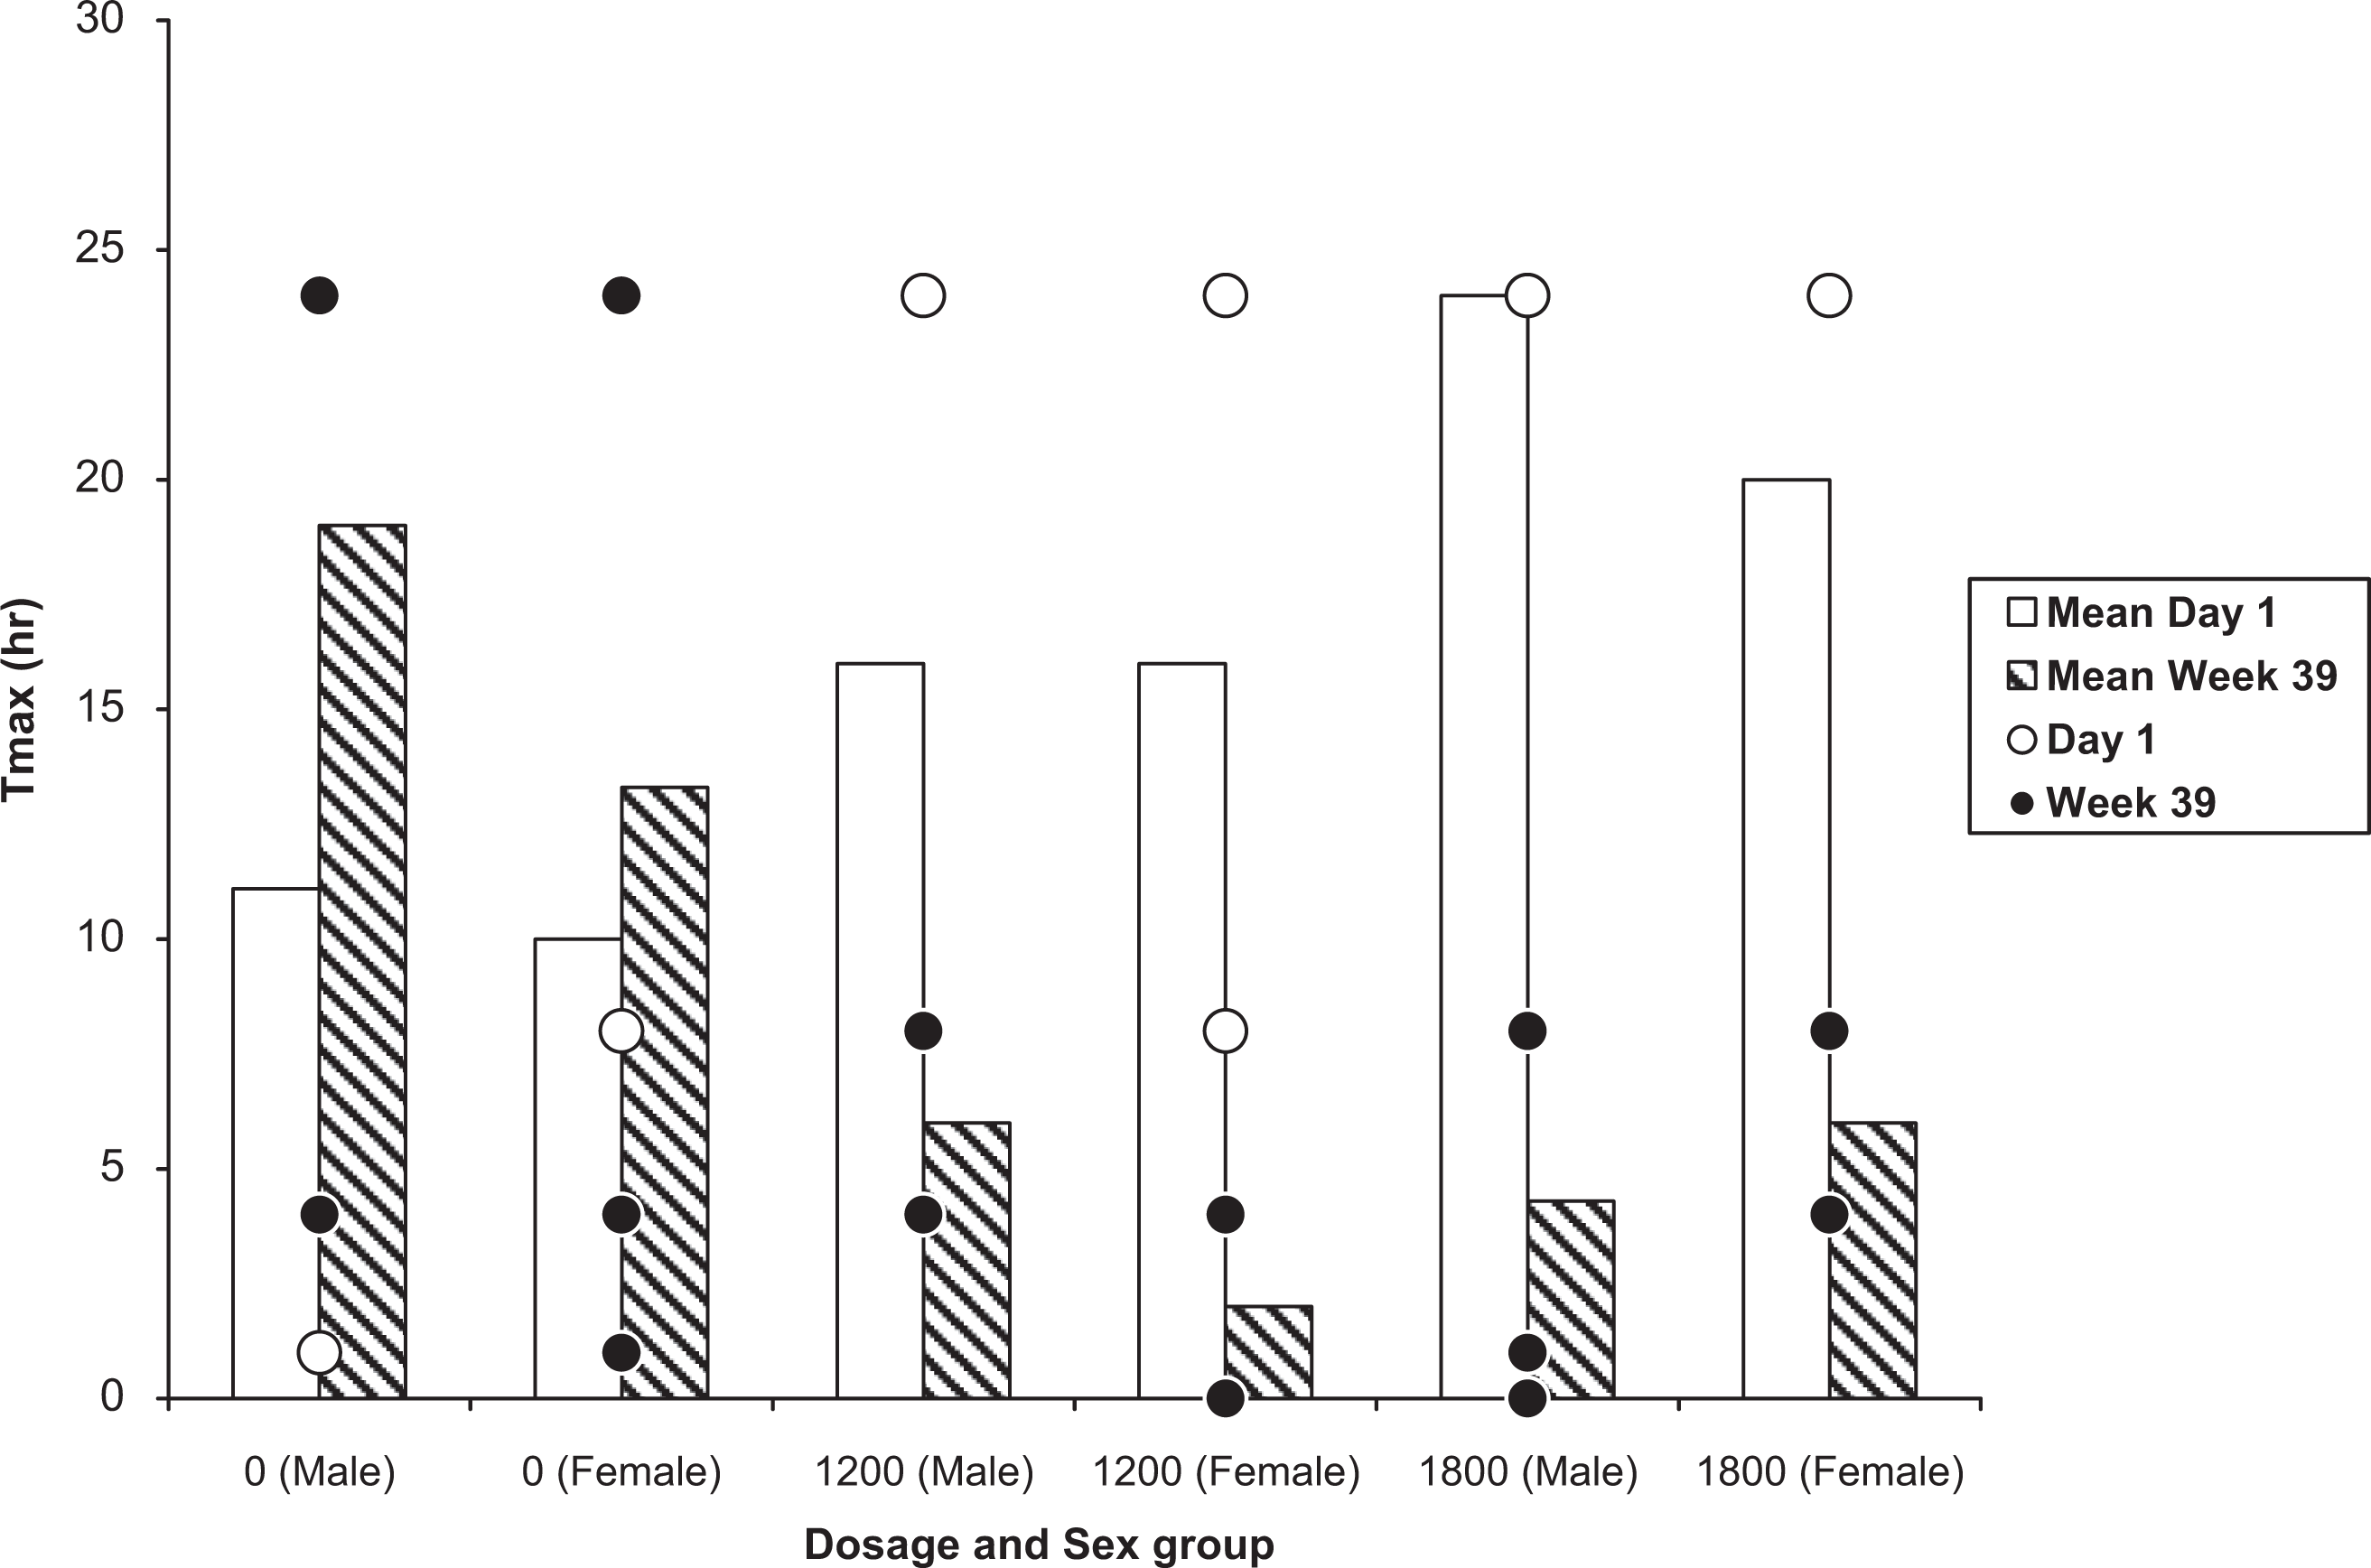
Time to reach the maximum concentration (T max) values at day 1 and at week 39 in male and female dogs administered placebo, 1200 mg/kg, or 1800 mg/kg of coenzyme Q10 (CoQ10) daily by gavage for 39 weeks. T max was shorter at week 39 than at day 1. Bars denote mean values and dots denote individual values of 4 animals per dosage group.
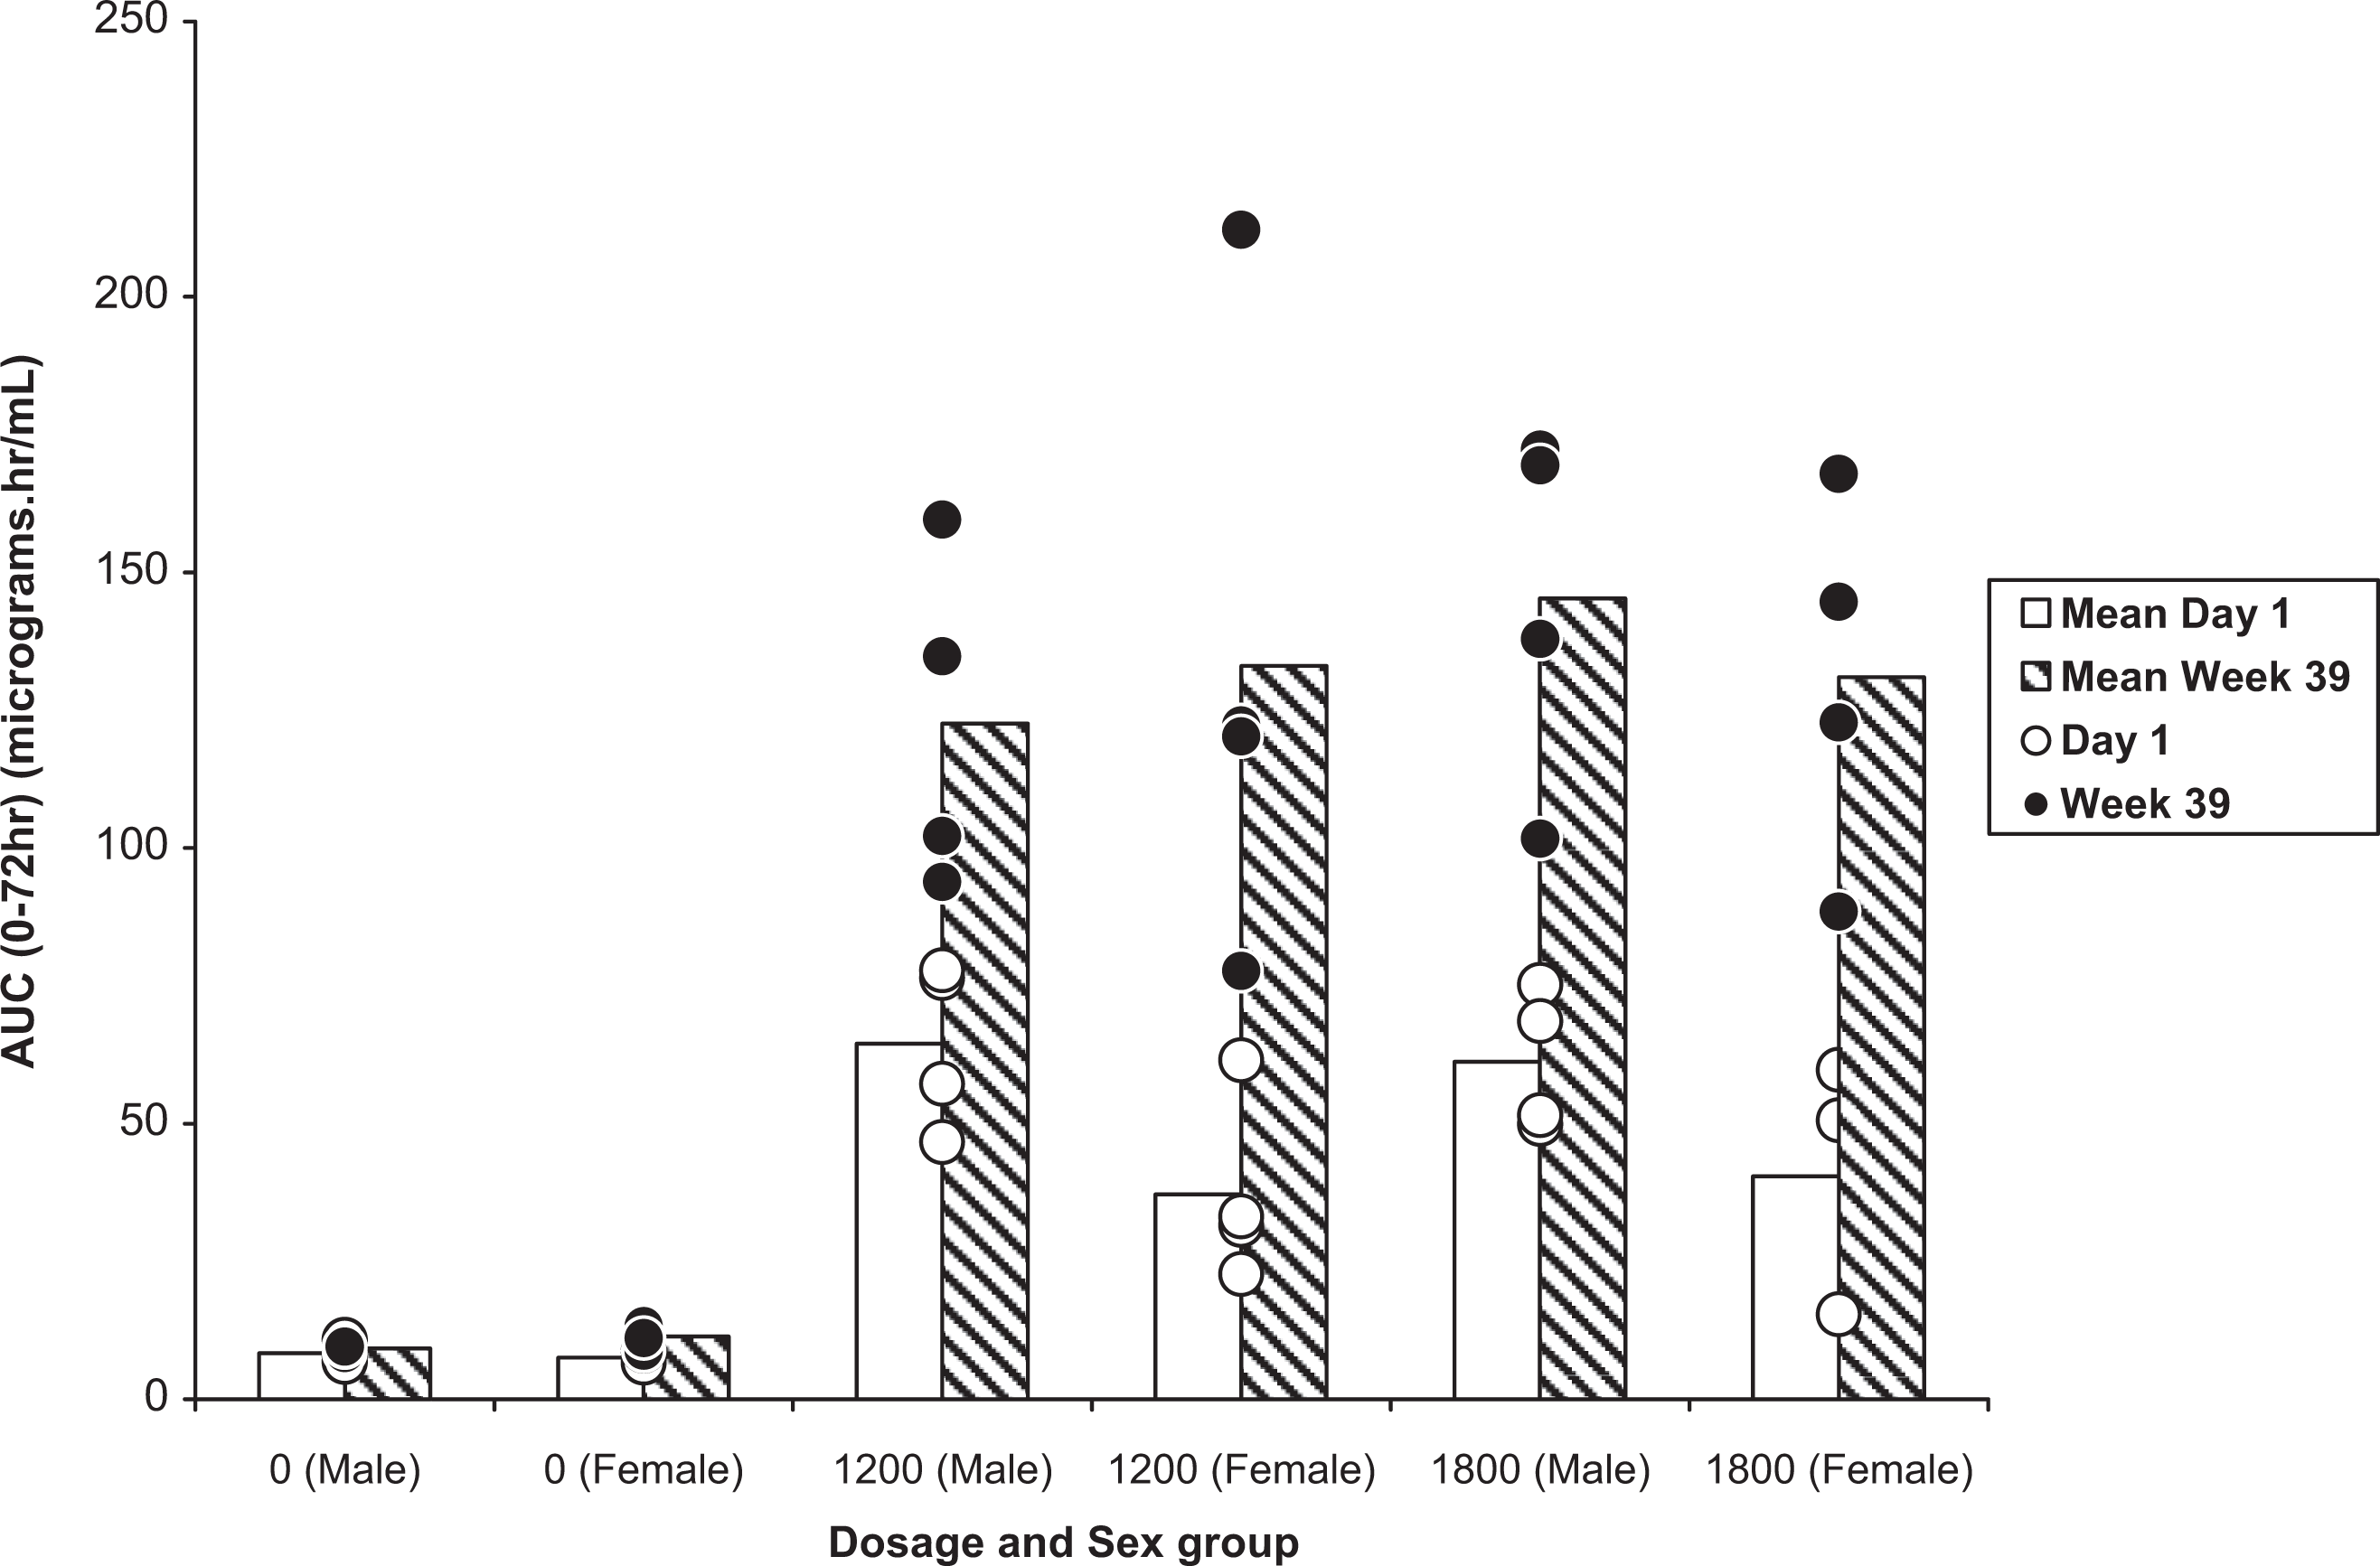
Area under the curve (AUC) values at day 1 and at week 39 in male and female dogs administered placebo, 1200 mg/kg, or 1800 mg/kg of coenzyme Q10 (CoQ10) daily by gavage for 39 weeks. AUC was greater at week 39 than at day 1. Bars denote mean values and dots denote individual values of 4 animals per dosage group.
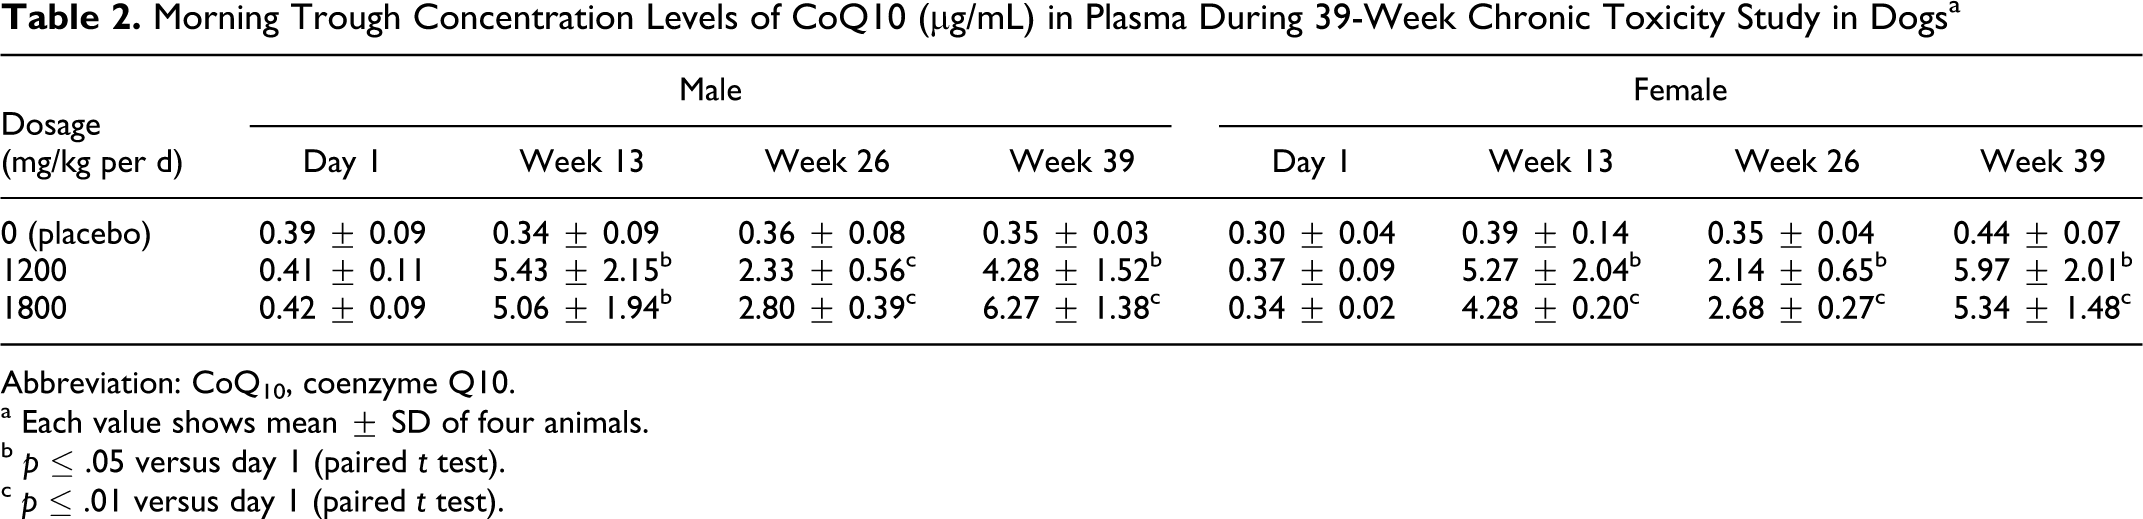
Determination of mean plasma levels of total CoQ10 at week 13 in both treatment groups revealed a gradual elevation of plasma concentration from day 1, in both sexes, at all measurement time points, and the values (pre-dose, 4, and 24 hours after dosing) at week 13 reached levels detected at week 39. Both C max and AUC0-72h were not determined at either the week 13 or week 26 time point, however trough levels of plasma CoQ10, the lowest concentration that a drug reaches in the plasma before the next dose is administered, were measured and the levels reached at week 13 were similar to those detected at week 39 (Table 2 ). No samples were taken between day 1 and week 13 of study. We therefore do not have data to demonstrate the achievement of steady state in plasma; however the findings presented above suggest plasma levels of total CoQ10 had reached steady state by week 13. Simulation of the single-dose study results demonstrated steady state in plasma should be reached after 3 or 4 weeks and results of the repeated-dose study showed steady state was reached after 2 weeks at all dosages (Table 1). It was therefore considered likely that steady-state would have been achieved by the week 13 time point in the chronic toxicity study.
Morning Trough Concentration Levels of CoQ10 (μg/mL) in Plasma During 39-Week Chronic Toxicity Study in Dogs a
Abbreviation: CoQ10, coenzyme Q10.
a Each value shows mean
b p ≤ .05 versus day 1 (paired t test).
c p ≤ .01 versus day 1 (paired t test).
Chronic Toxicity Study—Clinical Observations and Examinations
No deaths or untoward events were observed in any group. Stool containing test-like article was observed frequently in all male and female dogs in the 1200 and 1800 mg/kg per d groups throughout the treatment period. This was thought to be due to the excretion of unabsorbed test article in stools. Mucous stool was observed sporadically in 1 male and 1 female in the 1800 mg/kg per d group. Vomiting was observed in 1 male and 3 females in the 1200 mg/kg per d group and in all males and 3 females in the 1800 mg/kg per d group. For the first 6 weeks, vomitus containing test article-like substance was noted in 1 female in the 1200 mg/kg per d group and in 3 males in the 1800 mg/kg group. These findings were not considered to be significant.
Mean body weight gain (male/female) during the administration period in the control, 1200, and 1800 mg/kg per d groups was 2.2/1.2, 2.1/1.1, and 1.8/1.3 kg, respectively. There were no statistically significant differences in mean body weight and food consumption between the 1200 and 1800 mg/kg per d groups and the control group.
Chronic Toxicity Study—Standard Toxicological Examinations
Ophthalmology
No treatment-related changes were detected during ophthalmologic examinations in any group.
Electrocardiography
A decrease in heart rate, lower than the value observed in the week prior to administration, by at least 30% was recorded in 2 males and 1 female in the 1200 mg/kg per d group at week 39. This finding was not considered to be toxicologically significant since there were no changes in any other parameter, and corresponding histopathological examination revealed no organic changes in the heart.
The following changes were considered to be incidental, as they were similar to their respective pretreatment values: prolongation of the QRS complex (P < .05) in females in the 1200 mg/kg per d group at week 13; a low value for the QT interval (P < .05) in males in the 1200 mg/kg per d group at week 26, and in females in the 1200 mg/kg per d group at week 39. These ECG changes were found to be statistically but not toxicologically significant from placebo at corresponding time points, because the placebo values at these respective time points had also changed from their pretreatment values (Supplemental Tables 7 and 8).
Urinalysis
A positive occult blood and erythrocyte in sediment were detected in 2 females in the control group, 2 females in the 1200 mg/kg per d group, and 1 female in the 1800 mg/kg per d group at weeks 13, 26, and 39. These findings were thought to be related to estrus hemorrhage.
Hematology
Increased eosinophils, both in ratio and count, were observed in males in the 1800 mg/kg per d group at weeks 26 and 39. The value at week 26 was determined to be statistically (P < .05) but not toxicologically significant due to the absence of changes in other leukocytic parameters. A high value for basophils (P < .05, in ratio) was observed in females in the 1200 mg/kg per d group at week 26, however the value was similar to that of the pretreatment (Supplemental Tables 9, 10, and 11).
Blood Chemistry
An increase in blood urea nitrogen (BUN) was observed in 1 male in the 1200 mg/kg per d group at week 39. This change was observed in only 1 animal with no other corresponding BUN-related abnormalities. The following statistically significant abnormalities were not considered to be toxicologically significant as they were similar to their respective pretreatment values and remained within normal range: a low value for glucose (P < .05) in males in the 1800 mg/kg per d group at week 39; a high value for BUN (P < .05) in males in the 1800 mg/kg per d group at week 26; a low value for chloride (P < .05) in males in the 1200 mg/kg per d group at week 13 (Supplemental Tables 12, 13, and 14).
Postmortem Data
Gross pathological findings
A white focus was observed in the lungs of 1 female in the control group and 1 male in the 1200 mg/kg per d group. One male in the control group was found to have hypoplasia of the epididymis. These gross pathological findings were not considered toxicologically significant.
Histopathological findings
Only minimal or mild changes were observed in some organs/tissues of some animals (Supplemental Table 15). These were judged to be incidental based on their pathological nature or feature of occurrence.
In summary there were neither deaths nor CoQ10-related adverse events during the administration and observation periods. No toxicologically significant changes were observed in body weight, food consumption, ophthalmology, ECG, urinalysis, hematology, blood chemistry, gross pathology, organ weight, and histopathology.
Discussion
Multiple studies have been conducted to assess the safety and tolerability of high doses of CoQ10 in humans. 10 –13,15,24 –29 In a 28-participant tolerability trial assessing 1200, 2400, and 3600 mg/d of CoQ10, 20 participants with HD and 8 healthy participants received 4 weeks at 1200 mg/d, followed by 4 weeks at 2400 mg/d and were then maintained on 3600 mg/d for 12 weeks. 13 Coenzyme Q10 was well tolerated with 82% of participants achieving the target maximum dosage. In an open-label pilot study, the safety and tolerability of high-dose CoQ10 in 17 participants with mild PD was examined. 15 Escalating dosages of CoQ10 at 1200, 1800, 2400, and 3000 mg/d were administered with vitamin E 1200 IU daily. Maximum exposure was 2 months with 1 month at 2400 mg/d or 3000 mg/d. CoQ10 levels were measured after each dose and were found to reach a plateau at the 2400 mg/d dosage. No further increase was detected at the 3000 mg/d dosage. It was concluded that the appropriate dose to test in future efficacy studies should be 2400 mg/d. Similar conclusions were reached in studies of HD 13 and ALS. 11 Much of the available published data on clinical trials of CoQ10 at dosages ranging from 30 to 3000 mg/d has been previously reviewed. 30,31 Adverse effects do not follow a consistent pattern and there is no relationship with adverse events and increasing dosage of CoQ10 in any previous trial. These studies support the strategy of using the highest well-tolerated dosage of CoQ10 that has an incremental biological effect (ie, increases blood levels of CoQ10).
In a previous contract research study performed by the Kaneka Corporation, the reduced form of CoQ10, ubiquinol, was administered by gavage to 6 beagle dogs per dose for 13 weeks at dosages of 0, 150, 300, and 600 mg/kg per d, with 1 dosage of the oxidized form of CoQ10, ubiquinone, at 600 mg/kg per day. 32 The concentration of CoQ10 in plasma increased in a dose-related manner from day 1 to week 7 and then remained at steady state until week 13. The no-observed adverse effect (NOAEL) was estimated to be more than 600 mg/kg per d for male and female dogs. Two further rat studies, one 13-week and one 52-week toxicity study, showed that dosages up to 1200 mg/kg per d administered by gavage were well tolerated with no deaths or toxicological side effects over both 13- and 52-week study periods. Histopathology of the treated rats was normal except for some exudate in the nasal turbinates and lung granulomas attributed to incidental exposure to crystallized test material. Although these preclinical studies had been submitted to the regulatory authorities as evidence to support the phase 3 human trial of CoQ10 in people with HD, it was not deemed adequate to support such a long (60 months) and large (n = 608), clinical trial. 33,34 Three studies of CoQ10 in beagle dogs were therefore conducted with 2 shorter preliminary dog studies designed to confirm the appropriate dosage for the longer, 39-week, dog study. Dogs were chosen as they are widely used in safety studies in pharmaceuticals and are suitable for time-course examinations. In addition, the predominant form of endogenous CoQ in dogs is, as in humans, CoQ10.
Based on the simulated total plasma CoQ10 concentration curves, the single-dose study determined the appropriate length of the treatment period for the repeated-dose study to be 4 weeks. Due to the nature of CoQ10, that is its low solubility in water and high molecular weight, large individual differences, and poor dose response in plasma CoQ10 concentrations were expected in the repeated-dose study. Therefore, 4 dosage levels from 600 to 2400 mg/kg per d were selected to determine the maximum tolerated dose. In terms of administration volume per dose, the 2400 mg/kg per dosage is double the expected maximum feasible dose of 1200 mg/kg per d (12 g/10 kg of body weight). A dose of 1200 mg/kg per d corresponds to nearly 5% of a dog’s daily diet (200-300 g/dog) and would therefore be expected to have significant nutritional effects. 35 Results of the 4-week repeated-dose study showed that plasma CoQ10 levels reached steady state after 2 weeks at any dosage (600, 1200, 1800, or 2400 mg/kg per d). Similar results have been shown in a 4-week clinical safety study of high-dose CoQ10 in healthy participants and in another 4-week study with ubiquinol in healthy volunteers. The latter study also showed after daily administration is stopped, the plasma CoQ10 concentrations decrease to near baseline levels, suggesting that CoQ10 does not accumulate in the body after cessation. 36 –38 A decline in plasma CoQ10 concentrations was observed after the cessation of CoQ10 on day 28 of the repeated-dose study.
The plateau in plasma exposure was the basis for choosing the high dosage for the definitive chronic toxicity study, that is there was no need to test doses beyond a dosage that resulted in a maximum achievable plasma exposure. The highest appropriate dose for future chronic toxicity studies was therefore determined to be 1800 mg/kg per d (900 × 2). Application of safety factors to adjust for differences between humans and test animals, using a 50-fold margin of safety would suggest an acceptable daily intake of 36 mg/kg per d in humans. 39 This would equate to 2520 mg/person per d in a person weighing 70 kg. It is understood however that metabolic and physiological differences between humans and dogs exist that may influence tissue utilization or responses to CoQ10. A previous review of the available published clinical trial data on CoQ10 concludes it is safe to be used as a dietary supplement in humans. 31 Application of customary safety evaluation methods suggests daily dosages of up to 1200 mg/d are safe and that higher levels, which have been tested in clinical trials without adverse effect, may also be safe. 31
In all 3 studies described, dosages of more than 1200 mg/kg per d were given in 2 divided doses by gavage approximately 6 hours apart for ease of administration. Where possible a single daily dosing regime was employed in an attempt to maintain animal welfare and reduce any undue stress to animals that may be related to gavage administration. It is not known if and how a divided daily dosing schedule in some groups affected the comparisons with those groups administered single daily dosing, as this issue was not specifically examined in these studies. However, it has been previously reported that 200 mg of CoQ10 given in equally divided doses (100 mg twice a day) causes a greater increase in the plasma CoQ10 level than a single dose of 200 mg in humans. 40 This suggests that dogs administered divided doses would be exposed to higher levels of CoQ10 than following a single dose, an idea supported by results from the repeated-dose study where the 1800 mg/kg per d dosage induced a higher plasma CoQ10 concentration than the 1200 mg/kg per d dosage. Early morning trough plasma levels are commonly used to monitor a test drug in repeated-dose studies. Measurement of trough levels in the chronic toxicity study described above allowed the determination of adequate exposure to CoQ10 over 39 consecutive weeks and was a good indication of the achievement of steady state.
A review of the few published reports on the pharmacokinetics of CoQ10 in humans and in rodent models shows mean T max values ranging from 2 to 6 hours. 41,42 On day 1 of the chronic toxicity study, the mean T max ranged from 16 to 24 hours, falling between 2 and 6 hours after 39 weeks of daily CoQ10 administration by gavage indicating that CoQ10 may be absorbed slowly from the gastrointestinal tract, in part due to its hydrophobic nature and relatively high molecular weight, and that the rate of CoQ10 absorption increases with chronic exposure. Studies in rats administered CoQ10 by gavage have shown it appears in liver tissue in a dose-dependent manner and in the spleen. 43 Chronic toxicity studies of large doses of CoQ10 in rats have shown increased concentrations in brain mitochondrial fractions. 9 In our chronic toxicity study, orange (test article like) material was observed in the stools of all dogs in the 1200 and 1800 mg/kg per d dosage groups, indicating that CoQ10 is incompletely absorbed. The pharmacokinetic results presented above may therefore be a reflection of incomplete absorption. Although different formulations of CoQ10 have been used in previous studies most have used ubiquinone, the form of CoQ10 used in the studies described above. 10 –13,15,24 –29,32 Other studies have used ubiquinol, the active antioxidant form found endogenously in the body. 32,36 A safety and bioavailability study of ubiquinol in healthy human volunteers indicated that ubiquinol is better absorbed from the gastrointestinal tract compared to ubiquinone, however once ingested and absorbed almost 90% of ubiquinone is converted into ubiquinol. 36 Some studies have used vitamin E in combination with CoQ10 as vitamin E may increase CoQ10 absorption. 12–13,15,44 A single-dose comparison study of 4 different CoQ10 formulations conducted to assay the amount of active CoQ10 in each formulation however reported no such increase. 10 Formulations included 2 Vitaline CoQ10 chewable wafers (1 with 300 IU of vitamin E and 1 without), 1 hard gelatine capsule and 1 gel cap containing an oil-based vehicle. Assay of the 4 preparations revealed that all contained the claimed amount of CoQ10, review of the blood draws did not reveal any major differences in plasma CoQ10 curves generated, and pharmacokinetic results were all within the same range. 10 All 3 studies employed small sample sizes which preclude meaningful statistical comparisons. Nevertheless from the results of the chronic toxicity study, we are able to conclude that no untoward changes related to CoQ10 administration were observed with regard to body weight, food consumption, clinical observations, electrocardiograms, ophthalmologic examinations, urinalysis, hematologic and blood chemistry examinations, organ weights or histopathology, including sampling of multiple brain regions, after 39 consecutive weeks of treatment at the maximum practical dosage by gavage. The results of this chronic toxicity study in beagle dogs support the safe use of a 2400 mg/person per d dosage of CoQ10 in 2 phase 3 National Institute of Neurological Disorders and Stroke (NINDS)-sponsored clinical trials which are currently ongoing. When calculated for a 70 kg person the maximal safe dosage, of 2400 mg/kg per d, administered to beagle dogs in the repeated-dose study is 70-fold greater than a 2400 mg/person per d dose in man. The chronic dose study also supports the current National Institutes of Health (NIH)-sponsored phase 2 multicenter, randomized, double-blind, parallel-group tolerability study of CoQ10 in people with presymptomatic gene-positive HD. 45 The information gained from these toxicity studies in beagle dogs will prove valuable for future human clinical trials of CoQ10 in multiple disorders in which mitochondrial dysfunction and oxidative damages are implicated, including HD and PD.
Footnotes
The online supplemental tables are available at https://journals.sagepub.com/doi/suppl/10.1177/1091581811425256
Acknowledgments
This work was supported by Award Number 5 R0I NS05292 from the NINDS, Award Number U0I NS050324 from the National Institutes of Health (NIH), and Kaneka Corporation, Osaka, Japan. The content is solely the responsibility of the authors and does not necessarily represent the official views of the NINDS or the NIH. The authors would like to thank Wendy Galpern for her review of the manuscript.
Dai Watanabe, Mitsuaki Kitano, Kazunori Hosoe and Iwao Funahashi are presently employed by Kaneka Corporation, manufacturers of the CoQ10 product used in these studies. All other authors report no other relevant financial conflicts of interest. The authors alone are responsible for the content and writing of this article.
The author(s) received no financial support for the research, authorship, and/or publication of this article.
References
Supplementary Material
Please find the following supplemental material available below.
For Open Access articles published under a Creative Commons License, all supplemental material carries the same license as the article it is associated with.
For non-Open Access articles published, all supplemental material carries a non-exclusive license, and permission requests for re-use of supplemental material or any part of supplemental material shall be sent directly to the copyright owner as specified in the copyright notice associated with the article.