
Abstract
The aim of study was to evaluate the effect of commonly used lisinopril, rosuvastatin and their combined action on site-specific nephrotoxicity in rats using clusterin and microalbumin nephrotoxic biomarkers and other related parameters using oral gavage. Rosuvastatin at 2 different doses showed increase in urinary microalbumin levels whereas lisinopril and its combination with rosuvastatin at 2 different doses did not show urinary microalbumin excretion indicating beneficial effects of lisinopril in terms of reducing microalbumin. Urinary clusterin levels significantly increased in high-dose treated animals of lisinopril and rosuvastatin. The use of lisinopril plus rosuvastatin at low dose also led to worsened renal function by raising urinary clusterin levels (217±4.6 ng/ml) when compared with the control (143±3.3 ng/ml). Renal histopathology showed multifocal regeneration of tubules indicating proximal tubule damaged. These results indicate that lisinopril (50 mg/kg), rosuvastatin (100 mg/kg), lisinopril+rosuvastatin (20+40 mg/kg) and lisinopril+rosuvastatin (50+100 mg/kg) showed toxicity only on proximal tubules.
Introduction
Acute kidney injury (AKI) is one of the leading causes of death worldwide annually. The standard metrics used to define and monitor the progression of AKI, such as serum creatinine and blood urea nitrogen levels, are insensitive, nonspecific, and change significantly only after significant kidney injury and then with substantial time delay. 1 This delay in diagnosis not only prevents timely management decisions, including administration of putative therapeutic agents but also significantly affects the preclinical evaluation of toxicity thereby allowing potentially nephrotoxic drugs to pass preclinical safety criteria, later to be found clinically nephrotoxic with great human costs. 2 Besides, immune and nonimmune mechanisms are important contributors in the development of nephritis, progressive renal injury, and renal failure. Proteinuria, hypertension, and dyslipidemia are nonimmune risk factors implicated in the deterioration of kidney function. The changes in blood lipid levels also accelerate the decline in renal function, as is evident from the Helsinki Heart Study. Therefore, treatment of dyslipidemia by effective control of proteinuria and blood pressure is imperative for amelioration of renal dysfunction and protection from vascular diseases. Because of their good efficacy in lipid management and good tolerability, statins are are used in the treatment of patients with hyperlipidemia associated with various renal abnormalities. 3 The combination of angiotensin-converting enzyme (ACE) inhibitor with statin normalizes proteinuria in experimental diabetes. 4 There is a chance of renal damage hazards in patient population receiving ACE inhibitors and statins because of their individual effects on kidney, such as proteinuria. It has been reported 5 that lisinopril slows down the progression of nondiabetic chronic renal diseases in patients with baseline proteinuria ≤1.0 g/d. Contrary to this, the incidence of (++)-grade proteinuria with rosuvastatin (5-40 mg/d) was observed; whereas high dose of rosuvastatin (80 mg/d) demonstrated a relatively higher incidence (12%) when compared with the placebo. 6 Therefore, we selected ACE inhibitor (lisinopril) and statin (rosuvastatin) and their combination to evaluate their effect on kidney as either alone or a combination therapy.
Materials and Methods
Chemicals
Lisinopril and rosuvastatin were obtained from Cadila Health Care Limited (Ahmadabad, Gujarat, India). All other chemicals used in this study were of the analytical grade.
Animals and Housing Condition
Female wistar rats, 6 to 8 weeks old, were obtained from animal research facility of Zydus Research Centre. Experiments were complied with the committee for the purpose of control and supervision on experiments on animals (CPCSEA) guidelines of this institution. All animals were allowed free access to food (Standard Chakan brand pellet diet) and water (Clean water purified by Aqua guard water system) except for when urine was being collected. The animals were housed under 12-hour light/dark (lights on 8:00-20:00) in individual ventilated cage system. The temperature condition of animal housing was 22°C ±3°C.
Experimental Design
The experiment design is shown in Table 1. The animals were allocated to 7 groups of 6 animals each: a 0.5% carboxy methyl cellulose (CMC)-treated group, lisinopril (20 mg/kg)-treated group, lisinopril (50 mg/kg)-treated group, rosuvastatin (40 mg/kg)-treated group, rosuvastatin (100 mg/kg)-treated group, lisinopril + rosuvastatin (20 + 40 mg/kg)-treated group, and lisinopril + rosuvastatin (50 + 100 mg/kg)-treated group. Lisinopril and rosuvastatin were dissolved in 0.5% CMC solution at a required concentration just prior to use. All treatments were given orally using freshly prepared drug solutions (5 mL/kg). All the animals were acclimatized to experimental room condition for 5 days. All animals were sacrificed on day 22. These dose levels were selected on the basis of biochemical and or hisopathological changes in kidney. It is reported that at the dose 3/10/30 mg/kg/d orally for the duration of 3 months with 1 month interim period, lisinopril showed increased incidences of focal erosion of gastric mucosa and focal renal tubular basophilia. In addition to this, at all doses described above and 90 mg/kg/d for the period of 1 year with 6 month interim, lisinopril has shown decrease in weight gain, focal interstitial nephritis, and an increase in kidney weight. 7 Clinically recommended 8 dose of lisinopril for patients with no complications was in the range between 20 and 80 mg/d. Similarly, the fixation for rosuvastatin under the present study was based on the report of multicentric clinical trial of rosuvastatin at doses ranging from 5 to 80 mg/kg/d. However, there is a report on associated morbidity at the dose of 10 and 40 mg/kg/d. The higher dose of rosuvastatin (80 mg/kg) has been found to be associated with myopathy, urine abnormality, and renal toxicity. 3 Parallelly, there was one more report on rosuvastatin muscle toxicity and renal toxicity after high-dose level exposure in multiple animal species. 9
Experimental Design: All the Treatments were Given po for 21 Days in the Group of 6 Animals Each
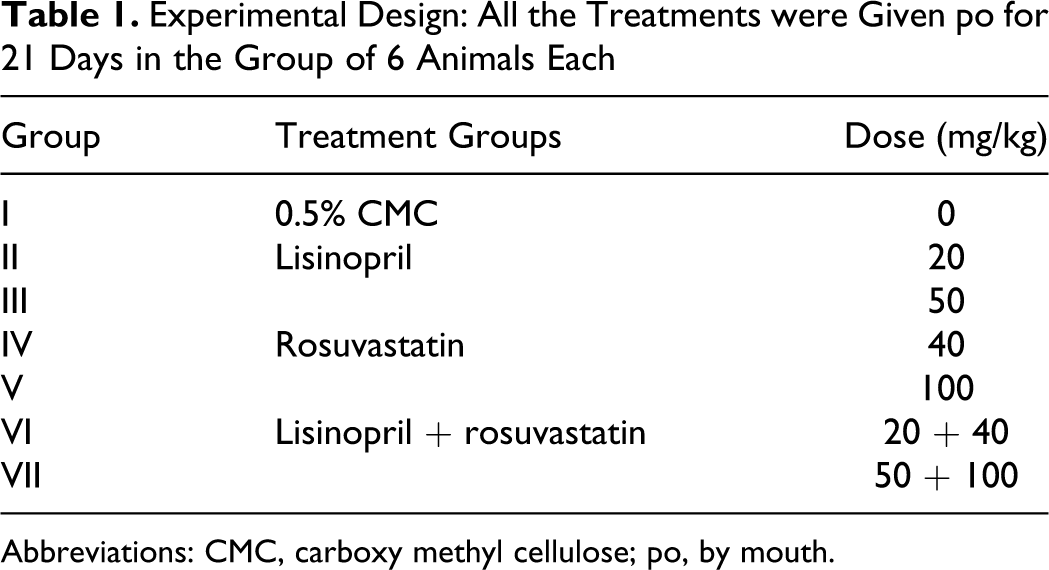
Abbreviations: CMC, carboxy methyl cellulose; po, by mouth.
Measurement of Urinary Biomarkers
Urinary clusterin was performed using the Rat Clusterin enzyme-linked immunosorbent assay (ELISA) kit (Life Diagnostic Inc, Cat. No. 3300-2). Urinary microalbumin was performed using the Rat Microalbumin Elisa kit (Kamiya Biomedical Company, Cat. No. KT-354)
Urine Analysis
Animals were kept in metabolic cages on day 14 and 21 for the collection of urine sample after taking body weights. The animals were given measured volume (100 mL) of distilled water and fasted overnight in metabolic cages. After measuring urine volumes, urine samples were centrifuged at 1000 rpm for 10 minutes with cooling for analysis. Urine samples from all the animals were analyzed for total protein, blood cells, and leucocytes by automatic urine analyzer (Clinitek-status, Zydus Research Centre, Ahmadabad, Gujarat, India).
Blood Chemistry
Blood samples were collected from retro-orbital plexus of rat in 1.0 mL eppendorf having EDTA (0.5 mL blood) for hematology and in plain eppendorf (1 mL blood) for the separation of serum. Blood samples for serum biochemical analysis were collected from retro-orbital plexus of rat in plain eppendorf. The blood was allowed to clot and then centrifuged at 4000 rpm for 5 minutes at ambient temperature. Serum albumin, total protein, creatinine, and urea levels were analyzed using automatic biochemical analyzer (Daytona, Zydus Research Centre, Ahmadabad, Gujarat, India).
Pathological Examination
After blood collection, all the animals were sacrificed on day 22. Kidney was collected and weighed. Kidney was preserved in 10% formalin. The kidney was processed and embedded in paraffin. Slides were prepared and stained with hematoxylin and eosin (H & E) for histopathological examination.
Mortality
All the animals were observed daily till day 22 of the experiment for any abnormal physical or behavioral changes and mortality throughout the dosing period.
Statistical Analysis
Statistical analysis was performed using Graph Pad Prism Version 4.00. Data were analyzed for dose wise comparison. Analysis of variance (ANOVA) was used for the comparison of different dosage groups with the control group for different parameters. Comparison of dosage groups with the control group was done on the basis of individual group data. Post hoc test to analyze data after ANOVA was done using Dunnett test (parametric) or Dunn test (nonparametric). Tests used in the analysis of data were done at 5% level of significance.
Results
Effect of Lisinopril and Rosuvastatin on Urinary Clusterin
As shown in Figure 1, pretreatment with lisinopril (50 mg/kg), rosuvastatin (100 mg/kg), and its combination (50 + 100 mg/kg) had a significant increase in urine clusterin levels on day 14 and 21 as compared to control group. Lisinopril and its combination with rosuvastatin at low dose also had a significant increase in urine clusterin levels only on day 21 as compared to control group.
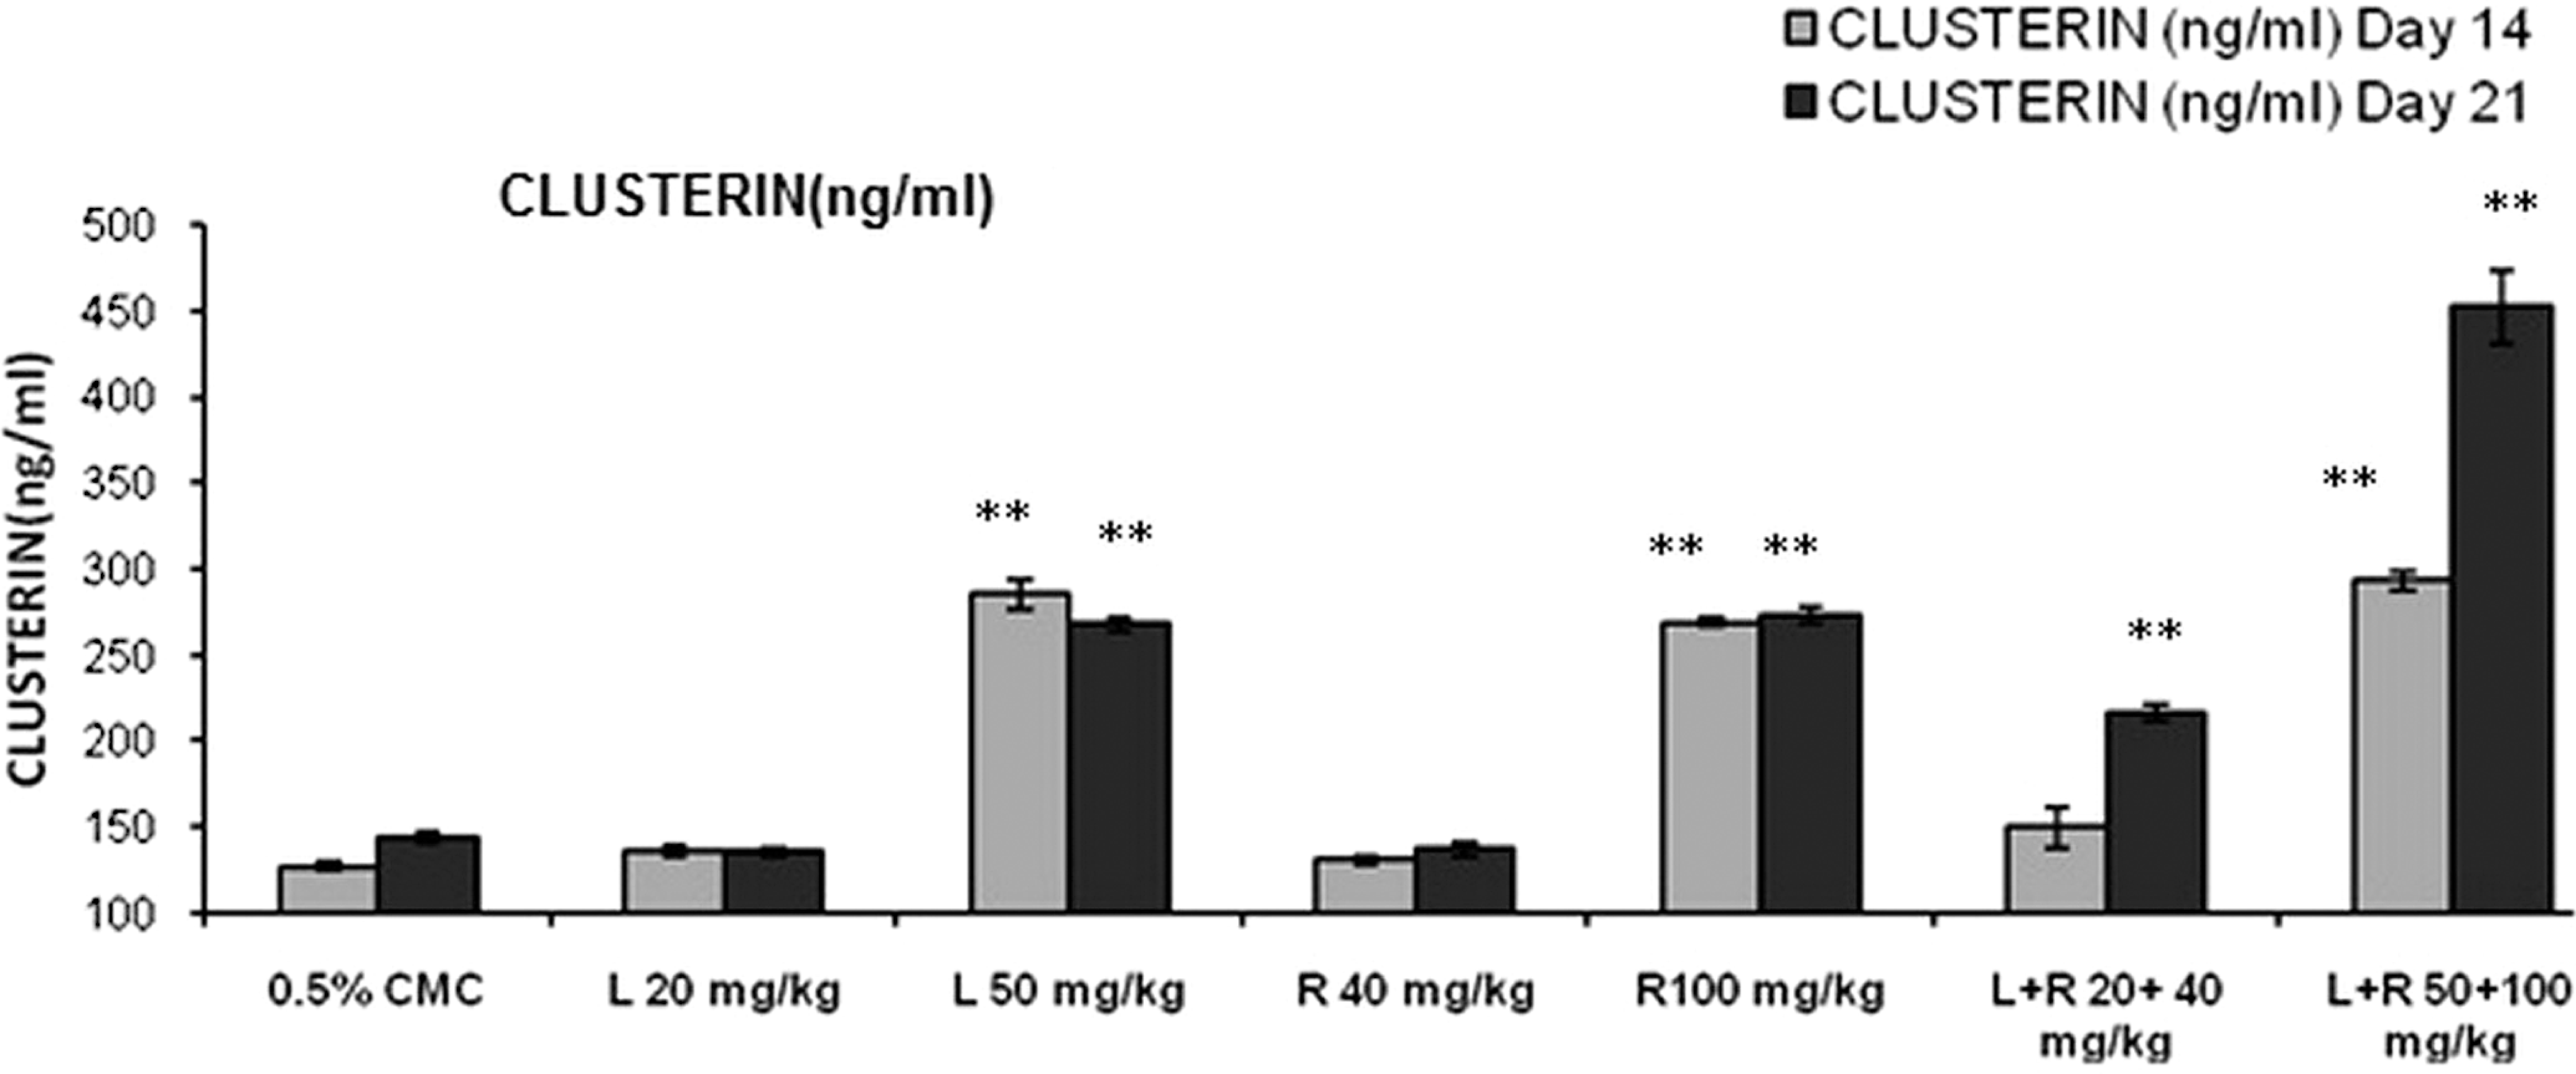
Effects of different treatment groups on urine clusterin levels n = 6 in each group: data are expressed as mean ± SEM. The statistical significance of differences between treated and control groups are determined using ANOVA followed by Dunnett (parametric) and dunn tests (nonparametric). *P < .05 significant compared with control, **P < .01 significant compared with control. ANOVA indicates analysis of variance; SEM, standard error of the mean.
Effect of Lisinopril and Rosuvastatin on Urinary Microalbumin
Rosuvastatin (40 and 100 mg/kg) had a significant increase in urine microalbumin levels on day 14 and 21 as compared to control group (Figure 2).
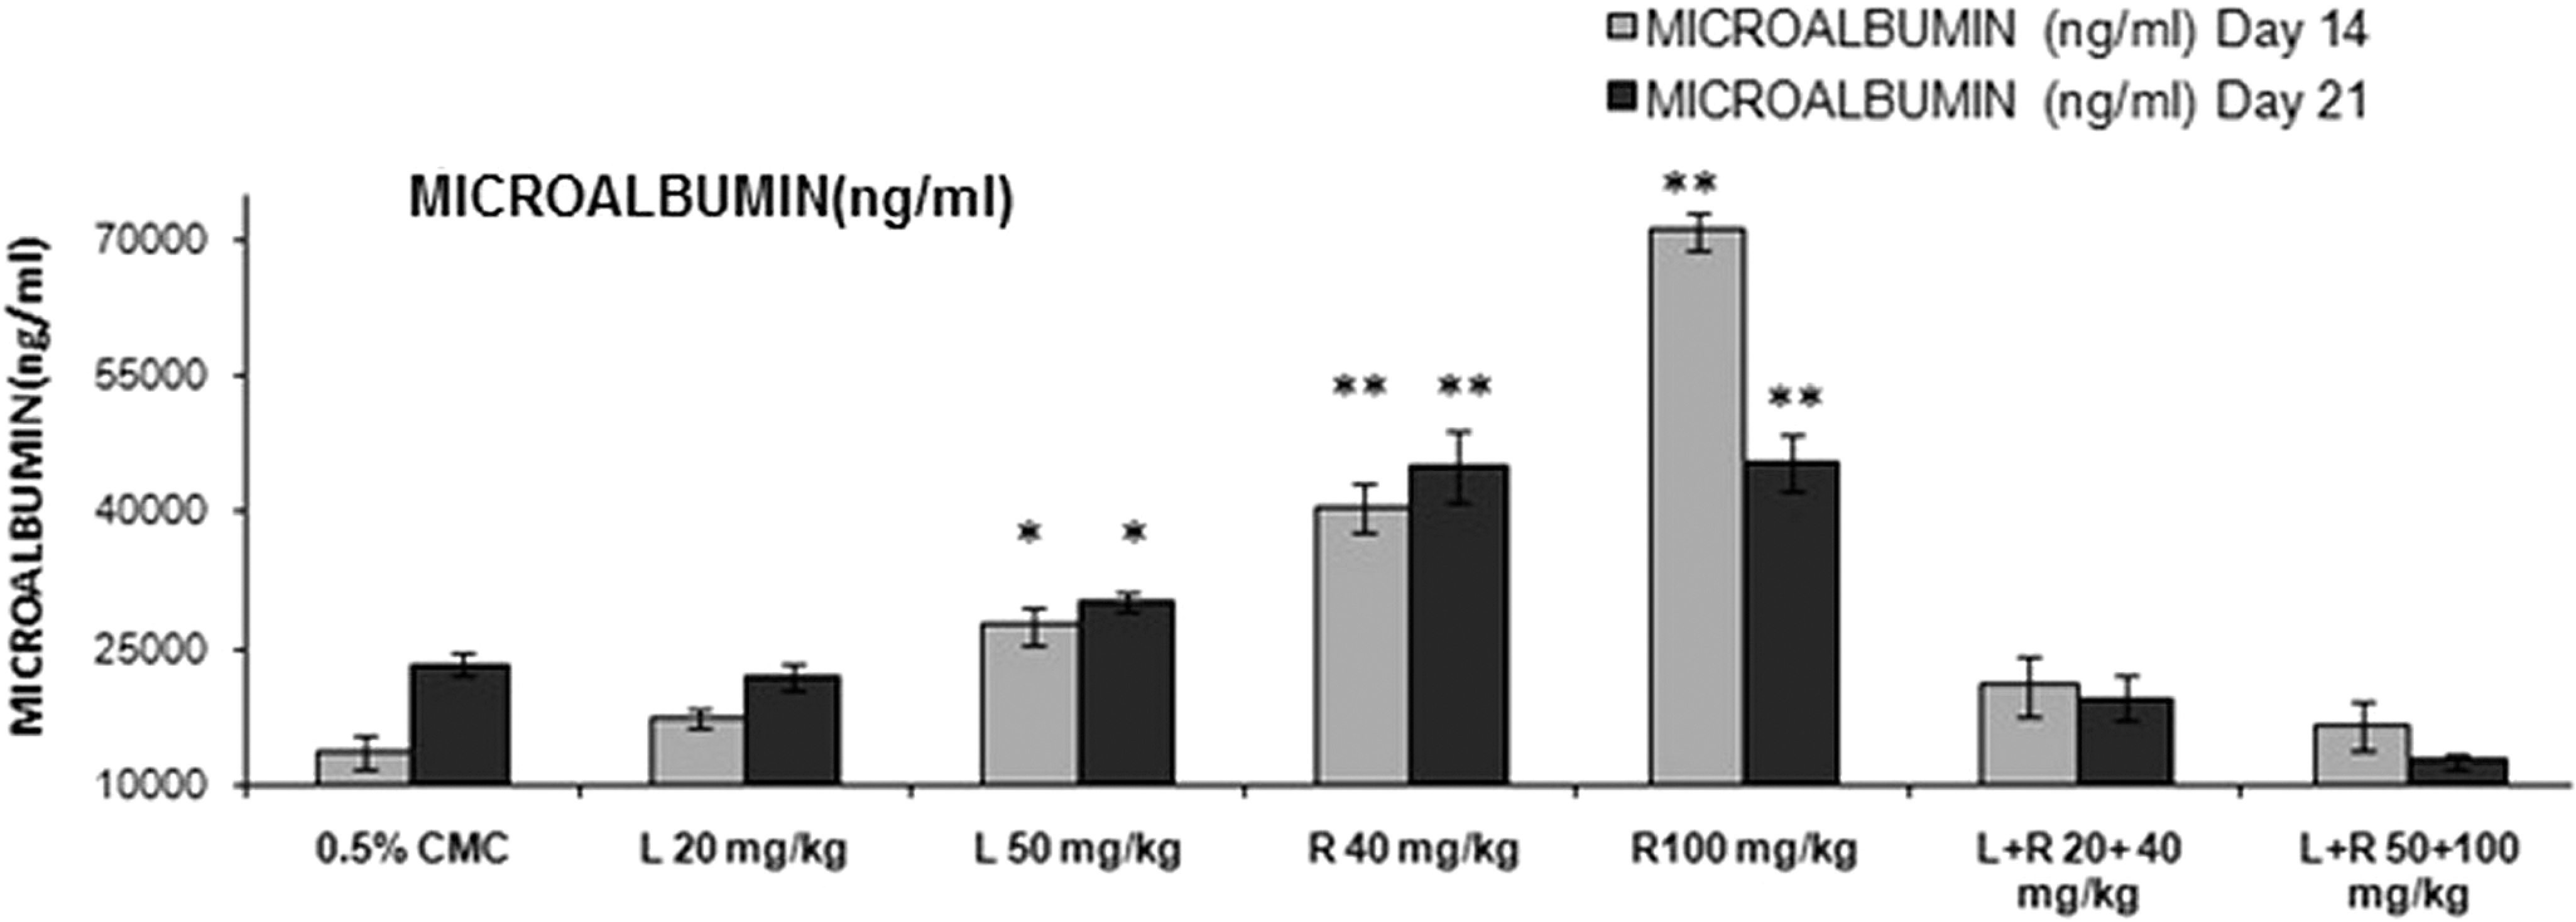
Effects of different treatment groups on urine microalbumin levels n = 6 in each group: data are expressed as mean ± SEM. The statistical significance of differences between treated and control groups are determined using ANOVA followed by Dunnett (parametric) and Dunn tests (nonparametric). *P < .05 significant compared with control, **P < .01 significant compared with control. ANOVA indicates analysis of variance; SEM, standard error of the mean.
Effect of Lisinopril and Rosuvastatin on Qualitative Urine Analysis
Lisinopril (50 mg/kg)-, rosuvastatin (100 mg/kg)-, and lisinopril + rosuvastatin (20 + 40 mg/kg)-treated rats had proteinuria (≥100 mg/dL) on day 22 when compared with the respective placebo treatment. Simultaneously, rosuvastatin (100 mg/kg) and lisinopril + rosuvastatin (50 + 100 mg/kg) had a significant decrease in urine output indicating marked decrease in glomerulus filtration rate. In addition to this, all treatment groups had an absence of leucocytes and blood cells in urine (Table 2).
Qualitative Urine Analysis in the Different Treatment Groups
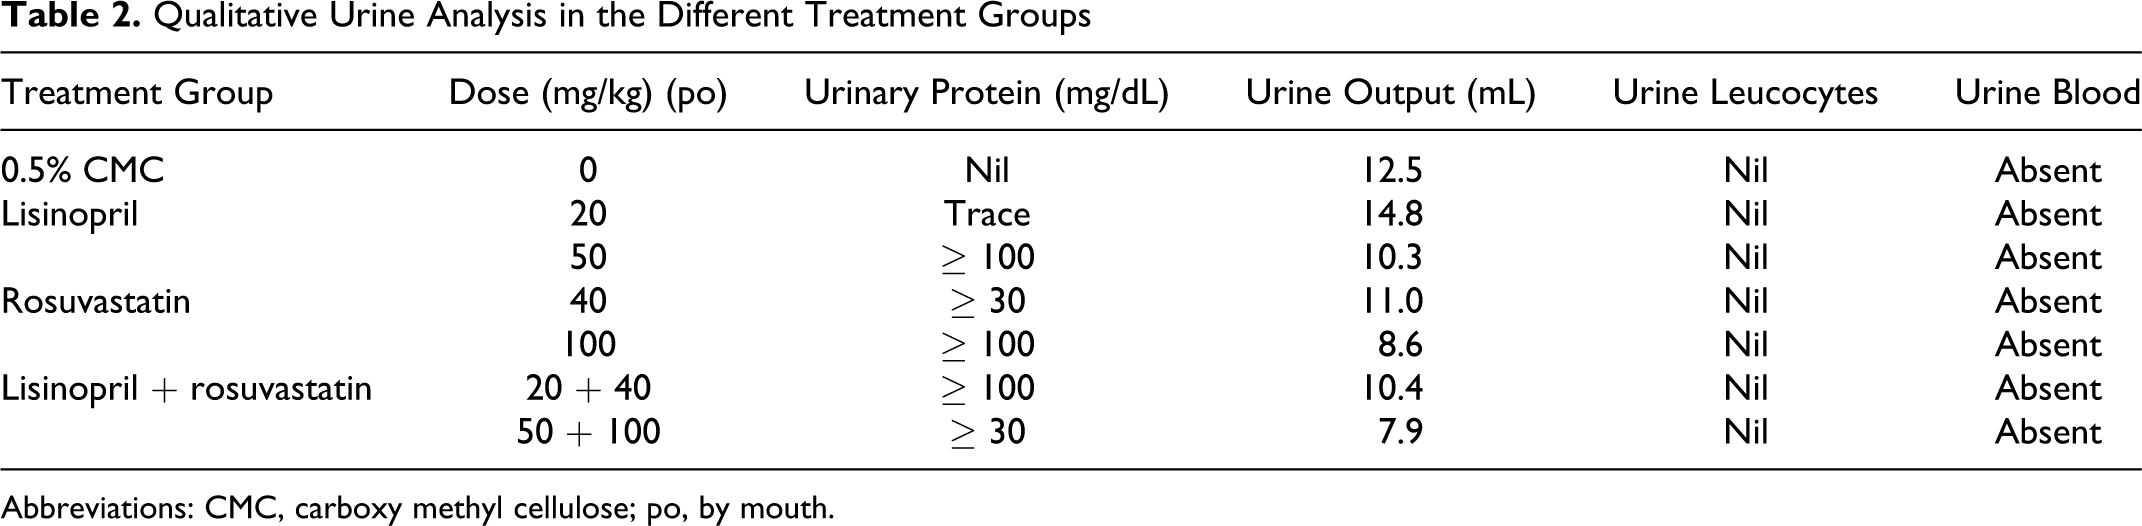
Abbreviations: CMC, carboxy methyl cellulose; po, by mouth.
Effect of Lisinopril and Rosuvastatin on Blood Chemistry
High dose combination of rosuvastatin (100 mg/kg) and lisinopril (50 mg/kg) treatment had a significant (P < .01) increase in serum urea levels (86.5 ± 5.68) on day 14 as compared to control (48.8 ± 4.61; Figure 3). High dose of rosuvastatin (100 mg/kg) and its combination with lisinopril (50 mg/kg) also had a significant (P < .01) decrease in serum urea levels on day 21 (Table 3). Simultaneously, a significant increase in serum creatinine levels were observed in lisinopril (20 mg/kg; 0.70 ± 0.016), lisinopril (50 mg/kg; 0.70 ± 0.020), and concurrent treatment of lisinopril (20 mg/kg) in combination with rosuvastatin (40 mg/kg) had a significant increase in serum creatinine levels (0.68 ± 0.03) on day 21 as compared to control (0.64 ± 0.01; Figure 4). Rosuvastatin and its combination with lisinopril at different dose levels viz low-dose (5.35 ± 0.19 and 5.57 ± 0.26) and high-dose (5.12 ± 0.07 and 5.30 ± 0.40) treated rats had a significant decrease in serum total protein levels on day 14 and 21 as compared to control (6.10 ± 0.16 and 6.35 ± 0.10), respectively (Figure 5); whereas same treatment groups had a significant decrease in serum albumin level (3.57 ± 0.09 and 3.48 ± 0.05) on day 14 as compared to control (3.88 ± 0.07). Further, lisinopril (50 mg/kg) and rosuvastatin (100 mg/kg) treatment individually also had a statistically significant decrease in serum albumin level (3.80 ± 0.04 and 3.57 ± 0.23) on day 21 as compared to control (4.03 ± 0.07; Figure 6).
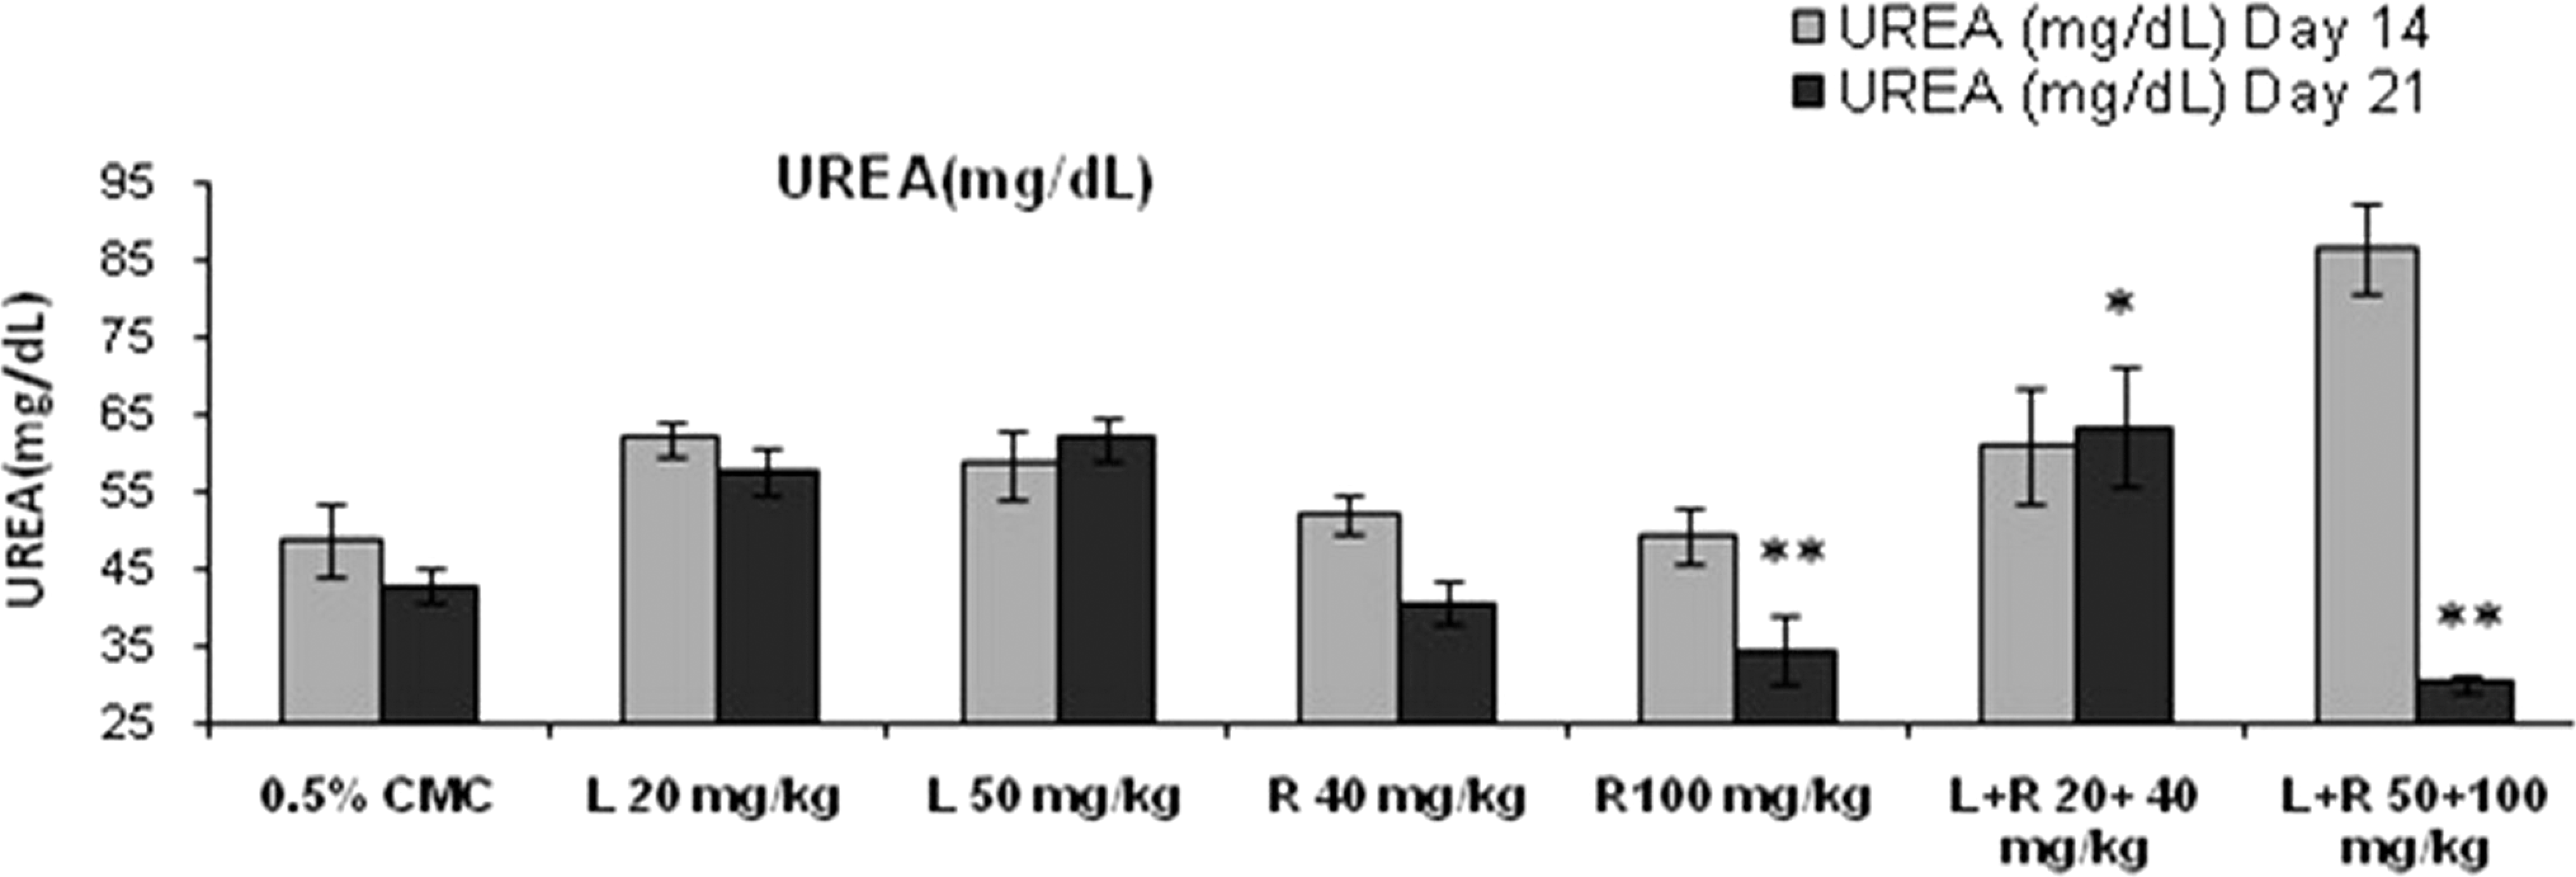
Effects of different treatment groups on serum urea levels n = 6 in each group: data are expressed as mean ± SEM. The statistical significance of differences between treated and control groups are determined using ANOVA followed by Dunnett’s (parametric) and Dunn’s tests (nonparametric). *P < .05 significant compared with control, **P < .01 significant compared with control. ANOVA indicates analysis of variance; SEM, standard error of the mean.
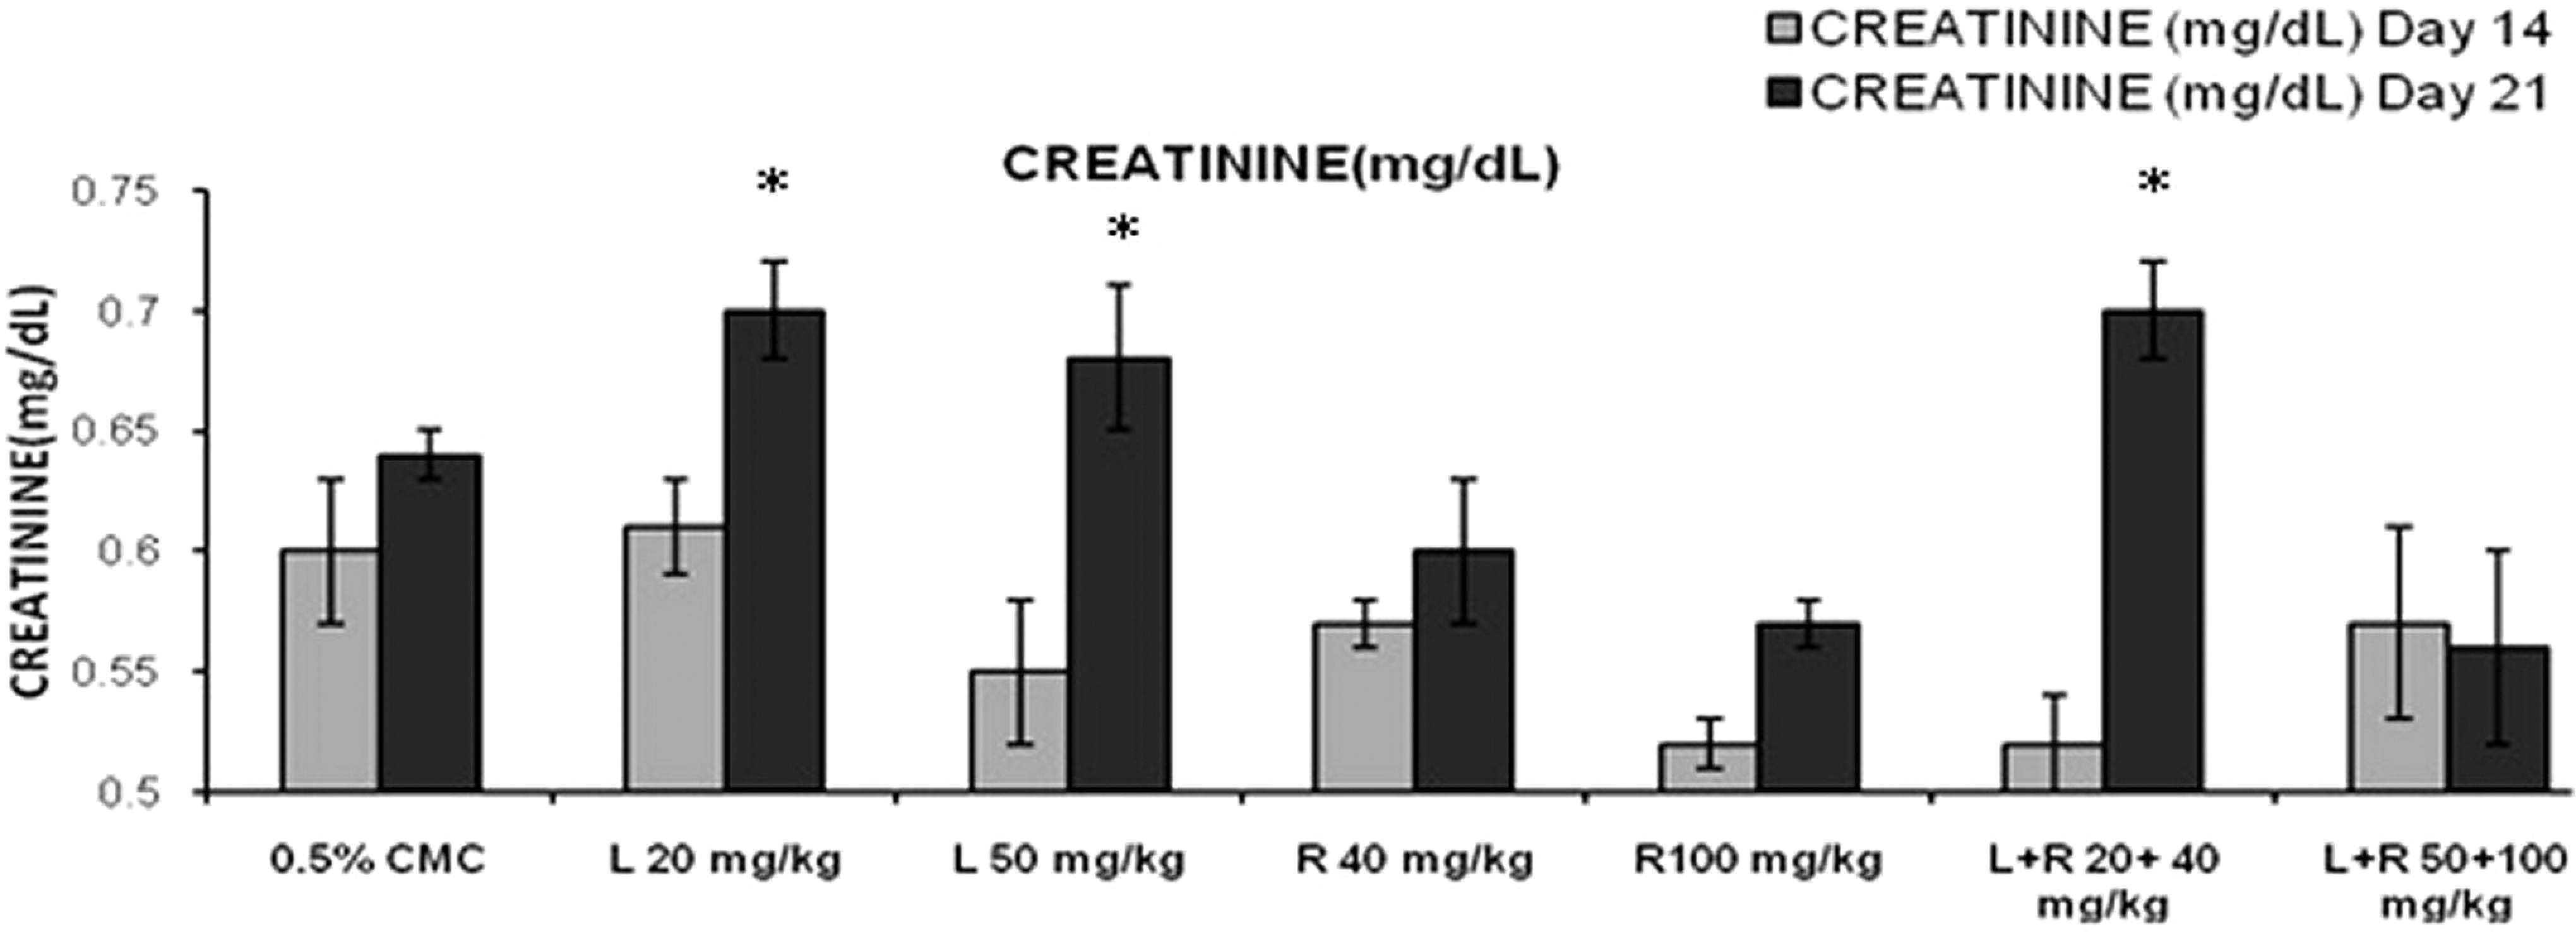
Effects of different treatment groups on serum creatinine levels n = 6 in each group: data are expressed as mean ± SEM. The statistical significance of differences between treated and control groups are determined using ANOVA followed by Dunnett (parametric) and Dunn tests (nonparametric). *P < .05 significant compared with control, **P < .01 significant compared with control. ANOVA indicates analysis of variance; SEM, standard error of the mean.
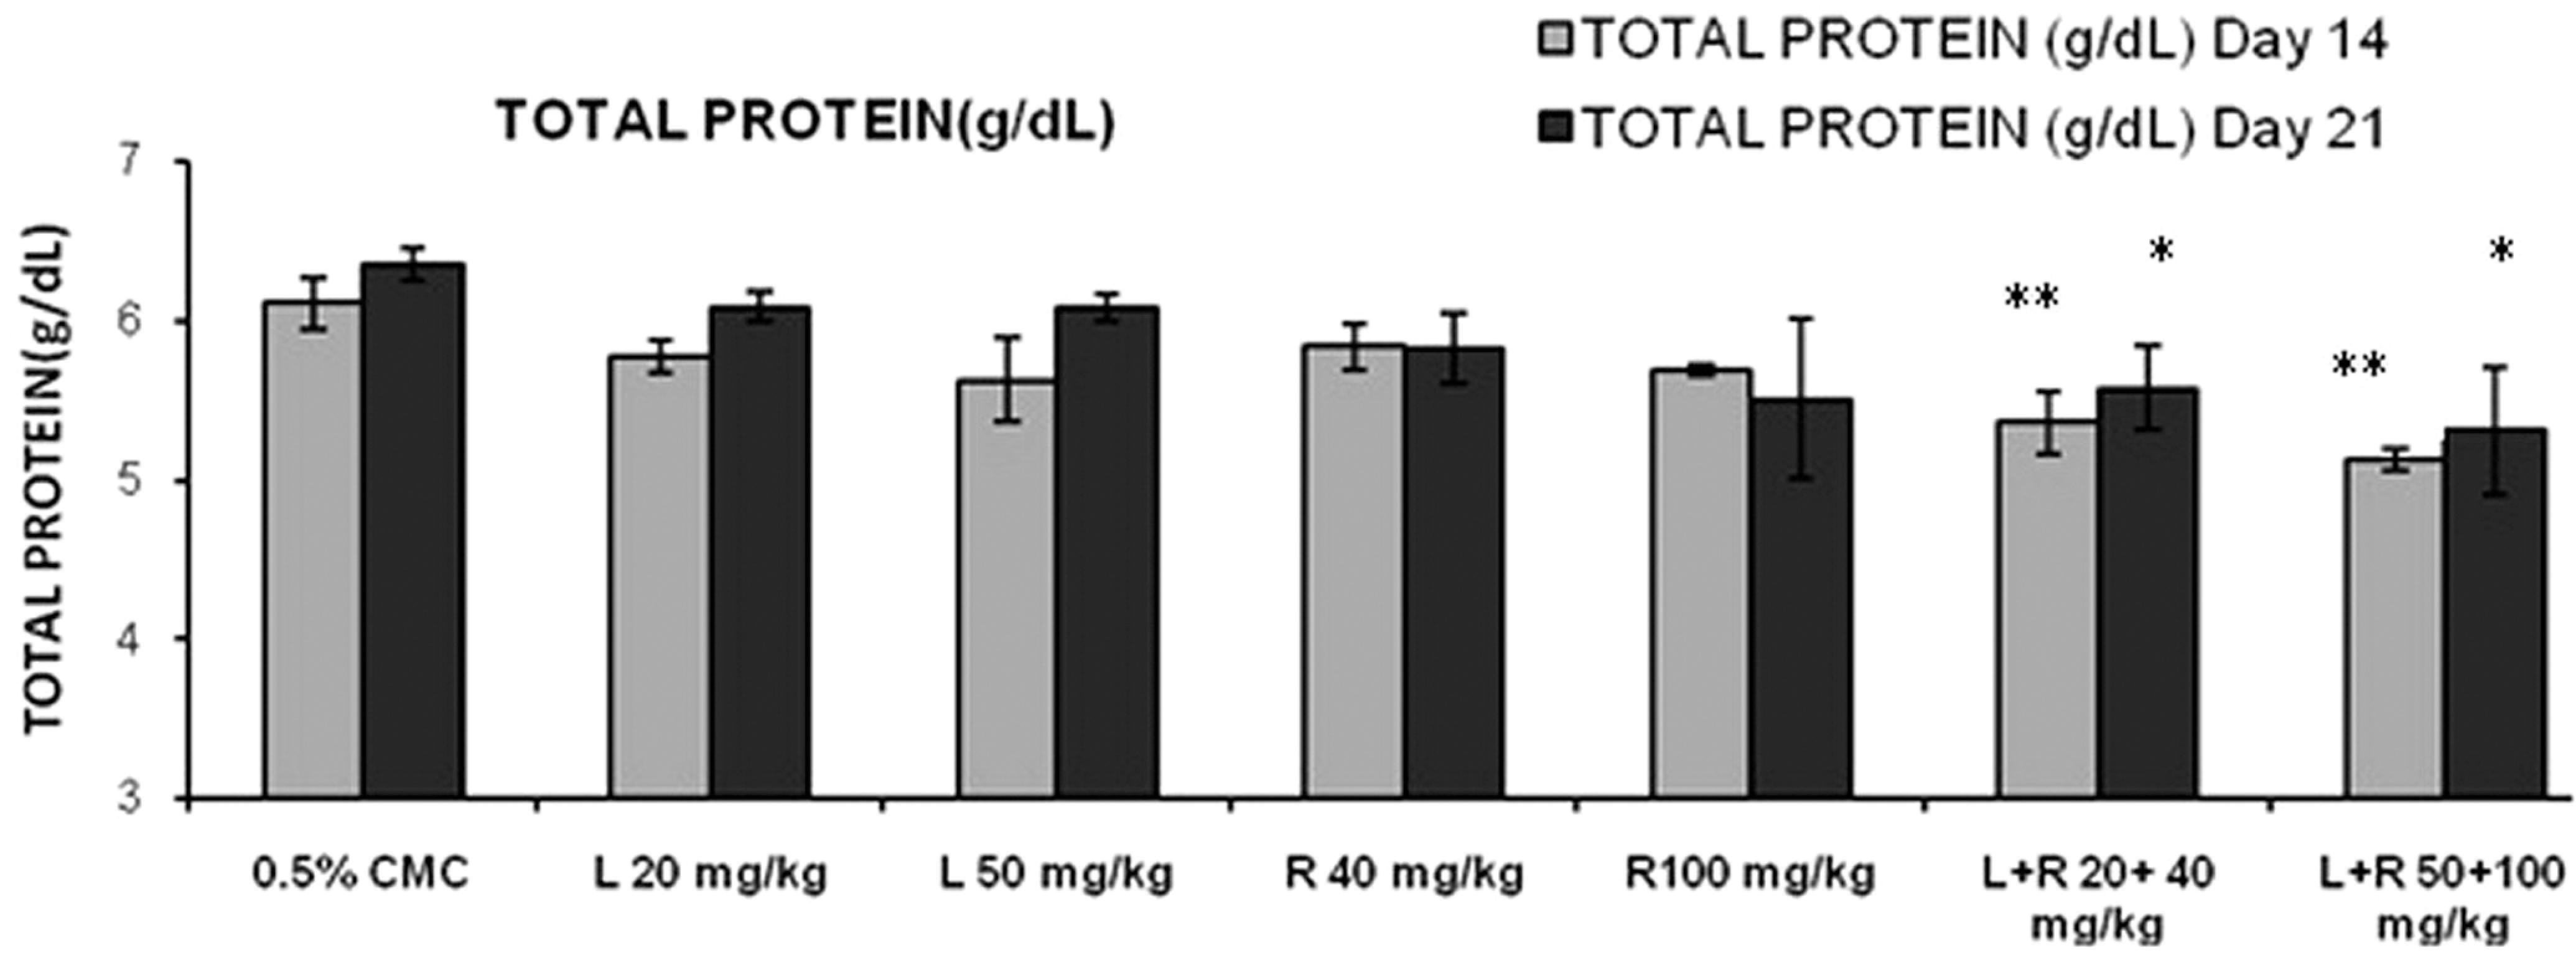
Effects of different treatment groups on serum total protein levels n = 6 in each group: data are expressed as mean ± SEM. The statistical significance of differences between treated and control groups are determined using ANOVA followed by Dunnett (parametric) and Dunn tests (nonparametric). *P < .05 significant compared with control, **P < .01 significant compared with control. ANOVA indicates analysis of variance; SEM, standard error of the mean.
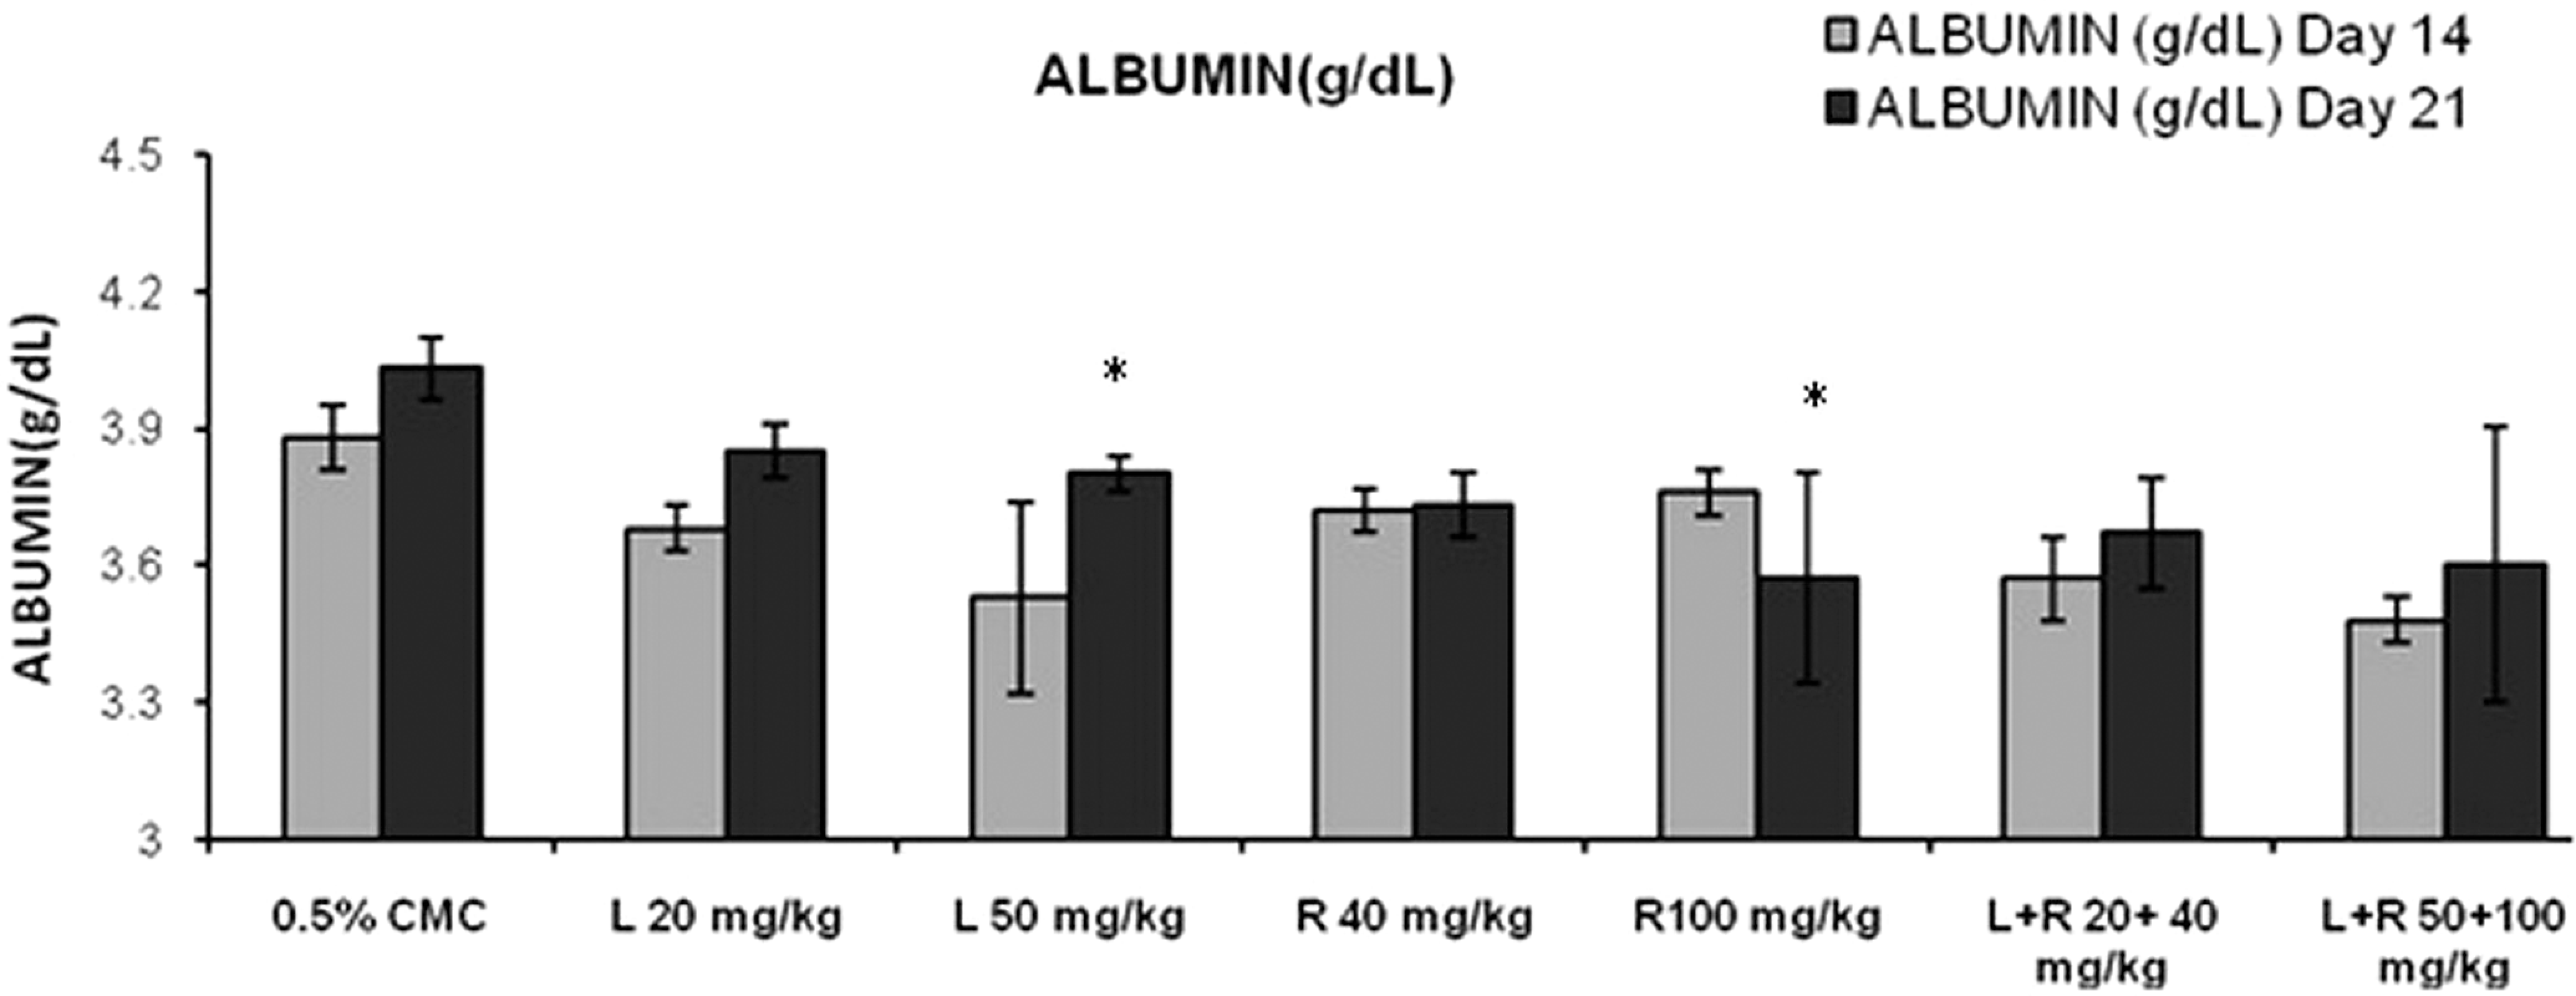
Effects of different treatment groups on serum albumin levels n = 6 in each group: data are expressed as mean ± SEM. The statistical significance of differences between treated and control groups are determined using ANOVA followed by Dunnett (parametric) and Dunn tests (nonparametric). *P < .05 significant compared with control, **P < .01 significant compared with control. ANOVA indicates analysis of variance; SEM, standard error of the mean.
Serum Urea Levels in the Different Treatment Groups at day 21 a
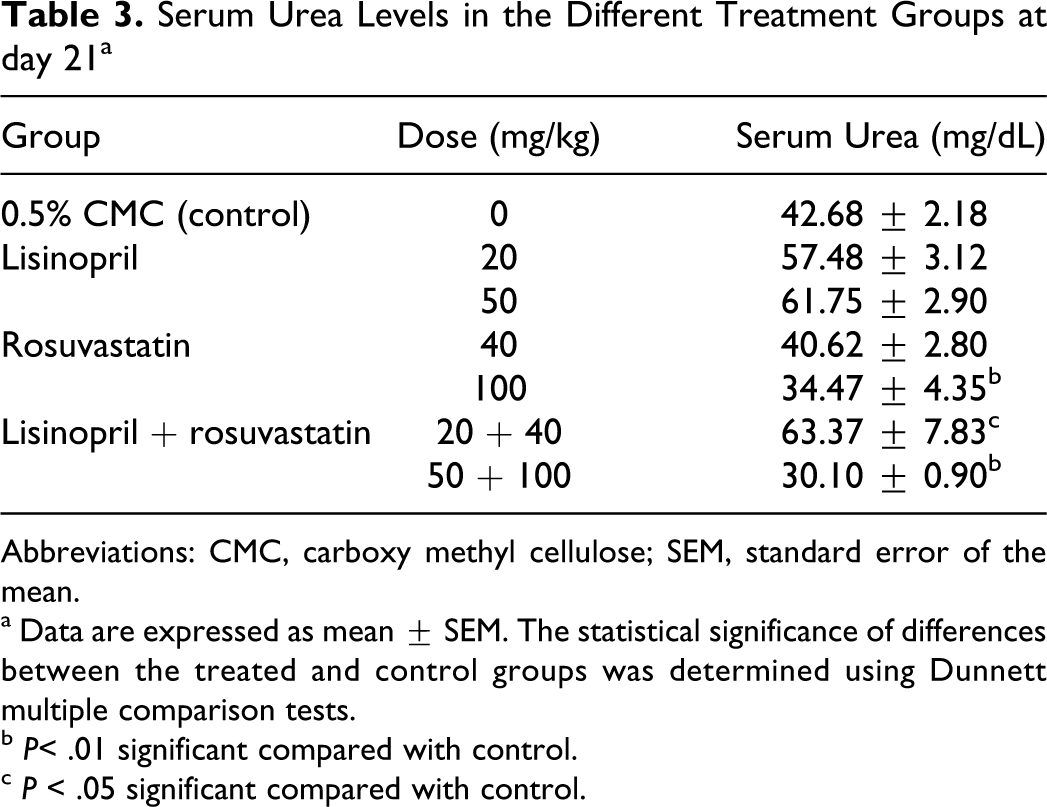
Abbreviations: CMC, carboxy methyl cellulose; SEM, standard error of the mean.
a Data are expressed as mean ± SEM. The statistical significance of differences between the treated and control groups was determined using Dunnett multiple comparison tests.
b P< .01 significant compared with control.
c P < .05 significant compared with control.
Effect of Lisinopril and Rosuvastatin on Kidney Pathology
Histopathological changes in kidney following lisinopril and rosuvastatin treatment are shown in Figure 7 and Table 4. There were renal tubular changes observed viz mild-to-severe dilatation of tubules (arrowheads) and moderate multifocal regeneration of tubules (arrows) with no alteration in the glomeruli (Figure 7B) as compared to histopathology of normal rats (Figure 7A). In addition, lisinopril (50 mg/kg) and lisinopril + rouvastatin (50 + 100 mg/kg) had mild multifocal regenerative and degenerative tubules with focal inflammatory cells infiltration.
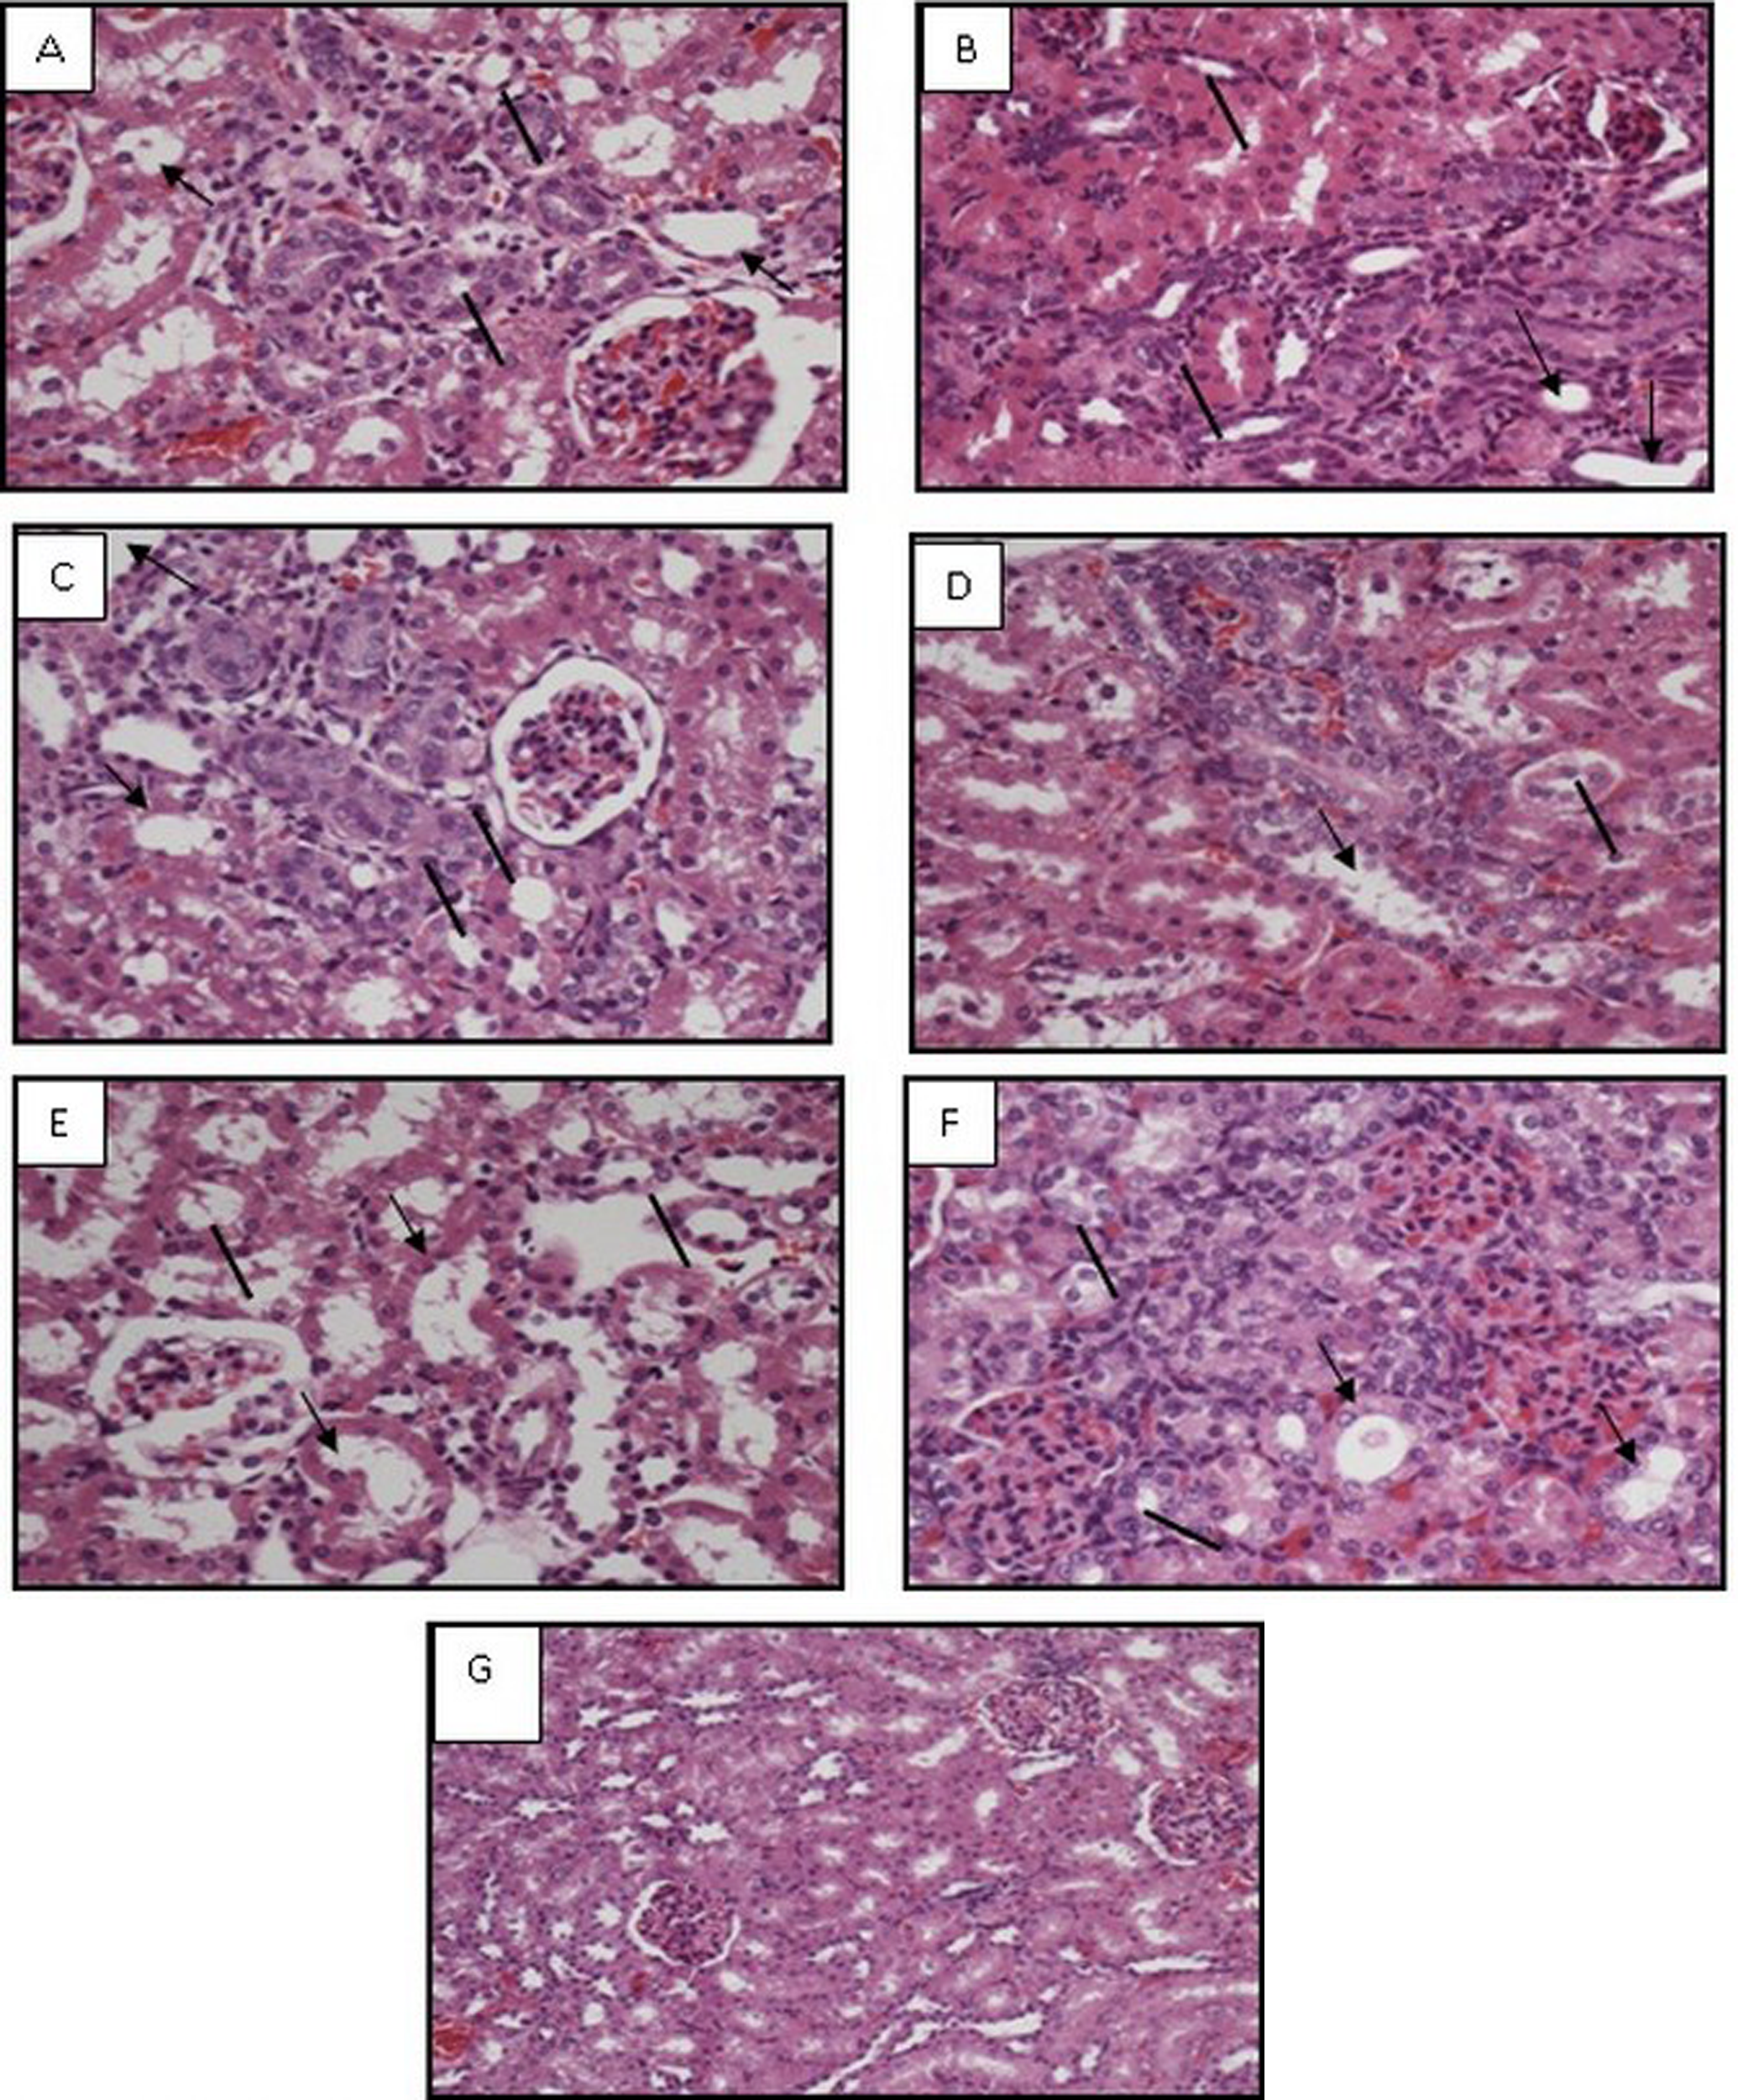
Effects of different treatments on rat kidney. Histopathological examination of rat kidney tissue in lisinopril (20 mg/kg, A), lisinopril (50 mg/kg, B), rosuvastatin (40 mg/kg, C), rosuvastatin (100 mg/kg, D), lisinopril + rosuvastatin (20 + 40 mg/kg, E), lisinopril + rosuvastatin (50+100 mg/kg, F), and 0.5% carboxy methyl cellulose (0 mg/kg, G) groups by high-power (×40) microscopy. Arrowheads indicate dilatation of tubules and arrows indicate regeneration of tubules in the nephron.
Histopathological Changes in the Presence of Different Treatments a
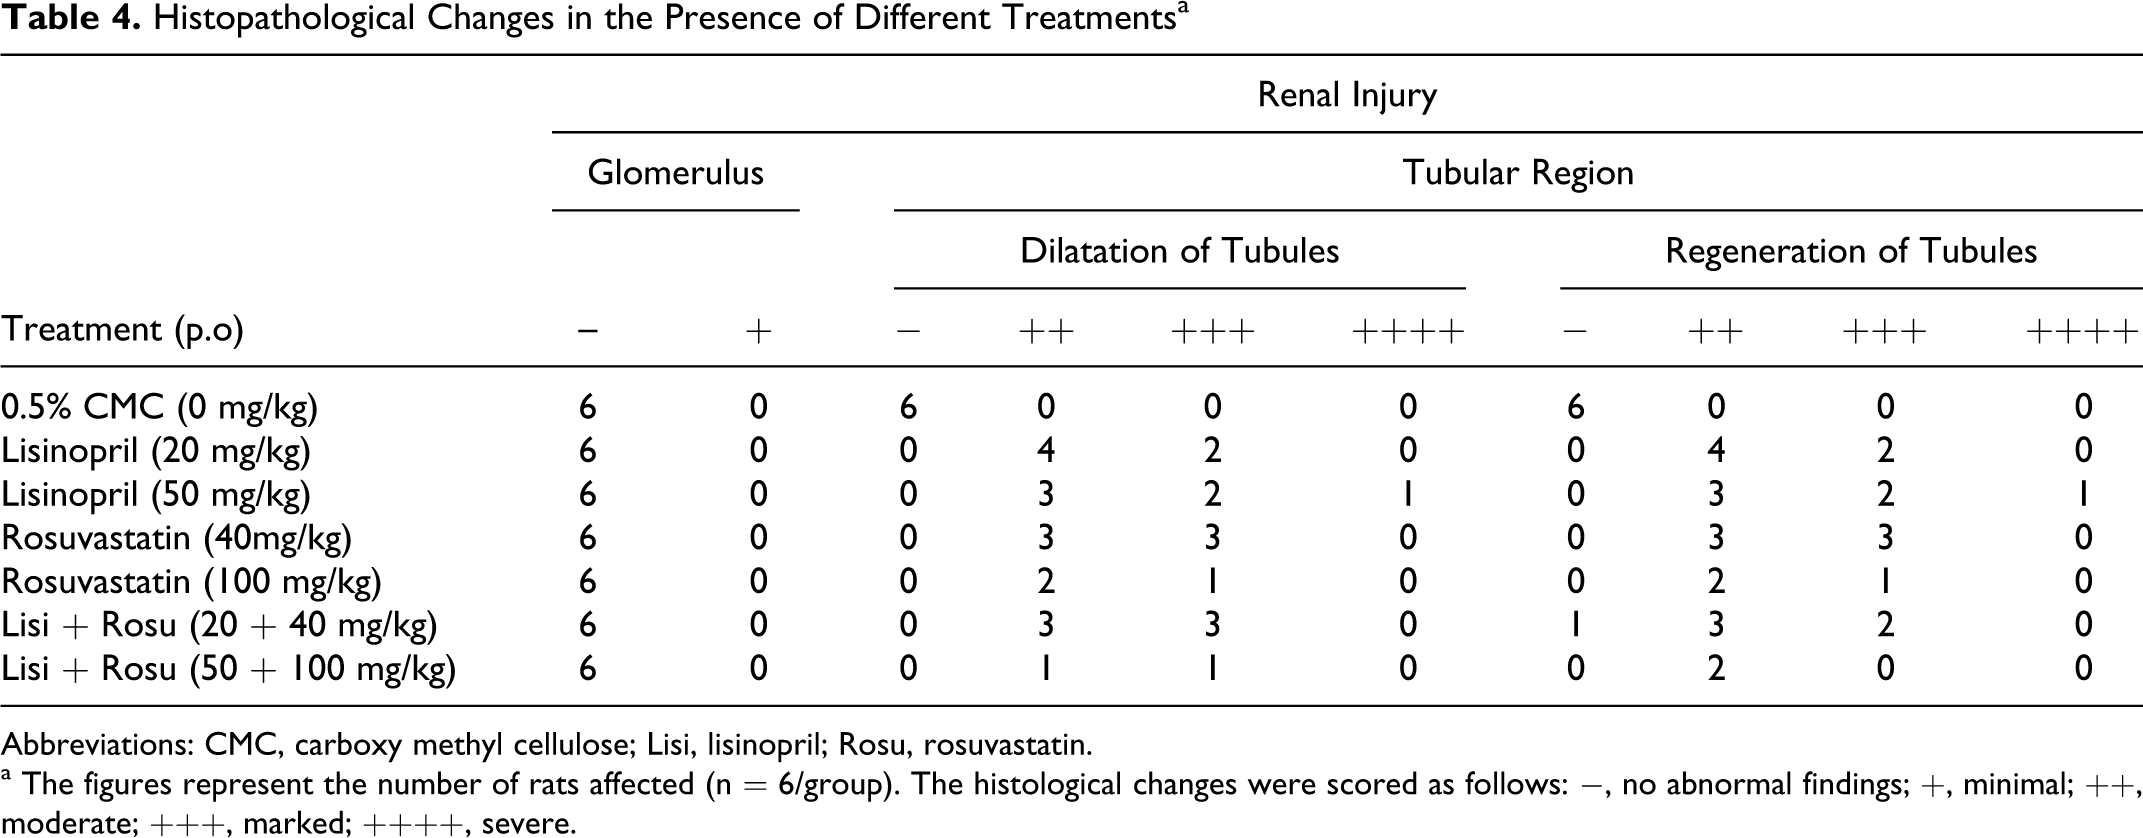
Abbreviations: CMC, carboxy methyl cellulose; Lisi, lisinopril; Rosu, rosuvastatin.
a The figures represent the number of rats affected (n = 6/group). The histological changes were scored as follows: −, no abnormal findings; +, minimal; ++, moderate; +++, marked; ++++, severe.
Percentage Mortality After Lisinopril and Rosuvastatin Treatment
As shown in Table 5, rosuvastatin (100 mg/kg) and lisinopril + rosuvastatin (50 + 100 mg/kg) treated rats had 50% and 66.7% mortality, respectively, due to severe renal toxicity.
Percentage Mortality in Different Treatment Groups
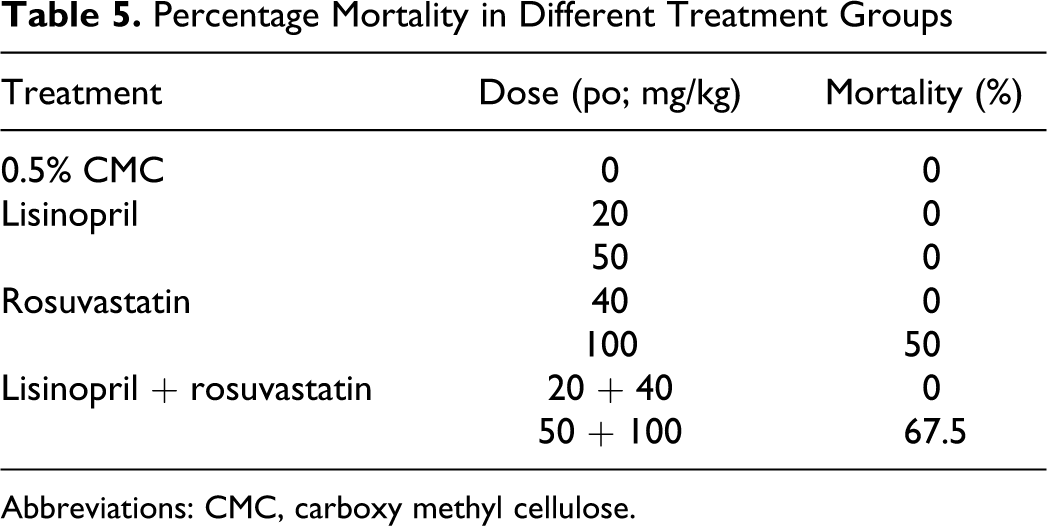
Abbreviations: CMC, carboxy methyl cellulose.
Discussion
Acute kidney injury can result from decreased renal or intrarenal perfusion, an edema, or primary reduction in the filtering capacity of the glomerulus. A number of pathophysiological mechanisms can contribute to AKI following an ischemic or toxic insult. These include (a) alterations in renal perfusion resulting from loss of autoregulation and increased renal vasoconstriction, (b) tubular dysfunction and cell death by apoptosis and necrosis, (c) desquamation of viable and dead cells contributing to intratubular obstruction, (d) metabolic alterations resulting in transport abnormalities that can lead to abnormalities in tubuloglomerular balance, and (e) local production of inflammatory mediators resulting in interstitial inflammation and vascular congestion. 1
One prevailing weakness with the definition is that it is still entirely based on an increase in serum creatinine or decrease in urine volume. Unfortunately, creatinine is a suboptimal marker following injury, when levels are often not reflective of glomerular filtration rate (GFR) owing to a number of renal and nonrenal influences on creatinine levels. In the setting of AKI, the delay between changes in serum creatinine and changes in GFR inhibits the ability to accurately estimate timing of injury and severity of dysfunction following injury. A sudden fall in GFR to a constant low level causes a gradual increase in serum creatinine until a new steady state between generation and excretion is achieved. In our study, lisinopril (50 mg/kg), rosuvastatin (100 mg/kg), and combination of lisinopril + rosuvastatin (20 + 40 mg/kg) showed significant rise in serum creatinine levels for the period of 21 days. However, rise in serum creatinine levels were not found clinically significant. The rate of rise of serum creatinine following AKI is dependent on many factors, including the new GFR, rate of tubular secretion, rate of generation, and volume of distribution. 1 Therefore, change in serum creatinine levels alone can result in delayed diagnosis and underestimation of degree of injury of AKI.
Besides, there was no change noticed in the levels of serum urea in the presence of lisinopril (20 and 50 mg/kg), rosuvastatin (40 and 100 mg/kg) and combination therapy at lower doses. We observed significant increase in serum urea levels in the presence of lisinopril + rosuvastatin at higher dose (50 + 100 mg/kg) for the period of 14 days. Further, 66.7% mortality of animals was observed on day 16 onward. In context with this fact, the necropsies were carried out in all animals of all treatment groups and revealed no morphological changes in any organs except muscle and kidney where in we observed variation in the size of kidney. However, muscle and renal toxicities were observed in dead animals after high-dose exposure to rosuvastatin and its combination with lisinopril. Rosuvastatin (100 mg/kg) alone also showed 50% mortality in animals. Thus, rosuvastatin (100 mg/kg) and combination therapy of lisinopril and rosuvastatin (50 and 100 mg/kg, respectively) showed ≥50% mortality that could be due to muscle toxicity and renal toxicity as reported earlier. 6
Proteinuria is a feature of nephrotic syndrome, a kidney disease in which the glomeruli damaged. Proteinuria can be categorized as glomerular, tubular, and mixed in nature. 3 Proteinuria is believed to reflect a change in the balance between glomerular filtration and tubular reabsorption of protein due to increased filtration or decreased tubular reabsorption or both. The presence of low-molecular-weight urinary proteins indicates proximal tubular injury; whereas urinary high-molecular-weight proteins indicate glomerular damage. High molecular protein, primarily albumin and transferin, in the urine are increased in glomerular damage and may reflect depletion of the glomerular polyanion, which inhibits the passage of negatively charged proteins through the glomeruli. The steady loss of protein eventually leads to a serious reduction in blood albumin levels (hypoalbuminuria). An increase in low-molecular-weight proteins (microalbumin) in urine is due to the failure of proximal tubule cells to reabsorb proteins that pass through the glomerular barrier. 10 Our result demonstrated a significant decrease in serum total protein level in the presence of combination therapy of lisinopril + rosuvastatin at all the doses levels, suggesting kidney damage after the treatment for a subacute period. Rosuvastatin and lisinopril at higher doses had statistically significant decrease in serum albumin at the end of 21 days that indirectly indicates excretion of albumin in urine. The decrease in serum albumin (high-molecular-weight protein) is not clinically significant, which indicates renoprotective effect of angiotension-converting enzyme (ACE) inhibitor and hydroxyl methyl glutaryl coenzyme a reductase inhibitor. Several studies have been performed to demonstrate the additional renoprotective effect of rennin angiotensin system (RAS) using ACE inhibitors, and angiotensin II receptor blockers provides additional reduction in urinary albumin and preservation of renal function. Besides, additional use of hydroxyl methyl glutaryl coenzyme, a reductase inhibitor, has been shown to reduce albuminuria in selected patients. The renoprotective effect of hydroxymethylglutaryl coenzyme A (HMG-CoA) reductase inhibitors may be due to their effects on renal hemodynamics and glomerular autoregulation. 11 This is further supported by the urinary microalbumin levels observed in different treatments. Significant increase in microalbumin levels was also observed in rats predisposed to rosuvastatin therapy at both the doses (40 and 80 mg/kg). Combination therapy of lisinopril and rosuvastatin at all the doses did not increase microalbumin levels in urine, indicating a protective effect of lisinopril against rosuvastatin-induced microalbuminuria. These findings are parallel with the previous study reports which indicated a protective effect of lisinopril against amlodipine-induced microalbuminuria. 12
Renal albumin clearance is associated more frequently at the glomerular segment of the nephron as compared to lower molecular weight proteins (microalbumin) whose excretion is more frequent in the tubular segment of the nephron, indicating altered glomerular permeability and impaired tubular reabsorption by albuminuria and microalbuminuria, respectively. 3 Thus, the results of proteinuria, albuminuria, and microalbuminuria in the presence of antihypertensive and antihyperlipidemic drugs indicate both altered permeability and impairment of tubular reabsorption which may in turn retard GFR.
Nephron has various tubular segments which include the proximal convoluted tubules (PCTs), distal convoluted tubules (DCTs), and the collecting tubules (CTs). Microalbumin levels under study did not have site-specific tubular damage. So, further study is planned to measure urine clusterin levels (biomarker). Food and Drug Administration (FDA) recommended nephrotoxicity biomarker clusterin and its site-specific role in predicting kidney toxicity of proximal tubule and distal tubule is useful to assess early and site-specific renal toxicity. 2 Urine clusterin levels also were raised significantly in the presence of high dose of lisinopril (50 mg/kg), rosuvastatin (100 mg/kg), and combination of lisinopril + rosuvastatin at lower and higher doses, suggesting again the involvement of proximal tubule part of the nephron.
Clusterin plays an important role in tubule regeneration at proximal tubule part of the nephron. 2 Regeneration of tubules which was observed microscopically at high dose of lisinopril, rosuvastatin, and combination of lisinopril + rosuvastatin at both the doses confirmed proximal tubule toxicity of the nephron.
All treatment groups in this study did not have a change in urine composition but showed mild-to-moderate protein excretion in urine. Surprisingly, no changes were observed in the microscopic examination of urine sediment. However, lisinopril (50 mg/kg), rosuvastatin (40 and 100 mg/kg), and its combination with lisinopril had a decline in urine output, revealing a decline in GFR and indication of acute renal failure. 13
Based on our findings, it is suggested that lisinopril (low dose) seems to be safe on glomerular segment of the nephron as evident from the lack of remarkable change in urinary microalbumin levels. However, we observed significant increase in urinary clusterin levels in the presence of high dose of lisinopril that might be associated with the impairment of tubular reabsorption in proximal tubules. Further, we observed significant rise in microalbumin levels in rosuvastatin-treated animals at both the doses, but only hypoalbuminuria and urinary clusterin levels were increased at the higher dose of rosuvastatin, confirming impairment of tubular reabsorption. These findings are parallel with the clinical report of Tiwari 3 who showed (++) category proteinuria and presence of β2-microglobulin along with N-acetyl-β-d-glucosaminidase in the urine of some patients treated with rosuvastatin, indicating tubular portion involvement rather than glomerulus origin. Further, there is a report on demonstrating the secretion of rosuvastatin as a function of proximal tubular cells and not of distal tubular cells. 14 This hypothesis can be supported by sideway et al 15 who demonstrated the inhibition of uptake of albumin and β2-miroalbumin in an opossum kidney cell line (OK) by statins (fluvastatin, simvastatin, atorvastatin, rosuvastatin, and pravastatin). The results indicated that the inhibition of protein uptake was related to the degree of inhibition of HMG-CoA reductase. At the histological level, progression of mesangioproliferative glomerulonephritis is characterized by glomerulosclerosis and fibrotic destruction of the corresponding nephron tubule that closely parellels to ongoing loss in renal function. This sequence generally involves proteinuria as well as tubulointerstitial accumulation of extracellular matrix proteins, proliferation of renal cells, and infiltration with macrophages. Angiotensin-converting enzyme inhibitors are the clinically established therapeutic approach in slowing the course of chronic-progressive renal fibrosis in a manner independent of the underlying disorder, including mesangioproliferative glomerulonephritis. Rosuvastation also showed preventive action on mesangioproliferative glomerulonephritis by slowing mesangioproliferative glomerulosclerosis. 16 Contrary to this, combination therapy of lisinopril and rosuvastatin has no effect on microalbumin levels but urinary clusterin increased, again suggestive of involvement of the proximal part of the nephron.
In summary, the study of urinary biomarkers is suggestive of renoprotective mechanism of lisinopril and rosuvastatin at glomerular portion of the nephron. However, proximal tubule toxicity cannot be ruled out with a high dose of lisinopril, rosuvastatin, and their combination therapy. Thus, we suggest the risk of nephrotoxicity with higher dose of lisinopril and rosuvastatin.
Footnotes
Acknowledgments
We are grateful to our all toxicology team members including Rajesh Sunder, Vijay Kale, Shekhar Kadam, and Biren Thakkar for their support and scientific advice throughout the experiments. We also thank Sweta Patel, Tushar Patel, Satyam Patel, and Kanu Bhavsar for histopathology and clinical pathology analysis.
The authors declared no potential conflicts of interest with respect to the research, authorship, and/or publication of this article.
The authors received no financial support for the research, authorship, and/or publication of this article.