
Abstract
Keywords
Introduction
Acute kidney injury (AKI) is marked by a swift decline in kidney function and is linked with considerable morbidity and mortality. 1 While there is a wide range of insults that can induce AKI, renal ischemia/reperfusion (I/R) injury remains a prevalent factor. 2 In particular, renal I/R occurs during cardiac bypass surgery, with AKI occurring in up to 30% of patients. 3 I/R injury is also an inevitable part of kidney transplantation.4–6 It is now acknowledged that the occurrence of AKI put the individual at a greatly increased risk of progressing to chronic kidney disease (CKD).7,8 This has led to considerable interest in studying the mechanisms and pathophysiology underlying the progression from AKI to CKD. However, many questions remain unanswered.
An important strategy to investigate the underlying mechanisms of the transition from AKI to CKD is through animal models. However, there are several limitations in animal models of renal I/R to induced CKD. First, mice and rats are resistant to developing CKD after an episode of kidney I/R injury unless that injury reaches a specific threshold.9,10 This means that there is only a narrow window in which the injury is severe enough to induce renal fibrosis, but not too severe so that animals do not survive the acute insult.11,12 This problem has mostly been avoided by applying renal I/R injury to only one kidney (unilateral). However, in this model there is no measure of the severity of the acute renal I/R injury, introducing an unknown variable into the model. Besides, the unaffected kidney in the unilateral model maintains normal kidney function in the animal, so that the injured kidney undergoing fibrosis has no workload and may indeed be non-functional, thus potentially complicating the interpretation of the data. Another limitation of kidney I/R models is that a high level of surgical skill is required to reduce the marked variability often seen with this procedure.
To avoid these significant limitations of current methods, we sought to test a relatively simple new approach. We aimed to induce a differential degree of renal injury across different sections of the kidney to provide sufficient damage to the lower pole to induce robust fibrosis, while a milder injury in the upper pole would allow this part of the kidney to recover easily and to maintain kidney function. This results in robust, but well tolerated acute kidney injury at day 1 after surgery, with a rapid return to normal renal function by day 3. The upper pole recovers well from injury, but the lower pole fails to fully recover and develops marked inflammation and fibrosis despite overall normal renal function at 4 weeks. Thus, we have developed a model in which the mechanisms underpinning the transition from acute to chronic kidney injury can be investigated while avoiding some of the limitations of standard models.
Materials and methods
Experimental model and design of experiments
Male C57BL/6 mice aged 12-14 weeks and weighing 25-30g were purchased from Sun Yat-sen University Animal Experiment Center. Mice were maintained in micro-isolator cages with a room temperature set at 25°C–27°C and a 12-h light/dark cycle, with unrestricted access to specific distilled water and pathogen-free (SPF) laboratory food.
The IRI surgical procedure adhered to the approved animal protocol (SYSU-IACUC-2019-000,067) reviewed and authorized by the Institutional Animal Care and Use Committee (IACUC) at Sun Yat-Sen University, Guangzhou, China. The present study followed national guidelines for humane animal treatment and complied with the relevant legislation. Mice were anesthetized with pentobarbital sodium solution (60 mg/kg i.p.), and 1 cm incisions were made bilaterally, parallel to the vertebral column, 1 cm below the rib cage on the dorsal side, proceeding with the incision through the skin before reaching the abdominal muscle. The kidneys were positioned on both sides, and after dissection to remove the fat between the kidneys and the inferior vena cava, the renal pedicles were exposed. The pedicle of left kidney was ligated using a thread (3-0, Global biology, Beijing, China) and then the left kidney was removed using a sterilized blade. Another thread (50 cm long) was used to surround the right pedicle, knotted at both ends, and the knotted thread fixed to the pulley. When the renal pedicle was suspended with a 20g weight, a gradual transition in kidney color was observed from red to pink and eventually to blackish (Figure 1). The kidney and wound were then covered with sterile cotton gauze, soaked in pre-warmed in 38° saline. After the require time of suspending (30, 40 or 60 min), the weight and thread were removed and the kidney underwent a color transition from blackish to red. Abdominal muscles were stitched closed with surgical suture needles with thread (1/2 7*17 27 mm, 3-0, sterilized by ethylene oxide, RZ311, Jinhuan Medical, Shanghai, China), and the skin sutured closed using nylon thread (3-0, Global biology, Beijing, China). To avoid dehydration after surgery, mice were administered 1 mL of intraperitoneal saline following wound closure. Analgesia involved subcutaneous injection of Rimadyl and injection of Bupivacaine at the wound site. Sham surgery involved all procedures applied for I/R, excluding the suspension of the kidney pedicle. Schematic diagram of the surgical procedure. (a) After anesthesia, the mouse was put in a prone position; (b) Removed the left kidney, exposed the right one; (c) Put a silk thread under the lower renal branch and then raised the kidney under tension of a 20g weight using a pulley system; (d) The lower half of the kidney turned black from occlusion of the lower renal artery branch, but the change of colour was less complete in the upper pole.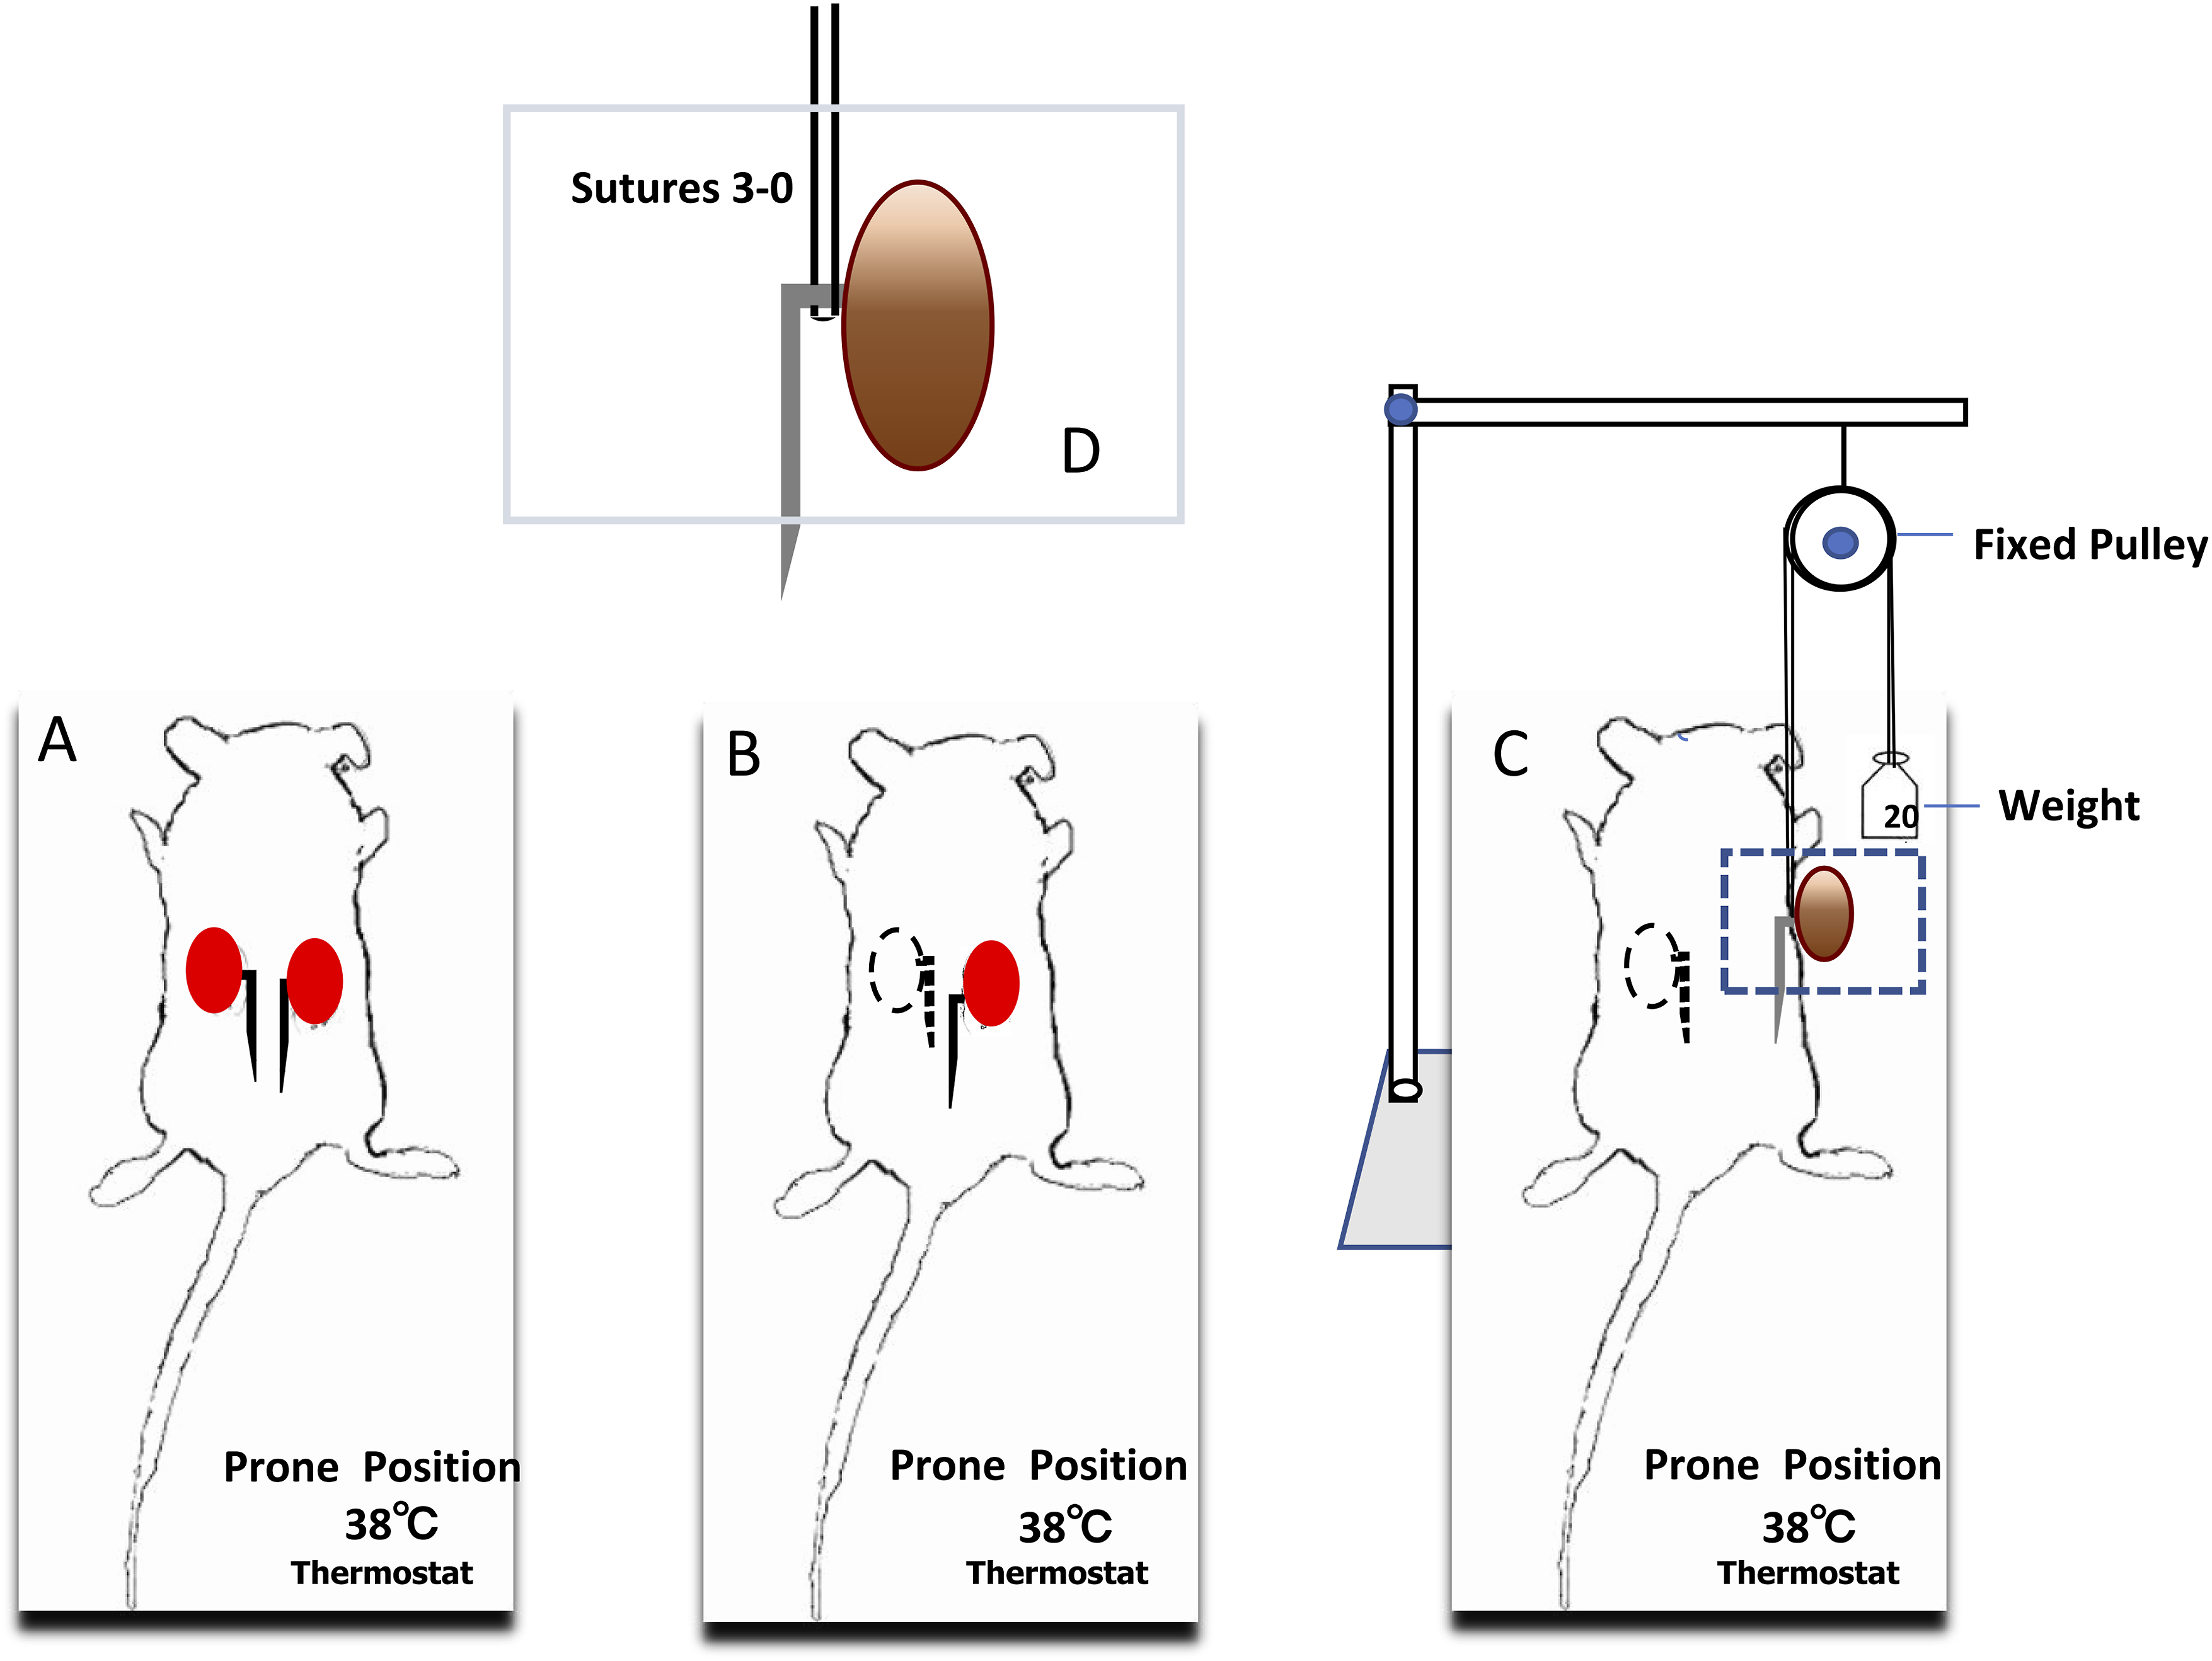
Ten groups were studied (n = 6∼8 per group): Group 1: Ischemia 30 min and reperfusion for 24h (n = 7). Group 2: Ischemia 40 min and reperfusion for 24h (n = 7). Group 3: Ischemia 60 min and reperfusion for 24h (D1-IRI) (n = 7). Group 4: Ischemia 60 min and reperfusion for 3days (D3-IRI) (n = 8). Group 5: Ischemia 60 min and reperfusion for 7days (D7-IRI) (n = 8). Group 6: Ischemia 60 min and reperfusion for 28days (D28-IRI) (n = 8). Group 7: 24h after the sham surgery for control (n = 7). Group 8: 3days after the sham surgery for control (n = 6). Group 9: 7days after the sham surgery for control (n = 6). Group 10: 28days after the sham surgery for control (n = 6).
Renal function
Mice were anesthetized and a terminal blood sample (500 μL) collected through the retro-orbital sinus, which was separated into plasma by centrifugation at 5000 r/min for 10 min at 4°C. Plasma creatinine and blood urea nitrogen were measured by Hitachi 3100 automatic biochemical analyzer by Donglin Biotechnology, Guangzhou, China.
Real-time PCR
Kidney tissue from the upper or lower pole was snap frozen. Total mRNA was then extracted from kidney tissue using TRIZOL reagent (Invitrogen, Carlsbad, CA) and reverse transcribed to cDNA using the RR036 A kit (Takara, Kusatsu, Japan). To quantify gene expression, qPCR was performed with a 7300 AB Real-time machine (CFX96 touch; BIO-RAD, US) using SYBR Green master mix (RR820 A, Takara, Kusatsu, Japan).
The following primer pairs were used: GAPDH (forward 5′ AGTATGACTCCACTCACGGC 3′, reverse 5′ CACCAGTAGACTCCACGACA-3′); KIM-1 (forward 5′ AAACAAGAGATTCCCACACG 3′, reverse 5′ GTCGTGGGTCTTCCTGTAGC 3′); NGAL (forward 5′ GAAGGAACGTTTCACCCGCTTTG 3′, reverse 5′ ACAGGAAAGATGGAGTGGCAGACA 3′); CD206 (forward 5′ GCTTCTGCCCCATCAAGAGTA 3′, reverse 5′ AGGACAGTGTGGATTGGAAGT 3′). We utilized the comparative threshold cycle (ΔCt) approach to ascertain the expression levels of the target gene and mRNA ratios are expressed as 2ΔCT when compared to the GAPDH control. The PCR controls run with template absent have a consistently negative result.
Histology
Sagittal slices of kidney tissue were subjected to overnight fixation in 10% neutral buffered formalin at room temperature. Following a brief PBS wash, fixed kidneys underwent paraffin embedding and were subsequently sectioned at 2 μm for PAS staining or at 3 μm for hematoxylin and eosin or Masson’s trichrome staining.
The tubular damage score was assessed in 25 fields in both the upper and lower poles of the kidney in PAS-stained sections. Scores ranging from 0 to three were assigned to each field based on histological morphology. Normal histology received a score of 0, while tubular swelling, loss of brush border, and accompanying nuclear loss were scored 1-3 (with <1/3 nuclear loss scored 1, 1/3∼2/3 scored 2, and ≥2/3 scored 3). Tubules containing luminal hyaline casts were counted in between 20 and 25 high power fields (×200 magnification) per section covering the outer medulla and cortex, as previously described, 13 and expressed as the average number of casts per field. All scoring was performed on blinded slides.
To evaluate collagen staining extent, a minimum of 1200 points counting was performed on the cortical area of the upper or lower pole, in Masson trichrome stained sections and under medium magnification (×200). Scoring was conducted on slides with blinded assessments.
Immunohistochemistry
Immunostaining was conducted using goat anti-collagen IV antibody (Southern Biotechnology, Birmingham, AL, United States) and rabbit antibodies to α-SMA (Abcam, Melbourne, VIC, Australia), phospho-c-Jun Ser63, phospho-Histone 2A.X Ser139, and CDKN1A (all from Cell Signalling, San Diego, CA, United States). The procedure was performed on 4 µm formalin-fixed sections after antigen retrieval, with some sections featuring a PAS counterstain, as detailed in prior descriptions. 14
Statistical analyses
Unless explicitly stated otherwise, the results are presented as mean ± standard deviation. Two-tailed Student’s t-tests were employed for comparing two groups, while one-way ANOVA with Tukey’s multiple comparison test was utilized for comparing three groups or more. Statistical analyses were conducted using GraphPad Prism software (Version 7, GraphPad Software, La Jolla, CA, USA). Statistical significance was defined as a p value less than 0.05.
Results
Surgical method
The concept behind the study was to differentially occlude the upper and lower renal branches of the renal artery. This was achieved by putting a silk thread beneath the lower renal branch and then raising the kidney using a pulley system with a 20g weight, as illustrated in Figure 1. The lower half of the kidney turned black as expected from occlusion of the lower branch of the renal artery, but the change of color was less complete in the upper pole, suggesting less complete occlusion of the upper renal artery branch (Suppl Figure 1). Color returned rapidly to the kidney upon lowering back to the normal position. All mice survived this procedure.
Acute kidney injury
An ischemic period of 30 or 40 min failed to induce significant impairment of renal function on day 1 (Figure 2(a) and (b)). However, a 60 min ischemic period resulted in acute renal failure, evidenced by a significant rise in plasma creatinine and urea nitrogen levels on day 1 (Figure 2(a) and (b)). Renal function on day 1 after an ischaemic period of 30, 40 or 60 min (IR-30min, IR-40min and IR-60min) compared to day 1 sham control. (a) Serum creatinine levels. (b) Serum urea nitrogen levels. One-way ANOVA with Tukey’s multiple comparison test. ****p < .0001; ns, not significant.
Histological analysis of the lower pole showed substantial tubular necrosis in the outer medulla and inner cortex, together with tubular dilation and hyaline cast formation at day 1 (Figure 3(a)). There was also clear tubular damage in the outer medulla and cortex in the upper pole (Figure 3(a)), but neither tubular damage or cast formation was significantly different between the upper and lower poles at day 1 (Figure 3(b) and (c)). Tubular damage on day 1 after an ischaemic period of 60 min (D1-IRI). (a) PAS staining of kidney sections in the cortex and outer medulla (OM) in the upper (U) and lower (L) poles of the kidney. Bars represent 100 μm. (b) Graph of tubular damage score. (c) Graph of tubular cast formation. One-way ANOVA with Tukey’s multiple comparison test. ****p < .0001; ***p < .001; ns, not significant.
Different trajectory of tubular damage in the upper versus lower pole following IRI
A time-course study showed that renal function returned to normal by day 3 after a 60 min I/R injury and remained normal through 28 days (Figure 4). On days 3 and 7, substantial recovery of normal kidney structure was observed in the upper pole. The lower pole showed some recovery of renal structure on day 3, but ongoing tubular damage and a mononuclear cell infiltrate were evident on day 7 and both tubular injury and cast formation were more severe in the lower pole on days 3 and 7 (Figure 5(a)–(e)). Renal function on day 1, 3, 7 and 28 after an ischaemic period of 60 min. Day 0 indicates sham controls. (a) Serum creatinine levels. (b) Serum urea nitrogen levels. Tubular damage on day 3 and day 7 after an ischaemic period of 60 min (D3-IRI and D7-IRI). (a) PAS staining of kidney sections in the cortex and outer medulla (OM) on day 7 in the upper (U) and lower (L) poles of the kidney. Bars represent 100 μm. (b) Graph of tubular damage score on day 3. (c) Graph of tubular cast formation score on day 3. (d) Graph of tubular damage score on day 7. (e) Graph of tubular cast formation score on day 7. One-way ANOVA with Tukey’s multiple comparison test. ****p < .0001; ***p < .001; **p < .01; *p < .05; ns, not significant.

Markers of acute tubular damage, such as KIM-1 and NGAL, are also associated with chronic kidney injury.15–18 Analysis by RT-PCR on day 7 showed that mRNA levels of KIM-1 and NGAL were almost normal in the upper pole, but were substantially elevated in the lower pole (Figure 6(a) and (B)). In addition, there was a significant increase in CD206 mRNA levels, indicative of M2-type macrophages, specifically observed in the lower pole but not the upper pole, on day 7 after I/R injury (Figure 6(c)). RT-PCR analysis of mRNA levels in the upper (U) and lower (L) kidney poles on day 7 after an ischaemic period of 60 min (D7-IRI-U and D7-IRI-L) compared to sham controls (D7-CTL). (a) KIM-1/HAVCR1, (b) NGAL/LCN2 and (c) CD206. One-way ANOVA with Tukey’s multiple comparison test. ***p < .001; **p < .01; *p < .05; ns, not significant.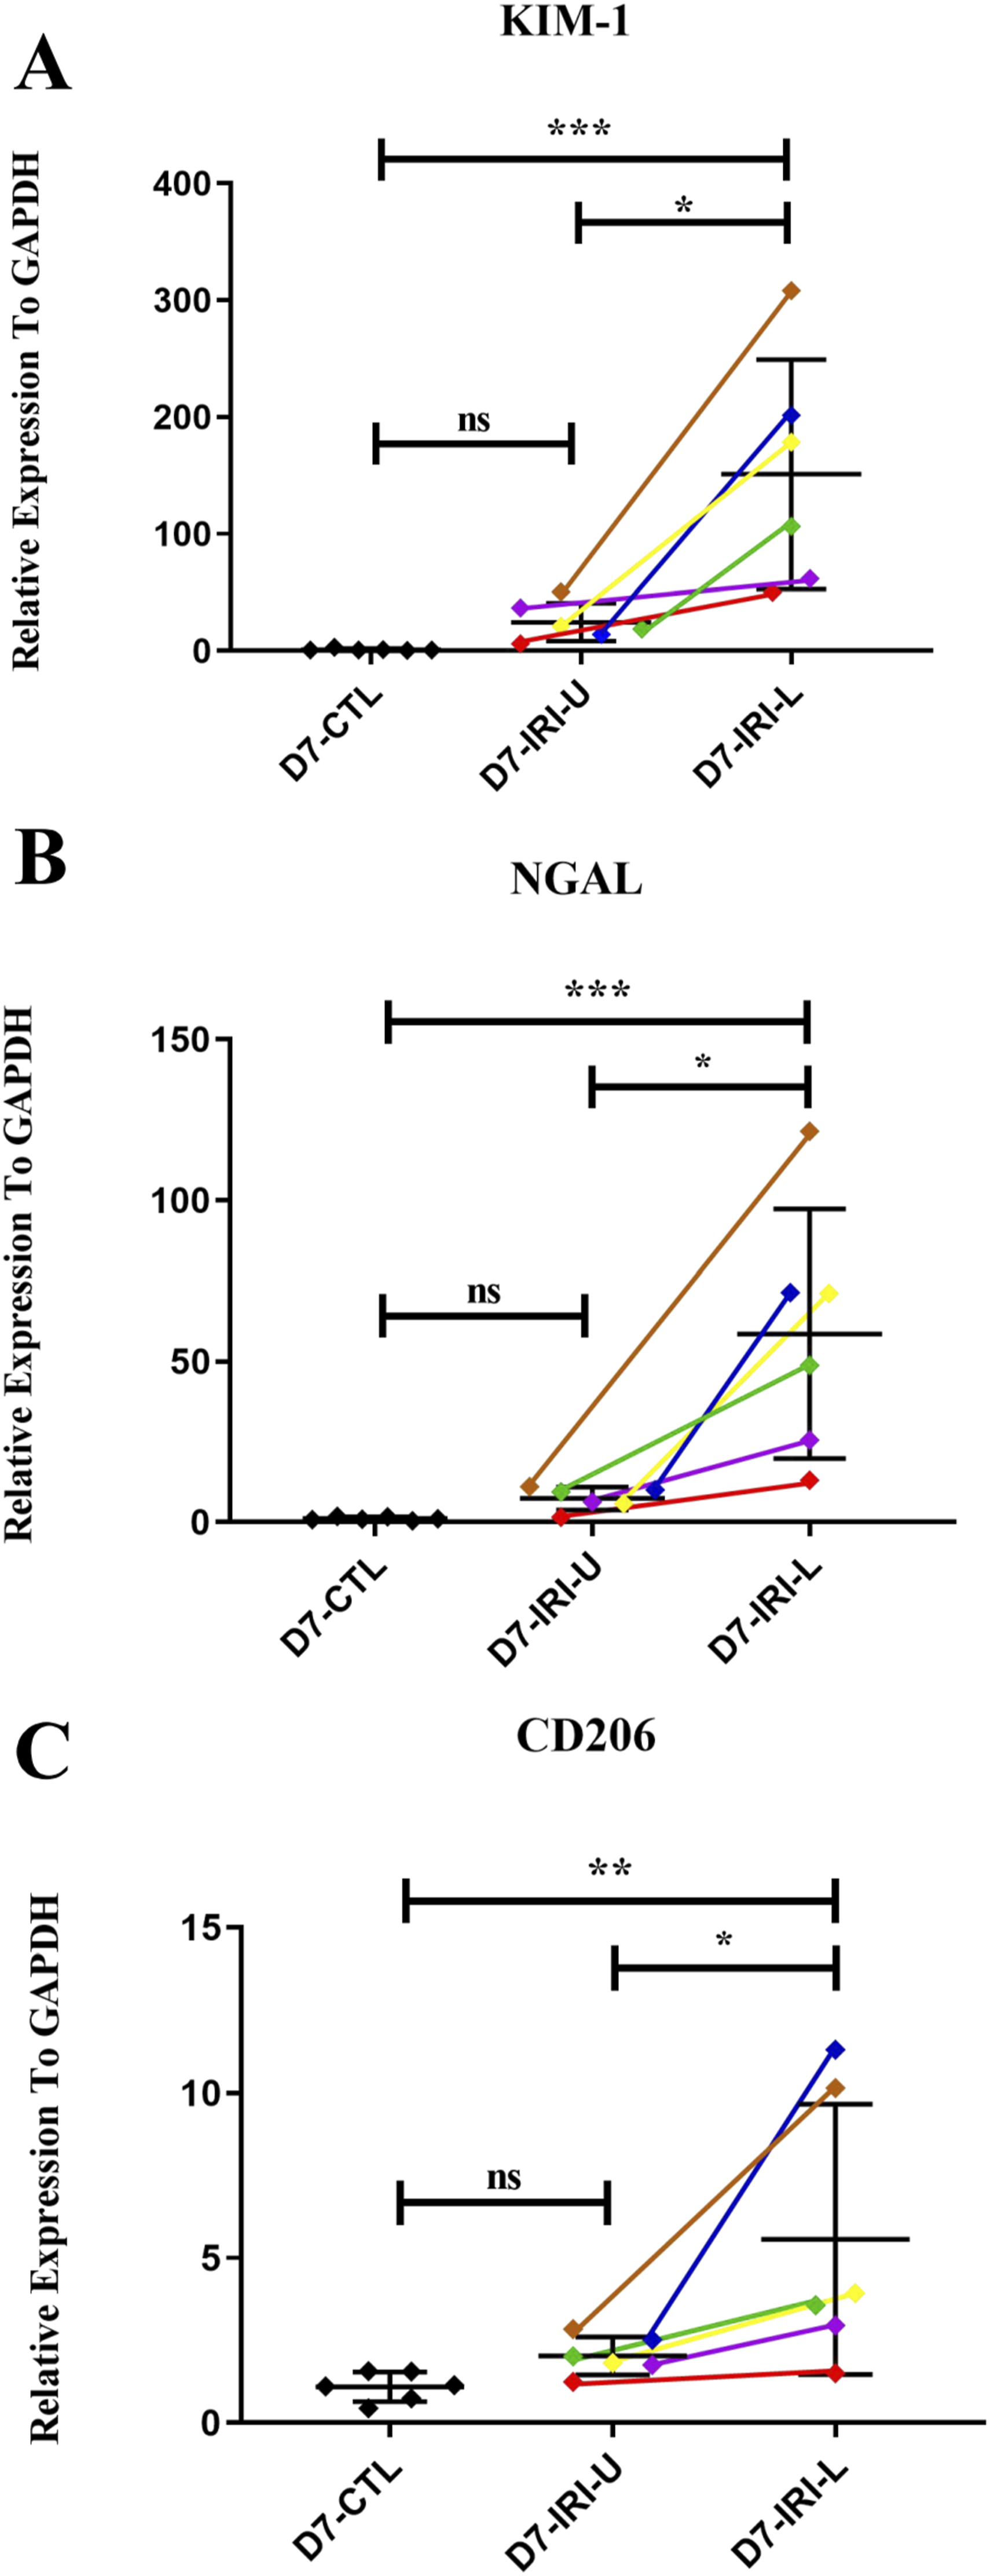
The enzyme c-Jun amino terminal kinase (JNK) is highly responsive to reactive oxygen species (ROS) and is recognized as a stress-activated protein kinase. 19 JNK is the exclusive enzyme responsible for phosphorylating c-Jun at Serine 63, making the identification of p-c-Jun Ser63 as a reliable surrogate marker for the activation of JNK.20–22 Positive staining for p-c-Jun in the upper pole of kidneys was observed only in very occasional cells on day 3, 7 and 28 after I/R injury (Suppl Figure 2). By contrast, numerous cells expressing p-c-Jun were observed in the lower pole of the kidney on day 3, 7 and 28 (Suppl Figure 2).
Ki67 is a marker of cell proliferation. Although there was no increase in Ki67+ tubular cells on day 1 of IRI, infiltrating neutrophils around damaged tubules in the outer medulla were stained with Ki67 on day 1 (Suppl Figure 3(A) and (B)), consistent with the known role of cell cycle proteins in the production of neutrophil extracellular traps. 23 A peak of tubular cell proliferation was evident on day 3. In the lower pole, tubular proliferation was substantially higher than in the upper pole on day 3 and remained significantly higher at both day 7 and 28. Tubular proliferation in the upper pole returned to sham levels on day 28, but remained significantly elevated in the lower pole (Suppl Figure 3(A) and (B)), indicating ongoing damage (either as ongoing proliferation or cells in G2/M arrest).
The protein survivin/Birc5 has an anti-apoptotic function and has been implicated in the repair of tubular cells after renal IRI. 24 Survivin is expressed throughout the proximal tubule in the cortex and outer medulla in the sham kidney (Suppl Figure 4). However, this expression is substantially down regulated in the lower pole on day 1 IRI indicating tubular damage, and only partially recovers by day 28, with substantial areas still lacking survivin expression. By contrast, survivin expression is largely maintained, except in damaged tubules, in the upper pole on day 1 and survivin expression returns to normal in the upper pole on day 7 and 28 (Suppl Figure 4). These data provide a clear demonstration of the different trajectory of tubular injury in the upper and lower kidney poles in this model.
Development of renal fibrosis
Tubular damage was evident in the lower pole on day 28 after IRI, whereas these lesions had resolved in the upper pole (Figure 7(c)). Masson trichrome staining showed substantial tubular damage and interstitial collagen deposition in the lower pole of the kidney on day 28 after I/R injury, whereas the upper pole showed relatively normal histology and no increase in the area of collagen staining (Figure 7(a) and (b)). Accumulation of α-SMA + myofibroblasts and elevated deposition of collagen IV were observed in the cortex of the lower pole on day 28 after I/R injury, whereas there was little change in α-SMA and collagen IV staining in the upper pole (Suppl Figure 5). Renal fibrosis on day 28 after an ischaemic period of 60 min (D28-IRI). (a) Masson trichrome staining of kidney sections in the cortex and outer medulla (OM) in the upper (U) and lower (L) poles of the kidney on day 28. Bars represent 100 μm. (b) Graph of interstitial collagen deposition on day 28. (c) Graph of tubular damage score from analysis of PAS-stained sections. One-way ANOVA with Tukey’s multiple comparison test. ****p < .0001; ***p < .001; **p < .01; ns, not significant.
DNA damage participates in the transition of AKI to CKD. 25 DNA damage was identified through immunostaining for p-H2A.X. Sham controls showed an absence of p-H2A.X staining. Small numbers of p-H2A.X+ tubular cells were observed in the upper pole of the kidney in day 28 after I/R injury, whereas many p-H2A.X+ cells were seen in the lower pole (Suppl Figure 6(A)).
Cyclin Dependent Kinase Inhibitor 1A (Cdkn1a/p21CIP1) is considered a marker of senescent tubular epithelial cells; a process thought to contribute to progression to CKD. However, very few cells were stained for p21CIP1 in either the upper or lower pole of the kidney on day 28 after I/R injury (Suppl Figure 6(B)).
Discussion
It is well recognized that the severity of AKI predicts progression to CKD in patients. 26 A wide range of I/R protocols have been tested in experimental animals to model human AKI and to study the mechanisms of progression from AKI to CKD. 27 Severe ischemic AKI is required to induce renal fibrosis within a 2 to 4 week period in experimental animals, but this also causes significant mortality.27,28 To overcome this major limitation, most studies use unilateral I/R injury to induce renal fibrosis with the contralateral kidney able to maintain animal health. 29 We have developed a simple model which does not require using vascular clamps to stop the blood flow to the kidney. The advantages of this model and the development of renal fibrosis are discussed below.
One particular advantage of this approach is that reperfusion was very rapid and consistent following the lowering of the kidney and removal of tension. One challenge with current I/R models is the significant inter-operator variability in AKI severity, arising from differences in the details of vascular clamping procedures, including both the application and removal of vascular clamps, which is prone to damage the vessels and prevent a rapid and complete reperfusion.30,31 While seldom quantified, it is thought that damage to the renal artery can be a significant cause of variation in the severity of renal impairment seen in conventional IRI models.
A second advantage of the model is that while severe renal failure is evident on day 1, this had resolved by day 3 and remained normal thereafter to the 28-days time point, while developing significant renal fibrosis in the lower pole of the kidney. By contrast, models of bilateral IRI exhibit a more prolonged period of severe renal failure, which often results in the loss of some animals.27,28,32 The alternative approach of clamping only one kidney to induce fibrosis while renal function is supplied by the contralateral kidney does prevent mortality,29,33 but this situation is rarely seen in clinical disease. Our model perhaps more closely mimics the clinical setting in which I/R occurs in the setting of cardiac surgery or severe hypotension and does not involve total cessation of the blood supply to the kidney, and patients can quite rapidly recover renal function but are at increased risk of developing CKD. In our model, we can see “silent” fibrosis – a cardinal feature of CKD progression – with normal serum creatinine levels.
In standard IRI models, a mild to moderate AKI can resolve within 7 days without early development of renal fibrosis, whereas a severe will induce a maladaptive repair response leading to the rapid development of renal fibrosis.28,29,34 While there is significant injury to the upper pole seen on day 1 of the current model, this recovers progressively by day 7, in association with the return to normal renal function by day 3. By contrast, histologic damage is much more severe in the lower pole on days 3 and 7, leading to the development of renal fibrosis by day 28 as demonstrated by accumulation of α-SMA + myofibroblasts and increased deposition of collagen IV.
Other features of progressive tissue damage are evident in the lower pole in this model. High levels of cell proliferation in tubules on days 3 and 7 are indicative of an attempted repair response, while the substantial cell proliferation in the interstitial space is consistent with local proliferation by α-SMA + myofibroblasts and infiltrating macrophages. In addition, p-c-Jun is an exquisite marker of oxidative stress and kidney inflammation and fibrosis. The sustained presence of p-c-Jun + cells, particularly tubular cells, in the lower pole is consistent with activation of JNK signalling which has been implicated in driving interstitial fibrosis in human and experimental kidney disease.14,22,35,36 By contrast, relatively little p-c-Jun staining was observed in the upper pole on days 7 and 28, consistent with recovery of this part of the kidney with no fibrosis and much less cell proliferation. Furthermore, the profound and sustained loss of surviving expression by proximal tubules in the lower pole is consistent with a maladaptive repair response, while the partial loss of surviving expression in the upper pole on day 1 recovered by day 7 in concert with effective repair.
A strength of this model is that the mice remain healthy for a prolonged period after I/R injury with no mortality. This provides an attractive model for testing interventions that can halt or even reverse the fibrotic response. Renal function impairment can be measured at 24h to determine the degree of the initial injury and thus allow animals to be allocated to different treatment groups to study potential therapies.
This study has several limitations. First, the observation period was limited to 28 days. Future studies are needed to investigate whether fibrosis develops in the upper pole over a longer timeframe, and whether renal function deteriorates beyond the 4-weeks time point. Second, as we were developing a disease model, we did not conduct a pre-hoc sample size calculation; however, statistically significant differences in the main endpoints were observed with 6-8 mice per group, indicating the reliability and generalizability of our results.
Conclusion
In conclusion, we have developed a simple model of I/R injury that is very well tolerated in which the mechanisms underpinning the transition of acute to chronic kidney injury following I/R injury can be investigated while avoiding some of the limitations of standard models.
Supplemental Material
Supplemental Material - A gradient model of renal ischemia reperfusion injury to investigate renal interstitial fibrosis
Supplemental Material for A gradient model of renal ischemia reperfusion injury to investigate renal interstitial fibrosis by Fan Yang, Baoping Zhu, Elyce Ozols, Haitao Bai, Mengjie Jiang, Frank Y Ma, David J Nikolic-Paterson, and Xiaoyun Jiang in International Journal of Immunopathology and Pharmacology
Footnotes
Authors’ note
The present study followed international, national, and/or institutional guidelines for humane animal treatment and complied with relevant legislation.
Acknowledgments
We would like to extend our appreciation to the China Scholarship Council for their support, which enabled the successful completion of this international collaboration.
Author contributions
Conceptualization, F.Y., D.J.N.-P. and B.P.Z.; Methodology, F.Y., E.O., F.Y.M. X.Y. J.; Validation, E.O., M.J.J. and F.Y.M.; Formal Analysis, F.Y., E.O., D.J.N.-P., F.Y.M. and B.P.Z.; Investigation, F.Y., E.O. and F.Y.M.; Data Curation, F.Y. B.P.Z. and D.J.N.-P.; Original Draft Preparation, F.Y., B.P.Z. and X.Y. J.; Final Manuscript Preparation, X.Y. J. and D.J.N.-P.; Supervision, H.T.B., X.Y. J. and D.J.N.-P.; Funding Acquisition, H.T.B., M.J.J., X.Y. J. and D.J.N.-P.
Declaration of conflicting interests
The author(s) declared no potential conflicts of interest with respect to the research, authorship, and/or publication of this article.
Funding
The author(s) disclosed receipt of the following financial support for the research, authorship, and/or publication of this article: This work was funded by the National Natural Scientific Foundation of China (No. 82170687), National Key Research and Development Program of China (No. 2022YFC2705104) and Fujian Natural Science Foundation Project (2022J011377).
Ethical Statement
Data Availability Statement
The raw data supporting the conclusions of this article will be made available by the authors, without undue reservation, to any qualified researcher.
Supplemental Material
Supplemental material for this article is available online.
References
Supplementary Material
Please find the following supplemental material available below.
For Open Access articles published under a Creative Commons License, all supplemental material carries the same license as the article it is associated with.
For non-Open Access articles published, all supplemental material carries a non-exclusive license, and permission requests for re-use of supplemental material or any part of supplemental material shall be sent directly to the copyright owner as specified in the copyright notice associated with the article.