
Abstract
Three doses of (+)-usnic acid (100, 200, and 240 mg/kg per d) were administered orally to Wistar rats for 8 days, and metabonomic characterization of (+)-usnic acid-induced liver injury based on gas chromatography–mass spectrometry metabolic profiles was evaluated. Serum biochemical analysis and histopathological examinations were simultaneously performed. The liver/body weight ratio was significantly increased in (+)-usnic acid-treated groups, whereas serum alanine aminotransferase and total bilirubin were significantly elevated. In liver sections of 200 and 240 mg/kg dosage groups, widespread hydropic degeneration of hepatocytes was observed. Clusters in partial least squares discriminant analysis score plots showed control and (+)-usnic acid-treated groups had an obvious separation. (+)-Usnic acid exposure can lead to disturbances in energy metabolism, amino acid metabolism, lipid metabolism, and nucleotide metabolism, which may be attributable to (+)-usnic acid toxicological effects on the liver through oxidative stress. The significant changes in 22 metabolites in liver might be adopted as potential biomarkers.
Keywords
Introduction
Dietary and herbal supplements use has become increasingly common worldwide. An estimated 72 million US adults are reported using complementary and alternative medical therapies in 2002, including over 38 million US adults using herbal supplements. 1 Unlike prescription medications, dietary and herbal supplements are perceived to be free of adverse effects, and these supplements do not need to be established as safe and efficacious before marketing. Therefore, some supplement-related toxicities are discovered after they appear on the market.2–4 This has prompted the relevant government agencies and researchers to pay close attention to these supplements.
Two of these supplements, Lipokinetix and UCP-1 that had been marketed as weight loss agents, had caused liver injury and acute liver failure in some cases. The key constituent of Lipokinetix and UCP-1 is usnic acid, which is a secondary metabolite derived from lichens, having a broad range of biologic properties, such as antimicrobial, anti-inflammatory, antiviral, antifungal, and antimitotic properties. Since usnic acid has been used for thousands of years and is still used worldwide, 5 a toxicological evaluation of usnic acid is being conducted.
Previous studies have shown that usnic acid-induced liver injury was associated with causing the uncoupling of oxidative phosphorylation in liver mitochondria, with resultant loss of mitochondrial respiratory control and inhibition of adenosine triphosphate (ATP) synthesis. 6 These investigators also identified a directly hepatotoxic effect of usnic acid on isolated rat hepatocytes in a mechanism similar to carbon tetrachloride, which involved free radical generation with resultant cell membrane and mitochondrial injury, lipid peroxidation, disturbed calcium homeostasis, and cell death. These results were confirmed by another research group for inhibited of mitochondrial function and induced oxidative stress by usnic acid in mouse hepatocytes. 7 Additionally, a recent study further explored these findings in isolated mouse liver mitochondria using a mitochondria-specific microarray. 8 The genes associated with complexes I through IV of the electron transport chain, fatty acid oxidation, Krebs cycle, apoptosis, and membrane transporters were significantly induced. However, the global molecular mechanisms of usnic acid-induced liver injury still remain to be explored.
Metabonomics, a novel methodology in systems biology, can monitor the global outcome of all influencing factors, without making assumptions on the effect of any single contribution to that outcome. 9 The information obtained from metabonomic study is complementary to that from proteomics and genomics and provides a connection between the “omics” and the actual tissue histology. 10 Moreover, metabonomics also has large practical advantages over other “omic” technologies such as transcriptomics and proteomics in that metabolic pathways are well conserved between mammalian species, and the analytical tools required to globally profile metabolism suit various species, 11 making it convenient to extrapolate the metabolic results from preclinical animals to human. Metabonomic has been applied to various toxicological studies, which provided novel insights into the molecular mechanisms and makes an effort to discover new specific biomarkers that relate to toxicity.12,13 Thereby, in this study, the mechanisms of (+)-usnic acid (usnic acid)-induced liver injury were investigated by examining plasma and liver tissue extracts obtained from the rats repeatedly exposed to different doses of usnic acid by the gas chromatography–mass spectrometry (GC-MS)-based integrated metabonomic approach. Serum biochemical analysis and histopathological examinations were simultaneously performed. The goal of our study is to determine the impact of usnic acid toxicity on metabolic pathways to acquire a further understanding on the underlying molecular mechanisms and potential biomarkers.
Materials and Methods
Chemicals and Reagents
N-methyl-N-trimethylsilyltrifluoroacetamide (MSTFA), trimethylchlorosilane (TMCS), xylitol, methylhydroxylamine hydrochloride, and pyridine were of analytical grade and purchased from Fluka (Buchs, Switzerland). n-Heptane are chromatography pure (Merck, Germany). (+)-Usnic acid (usnic acid) was purchased from Lion Biological Technology Co Ltd (Zhengzhou, China; purity, >99%). Carboxylmethylcellulose (CMC) was of analytical grade from China National Pharmaceutical Group Co (Shanghai, China).
Animal Study and Sample Collection
Male Wistar rats (280-300 g; Silaike Co, Shanghai, China) were housed in an environmentally controlled room at 25 ± 1°C with a relative humidity of 50% ± 10% under a cycle of 12 hours each light/dark. Food and tap water were provided ad libitum. The rats were administered usnic acid suspensions daily at doses of 100, 200, and 240 mg/kg body weight or vehicle (1% CMC) by oral gavage for 8 days (10 mL/kg, n = 7), respectively. Plasma samples were collected from orbital venous plexus on day 3, day 6, and 24 hours after the final administration on the 8th day (day 9) with centrifugation at 4000 rpm for 15 minutes at 4°C, and then immediately frozen at −80°C prior to GC-MS analysis (n = 7). All rats were euthanized under chloral hydrate anesthesia on day 9. Serum was separated by centrifugation at 4000 rpm for 15 minutes at 4°C on day 9 and immediately used for clinical biochemical analysis (n = 7). The livers were immediately removed postmortem from each animal and weighed. Then, 200 mg excised samples from the left lateral liver lobe were immediately flash frozen in liquid nitrogen for GC-MS analysis (n = 7). The remaining liver lobes and other major organs were used for histopathological examinations. The weighing and excision of tissues were carried out in an ice bath, and the time was controlled within 60 seconds postmortem before freezing in liquid nitrogen. All the protocols and studies involving the animals were conducted in accordance with the guidelines of the NIH and the Animal Care and Use Committee of Zhejiang University.
Clinical Chemistry Analysis
Clinical chemistry analysis of serum samples was carried out with a Hitachi 7600 Automatic Analyzer using appropriate kits. The following parameters were tested: alanine aminotransferase (ALT), aspartate aminotransferase (AST), alkaline phosphatase (ALP), total bilirubin (TBILI), and triglyceride (TG).
Histopathology
The heart, liver, spleen, lung, and kidney were removed 24 hours after the final administration on the 8th day and fixed with 10% formalin. After being sectioned, the thin sections of the tissues were stained with hematoxylin and eosin for histological observation in a nonblind fashion.
Samples Preprocessing and GC-MS Analysis
For metabonomics analysis, sample preprocessing and GC-MS analysis were carried out with reference to our previous study. 14 Briefly, liver samples (200 mg) were homogenized in 1 mL sodium chloride (1 mol/L). Both the plasma samples (50 μL) and the aqueous extracts of liver tissues (100 μL) were thawed before the immediate addition of acetone (100 μL for the plasma and 200 μL for the liver homogenate) to stop enzymatic activity. Then, all samples were mixed with the internal standard (0.3 mg/mL xylitol, 5 μL for the plasma, and 10 μL for the liver homogenate). The mixture was centrifuged (10 000 rpm) for 10 minutes to precipitate the proteins after vigorous shaking for 1 minute and ultrasonication for 15 minutes with incubation in ice. The supernatant (100 μL for the plasma sample and 200 μL for the liver sample) was transferred into a GC vial and evaporated to dryness with nitrogen gas. Derivatization was performed using methoxyamine pyridine (15 mg/mL, 35 μL for the plasma sample, and 50 μL for the liver sample) at 70°C for 1 hour, followed by derivatization using MSTFA with 1% TMCS (35 μL for the plasma sample and 50 μL for the liver sample) at room temperature for 1 hour. n-Heptane (100 μL for the plasma sample and 150 μL for the liver sample) was added to dilute the solution, and the supernatant was used for GC-MS analysis.
The system consisted of an Agilent 7683 Series mass spectrometer coupled to an Agilent 6890 GC (Agilent Technologies, Atlanta, Georgia) with an autosampler. About 2.0 μL of the derivative sample was injected into a ZB-5MS column (30 m × 250 μm × 0.25 μm) with helium as carrier gas at a flow rate of 0.8 mL/min. The temperature of the ion source was adjusted to 230°C and that of the quadrupole was set to 150°C. Electron impact mass spectra were recorded at 70 eV and 2 scan/s. Full-scan mass spectra were acquired from 60 to 600 m/z at 5 scan/s. To achieve optimal separation, we set a gradient temperature program. The column temperature was initially maintained at 70°C for 5 minutes and increased from 70°C to 100°C at a rate of 10°C/min. After being maintained for 5 minutes at 100°C, the temperature was increased to 200°C at a rate of 10°C/min. After being held for 10 minutes at 200°C, the temperature was increased to 300°C at a rate of 10°C/min and maintained for another 10 minutes.
Validation of Analytical Method
The applied GC-MS method was validated prior to the analysis of the experimental samples; the factors considered in the validation included the stability, injection precision, intraday precision, and interday precision of sample preparation. Stability was demonstrated by conducting repeated autosampler analyses of the same sample at 4-hour intervals covering a period of 24 hours. The RSDs of the main peaks ranged from 5.37% to 14.93% in the plasma and from 7.28% to 14.68% in liver. Injection precision was determined by the continuous detection of 6 injections of the same sample, and the RSDs of the peak intensities for each commensal metabolite were calculated. The RSDs of the main peaks ranged from 3.40% to 14.61% in the plasma and 2.09% to 13.29% in the liver. Intraday precision was investigated through 6 injections in 24 hours at an interval of 4 hours from the same plasma or liver sample after preparation. Then, 6 parallel samples were prepared using the same preparation protocol. The resultant RSDs of the main peaks in the plasma ranged from 4.99% to 14.79% for the intraday precision test and from 3.48% to 14.29% in the liver samples. Interday precision was determined through 6 injections in 3 days at an interval of 12 hours from the same liver or plasma sample after preparation. The interday precision test RSDs of the main peaks ranged from 8.02% to 14.72% in the plasma and from 4.87% to 14.78% in the liver.
Identification of the Endogenous Metabolites
All collected plasma or liver samples were analyzed and low-molecular-weight metabolites were represented as the chromatographic peaks in the GC-MS total ion current (TIC) chromatograms. Identification of the peaks of interest was performed by searching in NIST v1.0.0.12 mass spectra library and comparing with the peaks of standards. A majority of them can be well identified based on the NIST library. Furthermore, the identification of metabolites was performed using the commercial available standards by comparing their MS spectra and retention time, including 22 kinds of natural amino acids, the major organic acids, saccharides, fatty acids in biofluids, and cholesterol.
Data Processing and Pattern Recognition
The retention characteristics, intensities (peak areas), and the MS spectra of the endogenous metabolites in GC-MS data were involved in date processing. In order to handle the complex metabonomics data, a matrix of peaks present in the collected samples must be generated. For this purpose, data denoizing and peak detection were performed first based on the TIC chromatogram, using Agilent-Enhanced ChemStation software (Agilent Technologies). Peaks with intensities higher than 10-fold of the signal-to-noise (S/N) ratio were recorded. The relative intensity of each peak was normalized against that of the internal standard in a specific GC-MS run. The commensal peaks were aligned to generate a 2-dimensional data table, in which rows and columns represent the samples and the relative peak areas of commensal metabolites, respectively. The resulting data table was imported into the SIMCA-P (version 11, Umetrics AB, Sweden) software for the multivariate analysis. First, in order to discern the presence of inherent similarities of chromatogram profiles, a unsupervised pattern recognition (PR) method, principal component analysis (PCA), was performed on the plasma and liver metabonomics data, respectively. Next, a supervised PR method, partial least squares discriminant analysis (PLS-DA) was performed to maximize the separation between the changes observed in the plasma or liver samples. In PLS-DA, “variable importance plot,” a rapid visualization, was also performed. The values of variable importance in the projection (VIP) larger than 1 in the first component of PLS-DA model were selected as the candidates of potential biomarkers. Finally, significance of the between-group (between each usnic acid treatment group and control group) difference for these metabolites was examined by 2-tailed, 2-sample Student t tests, and P < .05 was considered statistically significant.
Statistical Analysis
Statistical analysis was performed by 2-tailed, 2-sample Student’s t-test between each usnic acid treatment group and control group. The level of significance was set at P < .05. Values are represented as mean ± standard deviation (SD).
Results
General Toxicity
First, we investigated the acute toxicity of usnic acid. More than 50% of the rats were dead within 8 days in 240 mg/kg dosed group, whereas no death occurred in 100 and 200 mg/kg groups. Body weights and the liver/body weight ratios were measured to determine the physiological changes in these parameters for the experimental animals in 100 and 200 mg/kg groups. Body weight gain showed no significant change in rats administered 100 mg/kg usnic acid for 8 days, and decreased in rats administered the 200 mg/kg dose, but the change was not significant (P < .05) in this group after 8 days of drug treatment compared with control group (Figure 1A). The decrease may be a result attributable to the weight loss-inducing properties of usnic acid. The liver/body weight ratios were significantly increased in the usnic acid treatment groups in a dose-dependent manner, whereas the 200 mg/kg-dosed group increased 16.4% compared with control group (3.83% ±0.49% vs 3.29% ± 0.36%; Figure 1B). These results indicate that the physiological condition of the experimental animals might start to change above 100 mg/kg and might significantly change at 200 mg/kg.
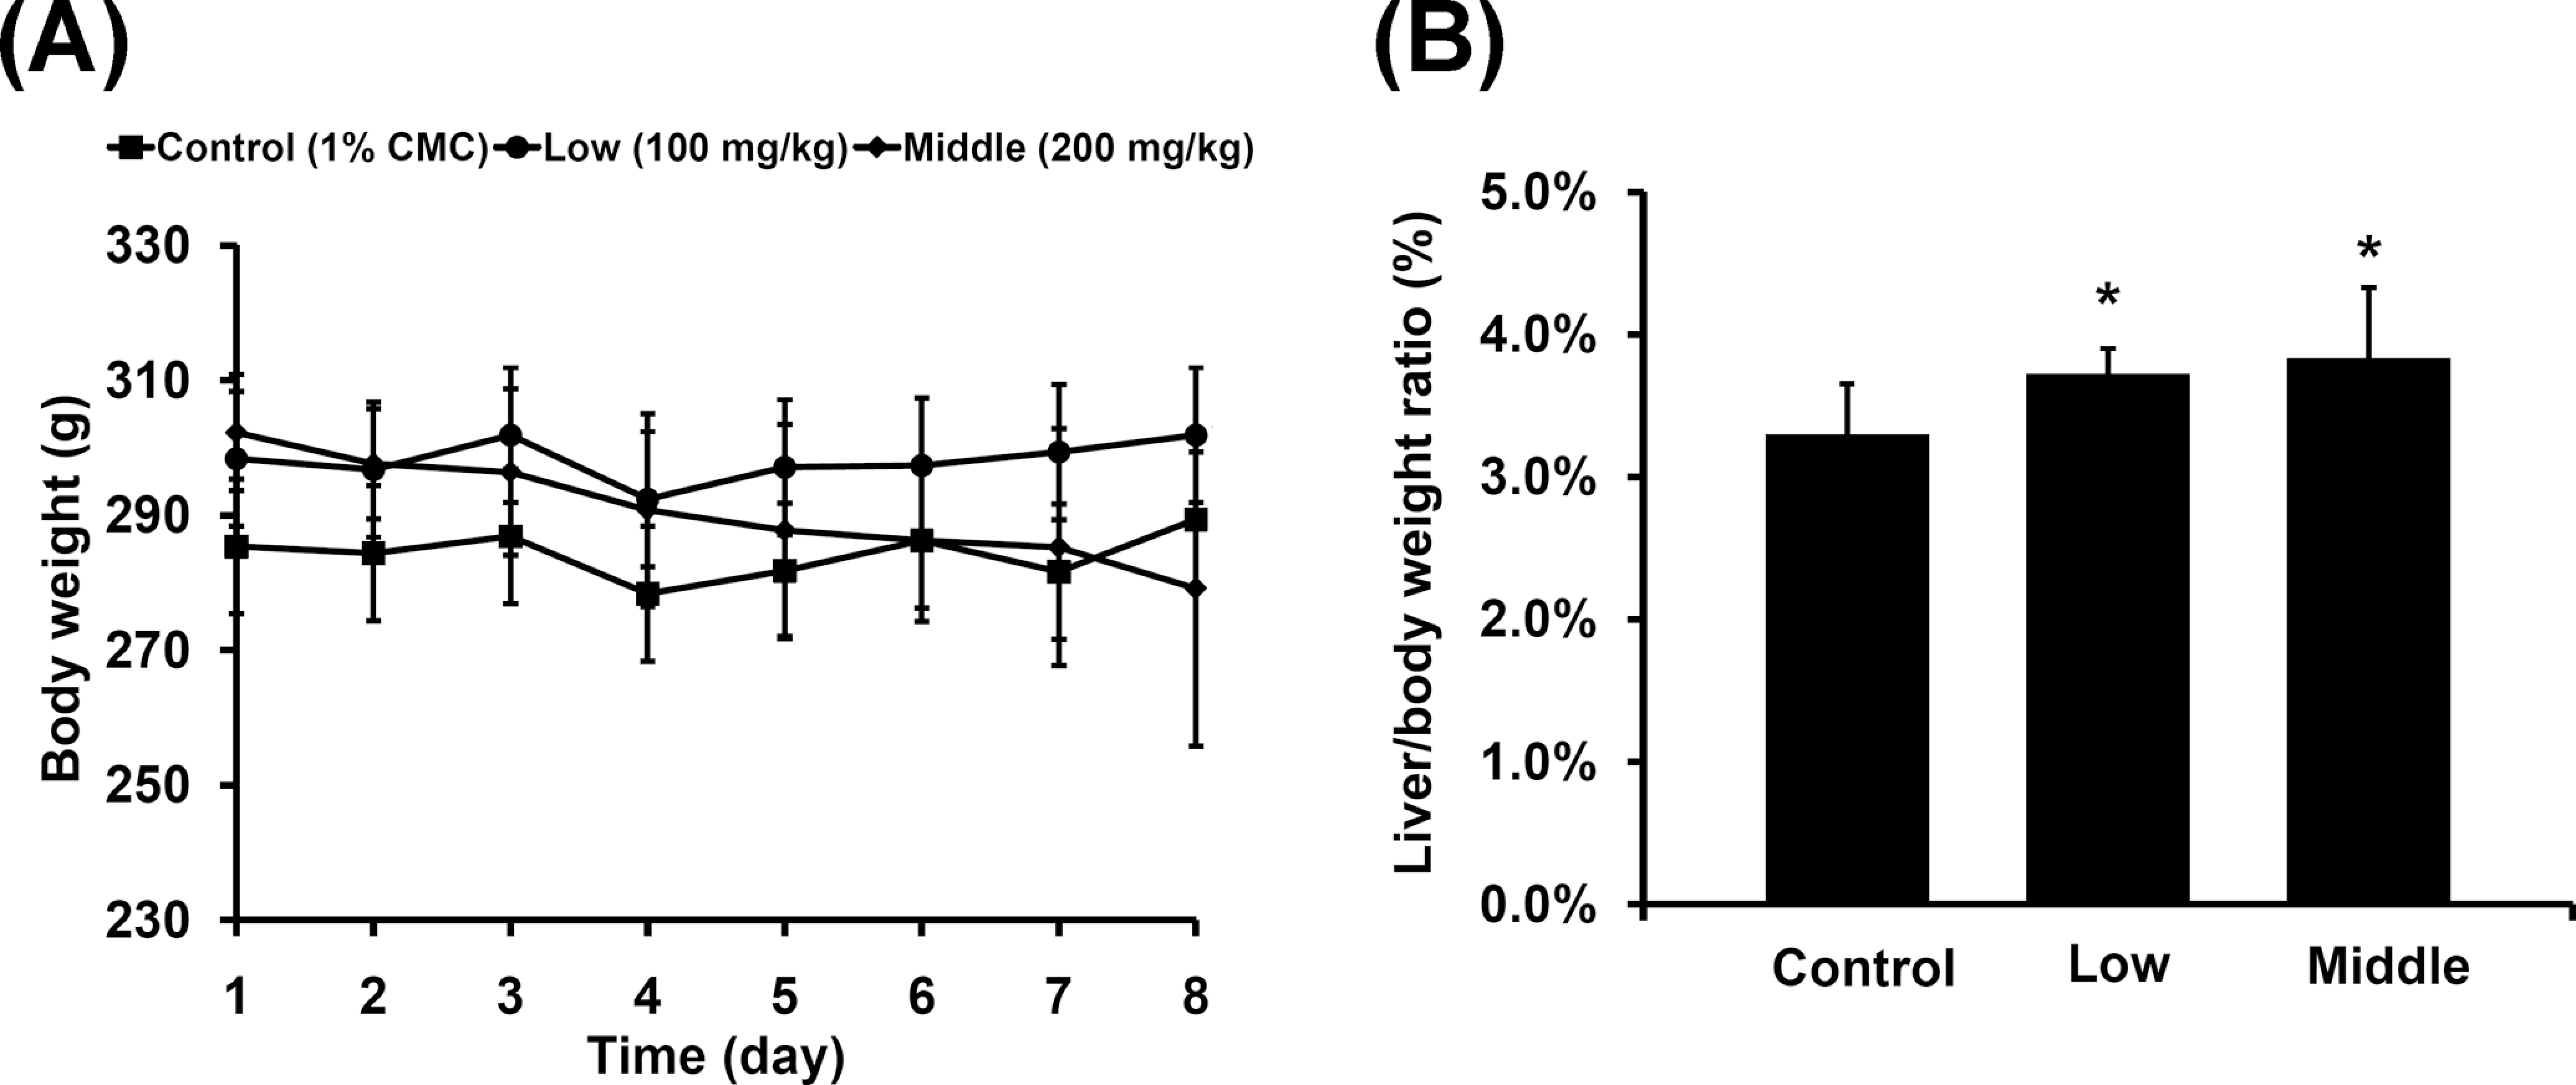
A, Change in body weight after multiple daily oral administrations of usnic acid for 8 days (squares, control; circles, 100 mg/kg usnic acid treatment group; diamonds, 200 mg/kg usnic acid treatment group). B, Change in liver/body weight ratio after usnic acid treatment on day 9. Values are expressed as mean ± SD; n = 7 individual rats per group. * P < .05 compared to vehicle control.
Histopathological Examination and Clinical Chemistry
Because of the death in 240 mg/kg dosed group, we detected the heart, liver, spleen, lung, and kidney in usnic acid treatment rats with hematoxylin and eosin staining. No obvious damages were detected in the heart, spleen, lung, and kidney tissues in all usnic acid treatment rats (data not shown), except in the liver tissue. A comparison of hematoxylin and eosin liver sections obtained from the control and usnic acid treatment rats indicated widespread hydropic degeneration of hepatocytes in the middle- and high-dose (200 and 240 mg/kg) groups, and no overt sign of toxicity was found in low-dose (100 mg/kg) group (Figure 2). As shown in Figure 2, hepatocytes with hydropic changes were swollen edematous hepatocytes with large clear spaces in cytoplasm, which were mainly observed in centrilobular region. To confirm the usnic acid-induced liver injury, the ALT, AST, and ALP activities and TBILI concentration in serum, the most widely adopted drug-induced liver injury (DILI) biomarkers for hepatotoxicity 15 were checked to evaluate hepatotoxicity at day 3, day 6, and 24 hours after the final administration on the 8th day in 100 and 200 mg/kg groups (Figure 3). On day 3, serum ALT and ALP levels had almost no change in low- and middle-dose groups, but serum AST level was slight increased in the low-dose group (P < .05) when compared to the control group, and TBILI level was dramatically increased in rats that received low- and middle-dose usnic acid. On day 6, slow increase in serum ALT level was observed in both low- and middle-dose groups, whereas slight decrease in serum ALP in the low-dose group (P < .05) compared to the control group, and serum AST, TBILI levels had the same changes as that on day 3. On day 9, the serum ALT level had almost no change in low-dose group, but it was slightly increased in middle-dose group (P < .05), while the serum AST level was dramatically decreased in the rats of this group. The serum ALP level after multiple oral administration of usnic acid was very similar to that of control group. Serum TBILI level was dramatically increased in middle-dose group (beyond 2-fold compared to the control group). Meanwhile, there was a little decrease in serum TG level in low- and middle-dose groups on day 6, but the changes were not significant (Figure 3E). These data suggest that the liver toxicity induced by usnic acid administration is not likely attributable to cholestasis, as no elevation in ALP activity. The increase in ALT and TBILI levels with widespread hydropic degeneration of hepatocytes in middle-dose group may indicate that usnic acid may induce liver injury at a higher dose.
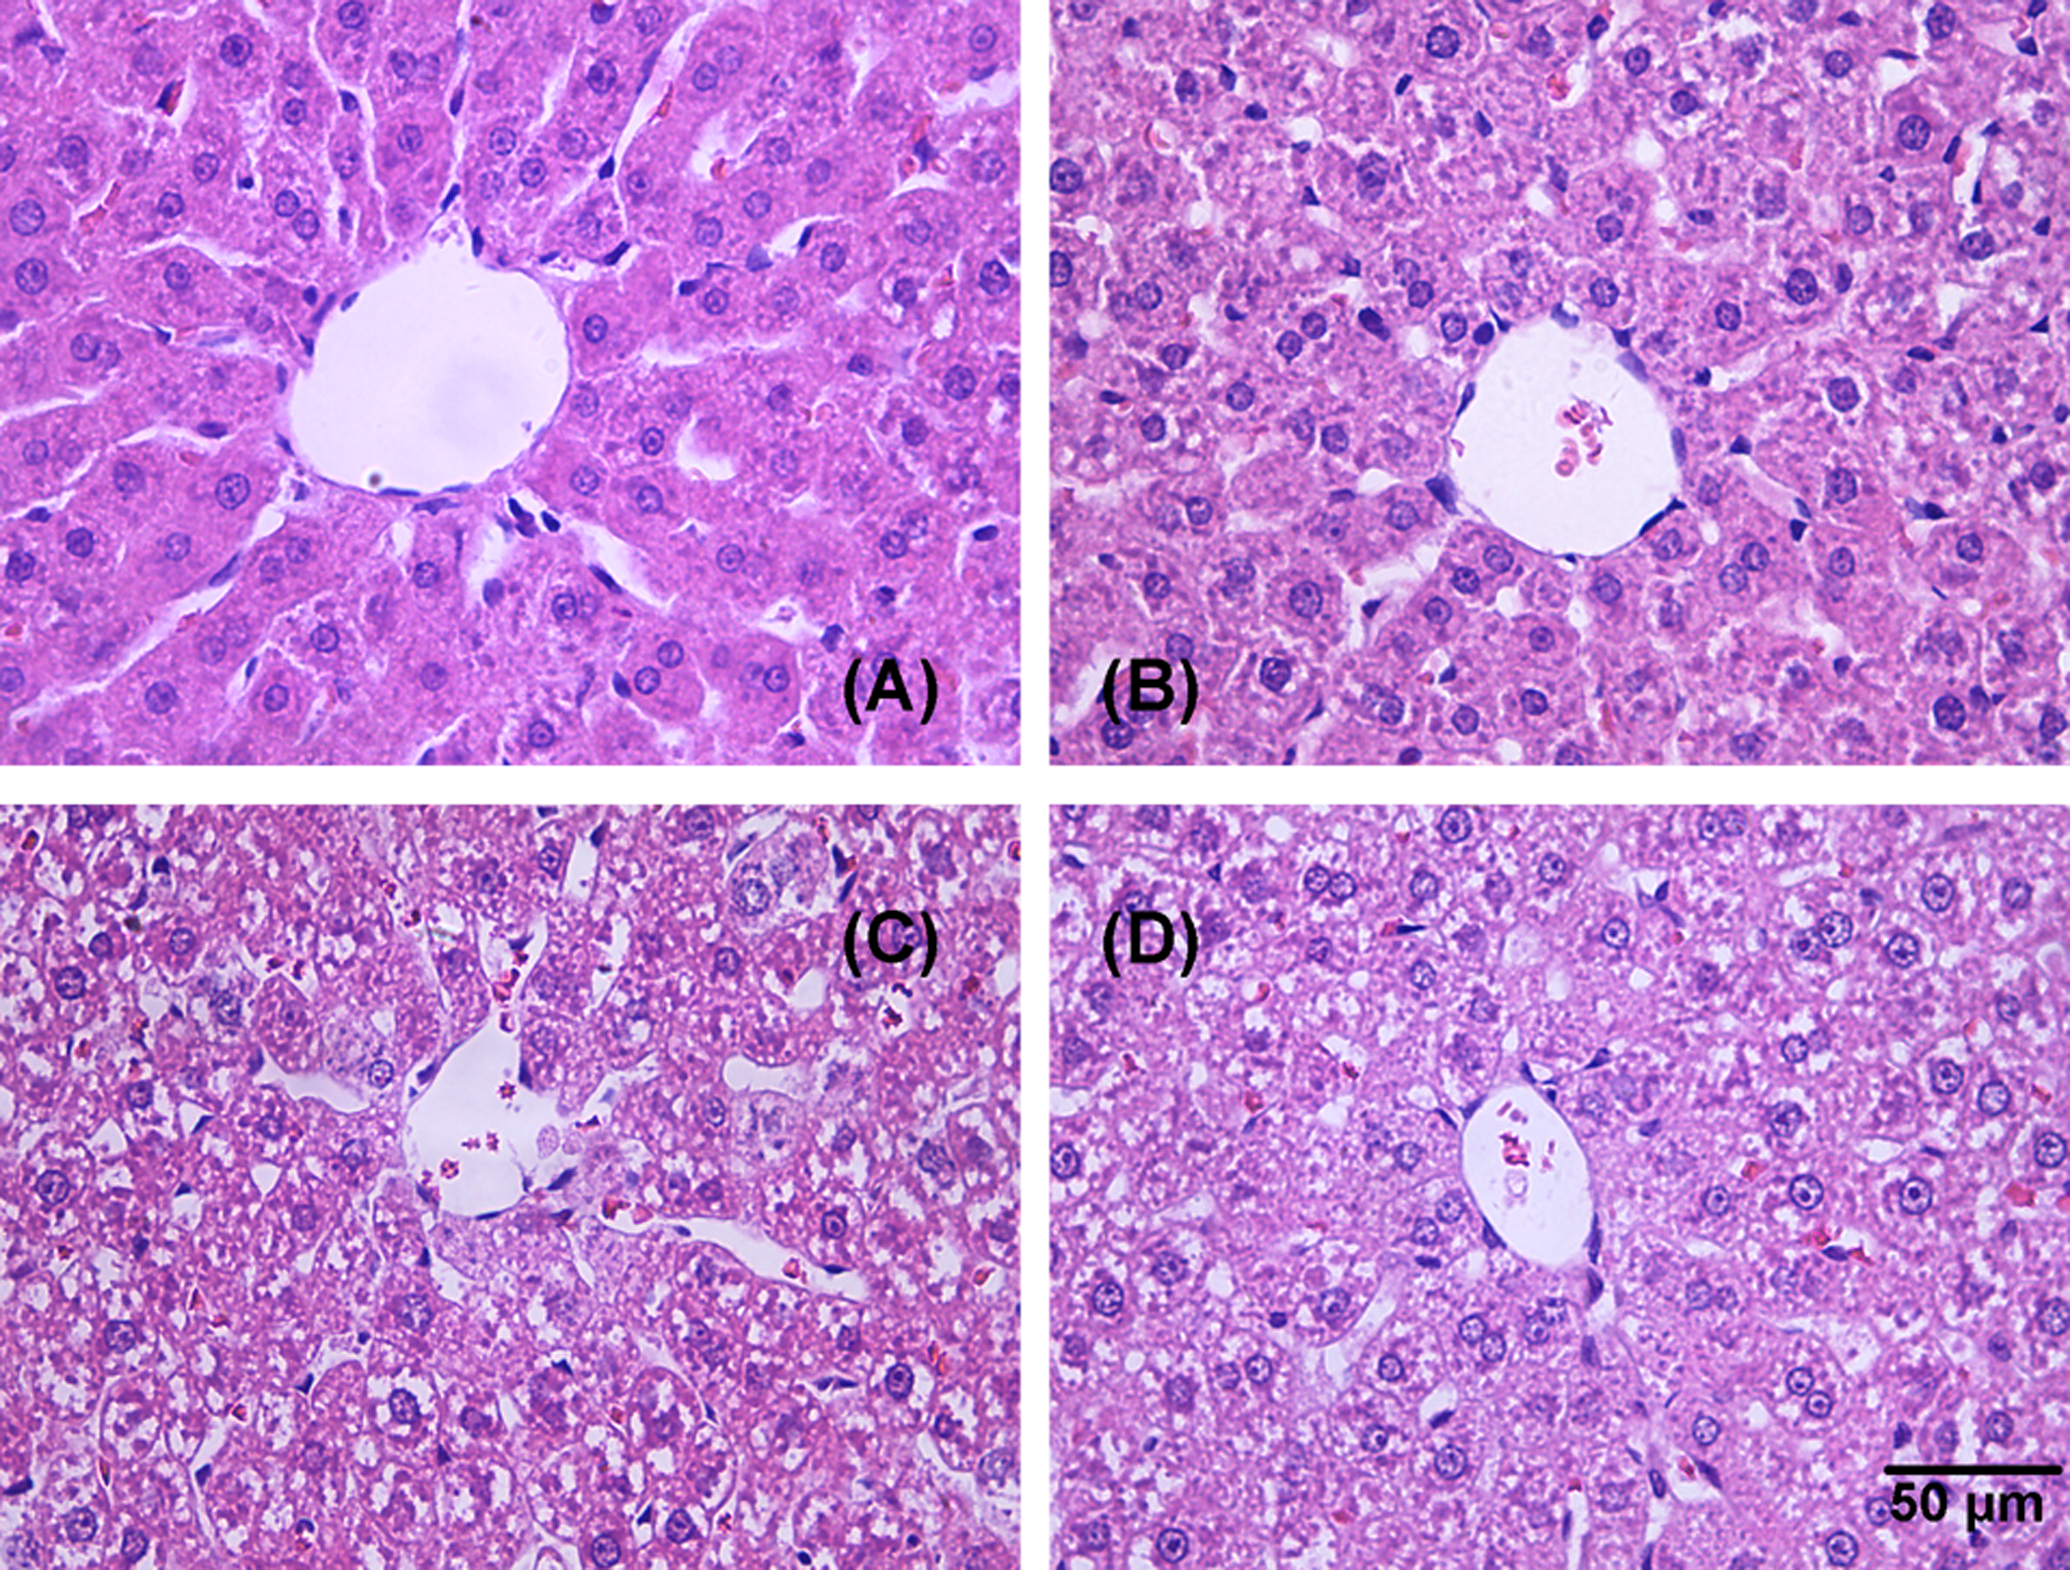
Photomicrographs of the liver tissues of rats on day 9 with hematoxylin and eosin staining: (A) control; (B) 100 mg/kg; (C) 200 mg/kg; and (D) 240 mg/kg. Control rats exhibited normal morphology. The middle- and high-dose usnic acid-treated (200 and 240 mg/kg) rats exhibited widespread hydropic degeneration of hepatocytes. Magnification, ×400. The scale bar is 50 μm.
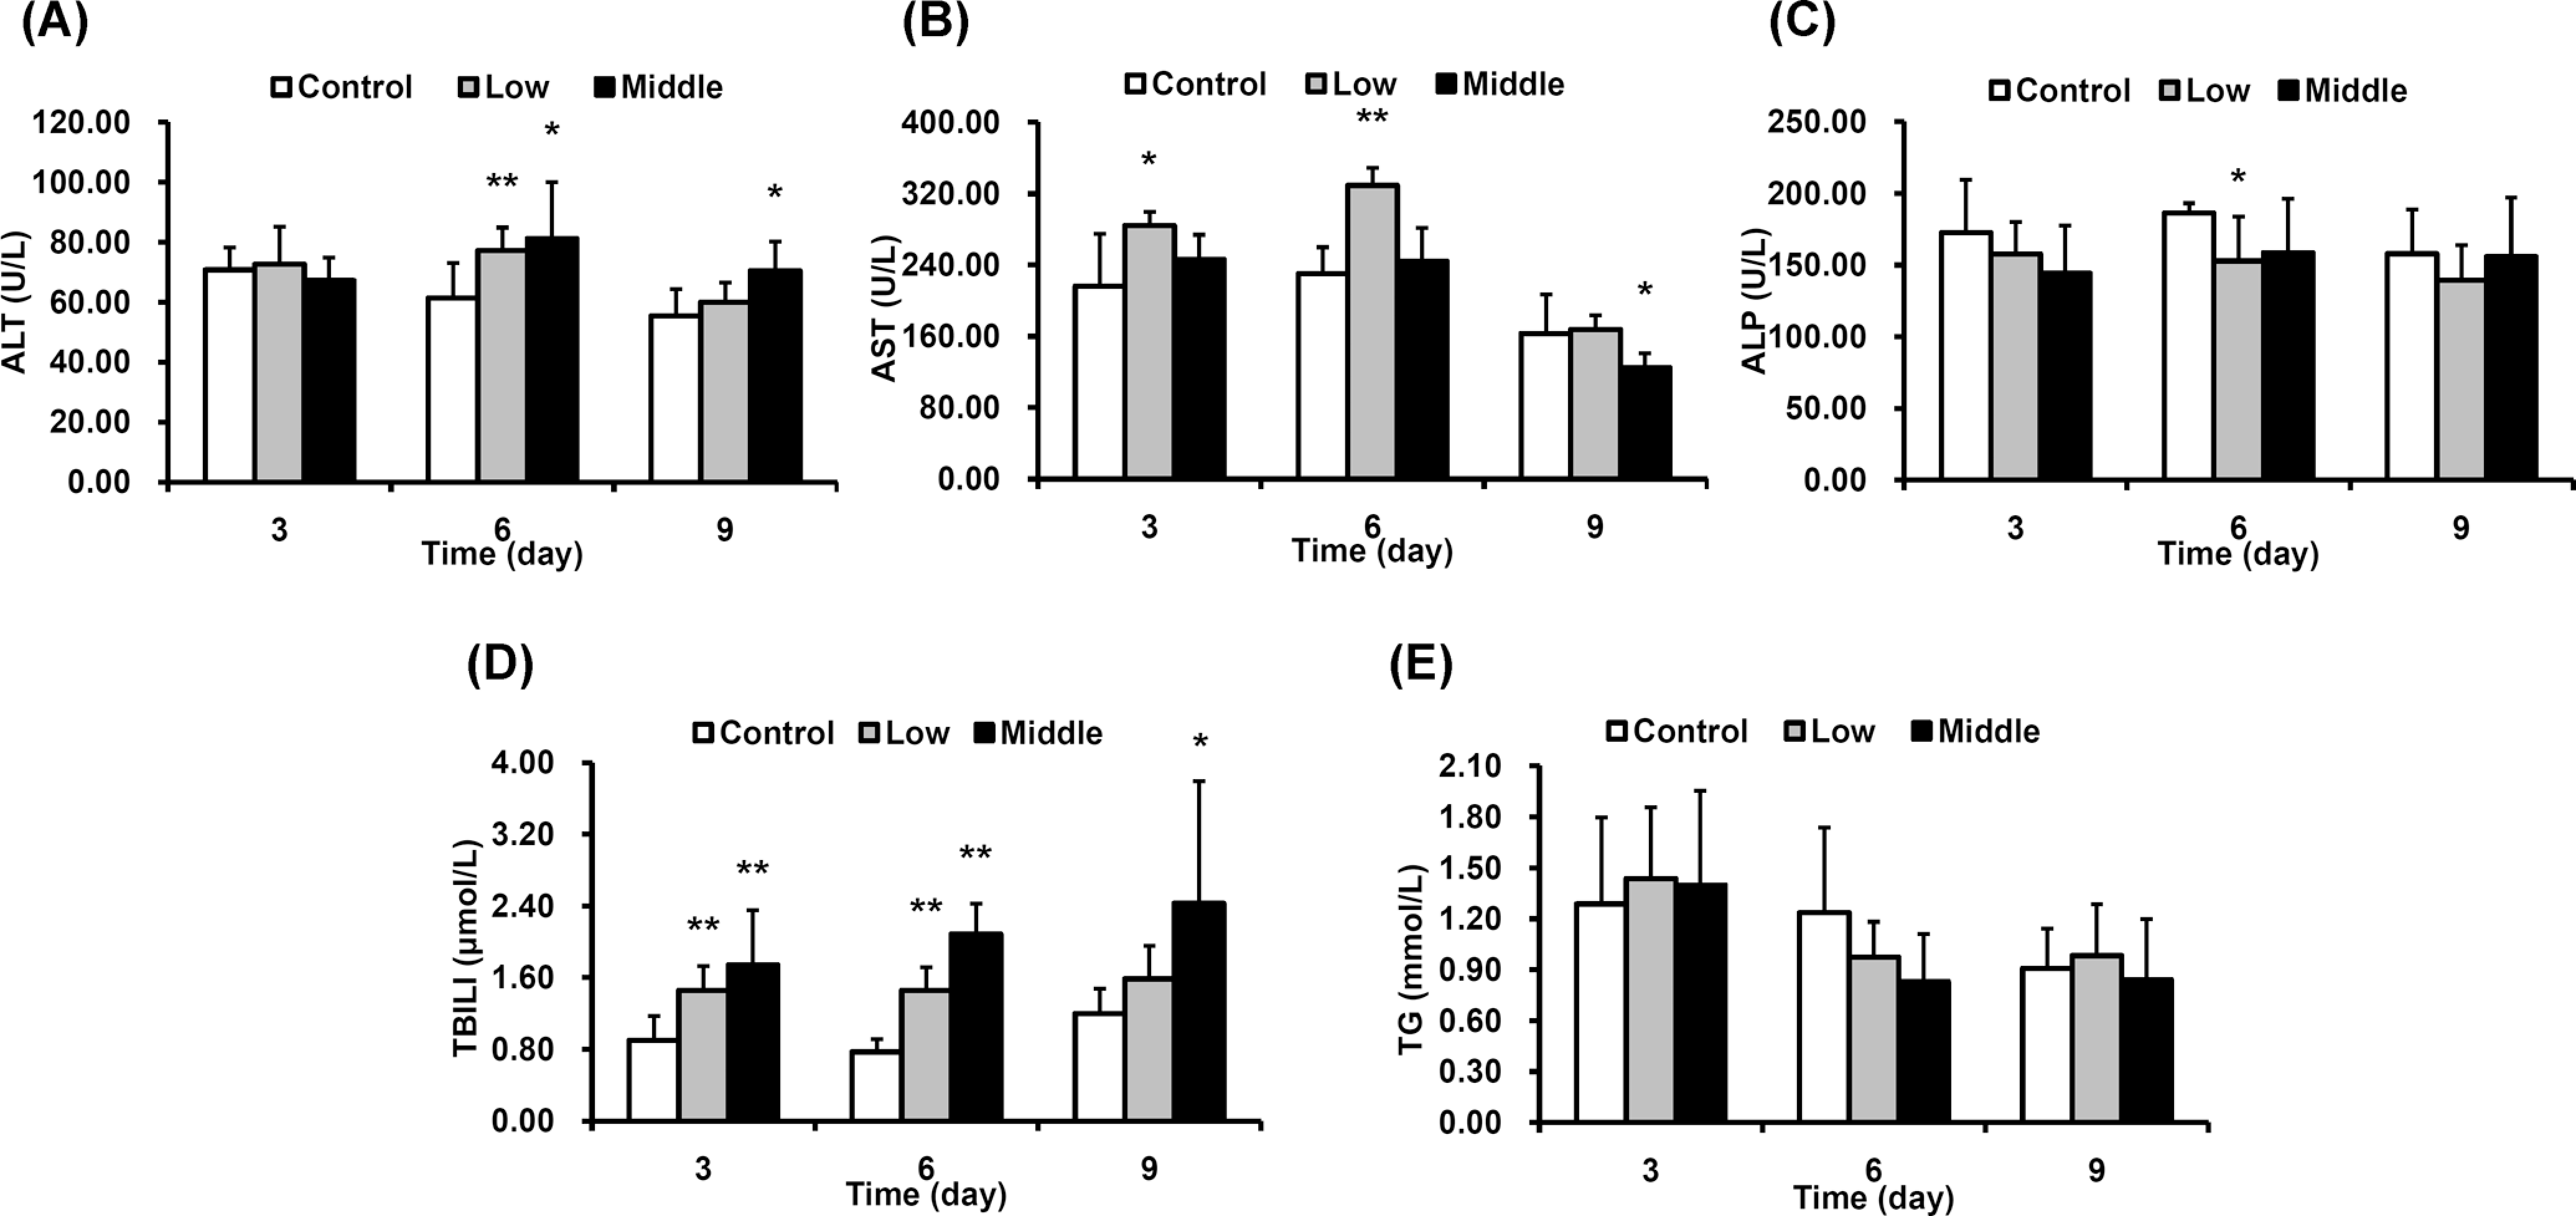
Effect of usnic acid on selected clinical chemistry parameters. A, Serum ALT level of usnic acid treatment at low or middle dose on day 3, day 6, and day 9. B, Serum AST level of usnic acid treatment at low or middle dose on day 3, day 6, and day 9. C, Serum ALP level of usnic acid treatment at low or middle dose on day 3, day 6, and day 9. D, Serum TBILI level of usnic acid treatment at low or middle dose on day 3, day 6, and day 9. E, Serum TG level of usnic acid treatment at low or middle dose on day 3, day 6, and day 9. Control, 1% CMC; low, 100 mg/kg; and middle, 200 mg/kg. Values are represented as mean ± SD; n = 7 individual rats per group. *P < .05, **P < .01 compared to vehicle control. ALT indicates alanine aminotransferase; AST, aspartate aminotransferase; ALP, alkaline phosphatase; TBILI, total bilirubin; TG, triglyceride; CMC, carboxylmethylcellulose; SD, standard deviation.
Metabonomic Profiles and PR Analysis of Plasma
A typical GC-MS TIC chromatogram of rat plasma or liver is displayed in Figure 4. A total of 30 peaks in plasma were selected as the commensal endogenous metabolites, which were used to characterize the metabolic patterns of plasma samples. A number of perturbation in endogenous metabolites were observed in the GC-MS TIC chromatograms of plasma samples collected at various time points after administration of usnic acid at dose of 100 or 200 mg/kg. The unsupervised PR method, PCA, was initially applied to analyze the plasma of experimental animals. The modeling diagnostic of PCA in this study is summarized in Table 1. The first and second components of plasma samples on day 3 explained 23.9% and 19.2% of the systematic variation, respectively. The PCA score plot is displayed in Figure 5A. The control group tended to cluster to the left part, while locations of usnic acid-treated groups generally moved right away from the controls. However, there was no clear separation between low-dose and middle-dose groups. Partial least square discriminant analysis (PLS-DA), as a supervised PR method, was therefore used for the classification of GC-MS data of plasma samples on day 3. As shown in Figure 6A, obvious classifications were detected between control group and dosed groups on day 3 and middle-dose group reached a maximum shift (Q
2
cumulated = 0.547). In PLS-DA, a rapid visualization can be achieved through the variable importance plot. The values VIP reflect the importance of terms in the model both with respect to Y, that is its correlation to all the responses, and with respect to X (the projection). Terms with large VIP, larger than 1, are the most relevant for explaining Y. According to the VIP value, hydroxyproline,
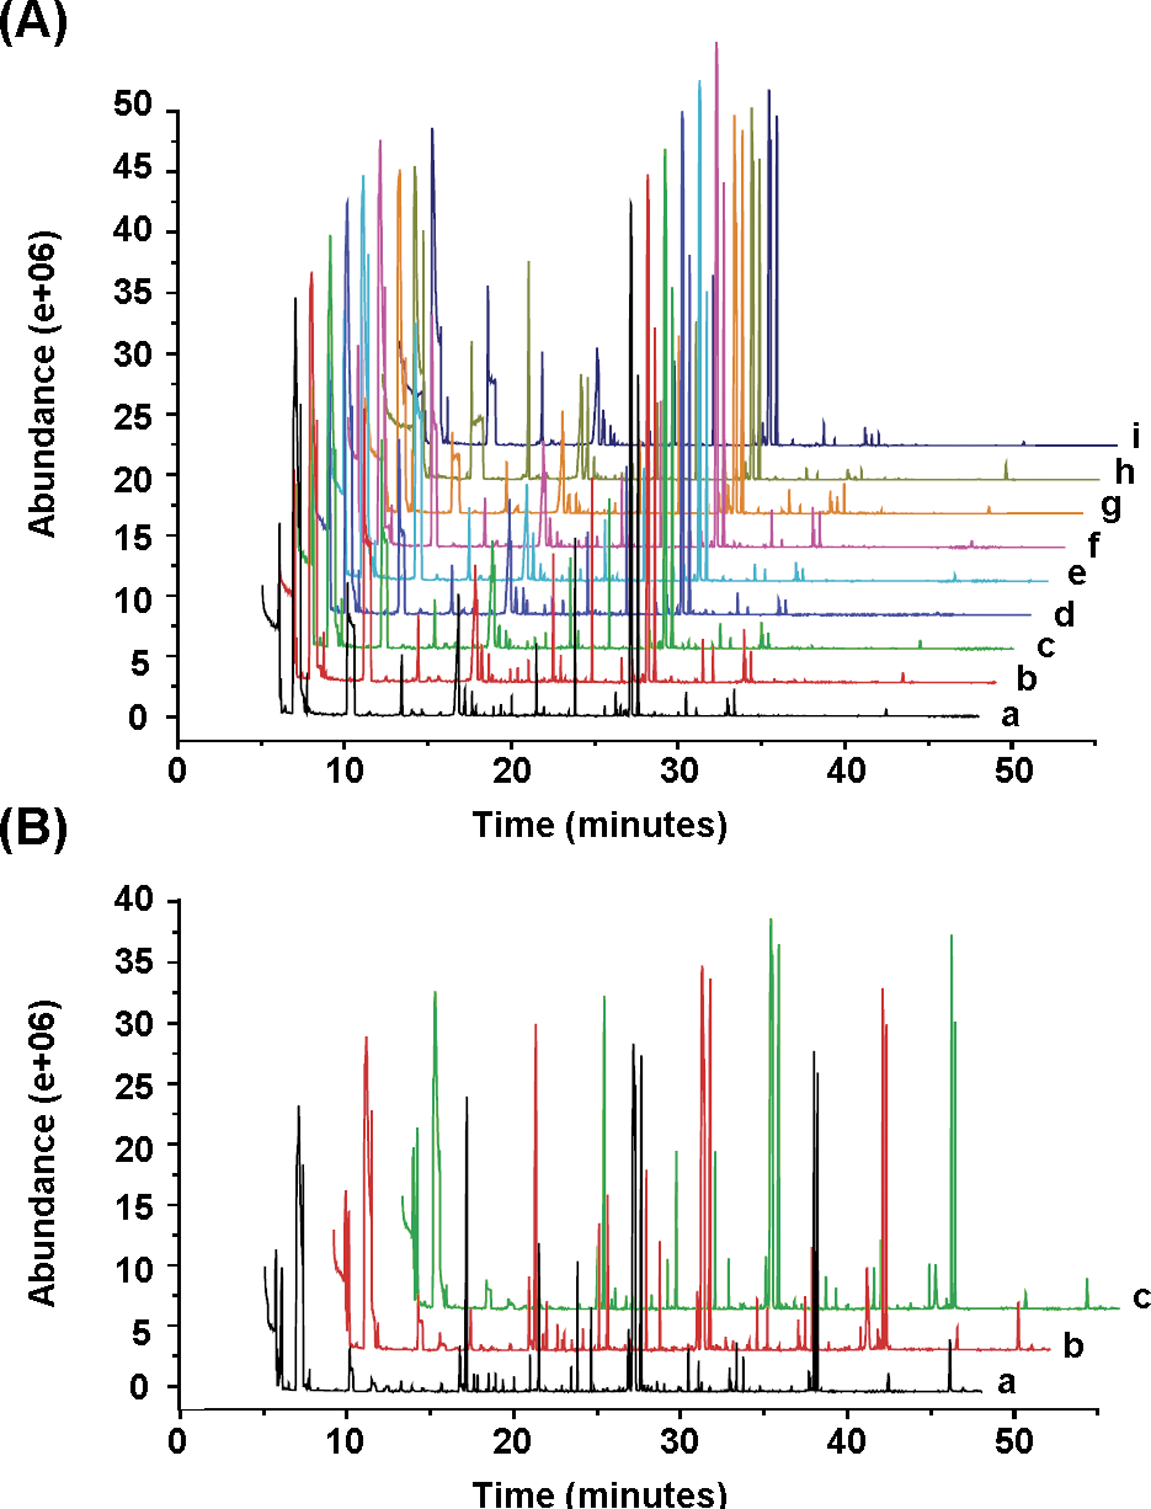
Representative GC-MS chromatograms of rat plasma (A) and liver tissue aqueous extracts (B) after multiple oral administrations of usnic acid for 8 days. (A) a, b, and c represent the GC-MS chromatograms of the plasma samples of control, low-dose, and middle-dose usnic acid treatment groups on day 3, respectively. d, e, and f represent the GC-MS chromatograms of the plasma samples of control, low-dose, and middle-dose usnic acid treatment groups on day 6, respectively. g, h, and i represent the GC-MS chromatograms of the plasma samples of control, low-dose, and middle-dose usnic acid treatment groups on day 9, respectively. (B) a, b, and c represent the GC-MS chromatograms of the liver samples of control, low-dose and middle-dose usnic acid treatment groups on day 9, respectively. GC-MS indicates gas chromatography–mass spectrometry
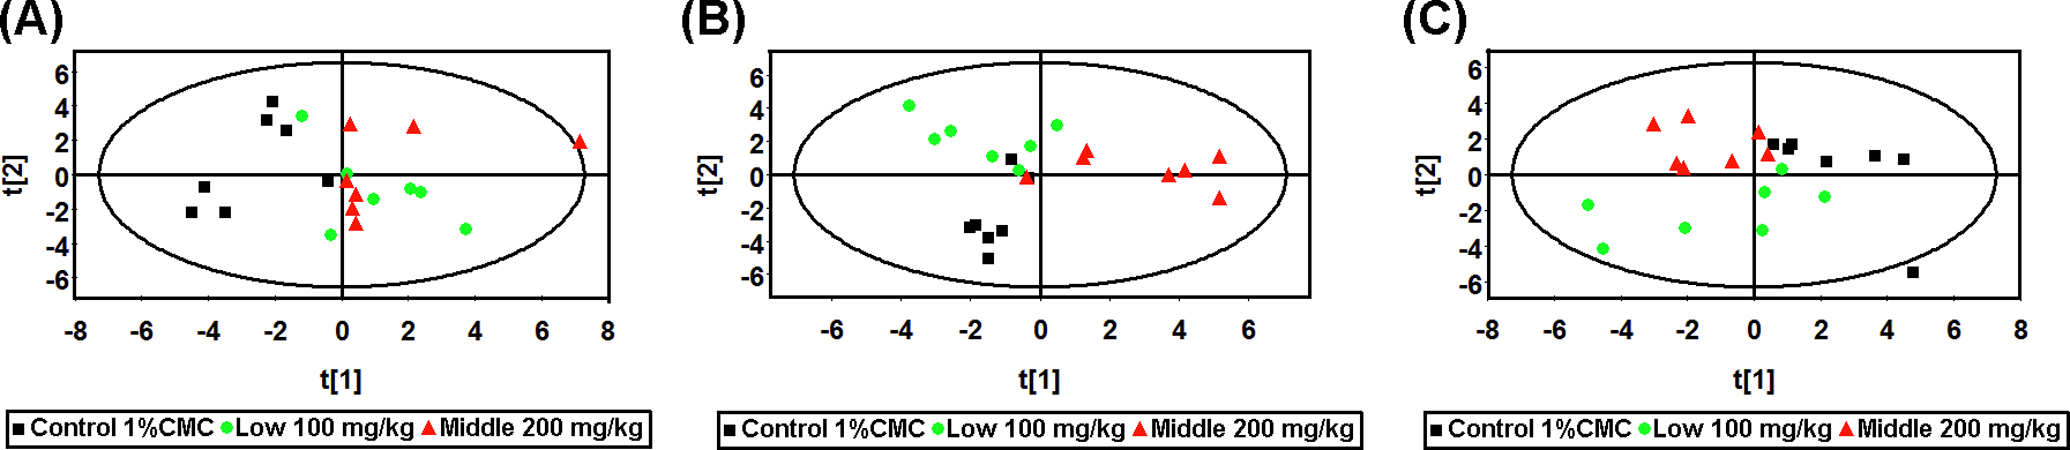
The PCA score plots derived from the GC-MS data collected after multiple oral administrations of usnic acid from plasma samples. A, The PCA score plot on day 3. B, The PCA score plot on day 6. C, The PCA score plot on day 9. Squares in black, control; circles in green, 100 mg/kg usnic acid treatment group; triangles in red, 200 mg/kg usnic acid treatment group. PCA indicates principal component analysis; GC-MS, gas chromatography–mass spectrometry.
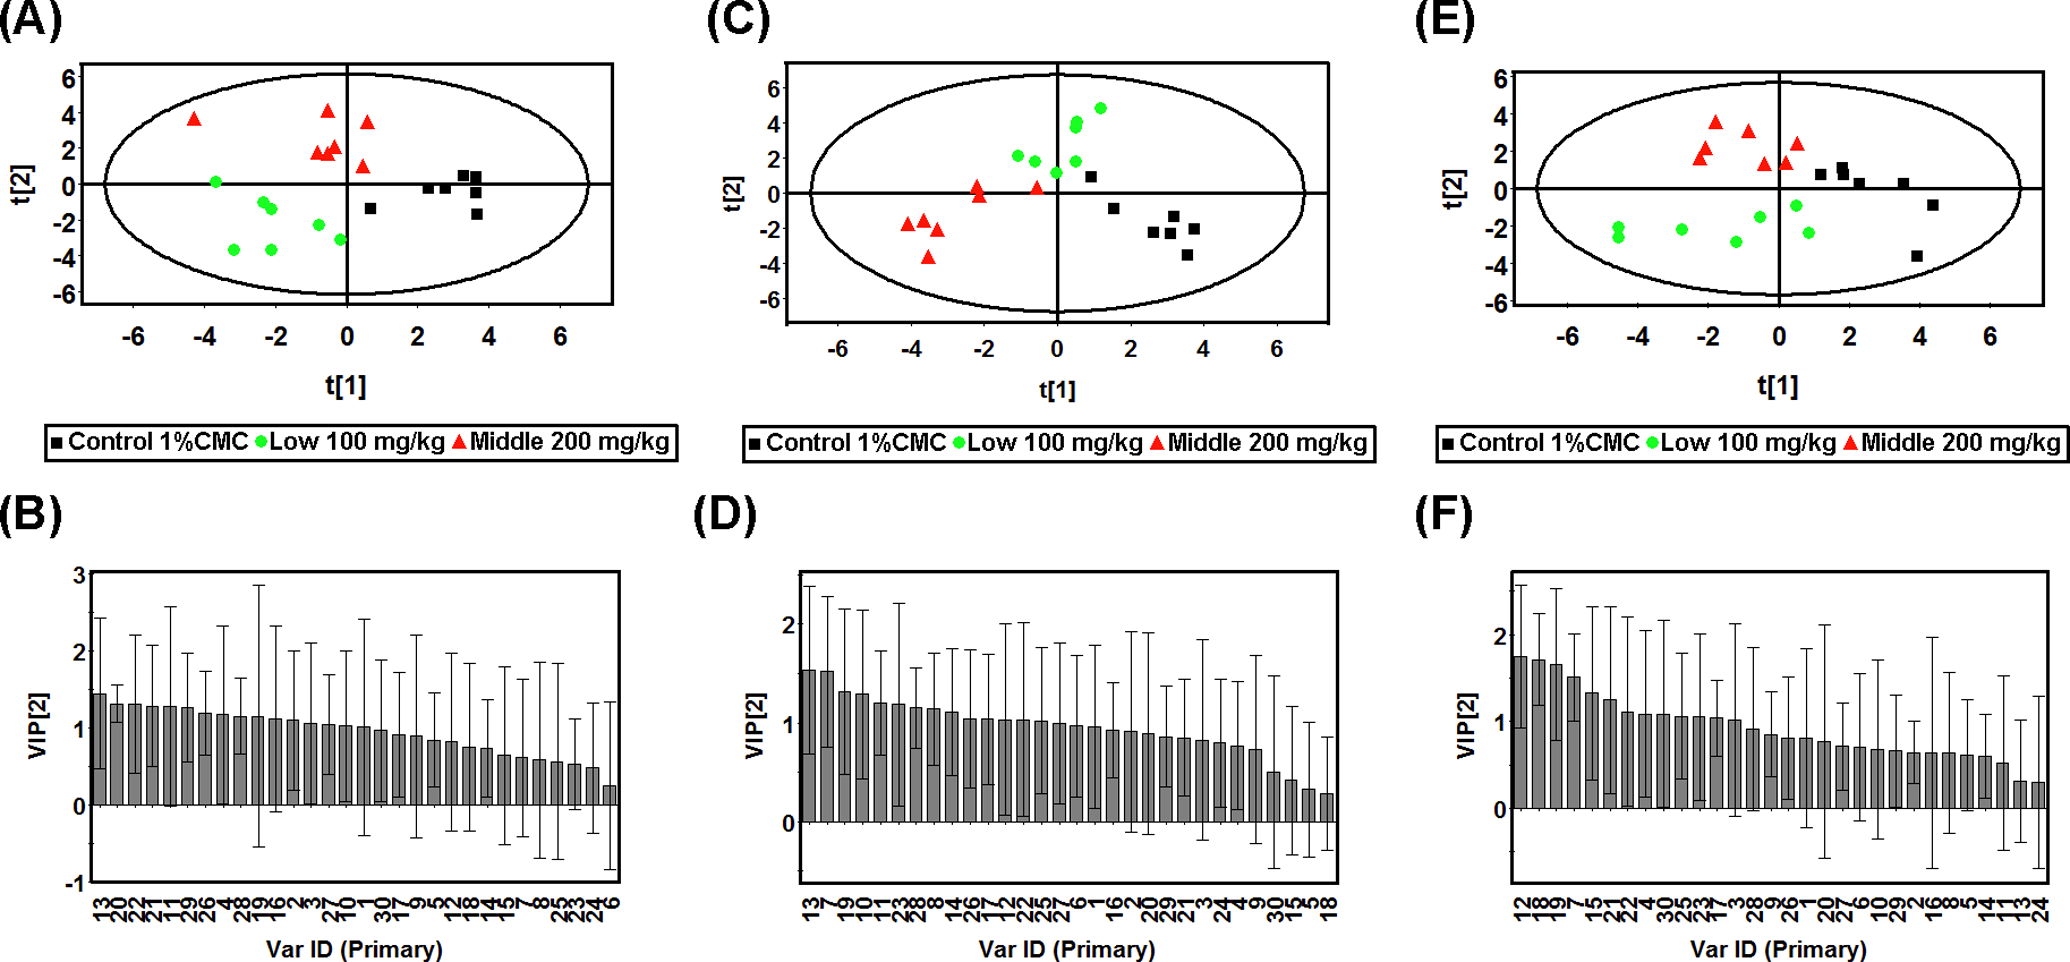
The PLS-DA score plots derived from the GC-MS data collected after multiple oral administrations of usnic acid from plasma samples on day 3 (A), day 6 (C), and day 9 (E) and the corresponding variable importance plots of first component on day 3 (B), day 6 (D), and day 9 (F). Squares in black, control; circles in green, 100 mg/kg usnic acid treatment group; triangles in red, 200 mg/kg usnic acid treatment group. The ID of variables in variable importance plots was consistent with the peak number in Table 2. 1, Lactic acid; 2, ethanedioic acid; 3,3-hydroxybutyrate; 4, urea; 5, glycerol; 6, phosphate; 7,
Modeling Diagnostic of the Metabolic Profiling Data a
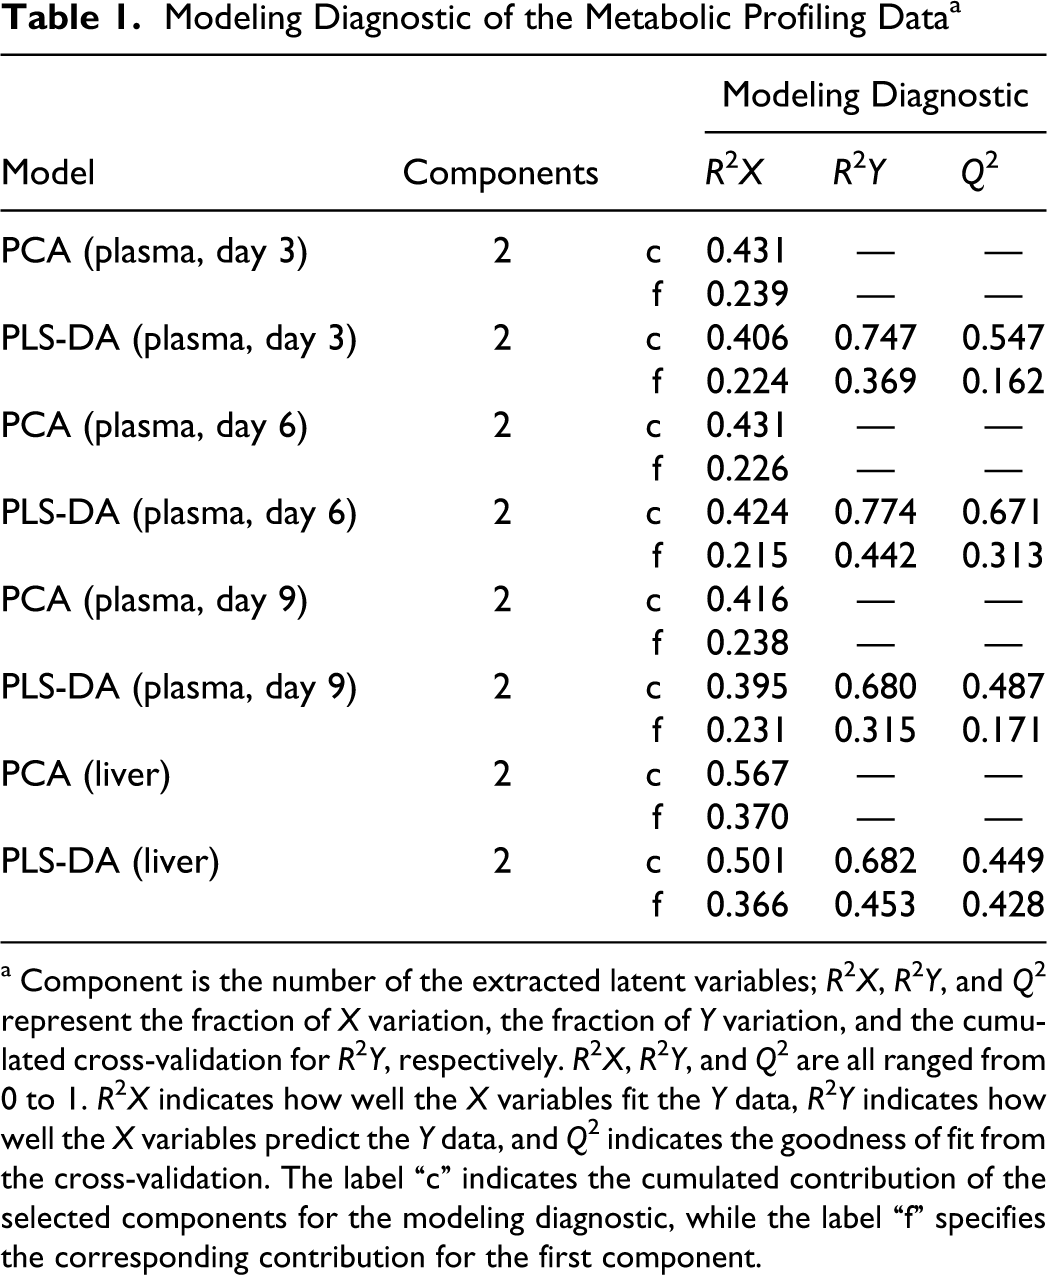
a Component is the number of the extracted latent variables; R 2 X, R 2 Y, and Q 2 represent the fraction of X variation, the fraction of Y variation, and the cumulated cross-validation for R 2 Y, respectively. R 2 X, R 2 Y, and Q 2 are all ranged from 0 to 1. R 2 X indicates how well the X variables fit the Y data, R 2 Y indicates how well the X variables predict the Y data, and Q 2 indicates the goodness of fit from the cross-validation. The label “c” indicates the cumulated contribution of the selected components for the modeling diagnostic, while the label “f” specifies the corresponding contribution for the first component.
Variations in the Endogenous Plasma Metabolite Levels in Usnic Acid Treatment Groups as Measured by GC–MS a
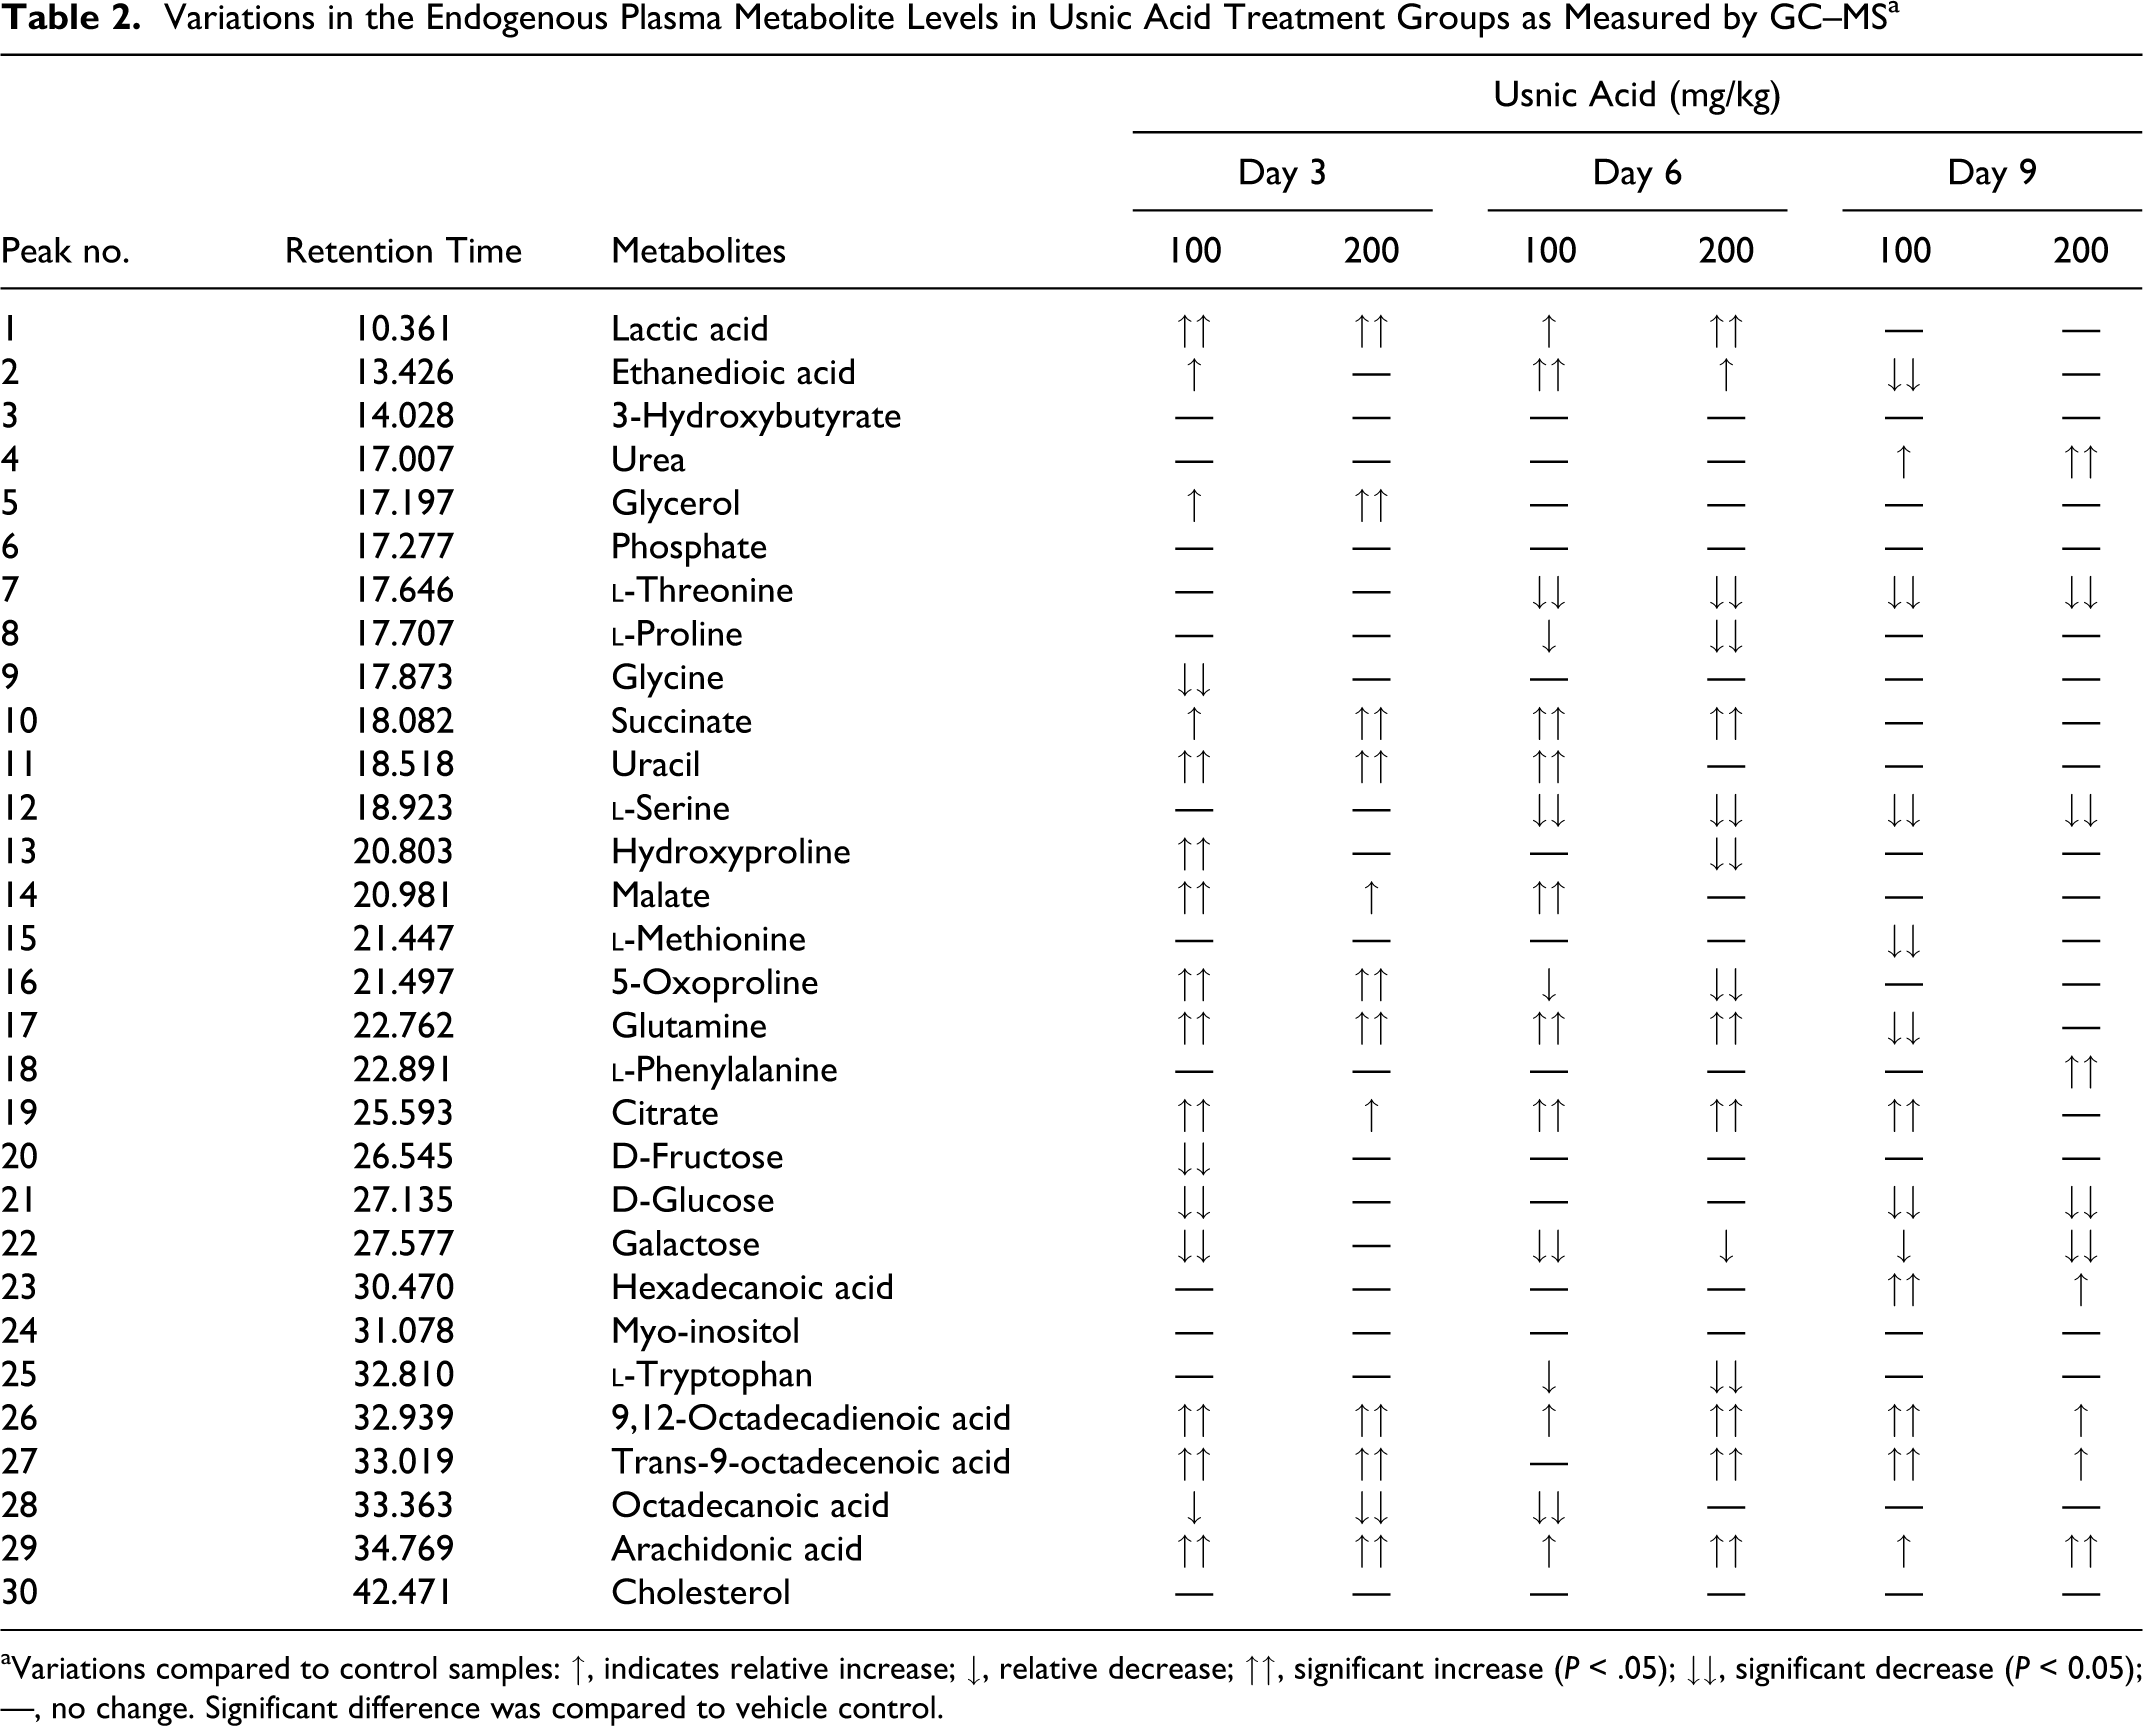
aVariations compared to control samples: ↑, indicates relative increase; ↓, relative decrease; ↑↑, significant increase (P < .05); ↓↓, significant decrease (P < 0.05); —, no change. Significant difference was compared to vehicle control.
On day 6, the first 2 components of plasma samples explained 43.1% of the systematic variation using PCA. The PCA score plot is displayed in Figure 5B. The separation between control group and 200 mg/kg-dosed group was more remarkable than 100 mg/kg-dosed group, illustrating the more severe change to animals caused by the higher dose of usnic acid. In PLS-DA plot, a clear separation for each dose point, with a maximum shift reached in 200 mg/kg group was observed between control group and dosed groups (Figure 6C; Q
2 cumulated = 0.671). According to the VIP value, 14 variables were larger than 1 in the first component of PLS-DA model on day 6. They were hydroxyproline,
On day 9, 41.6% of the variables can be explained by the 2 components using PCA in plasma samples (Table 1). The PCA score plot showed that the control group tended to cluster to the right part, while locations of usnic acid-treated groups generally moved left away from the controls (Figure 5C). Partial least squares discriminant analysis was performed to maximize the separation between the changes in control and the usnic acid-treated groups. Similar to day 3 and day 6, obvious classifications were observed between control group and dosed groups on day 9 in PLS-DA model (Figure 6E; Q
2 cumulated = 0.487). The metabolic perturbations at the end of the dosing period, according to the corresponding VIP values on first component (Figure 6F), were characterized by selecting
Metabonomic Profiles and PR Analysis of Liver Tissue
A series of changes in endogenous metabolite levels were observed in the GC-MS TIC chromatograms of liver samples collected after intragastric administration of usnic acid at doses of 100 or 200 mg/kg (Figure 4). Thirty-eight peaks in liver were selected as the commensal endogenous metabolites, which were used to characterize the metabolic patterns of liver samples. Principal component analysis is performed first for the acquired metabonomics data table. The first 2 components explained 56.7% of the systematic variation. The PCA score plot displayed that a clear separation between control and usnic acid treatment groups with a maximum shift reached in 200 mg/kg group were observed (Figure 7A). In this study, PLS-DA was also performed as the classification method for modeling the discrimination between the control group and the usnic acid treatment groups. The usnic acid-treated groups can be separated from control group clearly, while a maximum shift was reached in 200 mg/kg group, indicating that samples at a dosage of 100 mg/kg had an intermediate metabolic pattern between control and seriously disturbed group of 200 mg/kg in liver. As tabulated in Table 1, the first component of PLS-DA explains a variation (R2X) of 0.366 for the X variables, and a variation (R 2 Y) of 0.453 for the Y variable.
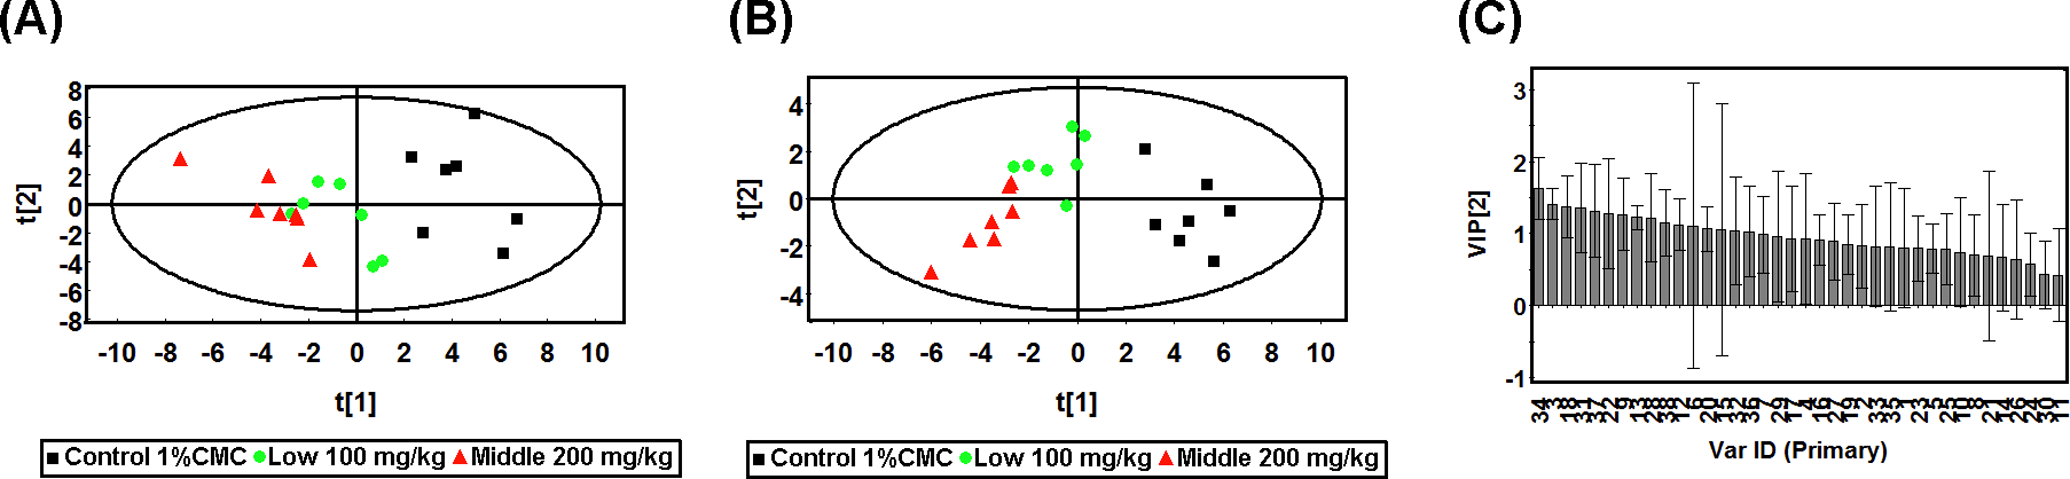
A, The PCA score plot derived from the GC-MS data collected after multiple oral administrations of usnic acid from liver samples on day 9. B, The PLS-DA score plot derived from the GC-MS data collected after multiple oral administrations of usnic acid from liver samples on day 9. C, The corresponding variable importance plot of first component on day 9 of liver samples. Squares in black, control; circles in green, 100 mg/kg usnic acid treatment group; triangles in red, 200 mg/kg usnic acid treatment group. The ID of variables in variable importance plots was consistent with the peak number in Table 3. 1, Lactic acid; 2,
The VIP was also calculated between the first component and the Y variables in liver samples in the PLS-DA model. The VIP values of 16 variables were larger than 1 in the first component of PLS-DA model and selected as the candidates of the potential biomarkers for usnic acid-induced liver injury. They were octadecanoic acid, glycine,
Significant Change of Endogenous Liver Metabolites in Usnic Acid Treatment Groups as Measured by GC-MS a
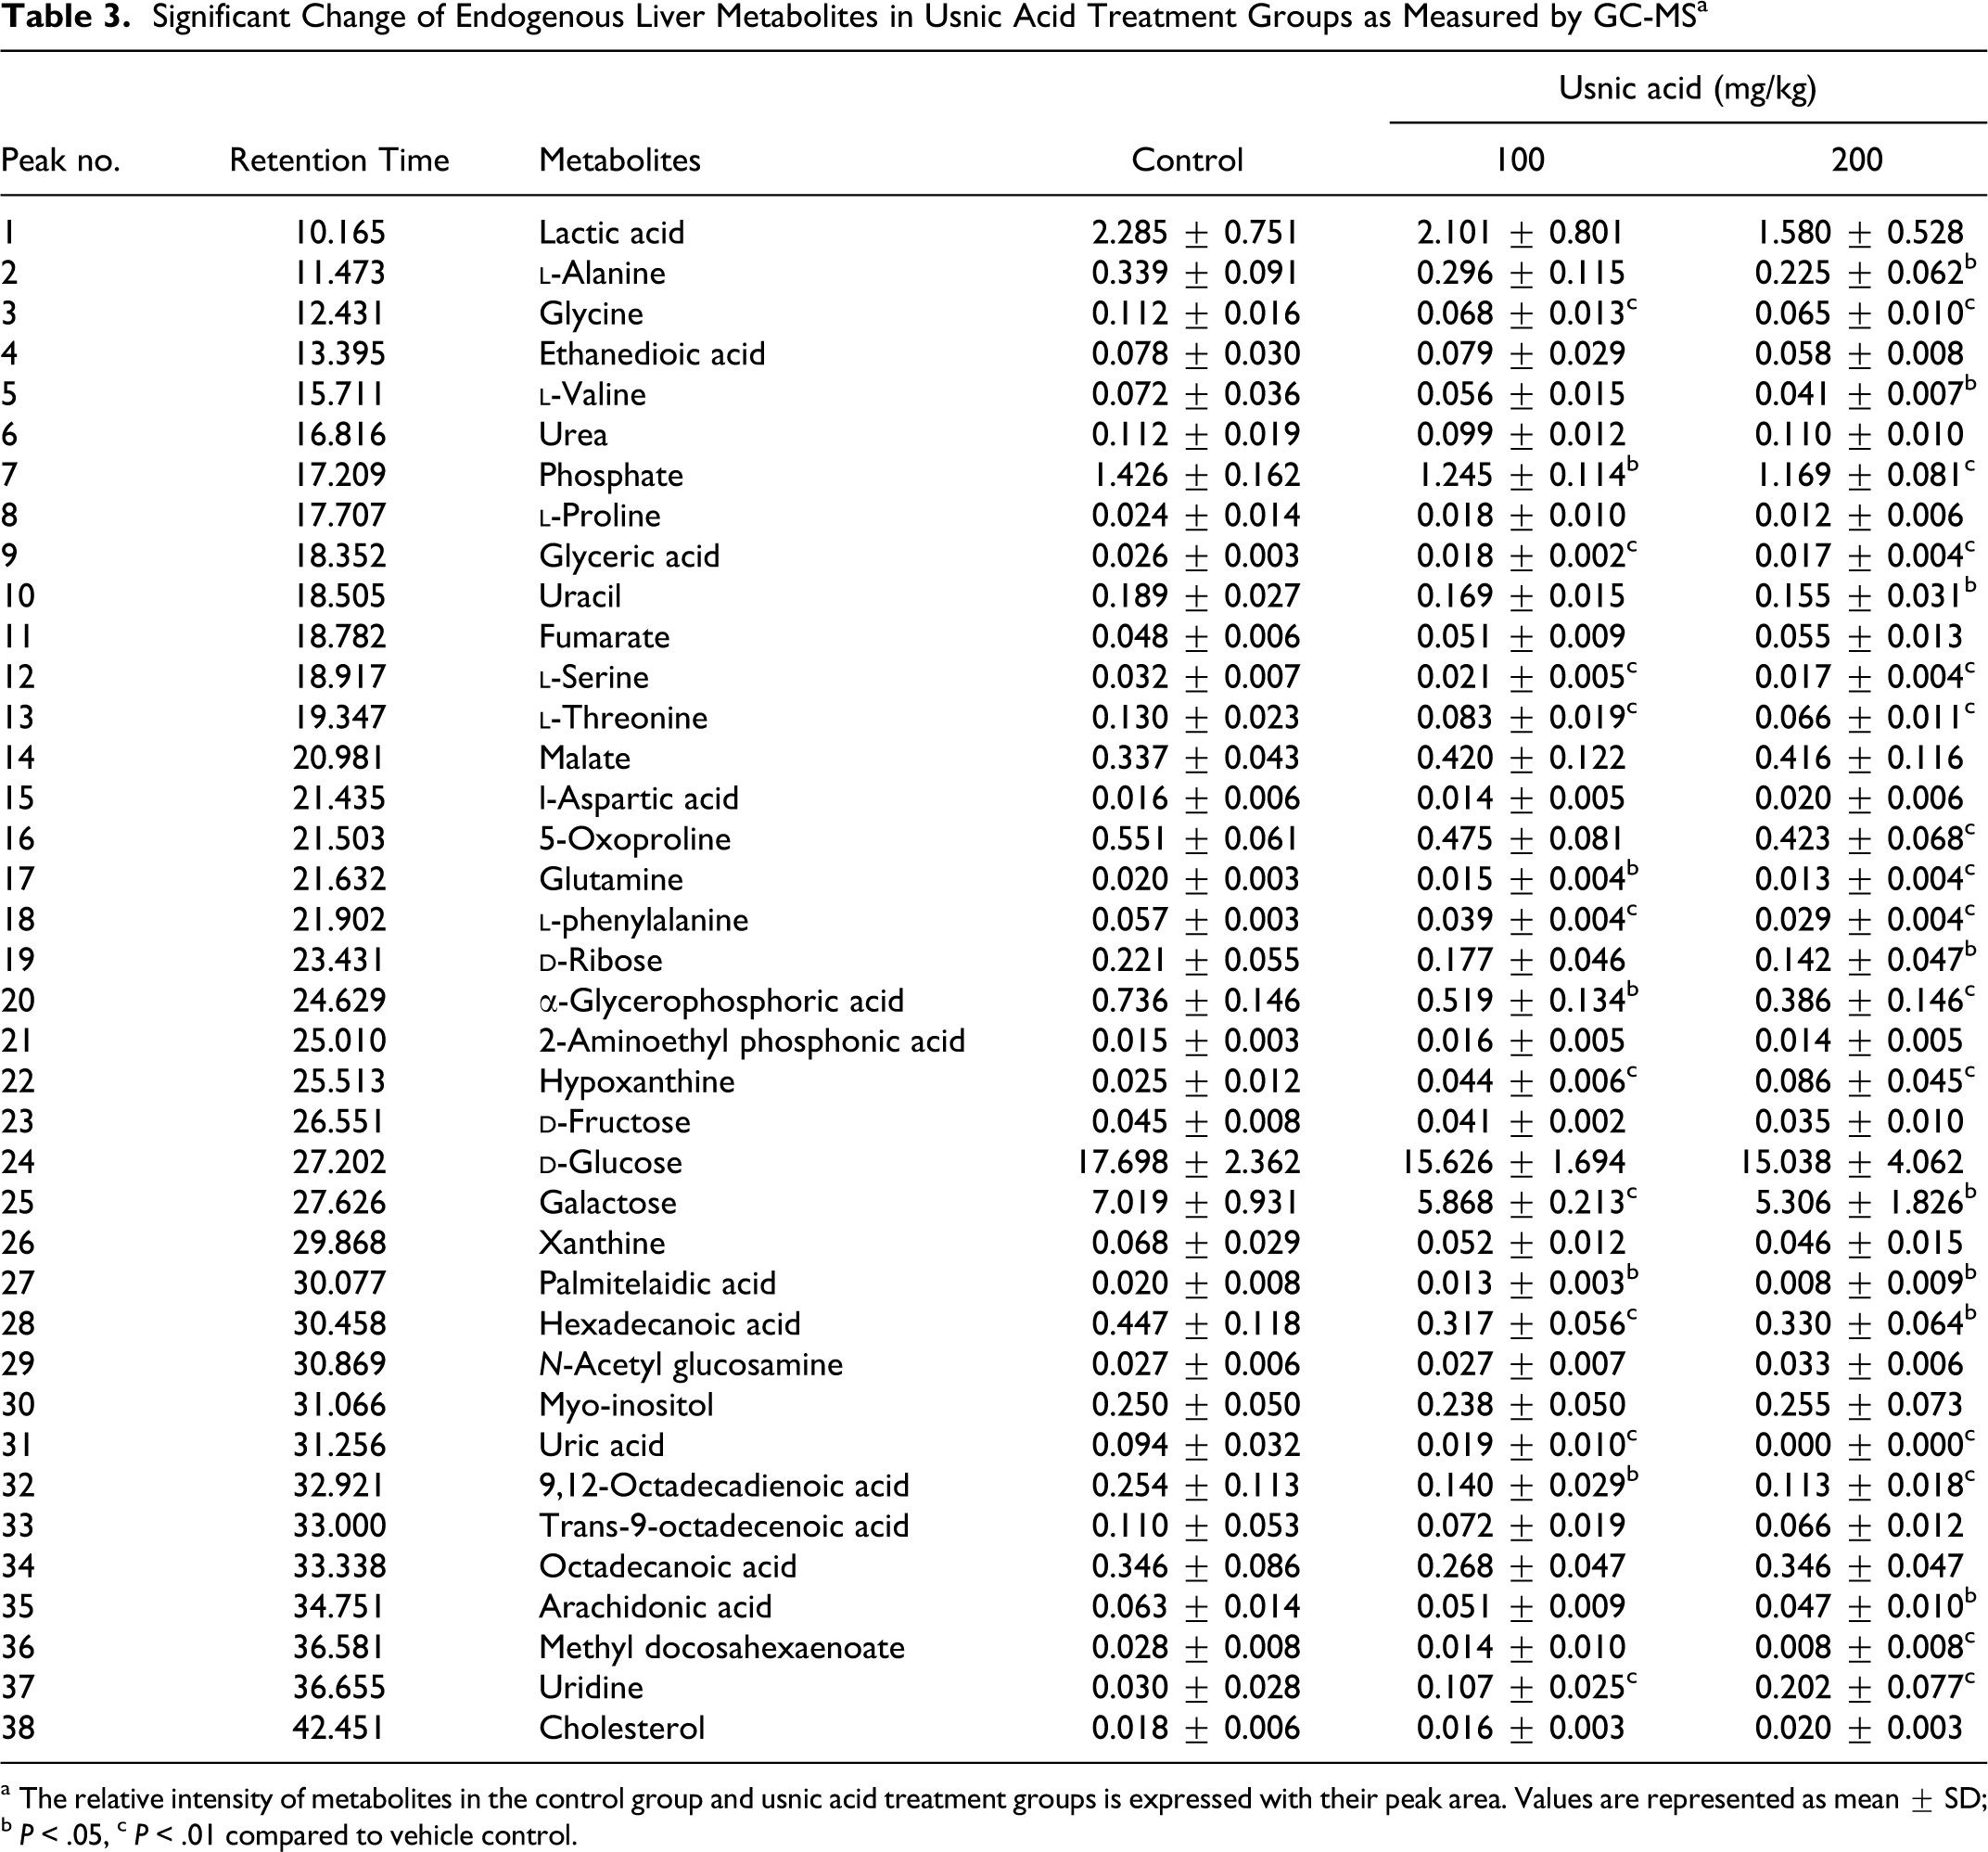
a The relative intensity of metabolites in the control group and usnic acid treatment groups is expressed with their peak area. Values are represented as mean ± SD; b P < .05, c P < .01 compared to vehicle control.
Discussion
The current study is the first report of the metabonomics analysis for the molecular mechanisms associated with usnic acid-induced liver injury in Wistar rats. Like 2,4-dinitrophenol, usnic acid is another chemical with mitochondrial uncoupling activity for weight loss and its use has been reported to be associated with hepatotoxicity.16–18 In this study, usnic acid-induced liver injury in rats was demonstrated at higher doses based on traditional toxicity evaluations, but metabolic profiling of plasma and liver samples suggested that low-dose usnic acid treatment also induced disturbances in energy metabolism, amino acid metabolism, lipid metabolism, and nucleotide metabolism as higher dose treatment, which may be attributable to usnic acid toxicological effects on the liver through oxidative stress.
Usnic acid is lipophilic in both neutral and anionic forms due to its β-triketone groups that absorb the negative charge of the anion by resonance stabilization. 19 It can pass through the inner mitochondrial membranes by passive diffusion into the matrix for lipophilicity, where it is ionized and released as a proton into the matrix. The resulting usneate anion can then diffuse back into the intermembrane space where it binds to a proton on the acidic side of the inner membrane to reform usnic acid which can then diffuse back into the matrix. The resulting proton shuttling cycle causes proton leakage that eventually can dissipate the proton gradient across the inner membrane, disrupting the tight coupling between electron transport and ATP synthesis.8,20 These effects are considered to play a major role in usnic acid-induced liver injury.
Several previous studies have demonstrated that exposure to usnic acid induced liver toxicity.6,21 In this study, traditional toxicity evaluations showed that higher dose treatment (200 mg/kg) of usnic acid elicited hepatotoxicity, as characterized by the increased liver/body weight ratio, elevated serum ALT activity and TBILI levels, and liver histopathologic alterations. However, low-dose (100 mg/kg) usnic acid treatment only increased liver/body weight ratio, elevated serum ALT activity, and TBILI levels with no obvious change in liver histopathology. Interestingly, the liver toxicity on day 9 was not severer than that on day 6 when exposure to usnic acid according to the results of clinical chemistry analysis, for TBILI levels and ALT activity were detected increased almost the same in these 2 days. These results may indicate that although usnic acid treatment induced liver injury, the liver retained sufficient functionality to maintain an adaptive response to the toxicity of usnic acid. Moreover, TBILI levels were observed surprisingly elevated on day 3 in both low- and middle-dose usnic acid-treated groups, accompanied with continued increase on day 6 and day 9. Bilirubin usually binds to a protein made in the liver and called albumin, which makes it harmlessly and carries it to the liver for detoxification and excretion. Liver failure can result in poor bilirubin processing and decrease albumin production and then increase bilirubin in blood. Widespread hydropic degeneration of hepatocytes was observed in the histopathologic examination of the middle- and high-dose (200 and 240 mg/kg) groups, indicating the hepatocytes were severe swelling which might decrease albumin production and result in increasing bilirubin in the blood at the later stage. As the previous studies showed, organic anion such as salicylic acid and fatty acid compete with bilirubin on binding to serum albumin, which results in increasing the level of bilirubin in serum.22,23 Since one of the three hydroxyl groups present in the usnic acid molecule has the strongest acidic character (pK a = 4.4) due to the inductive effect of the keto group, making usnic acid as a organic anion, 5 competitive binding of bilirubin and usnic acid to serum albumin might be the reason for the elevation of bilirubin on day 3 (Figure 3). Taken together, these data suggest that usnic acid was indeed induced liver injury in rats on higher dose based on traditional toxicity evaluations.
To explore the hepatotoxic mechanism of usnic acid, the high sensitivity of GC-MS-based metabonomics analysis technique was used to study the alterations of plasma and liver metabolite profiles in rats after exposure to usnic acid. Metabonomics analysis can inform on the state and severity of target organ dysfunction because the biochemical compositions of a biofluid will be modified if cell function varies. 24 Recent studies have shown that GC-MS-based metabonomics approach can be used as a rapid analytical tool for the study of the effects of toxic compounds and can give a insight into the mechanism of toxicity.25,26 In this investigation, according to the results of the PR analysis (PCA and PLS-DA), the differences between the metabolic phenotypes were better described. Samples of the 100 mg/kg group located between the control and the higher dosed groups. It was demonstrated that although the metabolic patterns of 100 mg/kg dosed samples have been disturbed, the patterns were still not deviated as seriously as the higher dosed (200 mg/kg) samples.
At present, it states that the dose and/or the duration of exposure of uncouplers determine the degree of change in mitochondrial activity. The low dose of usnic acid is considered to induce mitochondrial uncoupling, whereas the high dose of usnic acid inhibits mitochondria function, causes oxidative stress, and ultimately leads to cell death.6–8 The endogenous metabolite profiles of dose-dependent effects of usnic acid in rat plasma samples also suggested this activity. First, markedly decreased
In contrast, there were many metabolites changed in common in low- and middle-dose groups in the plasma samples during the treatment period. The level of lactic acid increased in plasma on day 3 and day 6 after both low- and middle-dose usnic acid treatments, together with succinate and citrate increased. Lactic acid was the product of anaerobic glycolysis, whereas succinate and citrate were the intermediates of Krebs cycle. These findings may be resulted from the inhibition of respiration and ATP synthesis by usnic acid treatment, and then inhibiting the Krebs cycle and increasing anaerobic glycolysis for the energy demand. Pervious study also consisted with these results by induction of the gene in the liver which might be due to mitochondrial uncoupling in usnic acid-treated mice as overexpression of ANT2, relating to the interruption of aerobic energy metabolism.8,28 Although the VIP value of 3-hydroxybutyrate was larger than 1 in the plasma on day 3 and day 9, there was no obvious change of 3-hydroxybutyrate in plasma during the period of multiple daily oral administrations of usnic acid for 8 days (Table 2), suggesting that the ketogenesis pathway may not activate by usnic acid treatment. Consistently, the mice exhibited higher expression levels of genes that were both involved in ketone body production and degradation after usnic acid treatment in mitochondrial genomics, indicating the balance between ketone body production and catabolism maintained stable levels in cellular.
8
Two amino acids (
In liver samples, although there was no obvious damage in low-dose usnic acid-treated group in liver histopathology, similar changes of endogenous metabolites of low- and middle-dose groups were detected in liver on day 9. In all, 22 metabolites were significantly changed in 200 mg/kg usnic acid-treated group, which was the same as in the 100 mg/kg usnic acid-treated group in comparison to the control group, although the P values of t test for some metabolites were >.05 (Table 3). Several amino acids such as
In summary, GC-MS technique coupled with PR analysis (PCA and PLS-DA) of rat plasma and liver tissue highlighted complex disturbances in the endogenous metabolites profiles after usnic acid treatment. Usnic acid exposure can lead to disturbances in energy metabolism, amino acid metabolism, lipid metabolism, and nucleotide metabolism, which may be attributable to usnic acid toxicological effects on the liver through oxidative stress. Moreover, our findings support the fact that metabonomics analysis is more sensitive than conventional toxicology analysis. According to the investigations in this work, the significant changes of 22 metabolites in liver might be adopted as the potential metabolic signals in monitoring usnic acid-induced liver injury. It could be the first trial to use the metabonomics method to reveal systematically the action mechanisms of the usnic acid-induced liver injury, which is complementary to the previous studies and provide a tool to monitor dietary and herbal supplements induced toxicity.
Footnotes
Acknowledgments
The authors thank Dr Weida Tong and Dr Qiang Shi (National Center for Toxicological Research, US Food and Drug Administration) for their helpful discussion.
The author(s) declared no potential conflicts of interest with respect to the research, authorship, and/or publication of this article.
The author(s) disclosed receipt of the following financial support for the research, authorship, and/or publication of this article: financially supported by the National S&T Major Project (No. 2009ZX09502-024), the Zhejiang Provincial Natural Science Foundation of China (No. R2080693 & 2008C23065), and Research Fund for the Doctoral Program of Higher Education of China (No. 20090101110126).