
Abstract
Pyropolyporus fomentarius, a fungus of the polyporaceae family, has been used in the treatment of various diseases, such as gastroenteric disorder, hepatocirrhosis, oral ulcer, inflammation, and several cancers. This study was conducted to investigate the compositions and cell growth inhibition effects of P. fomentarius chloroform (CHCl3) fraction and to clarify the possible mechanisms. Gas chromatography–mass spectrometry analysis was performed to investigate the composition of the P. fomentarius CHCl3 fraction. Cell viability was measured using 3-(4,5-dimethylthiazol-2-yl)-2,5-diphenyltetrazolium bromide assay. Cell membrane damage was evaluated with a scanning electron microscope and flow cytometry following propidium iodide and bis-(1,3-dibarbituric acid)-trimethine oxanol staining. Apoptosis was analyzed using annexin V-PE/7-amino-actinomycin D (7-AAD) staining. Generation of intracellular calcium ion (Ca2+), reactive oxygen species (ROS), and changes of mitochondrial membrane potential (Δψ m) were detected by flow cytometry using fluo 3-acetoxymethyl ester, 2′,7′-dichlorofluorescin-diacetate, and rhodamine 123. Our obtained data indicate that P. fomentarius CHCl3 fraction could inhibit proliferation of K562 cells depending on both the dosage and the incubation time, cause cell membrane damage, influence intracellular [Ca2+]i variation, promote the yield of ROS, decrease the level of Δψ m, and initiate the apoptotic response in K562 cells.
Introduction
Pyropolyporus fomentarius (L. ex Fr.) Teng, also called Fomes. fomentarius, is a fungus of the Polyporaceae family, belonging to the genus of Fomes. This herb has a long history of medicinal use. For instance, it was applied as hemostatic dressings and bandages during the 18th and 19th centuries. 1 The same polypore together with the birch polypore (Piptoporus betulinus), which has had a variety of medicinal and other uses, was found with the body of the famous 5300-year old “Ice Man” in a glacier of Italian Alps in 1991. 2,3 In Japan, it is also used to make a popular drink, which is believed to be a tonic and to have preventive effects against wide-ranging diseases. 4 As a traditional Chinese medicine, this mushroom has been applied in the treatments of various diseases, such as gastroenteric disorder, hepatocirrhosis, oral ulcer, inflammation, and several cancers. 5
The traditional use of the polypore has been demonstrated by modern pharmacological studies. Chen et al.’s 5 investigation illustrated that the ethanol extract of P. fomentarius had a direct antiproliferative effect on human gastric cancer cell lines SGC-7901 and MKN-45. Recently, a study described moderate cytotoxic effect of sterols isolated from ethanol extract of P. fomentarius. 6 Besides, Lu et al. 7 reported that chloroform (CHCl3) extract of P. fomentarius strongly inhibited the proliferation of Hela cells. Our previous screening studies indicated that the CHCl3 fraction, from the ethanol extract of the P. fomentarius, caused more significant cell damages in K562 cells than either the petroleum ether or n-butyl alcohol fractions did (data unpublished).
However, to the best of our knowledge, little research on anticancer mechanisms of the P. fomentarius CHCl3 extract has been performed before. Therefore, this study was conducted to investigate the cell growth inhibition effects of the P. fomentarius CHCl3 fraction and its underlying mechanisms.
Materials and methods
Plant materials
The sporophores of P. fomentarius was collected from Pinghe-liang, south of QinLing Mountains, Shaanxi province, China (latitude, 33°27′ N; longitude, 108°30′ E; altitude, 2305 m). It was identified by Prof. Yaping Xiao in the Ministry of Education, Key Laboratory for Medicinal Plant Resource and Natural Pharmaceutical Chemistry, Shaanxi Normal University, Xi’an, Shaanxi, People’s Republic of China.
Preparation of the CHCl3 extract
Crushed plant material was soaked in 95% ethanol (EtOH, w/v) at 45°C and extracted three times (each for 30 min) using ultrasonic-assisted extraction. After filtration through filter paper, the filtrate was vacuum concentrated and freeze-dried. The ethanol extract was then homogenized in water, followed by extraction with petroleum ether, CHCl3 and n-butyl alcohol, successively. Under reduced pressure, the various polarity fractions were obtained by evaporation. Then, the CHCl3 fraction was dissolved in 95% EtOH to get a stock solution of 20 mg ml−1 and was passed through 0.22 µm filter before use. Note that in this work, the CHCl3 fraction from P. fomentarius was called PFCF for short.
Component analysis by GC/MS
To investigate the composition of the PFCF, gas chromatography–mass spectrometry (GC-MS) analysis was performed with a 7890A GC/5975C MS system (Agilent Technologies, Santa Clara, California, USA) and fitted with a fused silica capillary column (HP-5MS, 30 m × 25 mm internal diameter, 0.25 μm film thickness; Agilent J&W Scientific, Folsom, California, USA). One microliter of the sample was analyzed with a split ratio of 10:1 (v/v). The programs of temperature rise were followed by initial temperature of 50°C for 2 min, raised at 10°C min−1 to 200°C, maintained for 2 min, and then raised to 250°C at 5°C min−1, maintained for 6 min, and then it was raised to 280°C at 10°C min−1 and maintained isothermally for 5 min. The injector temperature was set at 280°C, and the interface temperature was at 150°C. The MS source helium was used as the carrier gas at a flow rate of 1 ml min−1. The ionization source temperature was 250°C. MS was determined by full-scan method with range from 50 to 600 (m/z). Metabolites were identified by comparison with the National Institute of Standards and Technology (NIST) Mass Spectral Search Program 2008 database (version 2.0, FairCom Co., Columbia, Missouri, USA).
Cell culture
K562 cells (human chronic myelogenous leukemia cell line) were obtained from the Chinese Academy of Medical Sciences (Beijing, China). Cells were grown in Roswell Park Memorial Institute (RPMI) 1640 medium, supplemented with 10% fetal bovine serum and 1% penicillin, streptomycin,
Isolation of PBMC
Peripheral blood mononuclear cells (PBMC) cells were isolated with the lymphocyte separation kit (Applygen Technologies Inc., Beijing, China) from healthy donors in the hospital of Shaanxi Normal University, China. The whole procedures were performed according to the instructions provided by the manufacturer. The viability of the obtained PBMC cells was evaluated using trypan blue exclusion test and in experiment the viability was above 95%.
Assessment of cell viability after PFCF treatment
To detect the effect of PFCF on K562 cell proliferation, at a cell density of 1 × 10⁵, cells were incubated in 96-well plates. Different concentrations of PFCF (0, 10, 20, 30, 40, 50, 60, 70, and 80 μg ml−1) were added into the cells and then incubated for 24, 48, and 72 h. Cell viability of each group was determined by using 3-(4,5-dimethylthiazol-2-yl)-2,5-diphenyltetrazolium bromide (Sigma-Aldrich, St Louis, Missouri, USA) assay. 8 The absorbance values at 570 nm were recorded using a microplate reader (Bio-Tek ELX800, Winooski, Vermont, USA). Cell viability of PFCF-treated group was then acquired by comparing with the control group. The group containing 95% EtOH was used to indicate the effects of EtOH on cells.
In this experiment, PBMC cells were used as normal cells to evaluate the cytotoxicity of PFCF. K562 cells and PBMC cells suspension (100 μl) were seeded at a density of 1 × 10⁵ cells ml−1 in 96-well culture plates, respectively, and incubated with PFCF at different doses (0, 20, 40, 60, and 80 μg ml−1) for 24 h. Two types of cells were then harvested and stained with trypan blue (0.4%). Using a hemocytometer, the stained and unstained cells were counted. Cell viability was determined according to the following equation: cell viability = number of unstained cells/number of cells in the control group × 100%. Each experiment was repeated for at least three times.
Membrane integrity testing
Cell membrane integrity can be monitored using propidium iodide (PI) staining. PI, a nucleic acid binding dye, cannot penetrate the membrane of viable cells but can enter cells through a damaged cell membrane. Therefore, when cell membrane integrity is poor, the fluorescence of PI will increase significantly.
Cells (1 × 10⁵ cells ml−1) were incubated with the indicated concentrations of PFCF for 6 h, collected by centrifugation, washed two times with phosphate-buffered saline (PBS), then stained with 5 μg ml−1 PI (Sigma-Aldrich, St Louis, Missouri, USA) for 5 min in the dark and analyzed by flow cytometry (Guava easyCyte 8HT; Millipore Corp., Bedford, Massachusetts, USA). Using Flow Cytometry Analysis (FCS) Express V3, histograms were analyzed.
The measurement of cell membrane potential
Bis-(1,3-dibarbituric acid)-trimethine oxanol (DiBAC4(3)) is used as a dye for monitoring changes in the plasma membrane potential. 9 The depolarized membrane potential could increase the distribution of DiBAC4(3) in the cytosol and then the intracellular fluorescence intensity will rise subsequently. In contrast, the hyperpolarized membrane potential will decrease the intracellular fluorescence intensity.
After treated by PFCF at various concentrations for 4 h, K562 cells were harvested by centrifugation, washed with PBS, stained with 5 μmol l−1 DiBAC4(3) (D8189; Sigma-Aldrich, St Louis, Missouri, USA) at room temperature and then detected by flow cytometry. Histograms were analyzed with FCS Express V3.
SEM observation
After 24 h, following 40 μg ml−1 PFCF treatment, cells of each group were fixed by 2.5% glutaraldehyde, washed with PBS, dehydrated by graded alcohol, displaced, dried at the critical point, evaporated with gold, and then observed under a SEM (S-3400 N, Hitachi, Tokyo, Japan).
Annexin V-PE/7-AAD staining experiment
Annexin V-PE/7-amino-actinomycin D (7-AAD) double staining was used to detect the rate of apoptosis. During the early stage in apoptosis, annexinV-PE detects the translocation of phosphatidylinositol in the outer cell membrane, while in the late-staged apoptotic and dead cells, 7-AAD can enter the cell.
Apoptotic cells were measured using Guava Nexin Reagent (4700–1140, Millipore, Billerica, Massachusetts, USA). The assay was performed according to the instructions provided by the manufacturer. Briefly, K562 cells (1 × 10⁵ cells ml−1) were treated with 40 µg ml−1 of PFCF for 24 h at 37°C. Cells were collected by centrifugation, resuspended with 100 µl binding buffer, and then stained with 100 µl of Guava Nexin Reagent for 20 min at room temperature in the dark. Finally, samples were detected by flow cytometry, and the apoptotic indexes were analyzed using FCS Express V3.
Measurement of [Ca2+]i
Flu 3-acetoxymethyl ester (Fluo 3-AM; F312; Dojindo Laboratories, Kumamoto, Japan) was used to detect the intracellular calcium (Ca2+) ion concentration. Fluo 3-AM has long been used as the nonfluorescent acetoxymethyl ester, which is cleaved and turns to Fluo-3 in cells. Fluo-3, a Ca2+ indicator, can bind to Ca2+ ions and present strong fluorescence.
After treated with PFCF for 4 h and 8 h, both the control and treated cells were collected by centrifugation, resuspended with PBS, loaded with 2 μmol l−1 Fluo 3-AM for 30 min at 37°C, washed with PBS, and then immediately analyzed by flow cytometry.
Detection of intracellular ROS generation
We use the sensitive fluorescent probe 2′,7′-dichlorofluorescein-diacetate (DCFH-DA; Invitrogen, Carlsbad, California, USA) to detect the changes of intracellular ROS. DCFH-DA could easily pass through cell membrane, hydrolyzed by intracellular esterases, and then turn to non-fluorescent DCFH. Since DCFH can be subsequently oxidized and form highly fluorescent oxidized DCFH (DCF) in the presence of reactive oxygen species (ROS), the generation of intracellular ROS will be proportional to the fluorescence intensity.
After incubated with PFCF at various concentrations (0, 20, 60 µg ml−1) for 4 h, cells (1 × 10⁵ cells ml−1) were harvested, stained with 10 μM DCFH-DA, and incubated at 37°C for 30 min in the dark. After washed with PBS, samples were immediately analyzed by flow cytometry. Excitation wavelength was 488 nm and emission wavelength was 530 nm. Histograms were analyzed using FCS Express V3.
Examination of the Δψ m
We use the fluorescent probe rhodamine 123 (Rh123, Sigma) to detect the changes of mitochondrial membrane potential (Δψ m). Rh123 selectively enters mitochondria normally and can be retained in them. 10 Once Δψ m is decreased, the amount of Rh123 will subsequently decline.
Incubated with PFCF at various concentrations (0, 20, and 60 µg ml−1) for 12 h, cells (1 × 10⁵ cells ml−1) were collected and then stained for 20 min with 2 µg ml−1 Rh123. After washed with PBS, cells were immediately analyzed by flow cytometry. Excitation wavelength was 488 nm and emission wavelength was 530 nm. Histograms were analyzed using FCS Express V3.
Statistical analysis
Data are expressed as mean ± standard deviation of at least three independent experiments. Statistical analysis was performed by one-way analysis of variance. Statistical significance was established at a value of p < 0.05.
Results
Chemical compounds in PFCF
Upon GC-MS analysis, chemical composition of the main constituents from PFCF was identified in Table 1. The main constituents were considered “identified,” when their mass spectral fit values were at the default value of 90% or above. A total of 13 constituents were identified in the extract and the chemical structures of the identified compounds are shown in Figure 1. For the first time, our study reports the chemical compositions of the CHCl3 extract of P. fomentarius fruit body.

The structures of 13 identified compounds in CHCl3 fraction. CHCl3: chloroform.
Identification of PFCE metabolites using GC-MS analysis.

PFCE: chloroform fraction from P. fomentarius; GC-MS: gas chromatography–mass spectrometry.
Effect of PFCF on cell viability
K562 cells at a density of 1 × 10⁵ cells ml−1 were treated with PFCF with specific doses for 24, 48, and 72 h. As shown in Figure 2(a), PFCF inhibited K562 cell proliferation in a dose- and time-dependent manner. Compared with the control, the extract (10 μg ml−1) showed no cell damage (p > 0.05), while there were significant cell damages when PFCF doses were 20 μg ml−1 or above, and the prolonged incubation enhanced the viability loss. Of note, EtOH didn’t show obvious effect on cancer cells proliferation under the maximum dose range.

Cytotoxicity effect of CHCl3 fraction on K562 cells and PBMC. (a) K562 cells were treated with 0, 10, 20, 30, 40, 50, 60, 70, and 80 μg ml−1 of PFCF for 24, 48, and 72 h; (b) PBMC and K562 cells were incubated at the same experimental conditions for 24 h. Solvent ethanol effect was also suggested. Each value is expressed as a mean ± SD of three independent experiments. *p < 0.05 and **p < 0.01 versus the control. CHCl3: chloroform; PBMC: peripheral blood mononuclear cell.
Compared with K562 cells, PBMC cells showed no significant cell death in the experimental groups except the 80 μg ml−1 group (Figure 2(b)).
Plasma membrane damage measurement
Firstly, combined with flow cytometry, PI staining was used to evaluate cell membrane integrity after treated by PFCF. Images in Figure 3 show that when PFCF concentrations are 20 and 60 μg ml−1, the percentage of cells with higher PI fluorescence obviously increases to 86.13% and 85.4% at 6 h, while in the control group, such data is 5.4%.

Effects of CHCl3 fraction on the cell membrane integrity of K562 cells at 6 h after treatment. (a) cells were treated with CHCl3 fraction (a) control; (b) 20 μg ml−1; (c) 60 μg ml−1, the percentage of fluorescent cells in each group was shown. (b) The results represent the mean ± SD of three independent experiments. **p < 0.01: statistically significant difference with control. CHCl3: chloroform; PBMC: peripheral blood mononuclear cell.
Secondly, we measured the membrane potential of K562 cells after PFCF treatment. As shown in Figure 4, compared with the control, cells in the treated groups showed greatly dose-dependent cell membrane damage (p < 0.01). The percentage of cells with DiBAC4(3) fluorescence were 2.57%, 42.9%, and 79.04% when PFCF concentrations were 0, 20, and 60 μg ml−1, respectively. The result indicated a depolarization in the membrane potential after treated with PFCF.
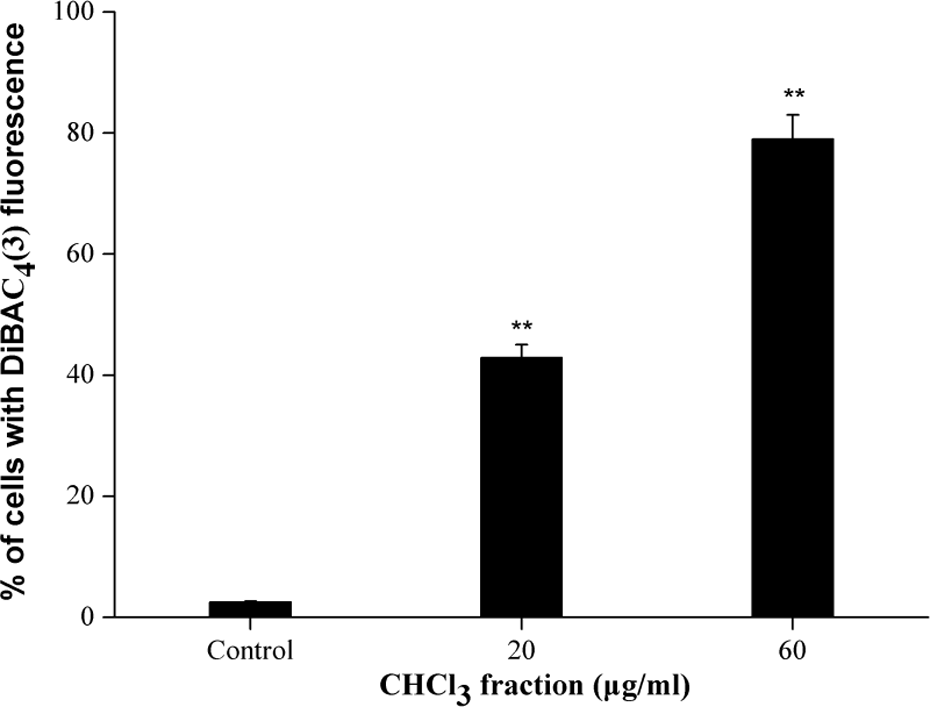
Membrane potential changes in K562 cells. Cells were treated with CHCl3 fraction at 0, 20, and 60 μg ml−1 for 4 h, labeled with DiBAC and the fluorescence intensity in individual cells was detected by flow cytometry. Data are mean ± SD of three independent experiments. **p < 0.01: statistically significant difference with control. CHCl3: chloroform; DiBAC: bis-(1,3-dibarbituric acid)-trimethine oxanol.
Finally, membrane damage effect was morphologically observed under SEM (Figure 5). In the control group, cells appeared round in shape with abundant microvilli, while cells treated with 40 μg ml−1 PFCF showed a significant decrease in the number of microvilli and shrunk obviously with relatively smooth surfaces. Moreover, some small convex structures were observed in PFCF group.
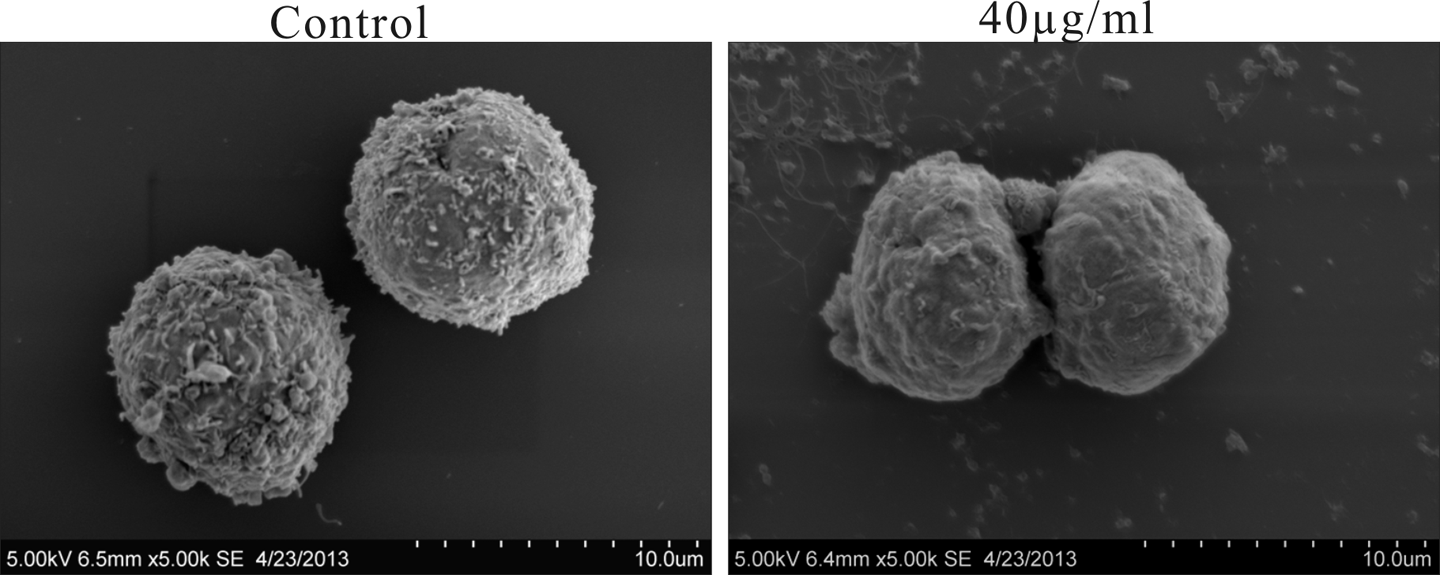
SEM images of K562 cells at 24 h with 0 and 40 μg ml−1 CHCl3 fraction treatments. Magnification of the images was ×5000. Scale bars: 10 mm. SEM: scanning electron microscopy; CHCl3: chloroform.
Apoptosis assessment
Using annexin V-PE/7-AAD double staining, we analyzed the exposure of phosphatidylserine as a marker of apoptosis. In Figure 6, after 24 h treatment, the viable cells were 96.4% in the control group; the cell population in the early stage of apoptosis (lower right) was 1.4%; the cell population in the late stage of apoptosis (upper right) was 1.9%. However, compared with the control, in the treated group the percentages of cells with annexin V-positive staining increased gradually (p < 0.01) from 3.3% to 36.8%, suggesting that PFCF could induce apoptosis in K562 cells.

Dot plots of annexin V and 7-AAD uptake after different treatments in K562 cells. (a) Cells were analyzed at 24 h post-treatment by flow cytometry (a′) control and (b′) 40 μg ml−1 CHCl3 fraction. (b) The ratio of annexin V-positive and -negative cells are represented as means ± SD of three independent experiments. 7-AAD: 7-amino-actinomycin D; CHCl3: chloroform.
Changes in intracellular [Ca2+]i
As shown in Figure 7, at 4 or 8 h after treatment, cells exposed to 20 μg ml−1 PFCF did not show obvious changes in [Ca2+]i. However, cells after treatment with 60 μg ml−1 PFCF showed increased [Ca2+]i concentration compared with the control (p < 0.01).

Time course of changes in [Ca2+]i after CHCl3 fraction treatment. Cells were treated with CHCl3 fraction (a) 4 h, (a′) control; (b′) 20 μg ml−1; (c′) 60 μg ml−1 and (b) 8 h, (a′) control; (b′) 20 μg ml−1; (c′) 60 μg ml−1, both the control and treated cells were loaded with Fluo 3-AM and analyzed by flow cytometry, and percentage of fluorescent cells in each group was shown. (c) Data are mean ± SD of three independent experiments. **p < 0.01: statistically significant difference with control at each time point. [Ca2+]i: calcium ion concentration; CHCl3: chloroform; Fluo 3-AM: fluo 3-acetoxymethyl ester.
Detection of intracellular ROS generation and Δψ m loss
Intracellular ROS was analyzed using the flow cytometer with DCFH-DA staining. Figure 8 shows that compared with the control, more obvious spectral shift of DCF fluorescence curve form left to the right in a dose-dependent manner after PFCF treatment, demonstrating that PFCF could markedly increase the level of intracellular ROS.
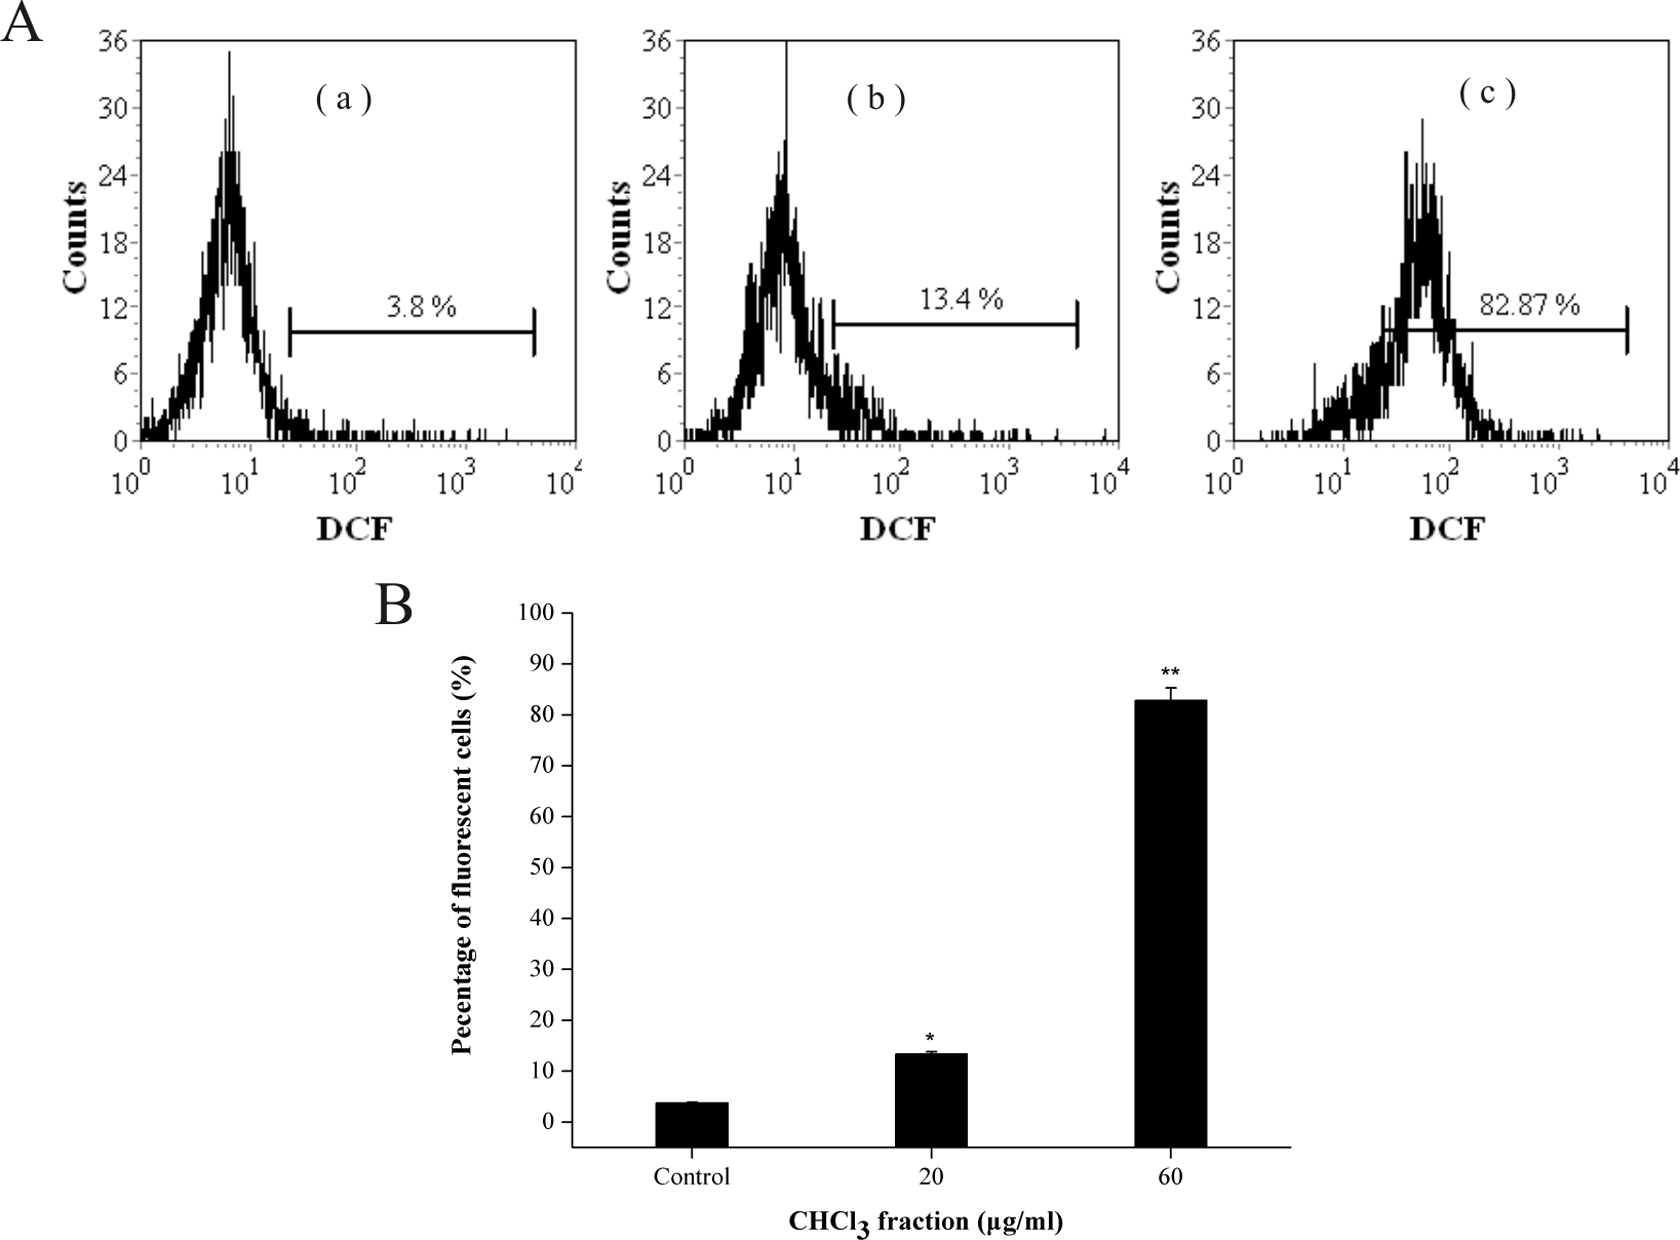
CHCl3 fraction stimulated intracellular ROS generation in K562 cells. (a) Cells were treated with CHCl3 fraction for 4 h at (a′) control; (b′) 20 µg ml−1; (c′) 60 µg ml−1, and labeled with DCFH-DA. The fluorescence intensity of the oxidized product DCF in individual cells was detected by flow cytometry, the percentage of fluorescent cells in each group was shown. (b) Each value is expressed as a mean ± SD of three independent experiments. *p <0.05; **p <0.01: versus the control. CHCl3: chloroform; ROS: reactive oxygen species; DCFH: 2′,7′-dichlorofluorescin; DA: diacetate
After incubation for 12 h, a significant Δψ
m loss could be detected in the treated group with the increasing dose of PFCF (Figure 9). The mean fluorescent intensity of Rh123 in the control group was 94.13, which was statistically much higher than that in the PFCF group (72.46 and 59.72; p < 0.01
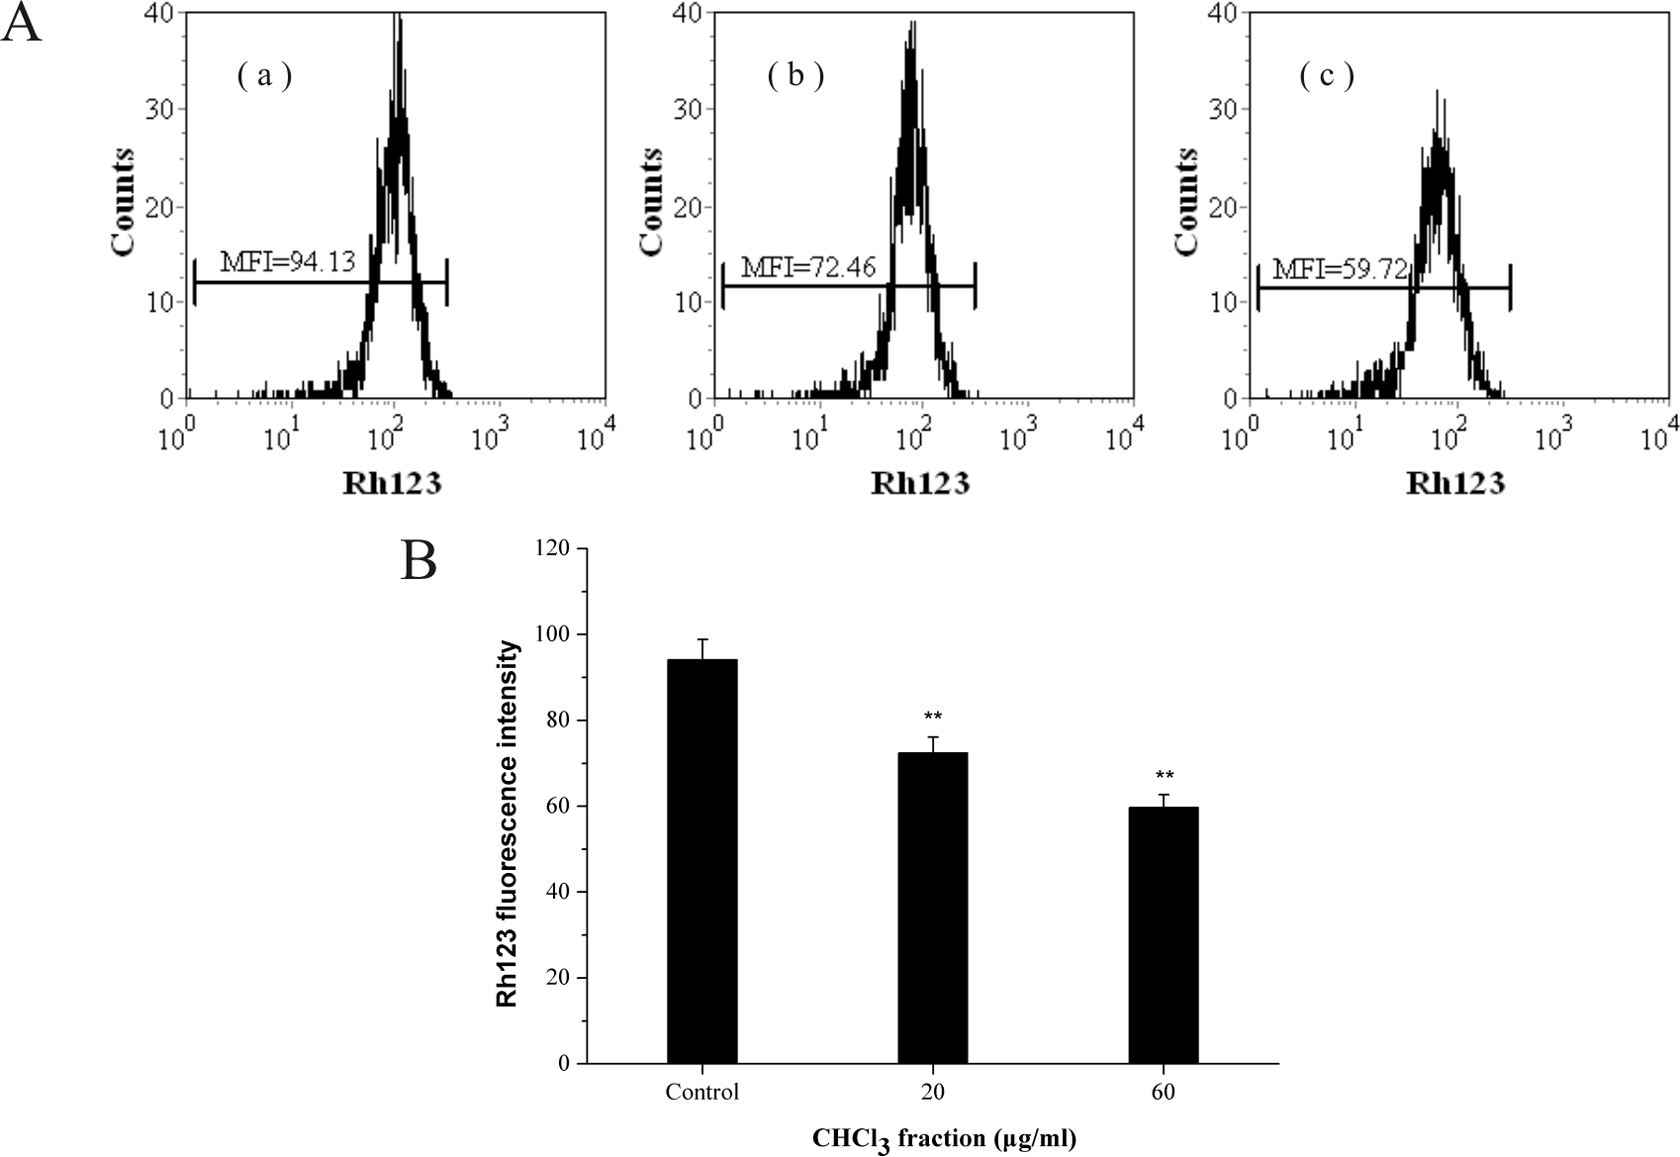
Effect of CHCl3 fraction on the mitochondrial membrane potential of K562 cells. (a) Cells were treated with CHCl3 fraction for 12 h at (a′) control; (b′) 20 µg ml−1; (c′) 60 µg ml−1, labeled with Rh123, and analyzed by flow cytometry. Histograms show number of cell channel (vertical axis) versus Rh123 fluorescence (horizontal axis). (b) The results represent the mean ± SD of three independent experiments. **p < 0.01: statistically
Discussion
Numerous cytotoxic polypore metabolites with lower molecular weight are related to the cytotoxic, antitumor, and immunomodulatory abilities of polypore extracts. 11,12 For example, hispidin, isolated as a naturally occurring styrylpyrone from Inonotus hispidus, is cytotoxic to cancerous cells while is little toxic in normal cells. 13 Studies have shown that zhankuic acid A exhibited its cytotoxic activity against P-388 murine leukemia. 14 Thus, the major objective of this work is to determine the chemical compositions of PFCF by GC-MS to investigate the in vitro antitumor effects and explore its underlying molecular mechanisms.
GC-MS analyses of the CHCl3 extract have shown the presence of alkanes, terpenoid, ketones, fatty acid, aldehyde, and phytosterol (Figure 1). Because the chemical properties of the identified compounds varied widely, we couldn’t tell which individual compound was the major cause of the observed antitumor effects or whether such results were mainly due to the mixture of certain compounds. According to the results of gas chromatography, the nonvolatile compounds are not detected, which might have contributed to this capacity, so further investigations are required to identify the active ingredients which may be responsible for the antitumor activity of PFCF.
It has been proven that the P. fomentarius extract could inhibit the proliferation of tumor cells. 5 In our article, data indicate that PFCF inhibits the proliferation of K562 cells depending on both the dosage and the incubation time. Meanwhile, K562 cells turned out to be much more sensitive to PFCF than PBMC cells (Figure 2(b)). This is partly in agreement with Beattie et al.’s report; 15 their results indicated that 15 Australian fungi species showed low or no cytotoxic activity against human healthy cells and some had significant (Omphalotus nidiformis, Cordyceps Cranstounii, and Cordyceps gunnii) and selective (Xerula mundroola, Leratiomyces ceres, and Hypholoma fasciculare) activity against cancer cells. The data suggest that the P. fomentarius might be of great potential in cancer treatment.
In this study, we observed that significant plasma membrane damages are caused by PFCF in K562 cells (Figures 3 and 4). It was reported that cell membrane could just maintain homeostasis and regulate itself within a certain extent. Once the stimulus is beyond the threshold, cell membrane will be injured and physicochemical properties may be changed, which then drive cells toward apoptotic or necrotic death. 16 Moreover, the PFCF-induced cell membrane damages were further evidenced by SEM observation (Figure 5). Changes on the surface of cell membrane affect cellular functions directly and may eventually lead to cell death. Thus, the results of membrane evaluation were consistent with the above-presented cell viability trends.
In terms of many types of cancers, defects in apoptosis are the common characters and are also essential in the resistance to different cancer therapies. 17 –19 Thus, apoptotic pathways are relevant targets of cancer therapies. 18 Over the past two decades, bioactive compounds in a growing number have been extracted from various traditional Chinese medicines, while some of them are related to apoptotic induction. 20 In this study, we found that PFCF could induce apoptosis in K562 cells (Figure 6), implying that such extract has great potential in screening anticancer drugs.
Nowadays, studies on apoptosis pathways that were induced by compounds extracted from plants mainly focus on mitochondria/intrinsic pathway. Both ROS- and Ca2+-mediated mechanisms have been reported to play vital roles in targeting cancer cells. 21 –25 Besides, mitochondria were also involved in cell apoptosis triggered by various stimuli. 26,27 Therefore, we examined the changes of intracellular [Ca2+]i, ROS formation, and Δψ m after PFCF treatment in K562 cells. As can be seen from Figure 7, after treatment, PFCF at 60 µg ml−1 could obviously enhance [Ca2+]i. It is well established that cellular [Ca2+]i overload may cause cytotoxicity and result in cell death. 28 Additionally, compared with the control group, the generation of intracellular ROS dramatically increased in a concentration-dependent manner (Figure 8). It has been reported that high levels of oxidative stress are toxic in cancer cells. 29 Such data suggest that ROS- and Ca2+-mediated mechanisms might be both involved in our system when treated with PFCF in K562 cells. Δψ m, as detected by flow cytometry with RH123, gradually decreased with the increasing PFCF doses (Figure 9), indicating that mitochondria were seriously damaged after PFCF treatment. Thus, we assume that PFCF-induced cell apoptosis might be ROS- and Ca2+-mediated mitochondria dependent.
In summary, our preliminary results, for the first time, evaluated the cytotoxicity of the P. fomentarius CHCl3 fraction in K562 cells, demonstrated that PFCF could cause cell membrane damage, influence intracellular [Ca2+]i, promote the yield of ROS, decrease the level of Δψ m, and then initiate apoptosis.
Footnotes
Conflict of interest
The authors declared no conflicts of interest.
Funding
This work was supported by National “Twelfth Five-Year” Plan for Science and Technology Support (2011BAI06B05), National Natural Science Foundation for Young Scholars of China (81202957) and Natural Science Foundation of Shaanxi Province, China (2014JM4137).