
Abstract
Three different doses of valproic acid (20, 100, and 500 mg/kg/d) are administered orally to Sprague-Dawley rats for 5 days, and the feasibility of metabolomics with gas chromatography–mass spectrometry as a predictor of the hepatotoxicity of valproic acid is evaluated. Body weight is found to decrease with the 100-mg/kg/d dose and significantly decrease with the 500-mg/kg/d dose. Mean excreted urine volume is lowest in the 500-mg/kg/d group among all groups. The plasma level of α-glutathione-S-transferase, a sensitive and earlier biomarker for hepatotoxicity, increases significantly with administration of 100 and 500 mg/kg/d; however, there is not a significant difference in α-glutathione-S-transferase plasma levels between the control and 20-mg/kg/d groups. Clusters in partial least squares discriminant analysis score plots show similar patterns, with changes in physiological conditions and plasma levels of α-glutathione-S-transferase; the cluster for the control and 20-mg/kg/d groups does not clearly separate, but the clusters are separate for 100- and 500-mg/kg/d groups. A biomarker of hepatotoxicity, 8-hydroxy-2′-deoxyguanosine and octanoylcarnitine, is identified from nontargeted and targeted metabolic profiling. These results validate that metabolic profiling using gas chromatography–mass spectrometry could be a useful tool for finding novel biomarkers. Thus, a nontargeted metabolic profiling method is established to evaluate the hepatotoxicity of valproic acid and demonstrates proof-of-concept that metabolomic approach with gas chromatography–mass spectrometry has great potential for predicting valproic acid–induced hepatotoxicity and discovering novel biomarkers.
Keywords
Valproic acid (VPA, 2-propylpentanoic acid, Figure 1 ) is a broad-spectrum antiepileptic agent that has a branched-chain carboxylic acid structure. VPA has been used to treat bipolar disorder, migraine, and neuropathic pain, 1-3 but it has been demonstrated to be associated with fatal liver toxicity. 4-7 Although the mechanism by which VPA leads to liver toxicity has not been fully elucidated, a large body of evidence suggests that reactive VPA metabolites—4-ene-VPA; 2-propyl-4-pentanoic acid and its subsequent metabolite, (E)-2,4-diene-VPA; 2-propyl-2,4-pentanoic acid)—may mediate hepatotoxicity by inhibiting mitochondrial fatty acid β-oxidation. 5,8,9 As a result, plasma 15-F2t-isoprostane has been suggested as a biomarker for evaluating the hepatotoxicity of VPA. 10 However, little or no association was found between either high serum or urine levels of 4-ene-VPA or 2,4-diene-VPA and hepatotoxicity. 11 A similar conclusion was reached following comparative studies of VPA and 2-ene-VPA in rats, where the incidence of liver microvesicular steatosis was observed to be independent of the plasma levels of 4-ene-VPA and (E)-2,4-diene-VPA. 12 Recently, N-acetylcysteine (NAC) conjugates of 2,4-diene-VPA were identified in urine and, in particular, NAC-I was reported to be 3 to 4 times higher in hepatotoxic patients than in nonhepatotoxic patients. 9,13 NAC-I ((E)-5-N-acetylcystein-S-yl-3-ene-VPA) and NAC-I III (4-hydroxy-5-N-acetylcystein-S-yl-VPA) have both been suggested to be predictors of deleterious side effects. 14
Chemical structure of valproic acid.
Previous reports have suggested that several biomarkers are required to predict the hepatotoxicity of valproic acid, because it is very difficult to determine the hepatotoxicity of valproic acid based on just 1 or a few biomarkers. As a result, the effort to predict the hepatotoxicity of valproic acid using biomarkers is ongoing.
In this report, we used a metabolomics approach to determine whether gas chromatography–mass spectrometry (GC-MS) could be a useful tool for predicting the hepatotoxicity of valproic acid and identifying biomarkers. Metabolomics is the study of monitoring as many low-molecular-weight metabolites (generally <1000 Da) as possible. Using a metabolite profiling strategy enables us to identify the consistently varying metabolites and elucidate changes in the relevant metabolic regulatory network using cutting-edge techniques, such as mass spectrometry (MS) and nuclear magnetic resonance. 15 In this study, GS-MS was used both to perform metabolite profiling and to test the feasibility of a metabolomics approach for elucidating hepatotoxicity markers by evaluating the change in plasma levels of α-glutathione-S-transferase, which is known to be a sensitive marker for hepatotoxicity. 10,16
Method
Chemicals
Valproic acid (VPA), ethyl acetate, and N-methyl-N-trimethylsilyltrifluoroacetamide (MSTFA) were obtained from Sigma-Aldrich (St. Louis, Mo). Methanol was purchased from Burdick & Jackson (Muskegon, Mich). β-glucuronidase/arylsulfatase from Helix pomatia was purchased from Roche Applied Science (Penzberg, Germany). An enzyme immunoassay kit for α-glutathione-S-transferase (α-GST) was purchased from Biotrin International (Dublin, Ireland). The following nucleosides were supplied by Sigma Aldrich: pseudouridine, cytidine, uridine, 1-methyladenosine, 5-methylcytidine, 5-methyl-2′-deoxycytidine, 5-hydroxymethyl-2′-deoxyuridine, guanosine, 3-methyluridine, 2′-deoxyguanosine, 8-hydroxy-2′-deoxyguanosine, adenosine, N2,N2-dimethylguanosine, 5-deoxyadenosine, and 1-hydroxy-isoguanine (internal standard, ISTD). The following acylcarnitines were also purchased from Sigma-Aldrich: hexanoylcarnitine, octanoylcarnitine, decanoylcarnitine, lauroylcarnitine, myristoylcarnitine, palmitoylcarnitine, and stearoylcarnitine. A deuterated octanoylcarnitine-d3 was used as an ISTD and was obtained from Cambridge Isotope Laboratories (Andover, Mass).
Animal Treatment
Six- to 8-week-old, male Sprague-Dawley rats (weighing 280-325 g) were purchased from Orientbio Korea (Seoul, Republic of Korea) and housed in a room with an ambient temperature of 20° to 23°C, 12-hour light (07:00-19:00) and dark (19:00-07:00) cycles, and a relative humidity of 50% ± 5%. Rats were given a standard chow diet (Samtaco, Seoul, Republic of Korea) and tap water ad libitum.
Oral Administration of Valproic Acid and Sample Collections
Sodium valproate was dissolved in water (10-250 mg/mL) and was administered orally by gavage in doses of 20, 100, and 500 mg (as the base) per kilogram per day (n = 5, in each group) for 5 days. Following drug administration, rats were given a standard chow diet and tap water freely. Urine was collected every 24 hours after each dosing using a metabolic cage. Blood samples were collected from the carotid artery at 24 hours postdose after the fifth day of drug administration; the blood samples were centrifuged and the plasma was obtained. Urine and plasma samples were stored at –20°C before analysis. A single oral dose of sodium valproate was administered in above-mentioned doses to check the plasma α-GST level. Blood samples were collected at 24 hours after drug administration. Plasma collection and storage of samples were standard for multiple dose studies.
α-Glutathione S-Transferase Assay
Plasma levels of α-GST were measured using an enzyme immunoassay (HEPKIT-Alpha; Biotrin International, Dublin, Ireland) with a reference range of <8 g/L and intra-assay and interassay coefficients of variation of 7.8% and 9.1%, respectively.
Nontargeted Metabolic Approach for Recognizing Global Metabolic Patterns Using GC/MS
The sample preparations for nontargeted metabolic approach were prepared per a published method 17 with slight modification (extractions in pH 2 condition were excluded in this study to avoid a severe condition that could affect the degradation of metabolites). The detailed procedures are as follows: The samples of rat urine were extracted with a Strata-X cartridge (60 mg, 3 mL; Phenomenex, Torrance, Calif). The cartridge was activated with 1 mL of methanol and washed with water thereafter. The urine samples were passed through the cartridge using a vacuum. The cartridge was washed with 1 mL of water again, and the nontargeted metabolites were eluted with methanol (2 mL). Half of the methanol (1 mL) was evaporated under a nitrogen stream and derived with MSTFA (direct solid phase extraction: fraction 1). The other half of the methanol (1 mL) was evaporated under a nitrogen stream, and enzymatic hydrolysis was performed by adding 50 μL of β-glucuronidase/arylsulfatase (from Helix pomatia; Roche, Mannheim, Germany) with 0.4 mL of 0.2 M acetate buffer (pH 5.0) at 55°C for 3 hours. After a slight cooling at room temperature (pH 5.0), we extracted the enzymatic hydrolysates with 4 mL of ethyl acetate by mechanically shaking for 10 minutes. The solution was centrifuged at 2400 rpm for 5 minutes and frozen at –30°C in a freezer to separate the organic layer from the aqueous layer. The separated organic layer was evaporated under a gentle stream of nitrogen, and the residues were kept in desiccators for further derivatization (weak acidic liquid–liquid extraction: fraction 2). We added 10 mg of K2CO3 to the remainder of the aqueous phase from fraction 2 to adjust the pH to 9-10 for basic extraction conditions. This fraction was extracted with 4 mL of ethylacetate by mechanically shaking for 10 minutes, centrifuged at 2400 rpm for 5 minutes, and frozen at –30°C to separate the organic layer from the aqueous layer. The organic layer was then dried and stored (basic liquid–liquid extraction: fraction 3). Each residue that was evaporated and stored was dissolved in 50 μL of the silylating reagent, MSTFA, and heated to 60°C for 15 minutes. Then we analyzed the solutions by GC/MS.
To analyze the nontargeted metabolic profiles, we used GC-MS, which consists of Polaris QMS and Trace GC 2000. The analysis was conducted in the scan mode to screen in the mass range of 50 to 800 m/z, and the mass spectrometer was operated at 70 eV in the electron impact mode. Ultra-1 column (25 m × 0.2 mm internal diameter, 0.33-μm film thickness: Agilent, Santa Clara, Calif) was used, and each sample (1 μL) was injected in split mode (split ratio 50:1). The initial oven temperature was 80°C; the temperature was ramped to 300°C at a rate of 10°C/min and held for 5 minutes. The carrier gas was helium and the column flow rate was 0.8 mL/min.
Quality control samples were prepared 18 by mixing equal volumes from each of 10 blank rat urine samples and prepared by the same method as the sample extraction. Samples were analyzed with samples at each run, and we checked the repeatability and sensitivity of analysis during runs.
Data Processing
Data processing and multivariate analysis were performed per a reported method. 17
For the nontargeted approach, we analyzed fractionated urine samples using GC/MS. The raw data were collected and processed using MetAlign software (http://www.metAlign.nl) for unbiased and unsupervised comparisons of all GC/MS data sets. 19 With the software package, the baseline of ion traces in the raw data was collected and all mass peaks were aligned to generate ordered data matrices. Then the mass ion amplitudes of the aligned peaks and the matrices were examined using Matlab version 7.0.4 R14 (Mathworks, Natick, Mass); the matrices were further examined by multivariate data analysis.
Multivariate Data Analysis for Nontargeted Metabolic Approaches
We stored the processed data in either Excel spreadsheets or a Comma Separated Values formatted file. In the Excel data, characteristic mass fragmentations for VPA, 2,4-diene-VPA, and 4-ene-VPA were excluded after we confirmed mass fragmentation and retention time obtained from analyzing standard compounds in same GC-MS conditions as sample analysis. Characteristic fragments (m/z value) for other metabolites (m/z 185, 191 for 3-hydroxy-VPA and 4-hydroxy-VPA, m/z 185 for 5-hydroxy VPA and PGA [2-propyl glutaric acid], m/z 183 for 3-keto VPA, and m/z 215 for 4-keto VPA) were excluded by interpreting mass spectra from a published report. 20,21
Then all data were imported into SIMCA-P software (version 11.0, Umetrics, Ume, Sweden). We analyzed the nontargeted metabolite profiles of rat urine using partial least squares discriminant analysis (PLS-DA) in Pareto mode as the supervised method to classify between the control group and each of the treatment groups. 22 The fraction of the Y variables explained after the selected component (R2Y) along with the fraction of the variation of the Ys that can be predicted by a component according to the cross-validation (Q2Y) was calculated to plot and validate the model. After calculating components for PLS-DA, we selected significant components according to the rule embedded in SIMCA-P software, where Q2 should be larger than 0 for more than 100 observations and 0.05 for 100 observations or less. Then, PLS-DA plots were displayed superimposed over the 2 highest latent variables (t1/t2 of p1/p2 as X, Y axes) such that most of the association with dummy Y variables can be explained by the variation in X. High coefficient values of R2Y and Q2Y represent good discrimination. A single point in the scatter plot contains information for thousands of mass ions for the nontargeted approach. Metabolic patterns can be interpreted by the visual image and by the values of R2Y and Q2Y.
Quantitative Analysis for Nucleosides in Urine
Fourteen nucleosides (pseudouridine, cytidine, uridine, 1-methyladenosine, 5-methylcytidine, 5-methyl-2′-deoxycytidine, 5-hydroxymethyl-2′-deoxycytidine, 5-hydroxymetnyl-2′-deoxyuridine, guanosine, 3-methyluridine, adenosine, 2′-deoxyguanosine, 8-hydroxy-2′-deoxyguanosine, N2,N2 -demethylguanosine) were quantified with direct injection of urine using column-switching liquid chromatography (Nanospace SI-2 HPLC System, model 3001, Shiseido, Tokyo, Japan)–tandem mass spectrometry (MS/MS) (LCQ advantage, Thermo Scientific, Waltham, Mass) as we have previously reported. 23
Quantitative Analysis for Acylcarnitines in Urine
A detailed analytical method for urinary acylcarnitines was provided in our previous reports. 24 Briefly, urine, which was centrifuged to remove floating material, was filtered through a PVDF filter (Milles-GV, 0.2-μm pore size, Millipore Korea, Seoul, Korea) to remove proteins. An internal standard (d3-octanoylcarnitine) was added and was directly injected into the column-switching liquid chromatography (Nanospace SI-2 HPLC System, model 3001, Shiseido, Tokyo, Japan). Seven acylcarnitines (hexanoylcarnitine, octanoylcarnitine, decanoylcarnitine, lauroylcarnitine, myristoylcarnitine, stearoylcarnitine, palmitoylcarnitine) were monitored with electrospray MS/MS (LCQ advantage, Thermo) in selective reaction monitoring mode.
Results
General Observations
Body weights (Figure 2) and daily excreted urine volumes (Figure 3) were measured over 5 days to determine physiological changes in these parameters for the experimental animals. Body weight gain increased slightly with the administration of the low dose of VPA (20 mg/kg/d) compared with the control group, which may be a result of the clear decrease in movement of each rat after dosing attributable to VPA’s sedative action. Body weight gain decreased in rats administered the 100- and 500-mg/kg/d doses, but the change was only significant (P < .05) in the 500-mg/kg/d group after 5 days of drug treatment. The daily excreted urine volume was not significantly changed in any group. Although the daily excreted urine volume did not change significantly, it did increase modestly until the 2- and 3-day time points and then decreased after that time in the control and the 20-mg/kg/d and 100-mg/kg/d groups. However, the mean excreted urine volume was always the lowest after the second day of administration in the 500-mg/kg/d group among all the groups. These results indicate that the physiological condition of the experimental animals might start to change above 20 mg/kg/d and might significantly change at 500 mg/kg/d.
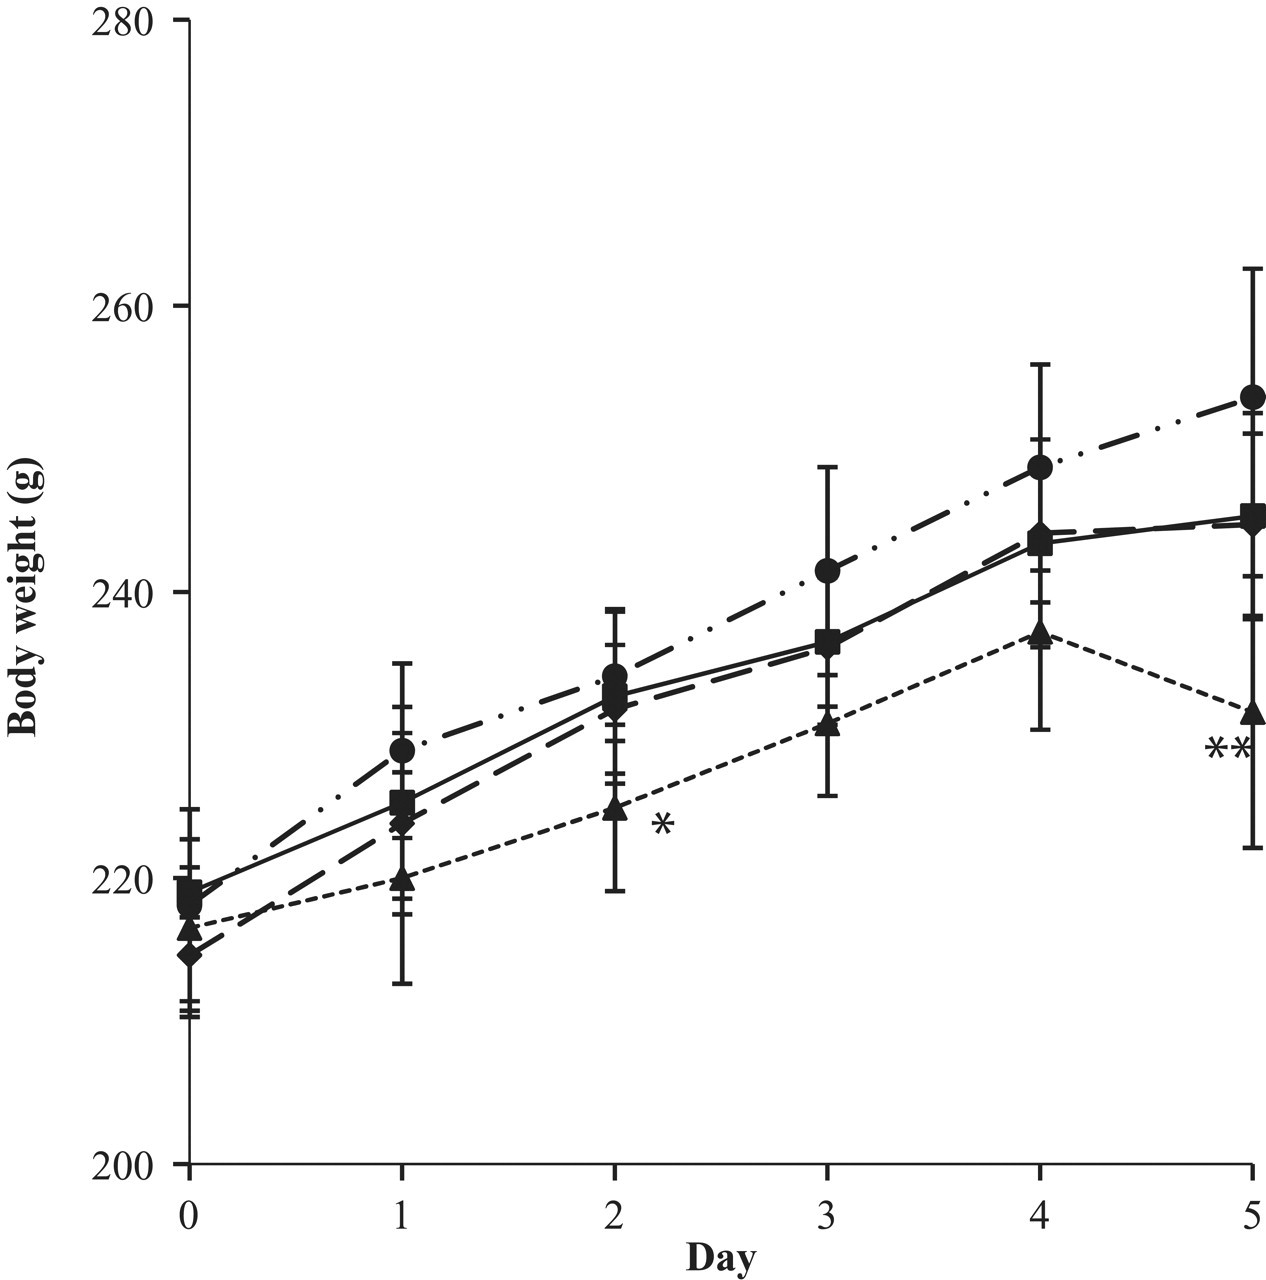
Change in body weight after multiple oral administrations of valproic acid for 5 days (squares, control; circles, 20 mg/kg/d; diamonds, 100 mg/kg/d; triangles, 500 mg/kg/d; *P < .05, **P < .01).
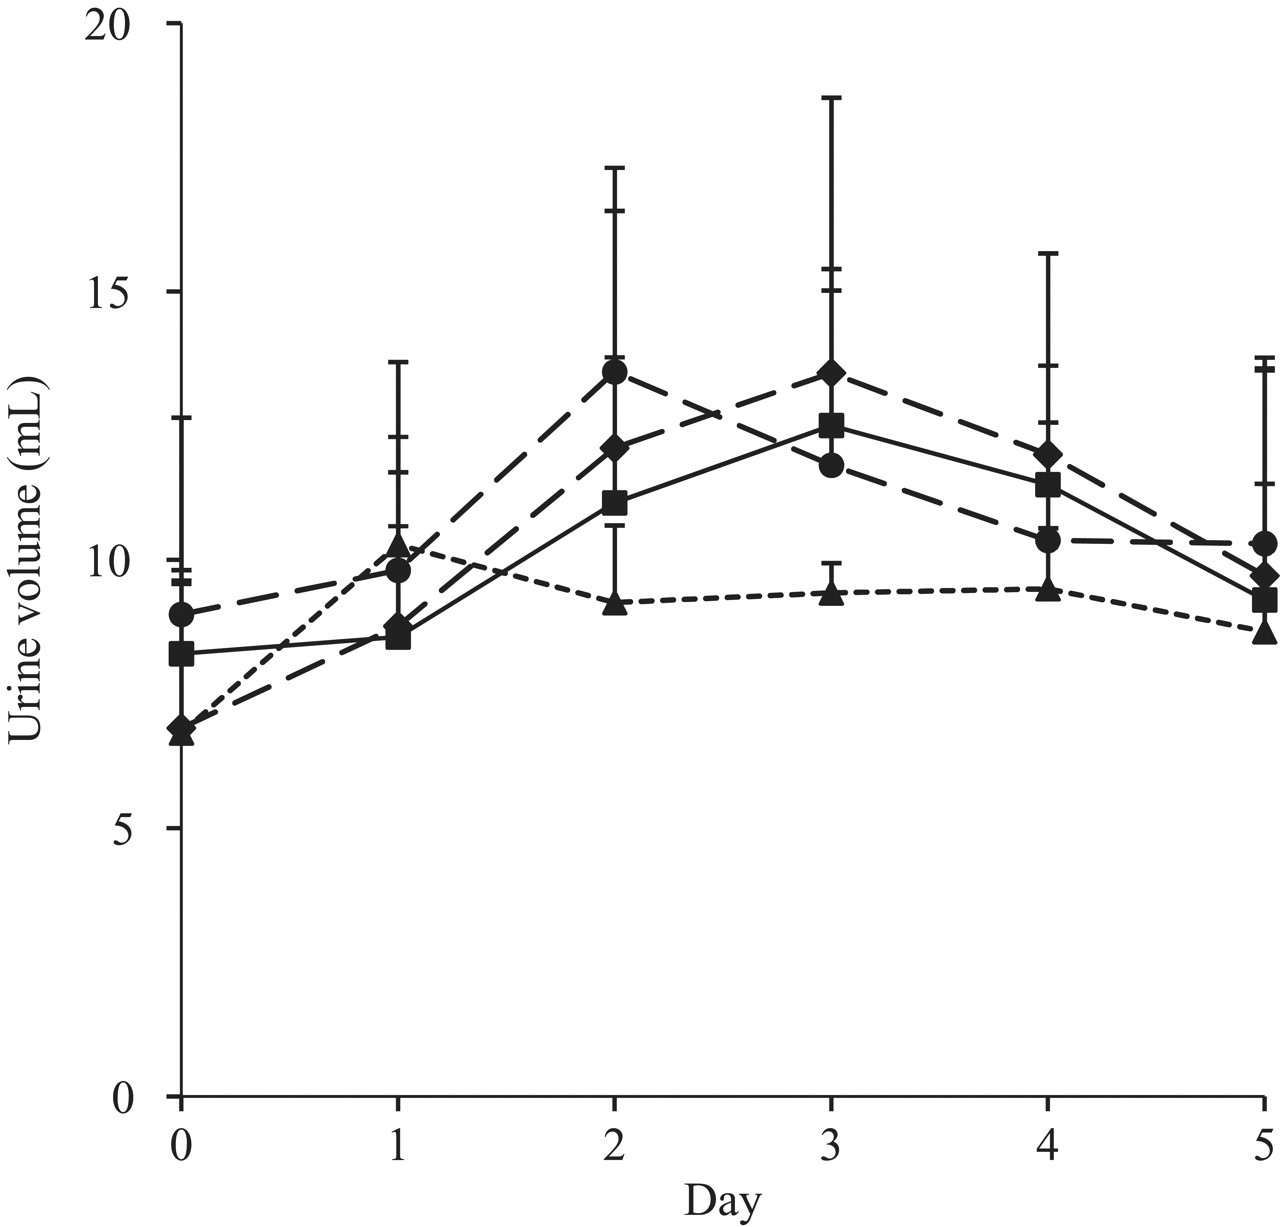
Change in the urine volume collected 24 hours after each consecutive oral administration of valproic acid carried out over 5 days (squares, control; circles, 20 mg/kg/d; diamonds, 100 mg/kg/d; triangles, 500 mg/kg/d).
Plasma Concentration of α-GST
The α-GST concentration in plasma, a specific marker for hepatotoxicity, was checked to evaluate hepatotoxicity 24 hours after the final administration on the fifth day as well as 24 hours after a single oral administration of valproic acid. As shown in Figure 4A, the plasma α-GST level was almost zero in the control and 20-mg/kg rats, but it was dramatically increased in the 100-mg/kg rats and was further increased in rats that received a single oral administration of 500 mg/kg. The trend of the α-GST plasma level after multiple oral administration of valproic acid for 4 weeks (Figure 4B) was very similar with after single oral administration of valproic acid with respect to the different doses. These data suggest that the liver toxicity induced by valproic acid administration might not occur at the low dose but could be increased above baseline with administration of 20 mg/kg/d.
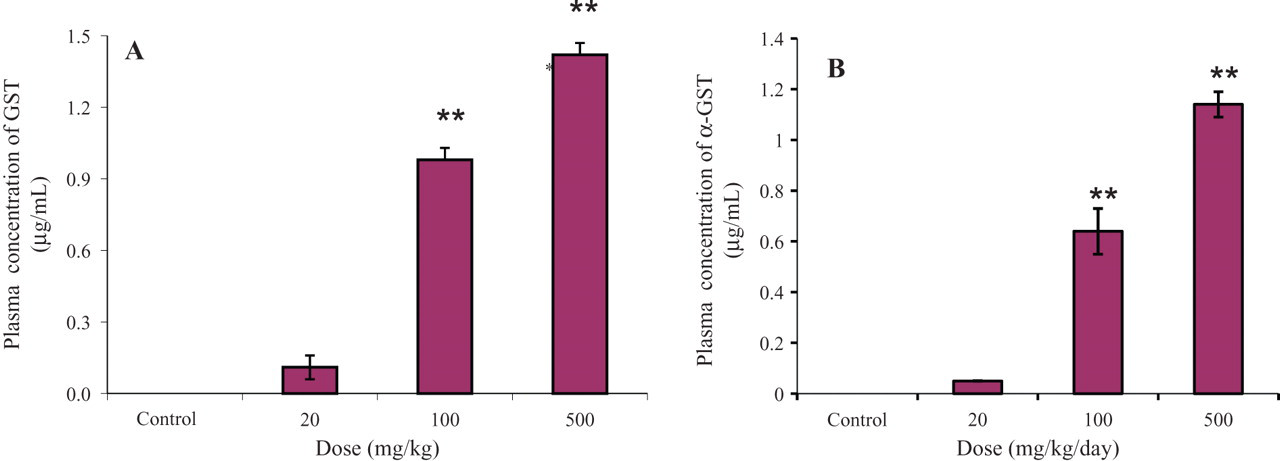
Plasma concentration of α-glutathione-S-transferase (α-GST). (A) Plasma α-GST level after a single oral administration of valproic acid. (B) Plasma α-GST level after the fifth day of multiple oral administrations of valproic acid. **P < .01.
These results also agree with our observations of physiological changes. From those findings, it is suggested that metabolic changes could be observed at a dose greater than 20 mg/kg/d, and significant changes are observed with administration of 500 mg/kg/d.
Compared with the profile for plasma levels of α-GST, physiological changes did not appear as rapidly. This indicates that endogenous metabolic changes may occur prior to physiological changes.
Chromatographic Patterns by GC-MS and Clustering Patterns by PLS-DA After Multiple Oral Administrations of Valproic Acid
A distinguishable change in the chromatographic pattern was observed in fraction 1 (direct solid phase extraction). A representative GC-MS chromatogram from a sample taken after dosing on the first day is shown in Figure 5A. It is obvious that the chromatograms for the control and 20-mg/kg/d groups were similar: the chromatogram for the 100-mg/kg/d group had a pattern that was similar in some respects to the chromatograms observed for the 20-mg/kg/d and 500-mg/kg/d groups, and the chromatogram for the 500-mg/kg/d group had a different pattern than the control and 20-mg/kg/d groups.
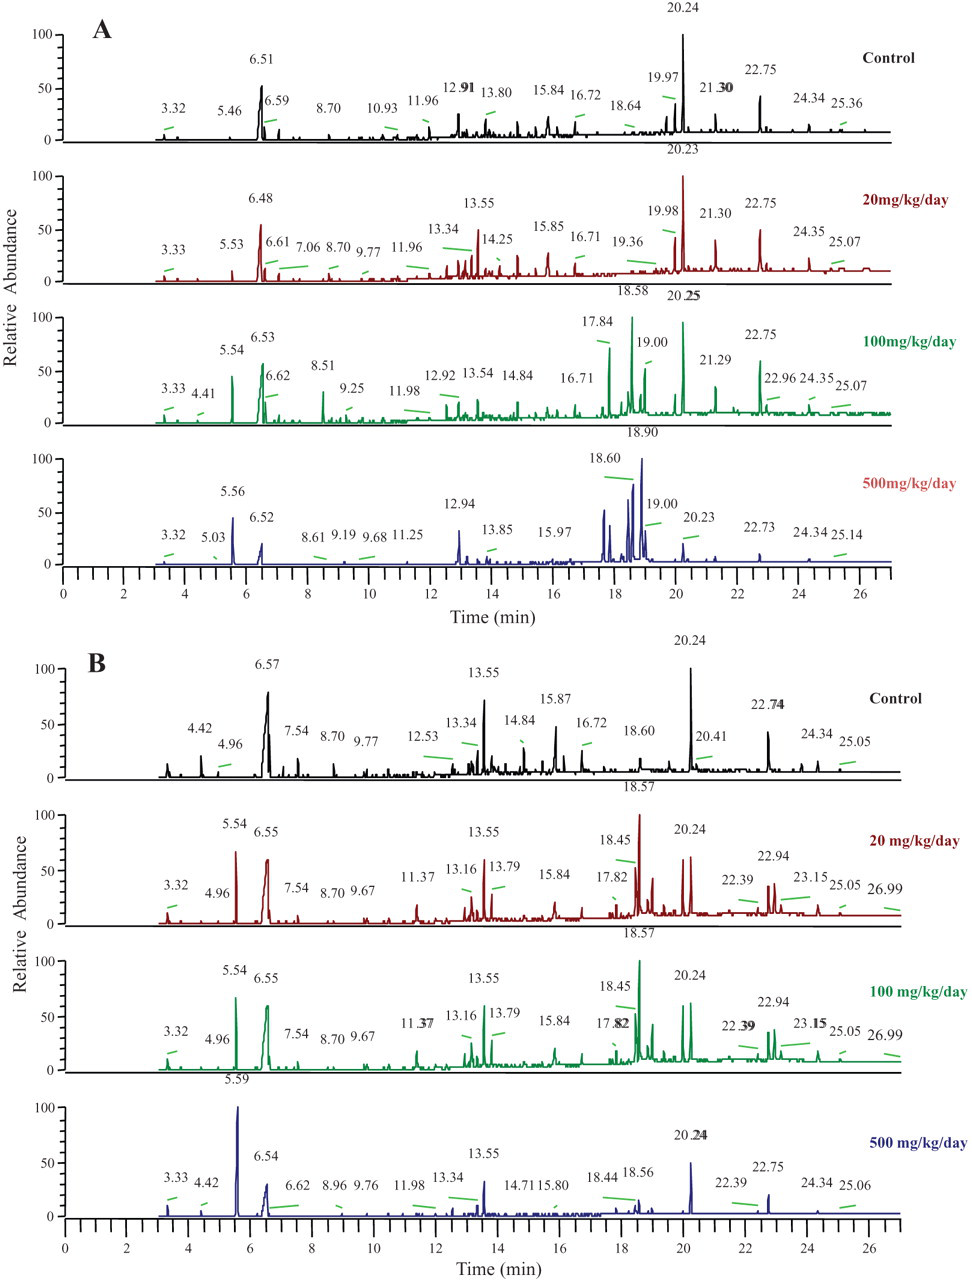
Representative GC-MS chromatograms of rat urine after multiple oral administrations of valproic acid at (A) the first day and (B) the fifth day.
The chromatographic pattern on the fifth day (Figure 5B) was slightly different from the pattern for the first day: the chromatogram for the 20-mg/kg/d dose showed a mixed pattern compared with the control and 100-mg/kg/d chromatograms, and the chromatographic pattern for the 500-mg/kg/d group was somewhat different from other groups.
The change in the metabolic pattern was more easily and clearly observable in PLS-DA score plots, as shown in Figure 6 . The clusters for the control and 20-mg/kg/d groups in the 2D-PLS-DA score plot did not clearly separate, but the clusters for the 100- and 500-mg/kg/d groups were separated at the first day of dosing (Figure 6A). The clusters for control and 20-mg/kg/d groups were closer and completely separated from those for 100- and 500-mg/kg/d groups at the fifth day after multiple oral administrations of valproic acid (Figure 6B).
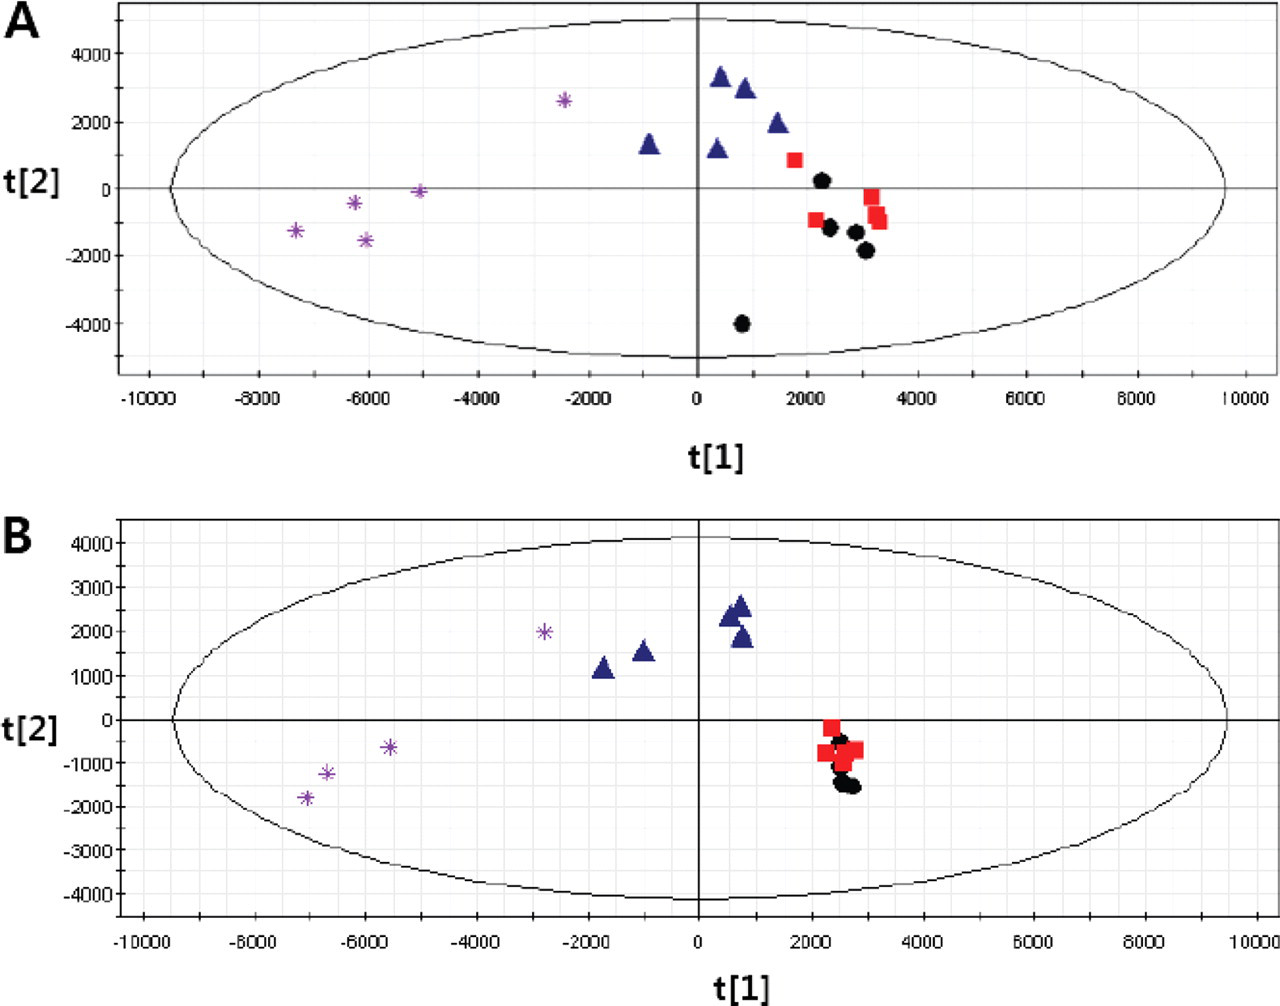
PLS-DA score plots derived from the GC-MS data from urine samples collected after multiple oral administrations of valproic acid at (A) the first day (R2Y = 0.50, Q2Y = 0.31) and (B) the fifth day (R2Y = 0.99, Q2Y = 0.88). Circles, control; squares; 20 mg/kg/d; triangles, 100 mg/kg/d; asterisks, 500 mg/kg/d.
Urinary Excretion of Nucleoside
In the GC-MS chromatogram, the discrimination peaks between doses appeared in 13 to 16 minutes and 18 to 25 minutes (Figure 5B). The peak at 5.5 minutes is valproic acid, but other known toxic metabolites, 4-ene-VPA and 2,4-diene-VPA, were not detected in the chromatogram when their retention time and mass spectra were checked by standard compounds. The detection of other metabolites, 3-hydroxy-VPA, 4-hydroxy-VPA, 5-hydroxy VPA, 3-keto VPA, and PGA, was also checked by known mass spectra from published reports 20,21 with extracted ion chromatograms. The possible peaks for those metabolites were detected in 12 to 13 minutes and 18 to 20 minutes, but the exact retention times and mass spectra could not be identified because we have no synthetic standards for those metabolites.
Although it was not possible to trace exact retention time of metabolites mentioned above, characteristic mass fragmentation for those metabolites could be excluded as described in the multivariate analysis to avoid its dominating PCA plots. As shown at loading plots (Figure 7 ), m/z 73, 217 was responsible for the metabolic changes at doses of 100 and 500 mg/kg/d. Such characteristic mass fragmentations have been previously reported for the common sugar ions of derivatized 2′-deoxyribonucleosides. 25 It has been reported that metabolism of VPA triggered oxygen-dependent tissue injury and elevated free radicals in the body, 26 and VPA induced cytotoxicity through general oxygen radicals against nuclear DNA. 27 Therefore, those mass fragmentations could be originated from the nucleoside, so we tried identifying exact retention time and mass spectrum with the standards of several nucleosides by GC-MS analysis. However, the mass spectrum was not exactly matched with any of standards of 2′-deoxyribonucleosides that we included in our study. It seems that many matrix components are mixed with the peak, which makes clear identification of the peaks in the SCAN mode of GC-MS difficult. Based on this finding, 14 nucleosides were quantified with another sensitive analytical method using LC-MS to more accurately check for a change of nucleoside. Among the 14 nucleosides, only 8-hydroxy-2′-deoxyguanosine was demonstrated to exhibit a significant difference in the 100- and 500-mg/kg/d groups (Figure 8), and, interestingly, this result also agreed well with the changes of plasma α-GST concentration (Figure 4) and cluster patterns in the PLS-DA score plot (Figure 6). These data suggest that oxidative damage may be one of the factors that generate hepatotoxicity, and the PLS-DA score plot may contain many factors (metabolic changes) that affect hepatotoxicity. It was previously reported that 8-hydroxy-2′-deoxyguanosine is a useful biomarker in blood to follow the risk of valproic acid hepatotoxicity generated from oxidative damage. 28 Given our findings, it can be suggested that 8-hydroxy-2′-deoxyguanosine in urine may be useful to predict the toxicity of valproic acid. A urinary biomarker has an advantage because urine is easily and noninvasively collected.
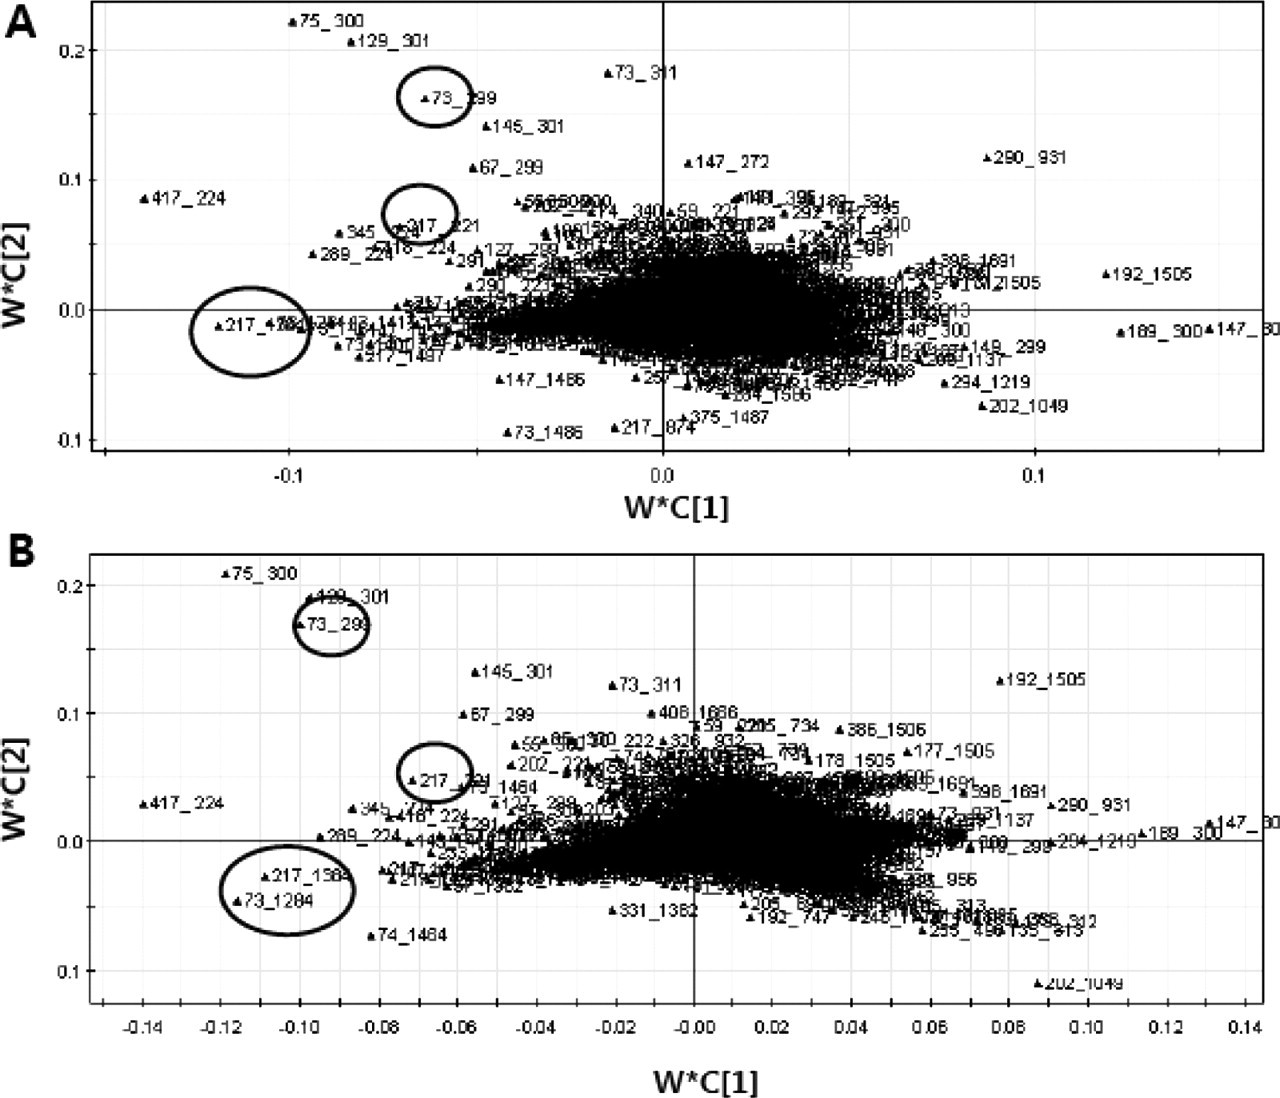
PLS-DA loading plots derived from the GC-MS data from urine samples collected after multiple oral administrations of valproic acid at (A) the first day and (B) the fifth day. Circled data represent the mass fragmentation for 2′-deoxyribonucleosides.
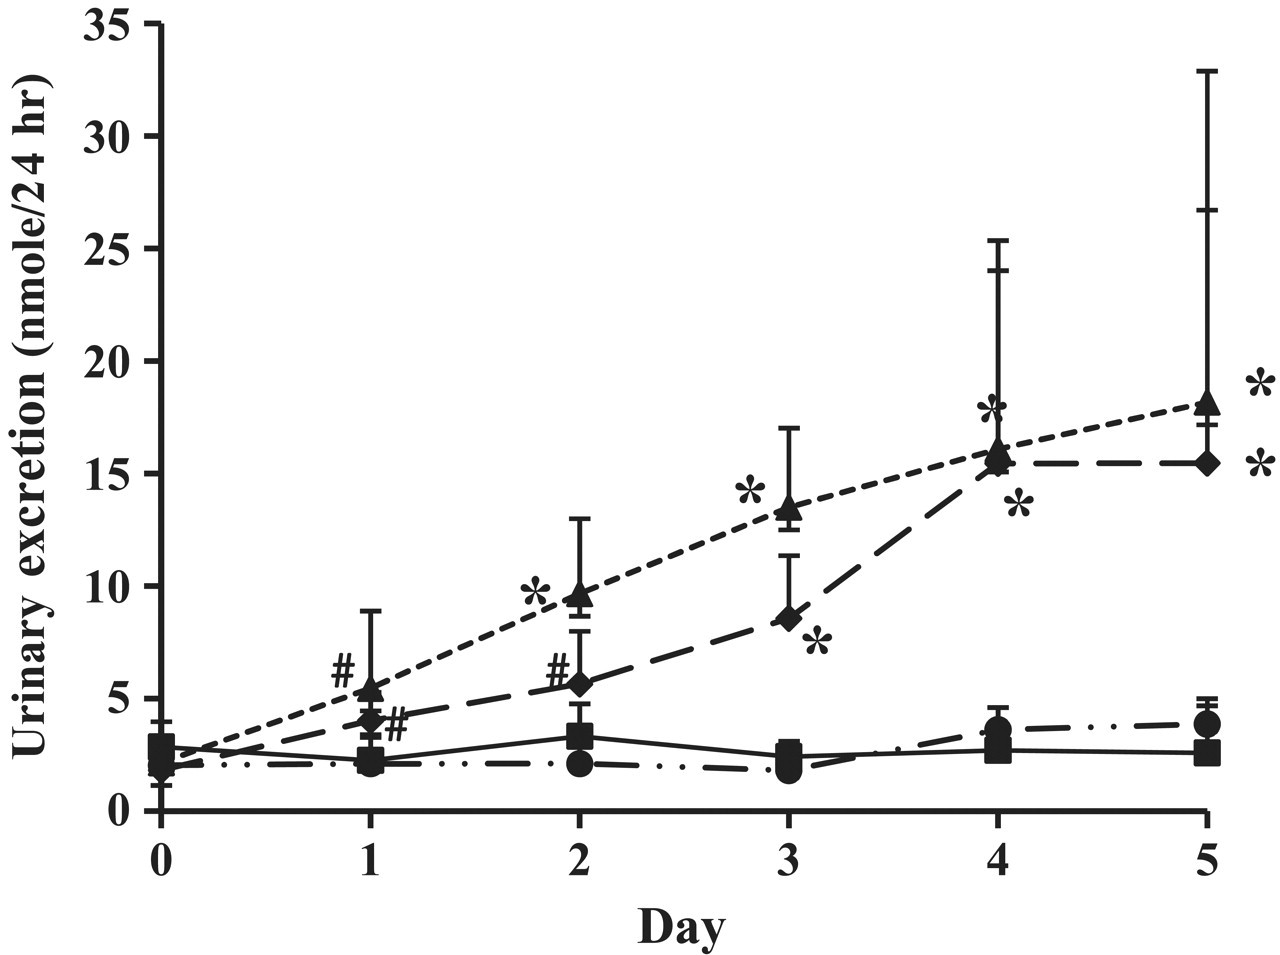
Urinary excretion of 8-hydroxy-2′-deoxyguanosine after multiple oral administrations of valproic acid. Squares, control; circles, 20 mg/kg/d; diamonds, 100 mg/kg/d; triangles, 500 mg/kg/d. *P < .05, # P < .1.
Urinary Excretion of Acylcarnitines
Given that acylcarnitine has been shown to be involved in lipid metabolism and its plasma level has previously been demonstrated to change with the administration of valproic acid, 29,30 we measured the urinary level of acylcarnitines following valproic acid administration. We found that urinary excretion of hexanoyl- and octanoylcarnitine was changed with valproic acid administration (Figure 9). Moreover, urinary excretion of hexanoylcarnitine (Figure 9-A) increased significantly after only 2 days of drug administration in the 500-mg/kg/d group and was significantly increased in all groups that received valproic acid after the fifth day of administration. We also found that urinary excretion of octanoylcarnitine increased significantly after only the first day of dosing in the 100- and 500-mg/kg/d groups, but a significant increase in this acylcarnitine was only observed following the fifth day of administration for the 20-mg/kg/d group (Figure 8-B). Interestingly, the profile of urinary excretion for octanoylcarnitine also agreed with the tendency for changes of plasma α-GST level and cluster separation in PLS-DA score plots.
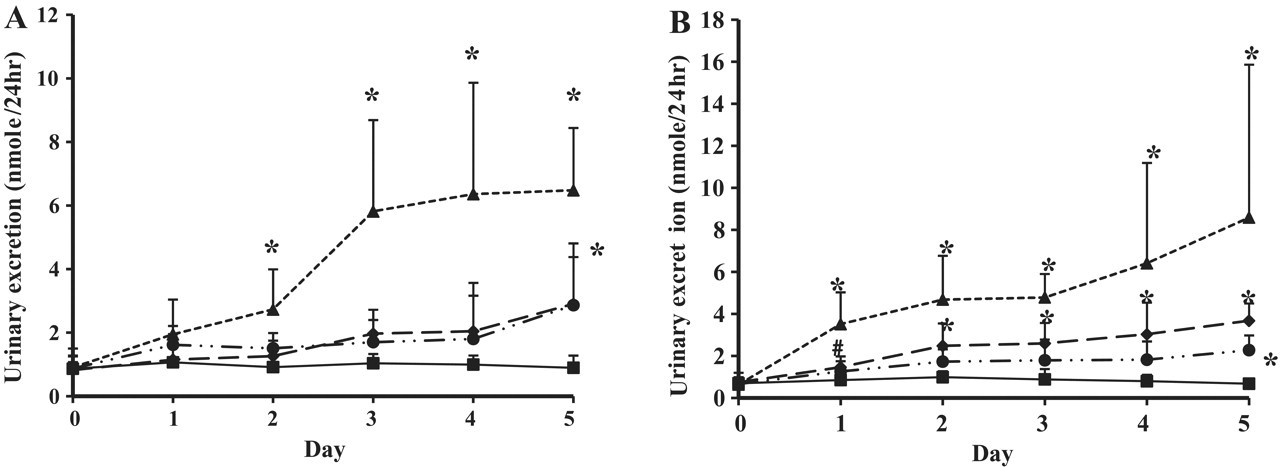
Urinary excretion of hexanoyl carnitine (A) and octanoyl carnitine (B) after multiple oral administrations of valproic acid. Squares, control; circles, 20 mg/kg/d; diamonds, 100 mg/kg/d; triangles, 500 mg/kg/d. *P < .05, # P < .1.
Discussion
GC-MS has its limitations as a tool for metabolite profiling, because many molecular modifications (derivatizations) are performed to increase the sensitivity and selectivity for polar compounds, which, in turn, makes it difficult to identify unknown compounds by database searching. Despite these limitations, metabolite profiling with GC-MS is an attractive tool because of its high resolution and sensitivity. Valproic acid is similar in structure to fatty acid. As a result, it interferes with lipid metabolism in the liver and leads to hepatotoxicity. Valproic acid, its metabolites, and its endogenous metabolites, which could be affected by valproic acid administration, are all easy to detect with GC-MS. With this rationale, we applied a metabolomics study using GC-MS to predict the toxicity of valproic acid.
Three different doses of sodium valproic acid were administered to rats, and urine was selected as the biological sample in which we would carry out our study because of its ability to be collected noninvasively. Many different extraction steps were tested to determine the best extraction methods to detect as many metabolites as possible, which would best reflect any metabolic changes following valproic acid administration. From the results of the PLS-DA plots, fraction 1 (direct solid phase extraction) was the fraction with the most separated clustering pattern when samples from the different groups were compared for differences. This means that the first extraction could contain more metabolites that reflect the metabolic change by oral administration of valproic acid than any other extractions. The cluster patterns by PLS-DA score plots, obtained from the urine extraction and GC-MS analysis, agreed with the change of hepatotoxicity indicator, the plasma level of α-GST.
Plasma α-GST profiles after a single dose of valproic acid were nearly zero and not significantly different in the control and 20-mg/kg/d groups. This means that there was no sign of hepatic damage with the low dose (20 mg/kg/d). But α-GST profiles increased significantly and rapidly in the 100- and 500-mg/kg/d groups. This result indicates that some hepatic injury occurred with doses of 100 and 500 mg/kg/d. This tendency was continued to the fifth day of multiple dosing (Figure 4). The metabolic changes shown by cluster patterns in PLS-DA score plots had patterns similar to the changes in plasma α-GST levels. The clusters with control and 20-mg/kg/d groups were not separated. But the cluster for 100 mg/kg was separated and that for 500 mg/kg was more clearly separated from control and 20-mg/kg/d groups in the first day of dosing. In fifth day after dosing, the pattern of clusters became clearer. The clusters of the control and 20-mg/kg/d groups were completely in same position but clearly separated from those of the 100- and 500-mg/kg/d groups. Those results indicate that a metabolic change occurred at 100 and 500 mg/kg/d. Aspartate aminotransferase (AST), alanine aminotransferase (ALT), blood urea nitrogen, creatinine, creatinine phosphokinase, albumin, glucose, and α-GST, which are used as markers for liver, kidney, and muscle toxicity, were also measured to check toxic effects in the oral administration of valproic acid. Among those parameters, only plasma levels of α-GST increased in a dose-dependent manner.
AST and ALT are well-known markers for liver toxicity, but it has been reported that their levels are highly variable among animals because of variable hemolysis, so those were not adequate for evaluation of hepatotoxicity in the 14-day intraperitoneal treatment of valproic acid. 10 Additionally, plasma level of α-GST is a more sensitive and earlier biomarker of hepatocyte injury than is the release of AST and ALT. 16,31-33 Therefore it could be concluded that metabolic change was especially related to hepatotoxicity.
From those results we suggest that metabolic change from the oral administration valproic acid was easily monitored with the pattern change of clusters in PLS-DA, and this change was closely related to hepatotoxicity.
Using nontargeted metabolic profiling, we were able to find a metabolite biomarker candidate that could be a major factor of metabolic change observed in PLS-DA score plots by comparing mass spectra in previously published report. 25 This candidate seemed to be a member of 2′-deoxyguanosine family because it had common characteristic fragmentations for 2′-deoxynucleoside. 25 However it was not possible to identify this metabolite even though we tried to confirm the mass spectrum of this compound with standard material because the mass spectrum from urine matrix was not clear enough to match with standard spectra. Moreover, the mass pattern was common for 2′-deoxynucleoside and was not specific for a certain nucleoside. Therefore, we screened the urinary levels of all nucleosides we quantified, including 5 2′-deoxynucleoside. Among the 14 nucleosides we quantified, only the urinary level of 8-OHdG changed in a dose-dependent manner (Figure 8), like the change of plasma α-GST level. So we confirmed that 8-OHdG is a major factor in metabolic change after valproic acid oral administration and could be a marker for hepatotoxicity of valproic acid. We are not the first to identify 8-OHdG as a novel biomarker; however, this is the first report of its presence in urine in response to valproic acid hepatotoxicity. 8-OHdG has previously been reported as a biomarker for DNA oxidative damage, 34,35 and one study reported that the serum level of 8-OHdG was remarkably increased in children on valproic acid monotherapy. 2
Although we were able to identify 1 factor (8-OHdG) for metabolic change and hepatotoxicity, it was very difficult to determine other biomarkers from loading plots. Most of the mass fragmentations (m/z values) detected from GC-MS in this study were modified by derivatization from MSTFA. All metabolome and chemical compounds in databases designate only nonmodified molecular weight, so the m/z values we searched for from loading plots could not be matched with the molecular weight in available databases. Therefore, we planned to monitor specific endogenous metabolomes whose metabolism has been suggested to be affected by the administration of valproic acid and whose metabolic change has been suggested to be related to the toxic effect using targeted metabolic profiling. The metabolomes we monitored by targeted metabolic profiling were acylcarnitines. Carnitine deficiency has been shown to be involved in the hepatotoxicity of valproic acid, 30,36,37 and the ratio of short-chain acylcarnitine/total acid-soluble acylcarnitine was increased in the hepatotoxicity induced by valproic acid. 29 The simple and useful quantitative assay using electrospray LC-MS/MS, which can cover short- to long-chain acylcarnitines, was previously developed in our lab 23 ; therefore, we used this method to confirm the change in the urinary level of acylcarnitines. A change in the urinary excretion profile was detected only in the short- to medium-chain acylcarnitines, hexanoylcarnitine and octanoylcarnitine. This result agrees with previous findings that the ratio of short-chain acylcarnitine/total acid soluble acylcarnitine is increased, but the long-chain acylcarnitine content is unchanged in plasma. 28 When we compared the 2 acylcarnitines detected in our study, the change of urinary excretion for octanoylcarnitine agreed with the change in plasma α-GST level and cluster patterns in PLS-DA score plots according to dose. The significant change in the urinary excretion profile of hexanoylcarnitine during the early phase of dosing appeared only in the samples from the 500-mg/kg/d group; however, a significant change in octanoylcarnitine profile was observed from the first day of dosing in both the 100- and 500-mg/kg/d groups. From these results, it might be suggested that hepatotoxicity induced by valproic acid could be predicted by monitoring urinary excretion of acylcarnitines, especially octanoylcarnitine. Additionally, we propose that urinary biomarkers should replace plasma biomarkers, because urinary biomarkers are just as sensitive in indicating hepatotoxicity but urine is easier to collect than plasma.
Conclusion
We developed a nontargeted metabolic profiling method to evaluate the hepatotoxicity of valproic acid using GC-MS with a noninvasive biological sample, urine. We also demonstrated proof-of-concept that the metabolomic approach to GC-MS has great potential for predicting valproic acid–induced hepatotoxicity and discovering novel biomarkers of toxicity.
Footnotes
Acknowledgments
This work was supported by a grant from the Korea Food & Drug Administration in 2006 (06132KFDA388), Ministry of Education, Science and Technology (MEST), Korea Science and Engineering Foundation (KOSEF) and the Korea Institute of Science and Technology.