
Abstract
Microphthalmia transcription factor (MITF) is a master transcription factor expressed in melanocytes, essential for melanocyte survival, differentiation, and pigment formation, and is a key oncogenic factor in melanoma initiation, migration, and treatment resistance. Although identified as an important therapeutic target for melanoma, clinical inhibitors directly targeting the MITF protein are not available. Based on the functional state of MITF, we have designed an MITF dimerization-based AlphaScreen (MIDAS) assay that sensitively and specifically mirrors the dimerization of MITF in vitro. This assay is further exploited for identification of the MITF dimer disruptor for high-throughput screening. A pilot screen against a library of 1280 pharmacologically active compounds indicates that the MIDAS assay performance exhibits exceptional results with a Z′ factor of 0.81 and a signal-to-background (S/B) ratio of 3.92 while identifying initial hit compounds that yield an ability to disrupt MITF-DNA interaction. The results presented demonstrate that the MIDAS assay is ready to screen large chemical libraries in order to discover novel modulators of MITF for potential melanoma treatment.
Introduction
Malignant melanoma is one of the most aggressive and treatment-resistant cancers found in human disease. 1 It arises from melanocytes, specialized pigment cells that synthesize melanin and are responsible for skin color. Approximately 212,000 new cases of melanoma are diagnosed annually worldwide, resulting in 65,000 melanoma-related deaths, with dramatically increased incidence over the past several decades in the United States.2,3 When diagnosed early, more than 80% of cases can be successfully treated through surgical resection. However, metastatic malignant melanoma is resistant to currently available treatments with a median survival of 6–12 months, and accounts for 80% of skin cancer deaths. 4
Microphthalmia transcription factor (MITF) resides at the mi locus (chromosome 3) in human. MITF gene encodes several isoforms, including MITF-M, MITF-H, MITF-A, MITF-B, MITF-C, MITF-D, and MITF-E.5–8 MITF-A, MITF-H, and MITF-D are reported to be important for retinal pigment epithelium (RPE) development. 9 MITF-H is expressed in cardiomyocytes and involved in cardiac stress response. 10 Isoform MITF-M, which is the most studied, is exclusively expressed in melanocyte. MITF-M (hereby as MITF) is a master regulatory transcription factor for the melanocyte lineage and plays a central role in melanocyte development, differentiation, migration, and survival.11–13 MITF directly regulates the expression of many genes critical for melanocyte function, including pigmentation, and melanocyte cell cycle progression and differentiation. 14
During recent years, the oncogenic role of MITF in melanoma has been extensively studied. Amplified MITF has been found in 20% of melanoma and identified as the lineage survival oncogene in malignant melanoma. 15 Mutation of MITF defective in SUMO-related degradation is found in genetically enriched patients with melanoma and predisposes them by a fivefold higher risk to developing melanoma and renal carcinoma.16,17 Rebound of MITF expression is found in melanoma relapse patients and drives the resistance to MAPK pathway inhibition. 18 In addition, the constant expression of MITF is involved in evading conventional chemotherapy.14,19
Thus, MITF is regarded as a putative therapeutic target for melanoma, from studies in human cell lines and several murine melanoma models.12,20–22 Introducing dominant-negative MITF (DN-MITF) into human melanoma cell lines inhibits cell proliferation and enhances sensitivity to chemotherapeutic agents. 15 The knocking-down MITF upstream regulator TYRO3 suppresses MITF expression and further inhibits tumorigenesis in mouse model. 22 Suppression of USP13, the de-ubiquitination enzyme that stabilizes and upregulates MITF protein, leads to dramatic loss of MITF protein and inhibits melanoma growth in soft agar and nude mice. 23 Impairment of the MITF protein level through shRNA, or a histone deacetylase (HDAC) inhibitor, blunts the cAMP-mediated resistance to MAPK pathway inhibitors. 18 However, despite extensive functional studies, direct modulation of MITF with pharmacologic compounds remains challenging, mainly due to the lack of a defined mechanism for inhibition.
The core dimerization region of MITF is composed of a basic helix–loop–helix–leucine zipper (bHLH-LZ) region that folds into a helical dimer for binding DNA.24–26 The bHLH-LZ region is thus shared in all MITF isoforms. 7 Many MITF loss-of-function mutations in diseases are found in this bHLH-LZ region.27–31 Therefore, targeting the dimerization of MITF may provide a unique and efficient method to control for the overexpression of MITF involved in the progression of melanoma initiation, migration, and relapse.
Presented here is a method developed to allow for monitoring the dimerization of MITF through an AlphaScreen reaction in a sensitive and robust manner. This has been optimized for high-throughput screening (HTS) and tested against the LOPAC1280 library (Library of Pharmacologically Active Compounds; 1280 compounds) to identify MITF dimer disruptors. We show that the hit compounds disrupting MITF dimerization suppress the DNA-interacting ability of MITF, providing a novel and effective approach for exploring MITF inhibitors with the potential to serve a role in melanoma treatment.
Materials and Methods
Proteins
Human MITF (residues 199–288) was constructed with an N-terminal 6xHis-tag with a tobacco etch virus (TEV) protease cleavage site (denoted as tev) in a pHisTEV vector and maltose binding protein (MBP) was fused before tev to increase the stability of MITF. 6xHis-MBP-tev-MITF (WT, R259stop, and Del217R, denoted as His-MITF, His-MITF_R259stop, and His-MITF_Del217R separately) was expressed in the bacterial strain BL21 (DE3) at 16 °C for 20 h and purified to homogeneity with a Ni-HiTrap affinity column. Further purification was performed through a size exclusion S200 column (GE Healthcare, Piscataway, NJ). Biotin-tagged MITF (denoted as Biotin-MITF) was obtained by TEV cleaving 6xHis-MBP-tev-CGGMITF that contains a cysteine at the N-terminal of MITF. The purification of 6xHis-MBP-tev-CGGMITF was done using the same method as purifying 6xHis-MBP-tev-MITF mentioned above. Following protease cleavage by TEV overnight, the nontagged CGGMITF was further purified through a HiTrap SP Sepharose column and size exclusion S75 column (GE Healthcare). EZ-Link Iodoacetyl-PEG2-Biotin (Thermo Scientific, Rockford, IL) was used to label the CGGMITF following the protocol indicated.
MITF Dimerization-Based AlphaScreen Assay Development and Characterization
The AlphaScreen histidine (nickel chelate) detection kit containing Ni-chelate acceptor beads and streptavidin donor beads was purchased from PerkinElmer (Waltham, MA).
All experiments were set up in 20 μL reaction volume in Optiplate-384HS plates (PerkinElmer) under green light conditions at room temperature. The reaction buffer contains 50 mM HEPES (pH 7.4), 250 mM NaCl, 0.1% Tween, and 0.1% bovine serum albumin (BSA). The AlphaScreen luminescence was read on a PerkinElmer EnVision 2104.
To optimize the suitable concentration of His-MITF and Biotin-MITF, cross-titration between these two proteins was performed, respectively (His-MITF [80 nM]—gradient Biotin-MITF [0–160 nM] titration; Biotin-MITF [80 nM]—gradient His-MITF [0–320 nM] titration). For both titrations, 5 μL of His-MITF was first incubated with AlphaScreen acceptor beads (chelated with nickel, final concentration 10 μg/mL) for 15 min. Five microliters of Biotin-MITF and 5 μL of AlphaScreen donor beads (conjugated with streptavidin, final concentration 10 μg/mL) were then added to the well. After adequate shaking by the MixMate (Eppendorf) with 1500 rpm for 2 min, the plates were incubated in the dark for 2 h before reading on a PerkinElmer EnVision 2104 using the AlphaScreen detection technology setup (680-nm excitation and 520-620 nm emission).
For the nontagged MITF titration, the gradient nontagged MITF/BSA (0–1280 nM) was incubated with His-MITF (80 nM) and AlphaScreen acceptor beads (final concentration 10 μg/mL) overnight before adding Biotin-MITF (80 nM) and AlphaScreen donor beads (final concentration 10 μg/mL).
For His-MITF WT/R259stop/Del217R—Biotin-MITF assay, a gradient concentration of His-MITF WT/R259stop/Del217R (0–250 nM) was implemented and incubated with AlphaScreen acceptor beads (final concentration 10 μg/mL) overnight before adding Biotin-MITF (80 nM) and AlphaScreen donor beads (final concentration 10 μg/mL).
Protocol for 384-Well Plate Assay
Pre-HTS experiments were set up in triplicate. First, His-MITF protein (final concentration 80 nM) and AlphaScreen acceptor beads (final concentration 10 μg/mL) were dispensed into the plate using the Aurora Discovery FRD (Beckman Coulter, Indianapolis, IN). One hundred nanoliters of test compounds (final concentration of ~15 μM, 0.5 % DMSO) were pinned into the plates using the Beckman Biomek NXP (Beckman Coulter), followed by incubation at 4 °C overnight. Then, Biotin-MITF (final concentration of 80 nM) and the AlphaScreen donor beads (final concentration of 10 μg/mL) were dispensed into the plate using the Aurora Discovery FRD. Plates were incubated for 2 h before reading on a PerkinElmer EnVision 2104 using the HTS AlphaScreen modality reading at a height of 0 mm, exciting for 0.04 s with an emission time of 0.09 s per well with cross talk optimization corrections applied.
Compound Library
The compounds tested in the assay validation stage were from the Sigma LOPAC1280 library containing 1280 proven pharmacologically active compounds. All data were normalized on a per-plate basis to their individual plate controls (N = 12 per plate). The percent activation for each compound was calculated as shown in the equation below, where Test Compound is defined as wells containing His-MITF, Ni-chelate AlphaScreen acceptor beads, streptavidin-conjugated AlphaScreen donor beads, and Biotin-MITF in the presence of the test compound. Positive Control is defined as wells containing the same formulation, but with the exception that nontagged MITF is used at 1 μM in place of the compounds. Low Control wells again are the same, but contain 0.5% DMSO.
% Activation = 100 × [1 – (Test Compound – Median Positive Control)/(Median Low Control – Median Positive Control)]
Since each compound was represented three times, we also calculated its average percent activity. The AlphaScreen compound concentration–response curve (CRC) assay was run under identical conditions to the HTS version in triplicate using a 10 mM source starting concentration and threefold serial dilutions for 10 points. The final assay compound concentrations were 15 μM at the highest dilution, progressing downward accordingly.
Assay Performance
To monitor assay sensitivity and evaluate the robustness of this assay, signal-to-background (S/B) ratios and the Z′ factor were calculated using the equations previously described. 32
Data Analyses
All control EC50 values were calculated by nonlinear regression analysis (sigmoidal dose–response with variable slope) using Prism software (GraphPad Software, Inc., San Diego, CA). Data analysis for the LOPAC1280 compound library was performed using internal informatics tools and Symyx Assay Explorer version 3.2 (Symyx Technologies, Inc., San Diego, CA). For CRC analysis involving the test compounds, we imported the data into the Scripps in-house database that allows ease of data handling for large numbers of compounds. Using database tools, percent activation was plotted against compound concentration. A four-parameter equation describing a sigmoidal dose–response curve was then fitted with an adjustable baseline using Assay Explorer software (Symyx Technologies). The reported EC50 values were generated from fitted curves by solving for the X-intercept value at the 50% inhibition level of the Y-intercept value. In cases where the highest concentration tested (i.e., 15 μM) did not result in greater than 50% inhibition, the EC50 was determined manually and labeled as greater than 15 μM.
Real-Time Kinetic Binding Assay
The interaction between 5′-biotinylated M-box DNA (biotin-CAGTCATGTGCT [sense]; AGCACATGACTG [antisense]) and HisMBP-MITF (6xHis-MBP-tev-MITF_WT) was tested using the ForteBio Octet Red system (ForteBio, Inc., Menlo Park, CA). The 5′-biotinylated M-box DNA was immobilized onto streptavidin biosensors (ForteBio), and the association (0–180 s) and dissociation (180–420 s) of the DNA molecule to HisMBP-MITF was monitored in binding buffer containing 1 × phosphate-buffered saline (PBS), 0.01% BSA, 0.002% Tween, and 1 mM MgCl2. Hits from the pilot screen LOPAC (P2738, M7277, and D5564) were incubated with HisMBP-MITF for 8 h with a final concentration of 50 μM before the measurement.
Results and Discussion
General Strategy: Developing the MIDAS Assay to Monitor the Dimerization of MITF
To monitor the dimerization of MITF, an AlphaScreen assay was designed, which includes a His-MITF that is recognized by the AlphaScreen acceptor bead and Biotin-MITF that is recognized by the AlphaScreen donor beads ( Fig. 1A ). To determine the optimal reagent concentrations, an initial assay was carried out varying His-MITF and Biotin-MITF simultaneously from 0 to 320 nM using 10 μg/mL AlphaScreen acceptor beads and 10 μg/mL AlphaScreen donor beads ( Fig. 1B ). The optimal concentrations achieved were 80 nM Biotin-MITF and 80 nM His-MITF, at which the S/B ratio reaches 343 (the background signal defined as the signal generated from 10 µg/mL AlphaScreen acceptor beads and donor beads only).
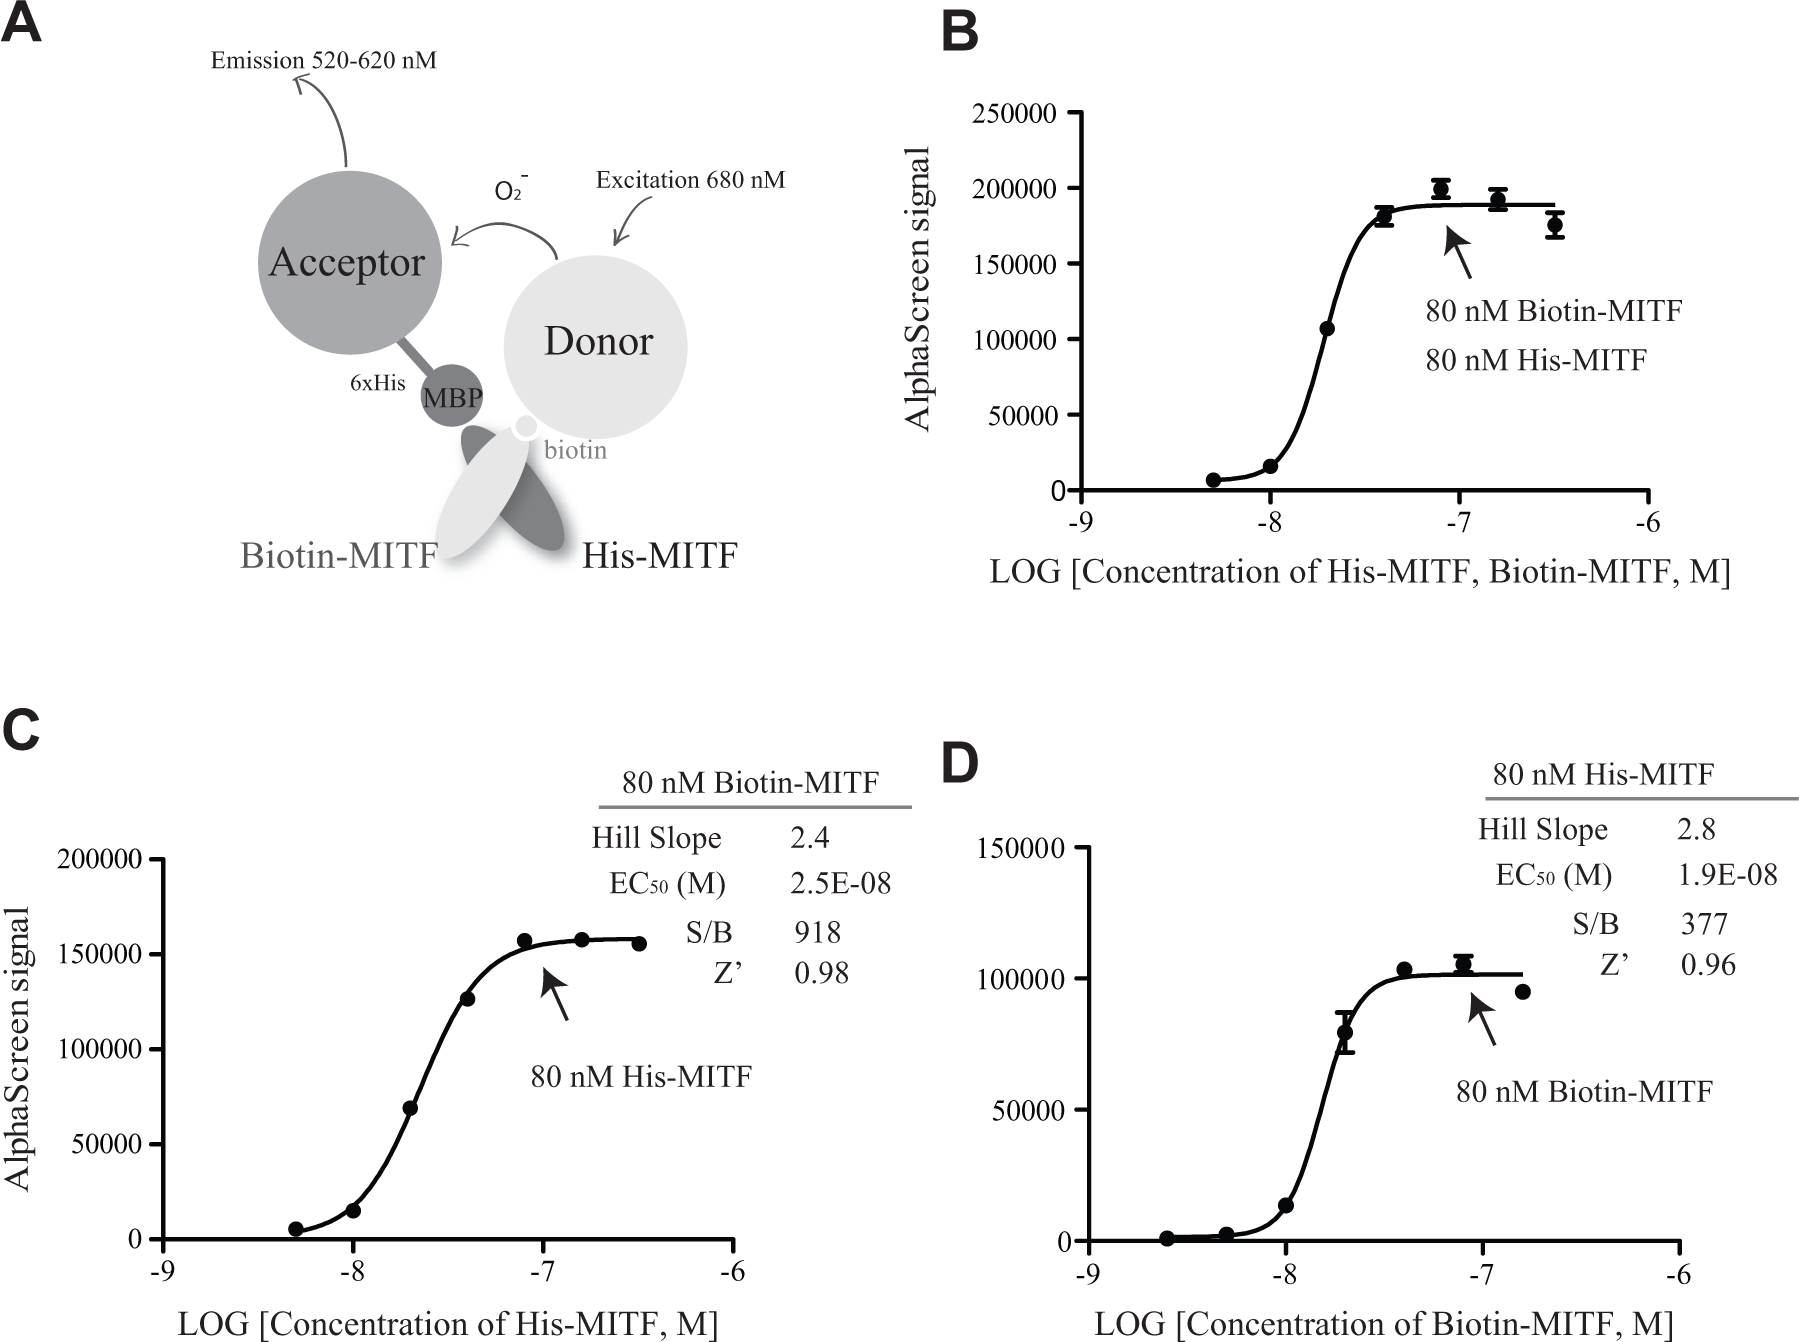
Design of MIDAS assay. (
We then further optimized the concentration of Biotin-MITF and His-MITF through cross-titration of these two proteins respectively. First, 80 nM Biotin-MITF was added in the presence of titrated His-MITF (0–320 nM), and the plateau was reached with 80 nM His-MITF ( Fig. 1C ). The EC50 value for the His-MITF was determined to be 25 nM, and the S/B and Z′ factor were 918 and 0.98, respectively ( Fig. 1C ). Then, 80 nM His-MITF was added in the presence of titrated Biotin-MITF (0–160 nM), the EC50 value for the Biotin-MITF was determined as 19 nM, and the S/B and Z′ factor were 377 and 0.96, respectively ( Fig. 1D ). Thus, under the conditions of 80 nM His-MITF, 80 nM Biotin-MITF, 10 μg/mL AlphaScreen acceptor beads, and 10 μg/mL AlphaScreen donor beads, the MITF dimerization-based AlphaScreen (MIDAS) assay is robust and sensitive.
Specificity of the MIDAS Assay to Mirror the State of MITF
To check the specificity of this MIDAS assay, a competition assay was performed with nontagged MITF. Varying concentrations of nontagged MITF (which contains neither His tag nor Biotin tag) was added into the assay system, under the optimal conditions described above. A gradient of BSA was used as control protein. Nontagged MITF specifically blocked the AlphaScreen signal in a dose-dependent manner with an IC50 of 26 nM, while BSA had no effect on the AlphaScreen signal ( Fig. 2A ), indicating the observed AlphaScreen signals are generated specifically by the dimer interaction between MITF monomers.
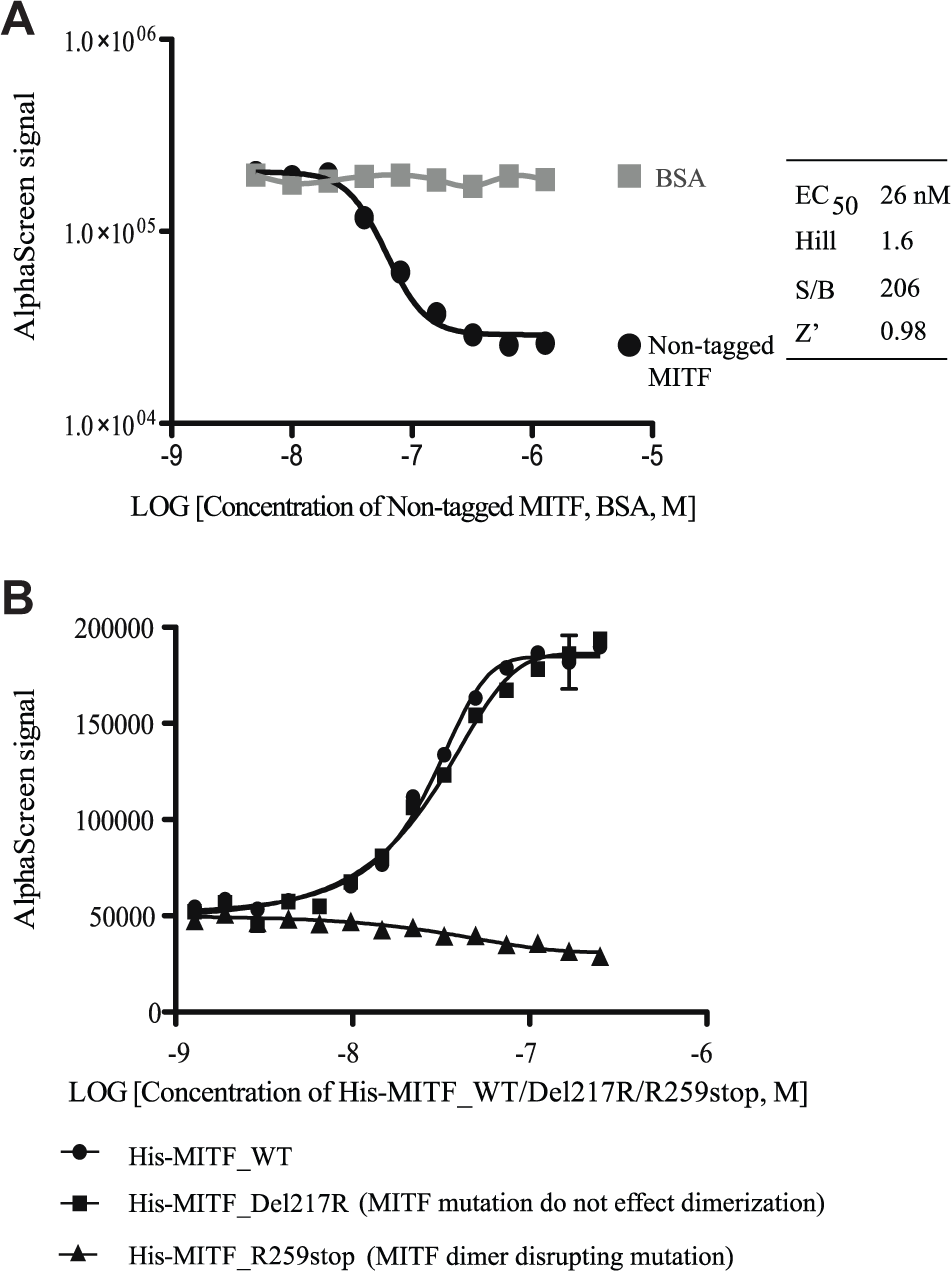
The MIDAS assay reflects the biological function of MITF dimerization. (
To further check the physiological relevance of this MIDAS assay to MITF function, two MITF loss-of-function mutations, R259stop and Del217R, were tested. Both mutations, found in human Waardenburg syndrome disease, led to the loss of MITF-DNA binding and loss of transcriptional activity of MITF. MITF_R259stop forces the loss of the leucine zipper and thus cannot form dimers;28,31 MITF_Del217R contains a mutation on the basic region and loses the DNA binding ability but maintains the dimer forming ability.24,27 Increasing concentrations of His-MITF (WT/Del217R/R259stop, from 0 to 250 nM) were titrated against the assay under optimal conditions. His-MITF_R259stop, the mutant that disrupted MITF dimerization, generated no AlphaScreen signal. In contrast, His-MITF_Del217R, which has no effect on the MITF dimer interface, generated AlphaScreen signal as the His-MITF_WT ( Fig. 2B ). These results demonstrate that the MIDAS assay mirrors the biological feature of MITF dimerization.
LOPAC Screen
To assess the performance of the MIDAS assay for HTS, a pilot screen against the Sigma LOPAC1280 library was performed under semiautomated HTS conditions. A 20 μL reaction under optimized conditions was used for the LOPAC screen in 384 plates. Each plate included low control wells with signal that was generated by adding DMSO (0.5%) in the system and positive control wells with signal that was generated by adding nontagged MITF with a final concentration of 1 μM. These control signals were utilized to calculate the Z′ factor and S/B, and assess plate homogeneity and reproducibility. LOPAC compounds were tested in triplicate at a final concentration of 15 μM (0.5% DMSO final). A total of 14 plates were used for this assay, comprising four separate triplicate compounds plates and two DMSO plates, one at the beginning and one at the end of the run. As indicated from the positive and low control scatterplots, the entire LOPAC MIDAS screen demonstrated an excellent Z′ factor (0.81 ± 0.29) and a stable S/B ratio of 3.92 ± 0.16 ( Fig. 3A ; here the background signal was defined by low control that used 1 μM nontagged MITF to block the dimerization-based AlphaScreen signal). Further, a scatterplot of replicate measurements yielded r2 = 0.971, indicating high reproducibility in assay data ( Fig. 3B ).
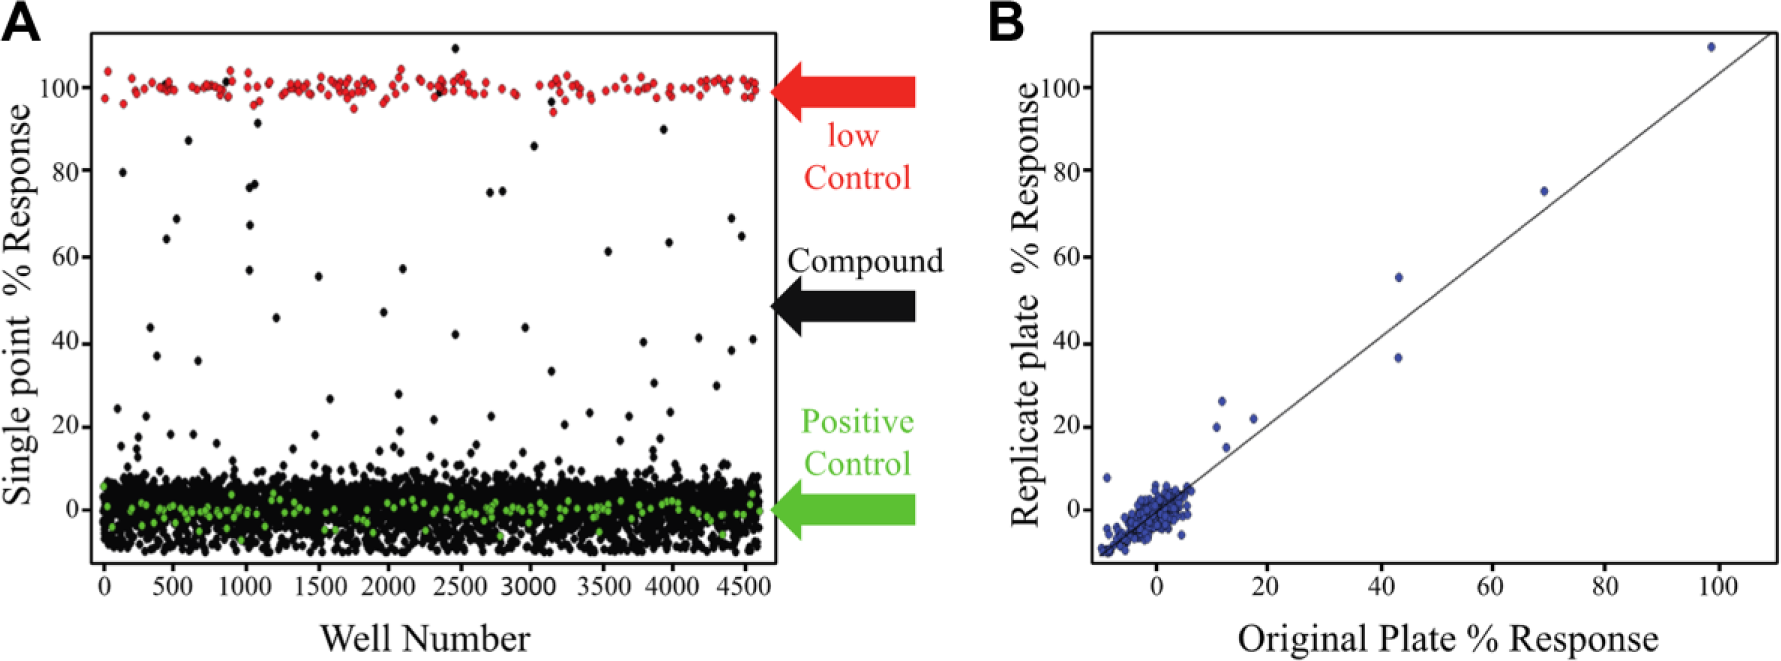
LOPAC screening of the MIDAS assay. (
Confirmation of Lead Hits in LOPAC Screen
An important parameter to assess for HTS readiness is the susceptibility of an assay to artifact, that is, compounds that interfere with the assay reagents or colored compounds that optically quench the AlphaScreen signal itself, resulting in a “false-positive” response. To exclude those false-positive hits, a counterscreen was carefully designed. This assay protocol uses a specific interaction between human LysRS and MSCp38, an interaction pair that we have previously characterized and is biologically independent of MITF. 33 This LysRS-MSCp38 AlphaScreen assay is similarly formatted as the MIDAS assay. A His-tagged full-length LysRS (hereafter denoted as His-LysRS) with Ni-chelated AlphaScreen acceptor beads was first incubated with the test compounds, followed by the sequential addition of the biotin-labeled MSC p38 and the streptavidin-conjugated AlphaScreen donor beads ( Fig. 4A ). This counterassay is also highly specific because nontag p38 specifically suppresses the signal in a dose-dependent manner ( Fig. 4B ). Compound that causes a decrease in the MIDAS signal and the LysRS-MSCp38 AlphaScreen signal would represent a nonspecific, false-positive hit, whereas those only showing an effect on the MIDAS signal are potential true hits.
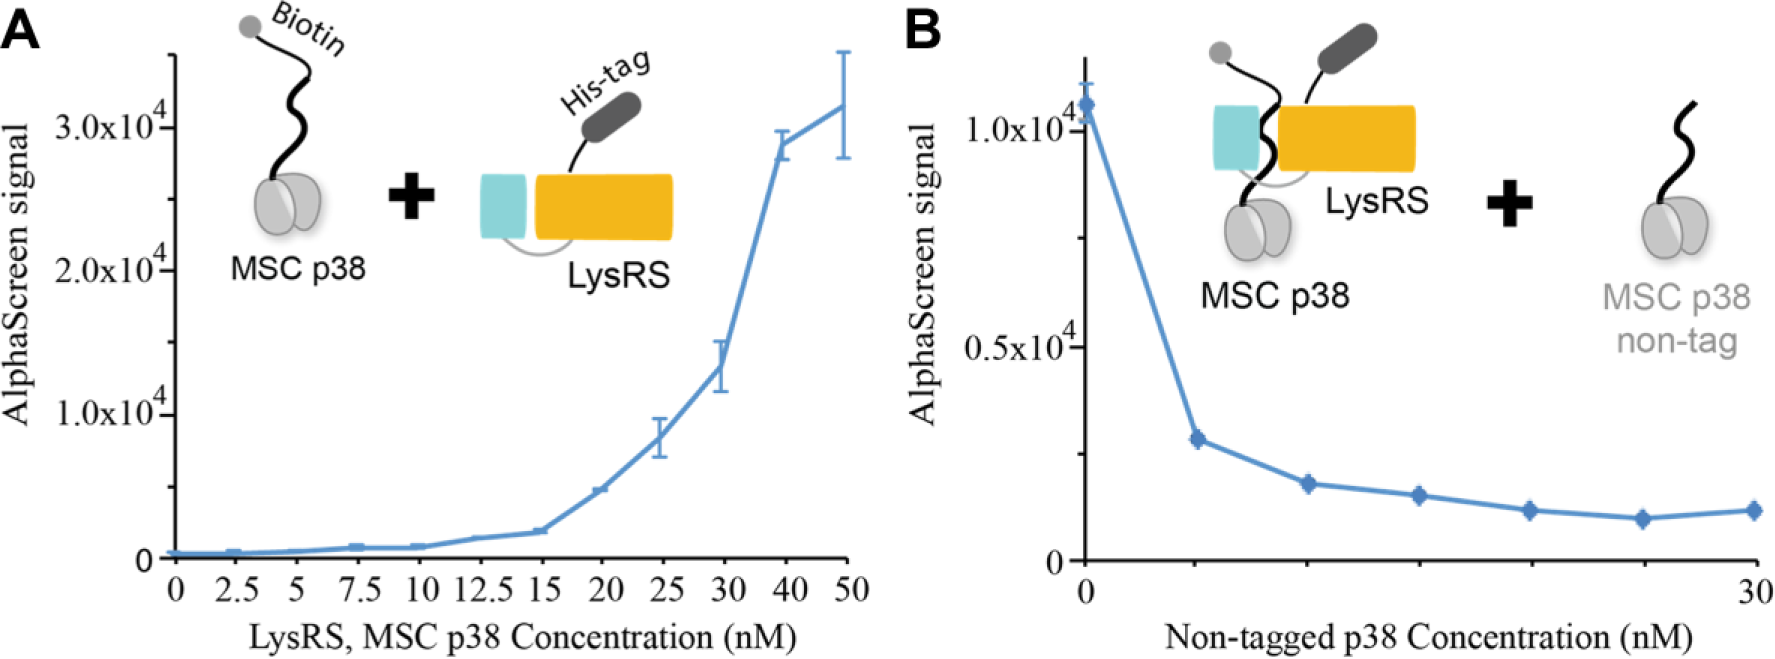
LysRS-MSCp38 interaction-based counterscreen. (
Following this criterion, three hit compounds were discovered, including P2738, D5564, and D7277 ( Fig. 5A ). These compounds significantly disrupted the MIDAS signal to the basal level with no effect on the LysRS-MSCp38 ( Fig. 5A ). Titration of these compounds indicated that they disrupted the MITF dimerization in a dose-dependent manner with an EC50 around 1 μM ( Fig. 5A , B ). We further measure the ability of these compounds to disrupt MITF-DNA binding through real-time binding assay. Compounds D5564 and M7277 decreased the binding ability of MITF to sensor-conjugated M-box DNA, while compound P2738 totally disrupted the DNA binding ability ( Fig. 5C ), confirming the true efficacy of these compounds in inhibiting MITF activity.
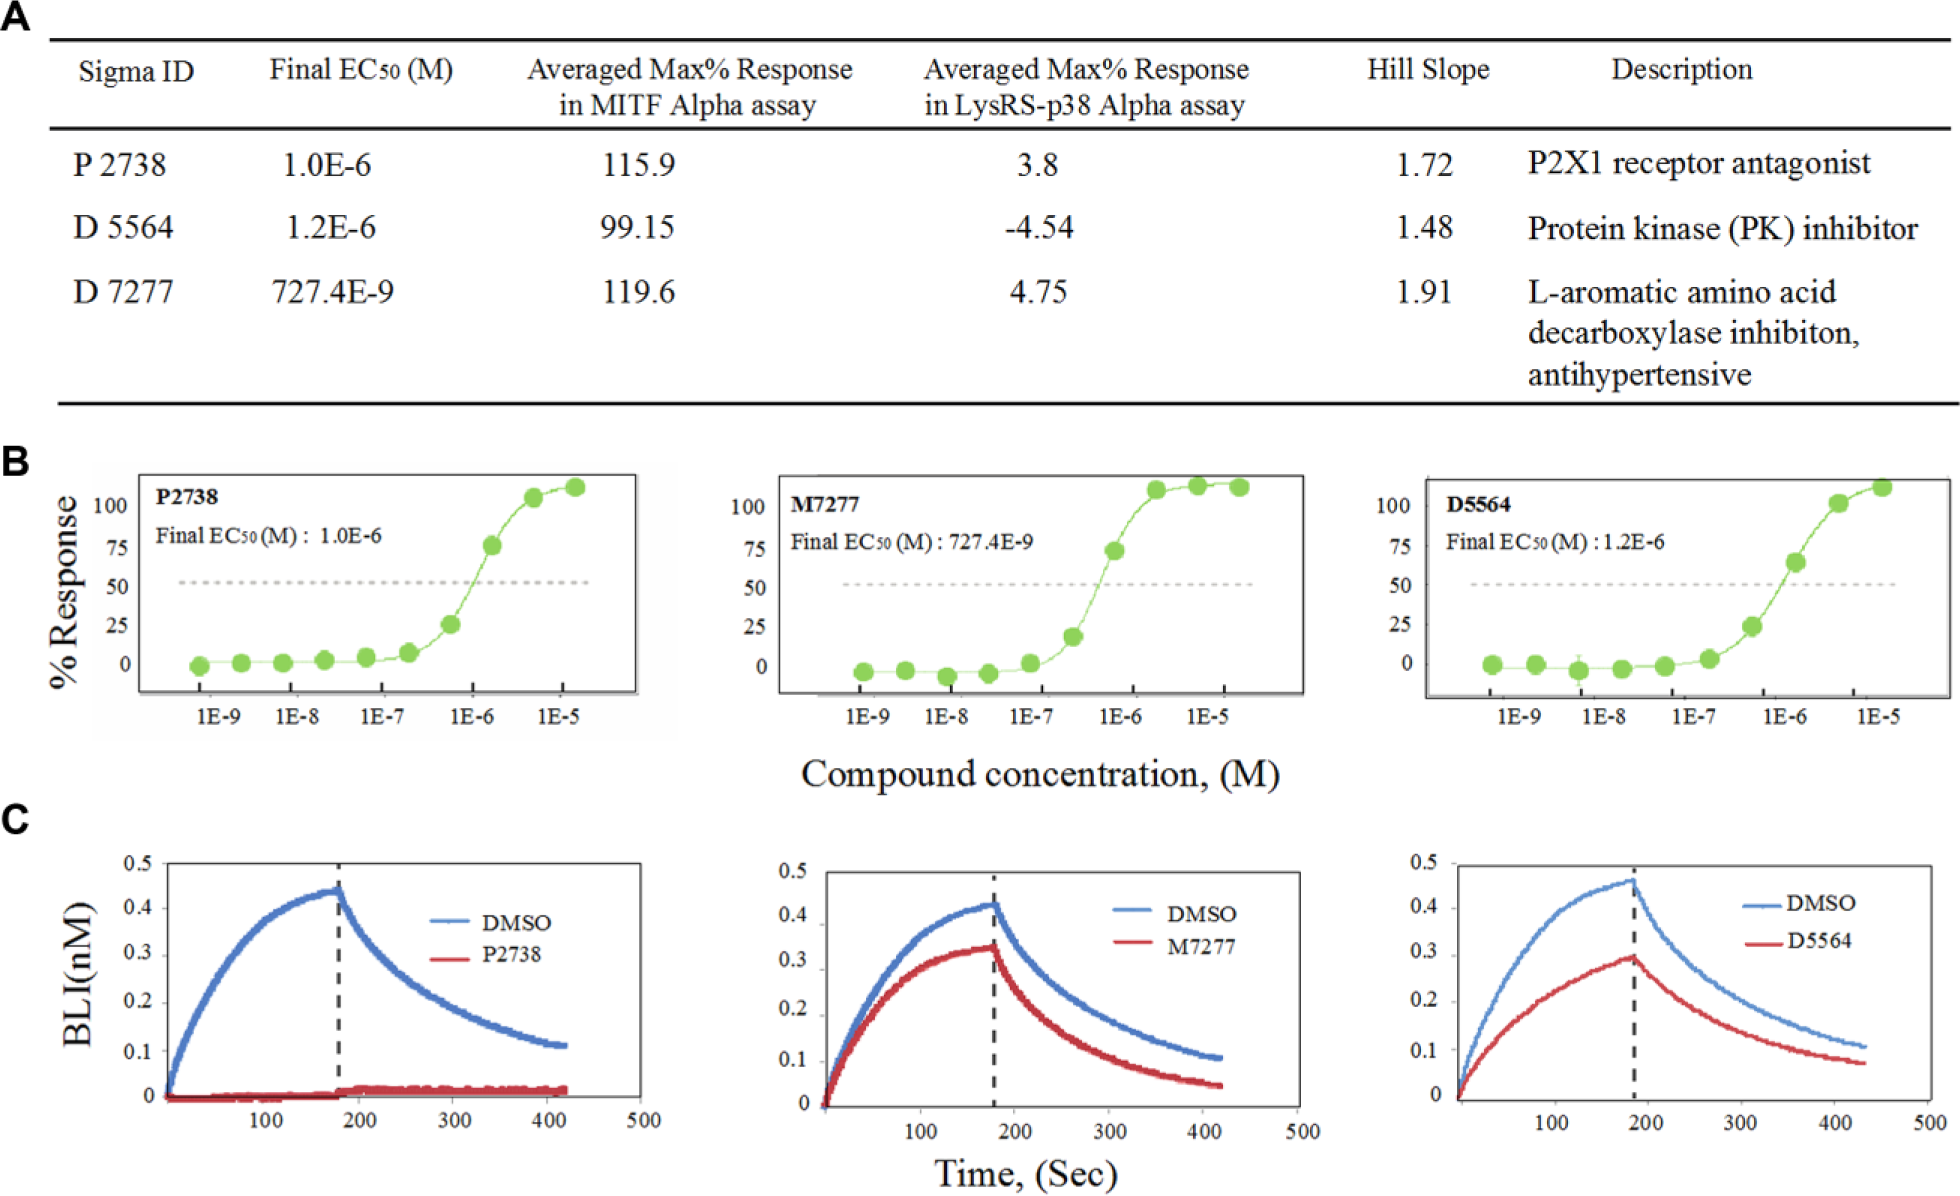
Confirmation of initial hits from LOPAC screening. (
Discussion
Although people have extensively studied the essential oncogenic role of MITF and identified MITF as an important putative therapeutic target for melanoma, clinical inhibitors directly targeting the MITF protein are not available.6,15–17 Previous studies have attempted to identify MITF inhibitors through inhibition of firefly luciferase generation under the promoter of the MITF target gene TRPM-1. 34 The screening of this TRMP-1-Luc reporter yielded one hit that suppresses MITF transcriptional ability at a micromolar concentration. However, no clear mechanism of the compound action was defined, and its ability to kill melanoma cell line was limited. 34 Here, we propose a direct mechanism to inhibit MITF through inhibition of its dimerization. This established HTS-compatible assay allows for the identification of small-molecule compounds that modulate the MITF dimerization using AlphaScreen technology—the MIDAS assay. We have demonstrated that the MIDAS assay is robust and sensitive with a Z′ factor of 0.81. Screening with this assay and its counterscreen against the Sigma LOPAC1280 library has identified compounds with 0.727–1.2 µM IC50 that specifically disrupt MITF dimer formation, and promote inhibition of MITF to bind its target DNA. These results support that more novel and potent pharmacores can be identified from large chemical libraries, and the developed MIDAS assay is ready to screen these libraries to discover selective modulators of MITF for potential melanoma treatment.
Footnotes
Acknowledgements
The authors would like to thank David E. Fisher for instructions of compounds analysis, and Brandon Young and Mariana Figuera-Losada for technical assistance.
Author Contributions
JW, TS, ER, PH, and MG designed research. JW, PF, and PC performed the research. JW, PF, PC, TS, PH, and MG analyzed the data. JW, PC, TS, LS, and MG wrote the paper.
Declaration of Conflicting Interests
The authors declared no potential conflicts of interest with respect to the research, authorship, and/or publication of this article.
Funding
The authors disclosed receipt of the following financial support for the research, authorship, and/or publication of this article: This work was supported in part by grants R01GM100136, R01CA178315, and R01GM106134 and the PGA Women’s Cancer Association to MG, by a One Hundred Person Project of The Chinese Academy of Sciences, and by the State Key Laboratory of Bioorganic and Natural Products Chemistry and Chinese Academy of Sciences to JW.