
Abstract
Regulator of G protein signaling (RGS) proteins temporally regulate heterotrimeric G protein signaling cascades elicited by G protein–coupled receptor activation and thus are essential for cell homeostasis. The dysregulation of RGS protein expression has been linked to several pathologies, spurring discovery efforts to identify small-molecule inhibitors of these proteins. Presented here are the results of a high-throughput screening (HTS) campaign targeting RGS17, an RGS protein reported to be inappropriately upregulated in several cancers. A screen of over 60,000 small molecules led to the identification of five hit compounds that inhibit the RGS17-Gαo protein-protein interaction. Chemical and biochemical characterization demonstrated that three of these hits inhibited the interaction through the decomposition of parent compound into reactive products under normal chemical library storage/usage conditions. Compound substructures susceptible to decomposition are reported and the decomposition process characterized, adding to the armamentarium of tools available to the screening field, allowing for the conservation of resources in follow-up efforts and more efficient identification of potentially decomposed compounds. Finally, analogues of one hit compound were tested, and the results establish the first ever structure-activity relationship (SAR) profile for a small-molecule inhibitor of RGS17.
Introduction
Activation of G protein–coupled receptor (GPCR) signaling pathways governs many cellular and physiological processes.1–4 These processes are mediated by both heterotrimeric guanine nucleotide binding proteins (G proteins) and β-arrestins.2,5 Given the diverse array of signaling cascades governed by these receptors, GPCRs remain one of the most highly targeted sites of therapeutic intervention. 6
Regulator of G protein signaling (RGS) proteins are a class of protein that temporally regulates the heterotrimeric G protein signaling cascades elicited by GPCR activation. Upon agonist binding to the receptor, the GPCR acts as a guanine nucleotide exchange factor and promotes the exchange of guanosine diphosphate (GDP) for guanosine triphosphate (GTP) at the active site of the Gα subunit. This results in the dissociation of the G protein heterotrimer (Gαβγ) into the active Gα subunit and the Gβγ heterodimer, both of which act as effectors for unique signaling cascades.3,4 RGS proteins bind the Gα-[GDP]-GTP transition state through a semi-conserved 120–amino acid sequence known as the RGS homology (RH) domain and act to accelerate the GTPase activity of Gαi/o and Gαq G proteins through stabilization of the transition state and promotion of hydrolysis of the γ phosphate of GTP, thus returning Gα to its GDP-bound inactive state, which promotes reassociation of the Gαβγ heterotrimer and terminates the G protein signaling cascade.7–9
Recently, RGS proteins have been implicated in a number of pathologies, both through their function as negative regulators of G protein signaling and through G protein–independent mechanisms.10–13 This has led to discovery efforts using high-throughput screening (HTS) to discover small-molecule inhibitors of these proteins, with some success.14–18 Yet targeting these proteins with small molecules is a relatively new endeavor, with the first small-molecule inhibitor of an RGS protein discovered only in 2007. 14 Therefore, there is limited knowledge with respect to characterization of small-molecule binding to these proteins and mechanism of small-molecule-mediated inhibition of the proteins.
To date, a commonality among many RGS small-molecule inhibitors is that they interact with cysteine residues located at allosteric sites with respect to the G protein binding interface.16,18–21 These critical cysteine residues tend to be solvent protected, and only recently have reports indicated a mechanism by which small-molecule inhibitors access and bind these cysteine residues. 21 Since, via this mechanism, a putative binding pocket has only recently been suggested, and since this mechanism of inhibitor binding has not been verified for many RGS proteins, investigation of lead compound structural analogues (in the absence of molecular modeling) remains the most informative strategy to elucidate compound substructures essential for small-molecule binding. Testing these lead compound analogues serves to establish a structure-activity relationship (SAR) profile that will be essential in the development of RGS protein–specific small-molecule inhibitors. However, due to the relative infancy of targeting RGS proteins with small molecules, only one report detailing the investigation of structural analogues of RGS inhibitors has been published to date. 22
As mentioned above, targeting RGS proteins through HTS has had some successes, with the identification of potent inhibitors of RGS4 and identification of lead compounds that demonstrate activity in several mouse models in vivo.16,23–25 Yet HTS is not without pitfalls, including identification of promiscuous small molecules that may interfere with a multitude of screening assays, as well as identification of false positives through instability of small molecules in library storage conditions.26–29 The subject of assay interfering compounds has been extensively published, and online computational tools exist to identify putative problematic substructures in this regard. 30 However, the subject of small-molecule integrity in screening libraries is much less discussed, perhaps due to these compounds being dismissed as false positives during lead molecule verification. A recent report by Olson et al. 31 detailed the identification of a chemical structure prone to instability in screening libraries. In addition, these authors found that this chemical structure was enriched in screening libraries. Therefore, it seems in the best interest of the field to identify compound structures prone to instability to prevent the misallocation of resources toward these chemical entities.
Here we present our results of an HTS campaign targeting the RGS protein RGS17, a protein that has been reported to be upregulated in lung, prostate, breast, and hepatocellular carcinomas. 10 Mechanistic investigation of RGS17 function in these pathologies indicated that RGS17 dysregulation was altering the Gαs/Gαi signaling balance in the cell through increased negative regulation of Gαi and promoting the increased transcription of several CRE-promoted oncogenes. 10 Knockdown of RGS17 was reported to inhibit the growth of lung, prostate, and hepatocellular carcinoma cell lines in culture and was reported to drastically reduce tumor progression in a mouse model in vivo, thus establishing this RGS protein as a promising therapeutic target. 10 After initial hit compound verification, five compounds were characterized for mechanism of inhibition (i.e., cysteine dependence). Three compounds were shown to lose activity when fresh stocks were prepared from commercial sources yet recovered activity over time, indicating instability of these compounds in chemical library storage conditions. In addition, to establish a SAR profile for targeting RGS17, analogues of one lead compound were investigated. Finally, the selectivity of the two remaining lead compounds and one compound analogue with respect to other RGS proteins was assessed.
Materials and Methods
Protein Purification
All proteins were purified as previously described.18,32 Concentration of active G protein was determined by GTPγ[ 35 S] binding as previously described. 18 Wild-type (WT) and mutant RGS protein activity was determined previously using a malachite green GTPase accelerating protein (GAP) activity assay (see below).18,32
AlphaScreen, Screening Campaign, and Dose Response
AlphaScreen (PerkinElmer, Waltham, MA) was used largely as previously described. 18 Screening was performed in 1536-well plates (Nunc, Rochester, NY) with final concentrations of each component being 10 nM each protein (RGS and G protein) and 10 ng/µL each bead. The National Cancer Institute (NCI) NExT Diversity Library was screened at a final compound concentration of 35.7 µM. Due to financial constraints, only 60,502 compounds were screened from this library, representing roughly 75% coverage of the 83,536-compound collection. Dose-response follow-up was performed in 384-well low-volume plates (Corning, Kennebunk, ME). Three-point dose-response assessment used compound final concentrations of 119 µM, 35.7 µM, and 11.9 µM. For 9-point dose-response assessment, compound final concentrations ranged from 100 µM to 31.6 nM following a half log dilution pattern. Counterscreening/assay interference control assay used the AlphaScreen TruHits assay (PerkinElmer) as previously described. 18 All plates were read on an EnVision plate reader (PerkinElmer), and all data were analyzed using GraphPad Prism 7 (GraphPad Software, La Jolla, CA).
AlphaScreen—Screening Data Positional Bias Corrective Analysis
During the screening campaign, it became apparent that systematic error in the screening process was resulting in positional effects in the plate ( Suppl. Fig. S1A,1B ). These positional effects were especially noted in edge wells (row A and column 1 of Suppl. Fig. S1A ), and potential dispenser bias was also noted (as seen in the upper half of Suppl. Fig. S1A ). This is not uncommon in screening campaigns using small-volume assays such as the AlphaScreen paradigm described here. Therefore, a B-score algorithm was used to correct for these positional effects.33,34 The positive controls (see below—first four columns of plate, 128 wells) were included in the B-score computation since these wells serve to more accurately compute the median uninhibited value. The negative controls (see below—last four columns of plate, 128 wells) were removed from the B-score computation as these low-value wells would skew the median value. To correct for positional bias in the negative controls, a B-score was computed on just the negative control section of the plate as well. Supplementary Figure S1C,1D depicts the results of the B-score correction with a secondary calculation to return values on the scale of the raw output. The B-score effectively eliminated the edge effects and as a result improved the plate Z factor ( Suppl. Fig. S1E,1F , before and after B-score correction, respectively; Z factor = 0.55 and 0.85, respectively). Use of the B-score correction did not introduce positional bias in hit identification, as the hits were relatively evenly distributed across the plate ( Suppl. Fig. S1G ). Therefore, B-score corrective calculations were used throughout the analysis and were implemented prior to calculation of each plate’s respective Z factor ( Suppl. Fig. S1H ).
AlphaScreen—Data Normalization and Curve-Fitting Analysis
AlphaScreen results are presented as a normalized alpha signal. For each RGS, the positive control condition was RGS + Gαo + AMF with no inhibitor and was set to 100% (where AMF is a mixture of NaF, MgCl2, AlCl3, and GDP used to promote the formation of a G protein – GDP – AlF4 transition state mimic, promoting the formation of the G protein–RGS interaction7,26,32). The negative control condition was RGS + Gαo with no AMF and was set to 0%. Compound results for each RGS were normalized with respect to the appropriate RGS. For compound concentration-response experiments, curves were fit using GraphPad Prism 7 using a log(inhibitor) vs. response – variable slope (four parameters) equation, with a constraint that the bottom of the curve must equal 0 (since data were normalized such that lack of a protein-protein interaction was 0%). Thus, the IC50 value represents the point halfway between the top of the curve and the 0% threshold. The 95% confidence interval (CI) values were calculated using the default asymmetrical (likelihood) method in GraphPad Prism 7. For RGS selectivity analysis, statistical significance was determined using one-way analysis of variance (ANOVA), with Holm-Sidak post hoc multiple-comparisons analysis.
Malachite Green Steady-State GTPase Assay
Malachite green assay was performed largely as described previously. 18 In brief, lead compounds were tested at final concentrations of 50 and 75 µM. Compounds were allowed to incubate with RGS17 for 30 min prior to the addition of Gαi1 (R178M, A326S) and GTP. The reaction was allowed to proceed for 75 min, then quenched with the addition of Developing Solution (50:12.5:1 malachite/molybdate/Tween-20). Reactions were allowed to develop for 50 min prior to read at 642 nm on a Biotek Synergy 2 plate reader (Biotek, Winooski, VT).
Thin-Layer Chromatography
Freshly prepared compound stocks and stocks that had incubated at room temperature (RT) for 28 days were spotted on Uniplate Silica Gel GHLF thin-layer chromatography (TLC) plates (Analtech, Newark, DE) and the plates were assessed for the appearance of new product bands. Compound IV was resolved using a mobile phase of 1:1 ethyl acetate/hexanes. Compounds I and V were resolved using a mobile phase of 1:2 ethyl acetate/hexanes. Bands were detected with UV radiation at 254 nm.
Thiol Reactivity Testing
Lead compounds and select analogue thiol reactivity was determined as previously described. 18 In short, 100 µM N-acetyl cysteine (NAC) was incubated with 100 µM lead compound or N-ethylmaleimide (NEM) (positive control) for 4 h at 37°C. Following incubation, 1 mM Ellman’s reagent, {5,5′[dithiobis(2-nitrobenzoic acid)]} (DTNB), was added and absorbance read at 412 nm using a Molecular Devices SpectraMax (Sunnyvale, CA) plate reader. Data were analyzed using GraphPad Prism 7 (GraphPad Software). Statistical significance was determined using one-way ANOVA, with Holm-Sidak post hoc multiple-comparisons analysis.
Detection of Compound Degradation Using High-Performance Liquid Chromatography
Briefly, an Agilent (Santa Clara, CA) 1200 Series Capillary high-performance liquid chromatography (HPLC) system with a photodiode array detector measuring absorbance at 202 and 280 nm was used. Then, 10 µL of sample was injected and separation was achieved using a Phenomenex (Torrance, CA) Luna C18 column (1 mm × 150 mm, 100 Å) and a mobile phase consisting of (A) 0.1% trifluoroacetic acid (v/v) in HPLC-grade water and (B) 0.1% trifluoracetic acid (v/v) in acetonitrile. A gradient was used as follows: 0 to 5 min, 5% B; 5 to 30 min, 5% to 50% B; 30 to 35 min, 50% to 80% B; 35 to 40 min, 80% B; 40 to 45 min, 80% to 5% B; and 45 to 60 min, 5% B at a flow rate of 50 µL/min.
Small Molecules
Compounds I and IV were obtained from ChemBridge Corporation (San Diego, CA). Compound V was obtained from Chemical Diversity (San Diego, CA). Compound II-7 was obtained from Key-Organics (Camelford, Cornwall, UK). Compounds II, II-1 to II-6, and III were obtained from Vitas-M Laboratory (Champaign, IL).
Results and Discussion
Identification of Lead Compounds
Roughly 60,000 compounds were screened from the NCI NExT Diversity Collection to identify inhibitors of the RGS17-Gαo protein-protein interaction. Each plate screened contained internal positive and negative controls to ensure assay robustness and data quality. Assay robustness was assessed via Z factor calculation. 35 Average Z factor throughout the screening campaign was calculated to be 0.68 ( Suppl. Fig. S1H ), indicating the assay was robust throughout the campaign.
A total of 131 compounds were identified as initial hits that inhibited the RGS17-Gαo interaction by 50% or greater at the screening concentration ( Suppl. Table SI ). The hit compound structures were first analyzed computationally, assessing the compound substructures for the presence of putative assay interfering moieties (PAINS). 26 This was accomplished through implementation of the open-source chemoinfomatics software RDKit and python script. It should be noted that an examination of the accuracy of RDKit for identification of PAINS in 2011 by Saubern et al. 36 determined that RDKit consistently undermatched or failed to match substructures compared to use of Sybyl Line Notation (SLN) (i.e., the method used in the original computational design). However, in 2015, Landrum 37 (RDKit) detailed that a reason for RDKit’s underperformance was likely a function of using the SMARTS notation and specifically the way that explicit hydrogens are handled using SMARTS. Landrum showed that by merging explicit hydrogens to the query filter, a filter that previously went unidentified would now be correctly identified. 37 Finally, Landrum noted that 391 of the 480 PAINS SMARTS notations contain an explicit hydrogen, and many of these would not generate expected matches without explicit hydrogens merged. Therefore, we included merging of explicit hydrogens to the query filter as part of our filtration script and tested this script against the same 10,000-compound reference set used and made available by Saubern et al. 36 in their original assessment of RDKit (for results, see Suppl. Table SII ). 38 Merging of explicit hydrogens to the query filter significantly improved the performance of substructure match identification for RDKit. The number of filters producing overmatching or undermatching remained consistent (although the filters producing the over/undermatch results changed), but more important, the number of filters producing equivalent matches increased from only 21 (31—no 3-pass filtration) to 115. 36 These results indicate that merging explicit hydrogens results in a filter identification rate of greater than 90% (compared to just 29% in the absence of merged hydrogens) and an equivalent filter identification rate of 75% (compared to just 14% in the absence of merged hydrogens). Thus, since the purpose of PAINS identification was for informatics purposes and not used as an exclusionary measure (see below), we used RDKit for PAINS identification.
Of the 131 initial hit compounds, only 21 were flagged as containing putative assay interfering structures. This prefiltration was not used as an exclusionary method to triage compounds from further characterization but rather as an informatics tool to identify those compounds that may cause assay interference and thus may indicate reactive substructures. Indeed, a recent investigation of publicly available screening data demonstrated that many compounds containing PAINS-flagged substructures did not exhibit a greater degree of assay promiscuity. 39 However, the original report outlying these substructure filters postulates that many PAINS compounds may not solely interfere with assay mechanics but rather that these compounds may be reactive, protein-modifying compounds. 26 For this reason, it was deemed prudent to identify the hit compounds that contain these flagged substructures while not excluding said compounds from initial characterization.
Therefore, the 131 hit compounds were then assessed via 3-point dose-response analysis to confirm hit compound activity and assess hits for AlphaScreen assay interference. Compounds were tested against both the protein-protein interaction and against a biotinylated glutathione S-transferase (GST) control assay.
This control assay (TruHits; PerkinElmer) uses a biotinylated GST construct that can conjugate to both the streptavidin donor bead and the anti-GST acceptor bead. This results in a robust interaction response despite a lower concentration of protein used (10 nM final for RGS and G protein, 300 pM final for biotinylated GST). 18 Use of this assay identifies compounds that interfere with the chemistry or readout of the AlphaScreen assay (i.e., color quenchers, singlet oxygen quenchers, biotin mimetics, etc.) and thus eliminates false positives of these mechanisms. In addition, the discrepancy in protein concentration is not an issue here as the compound concentration range remains constant, and indeed the control assay exhibits increased sensitivity since the protein concentration used is lower. Therefore, a compound that does not inhibit the control assay but does inhibit the RGS–G protein interaction can be deemed a true-positive hit.
For compounds to be selected for additional investigation, the hits had to demonstrate both 50% inhibition of the protein-protein interaction by a compound concentration of 100 µM and selectivity over the control assay. There were 36 compounds that met both criteria and were then investigated in a more complete concentration-response manner. These were tested in three trials, with compounds triaged after each trial based on potency. Of these 36, 16 compounds were tested in n = 3 ( Suppl. Fig. S2 and Suppl.Table SIII ). The five most potent compounds were selected for additional investigation ( Fig. 1 ). These five lead compounds were first tested in a secondary inhibition assay using a previously described malachite green steady-state GTPase paradigm. None of the compounds inhibited the GTPase activity of RGS17 in this assay (data not shown), but it should be noted that the malachite green assay uses 100- to 1000-fold more RGS protein and G protein than the AlphaScreen paradigm while maintaining comparable compound concentrations. Therefore, the apparent lack of inhibition in the GTPase assay is likely due to the large shift in protein concentration used and may not reflect lack of compound activity.
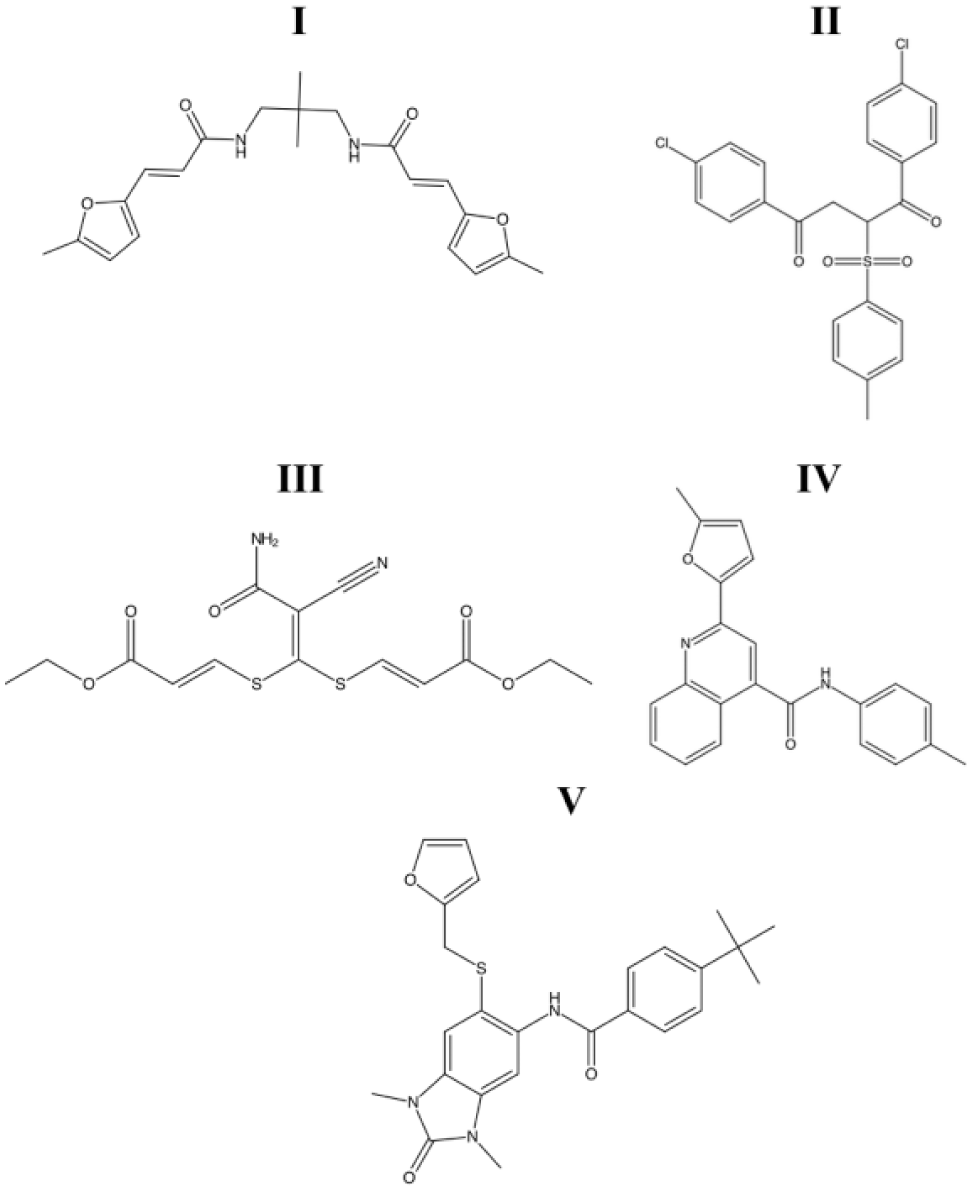
Structures of the five lead compounds selected for characterization based on initial follow-up. Compounds will be referred to in text by their respective numeric identifiers, I to V.
With lead compounds in hand, the structures were reassessed for assay-interfering moieties. Compounds I and III were flagged as containing putative PAINS structures, while compounds II, IV, and V did not. Therefore, compounds II, IV, and V represent the first small molecules identified by our lab that inhibit RGS17 and do not contain PAINS-flagged substructures.
Lead Compounds Inhibit through a Cysteine-Dependent Mechanism
Previous screening campaigns targeting both RGS4 and RGS17 have predominantly identified compounds that inhibit through interaction with cysteine residues, and use of mutant RGS proteins lacking cysteine residues results in a dramatic decrease in potency of the compounds.15–18,21 Therefore, the newly identified lead compounds were tested for their dependency on cysteine to inhibit RGS17 ( Fig. 2 ). All five lead compounds lost inhibitory activity when tested against a cysteine null mutant (RGS17 C117A). This indicates that these compounds impart inhibition of RGS17 through interaction with this cysteine residue, either through dependence on cysteine for proper binding coordination or via direct modification of the thiol. These results also suggest that the lead compounds bind RGS17 and not the G protein. The C117A mutation does not alter RGS17’s ability to bind to the G protein or alter RGS17’s GAP activity. 18 Therefore, if the lead compounds bound to the G protein to impart inhibition, one would expect that the compounds would disrupt the protein-protein interaction even when using RGS17 C117A. This is not the case, thereby suggesting that the compounds are binding RGS17. In addition, these data indicate that these lead molecules are inhibiting allosterically, as Cys 117 is not at the G protein interaction interface ( Fig. 2 ). This allosteric mechanism of inhibition is also a commonality among RGS protein inhibitors to date, and indeed no published RGS inhibitors bind at the G protein interaction interface.16,19–21 Interestingly, Cys 117 represents the cysteine residue in RGS17 that is highly conserved among many RGS proteins. For the RGS protein RGS4, this residue corresponds to Cys 95, which was the cysteine residue at the focal point of a recent conformational dynamics study that demonstrated a mechanism by which inhibitors might access this solvent-protected cysteine in RGS4 and identified a putative binding pocket at this site for RGS4. 21 Thus, the result that these lead compounds inhibit through interaction with Cys 117 in RGS17 may serve as indirect evidence that RGS17 exhibits similar conformational dynamics, which allow access to this solvent-protected cysteine residue. However, the investigation required to verify such a hypothesis (i.e., extensive molecular dynamics modeling and protein nuclear magnetic resonance [NMR]) was outside the scope of this work.
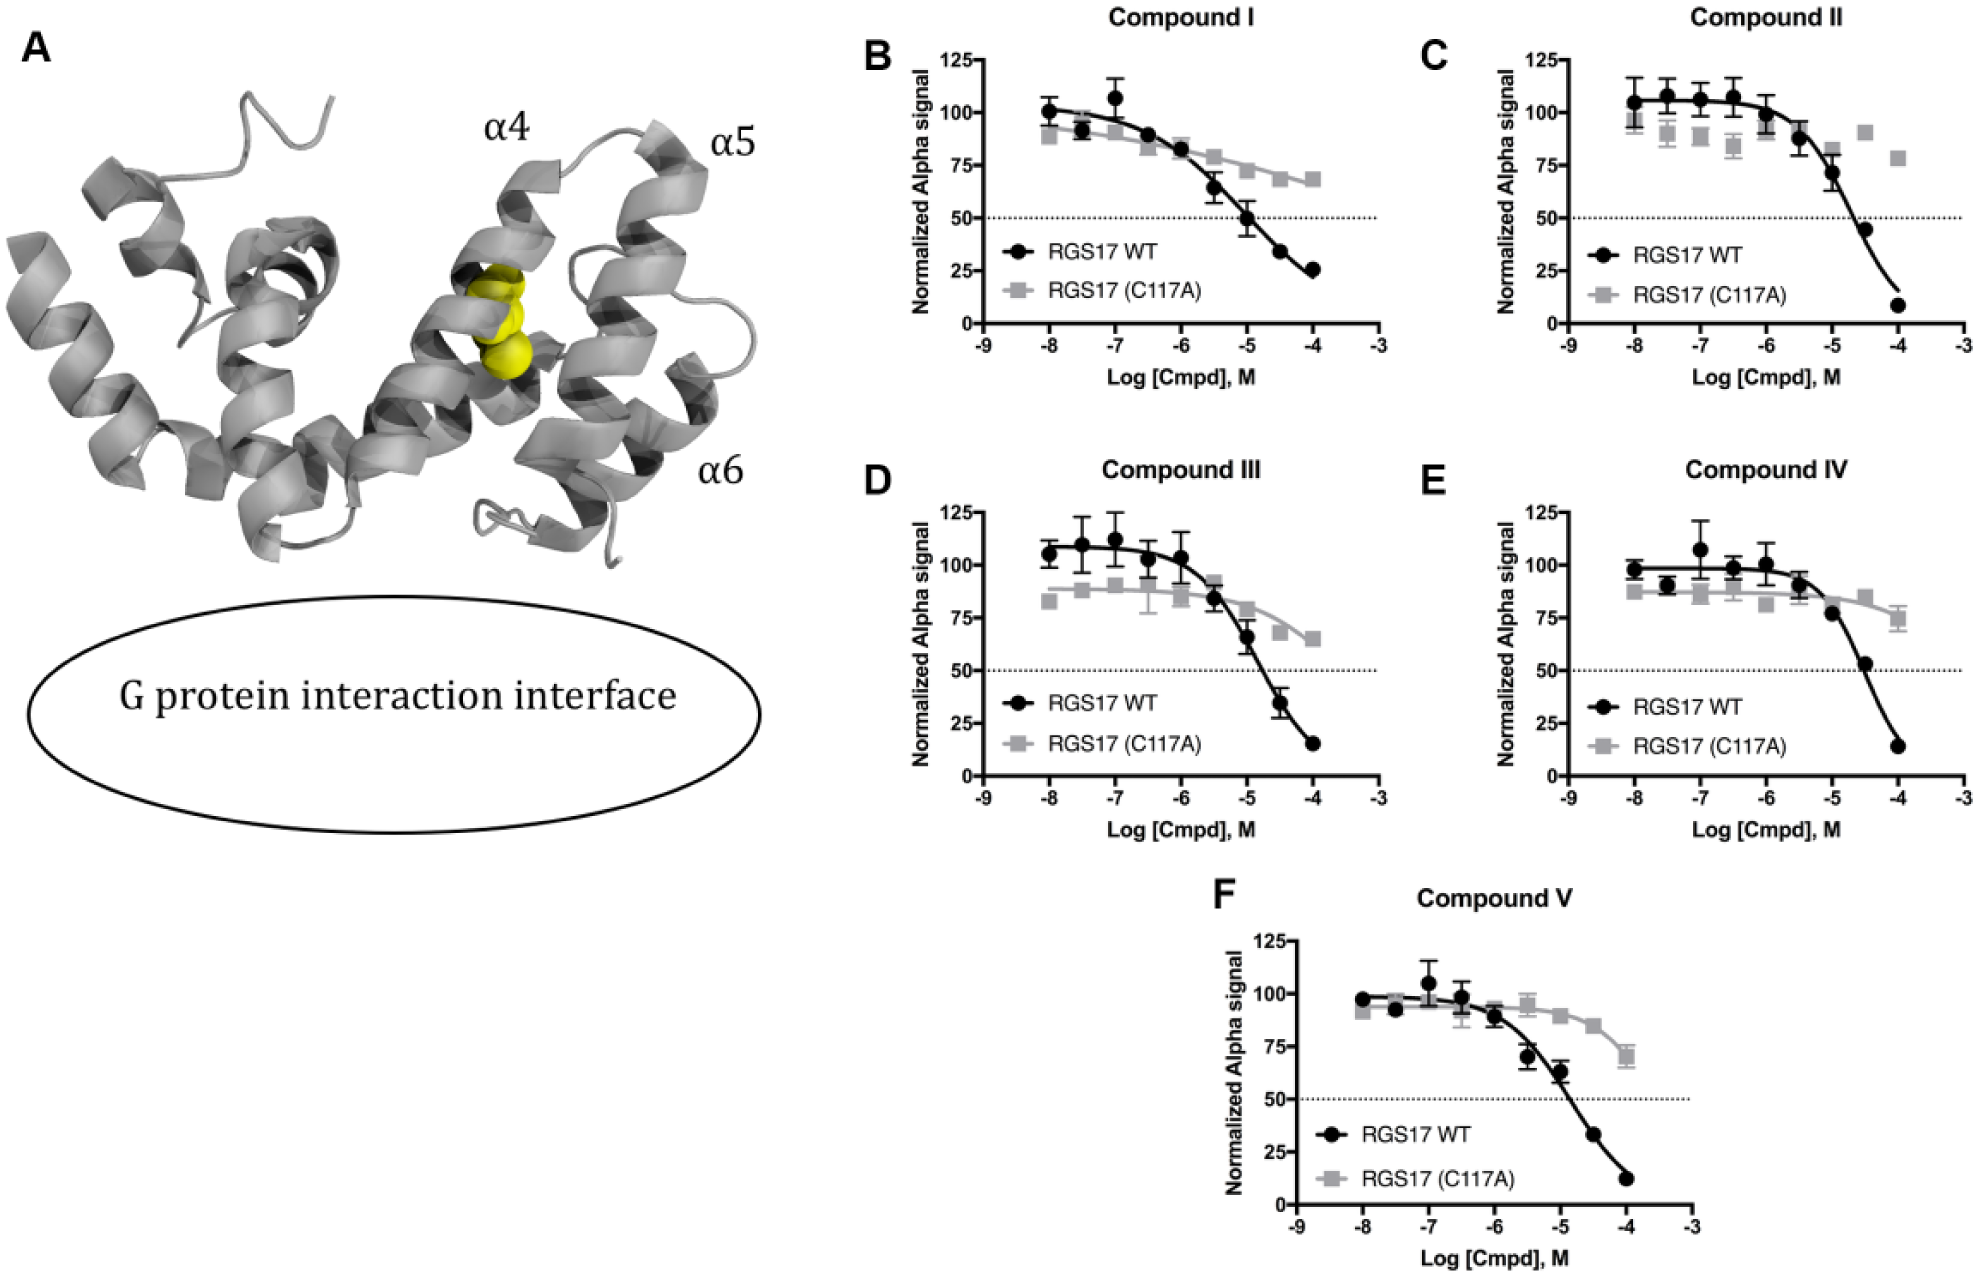
(
Compounds I, IV, and V Inhibit through Reactive Decomposition Products
In preparation for further characterization of compound mechanism of action, lead compounds were ordered from commercial sources and tested for activity. Compounds II and III demonstrated comparable activity to the NCI-provided stocks when prepared fresh from powder (data not shown). However, compounds I, IV, and V demonstrated almost no inhibitory activity with the freshly prepared DMSO stocks. Examination of the structure of compound IV reveals a methyl furan–quinoline substructure. This core structure has been reported to undergo time-dependent decomposition when incubated in 100% DMSO at RT, which resulted in an increase in compound potency against the target being studied. 31 Olson et al. 31 used liquid chromatography–mass spectrometry (LC-MS) to characterize these decomposition products, identifying at least five potential decomposition products stemming from cycloaddition at the furan forming an endoperoxide that can undergo additional transformations. Two of these transformations result in the formation of α,β unsaturations through hydrolytic opening of the endoperoxide, resulting in the formation of fumarate moieties.
Since the core of compound IV ( Fig. 3B ) is highly similar to the core of the compounds tested by Olson et al., 31 and since the three compounds that lost activity when made fresh from powder (compounds I, IV, and V) all contain either methyl furan or furan moieties ( Fig. 3A–C ), it was hypothesized that these compounds may be subject to the same degradation process as outlined by Olson et al. 31 To test this, the freshly made stocks of compounds I, IV, and V were incubated at RT and the activity was tested weekly ( Fig. 3D–F ). Compounds IV and V recovered inhibitory activity after just 7 days of incubation, while compound I recovered activity to initial follow-up levels after 14 days of incubation ( Suppl. Table SIV ). This incubation process did not appreciably increase potency for compound I compared to initial follow-up efforts with NCI-provided stocks, but both compound IV and compound V demonstrated increased potency compared to that determined in initial follow-up efforts. This increase in potency was indeed due to increased inhibition of the RGS17-Gαo interaction and not due to an increase in inhibition of the assay itself, as demonstrated by assessment of assay inhibition at the 14-day time point. None of the compounds inhibited the biotinylated GST control assay at 14 days of decomposition.
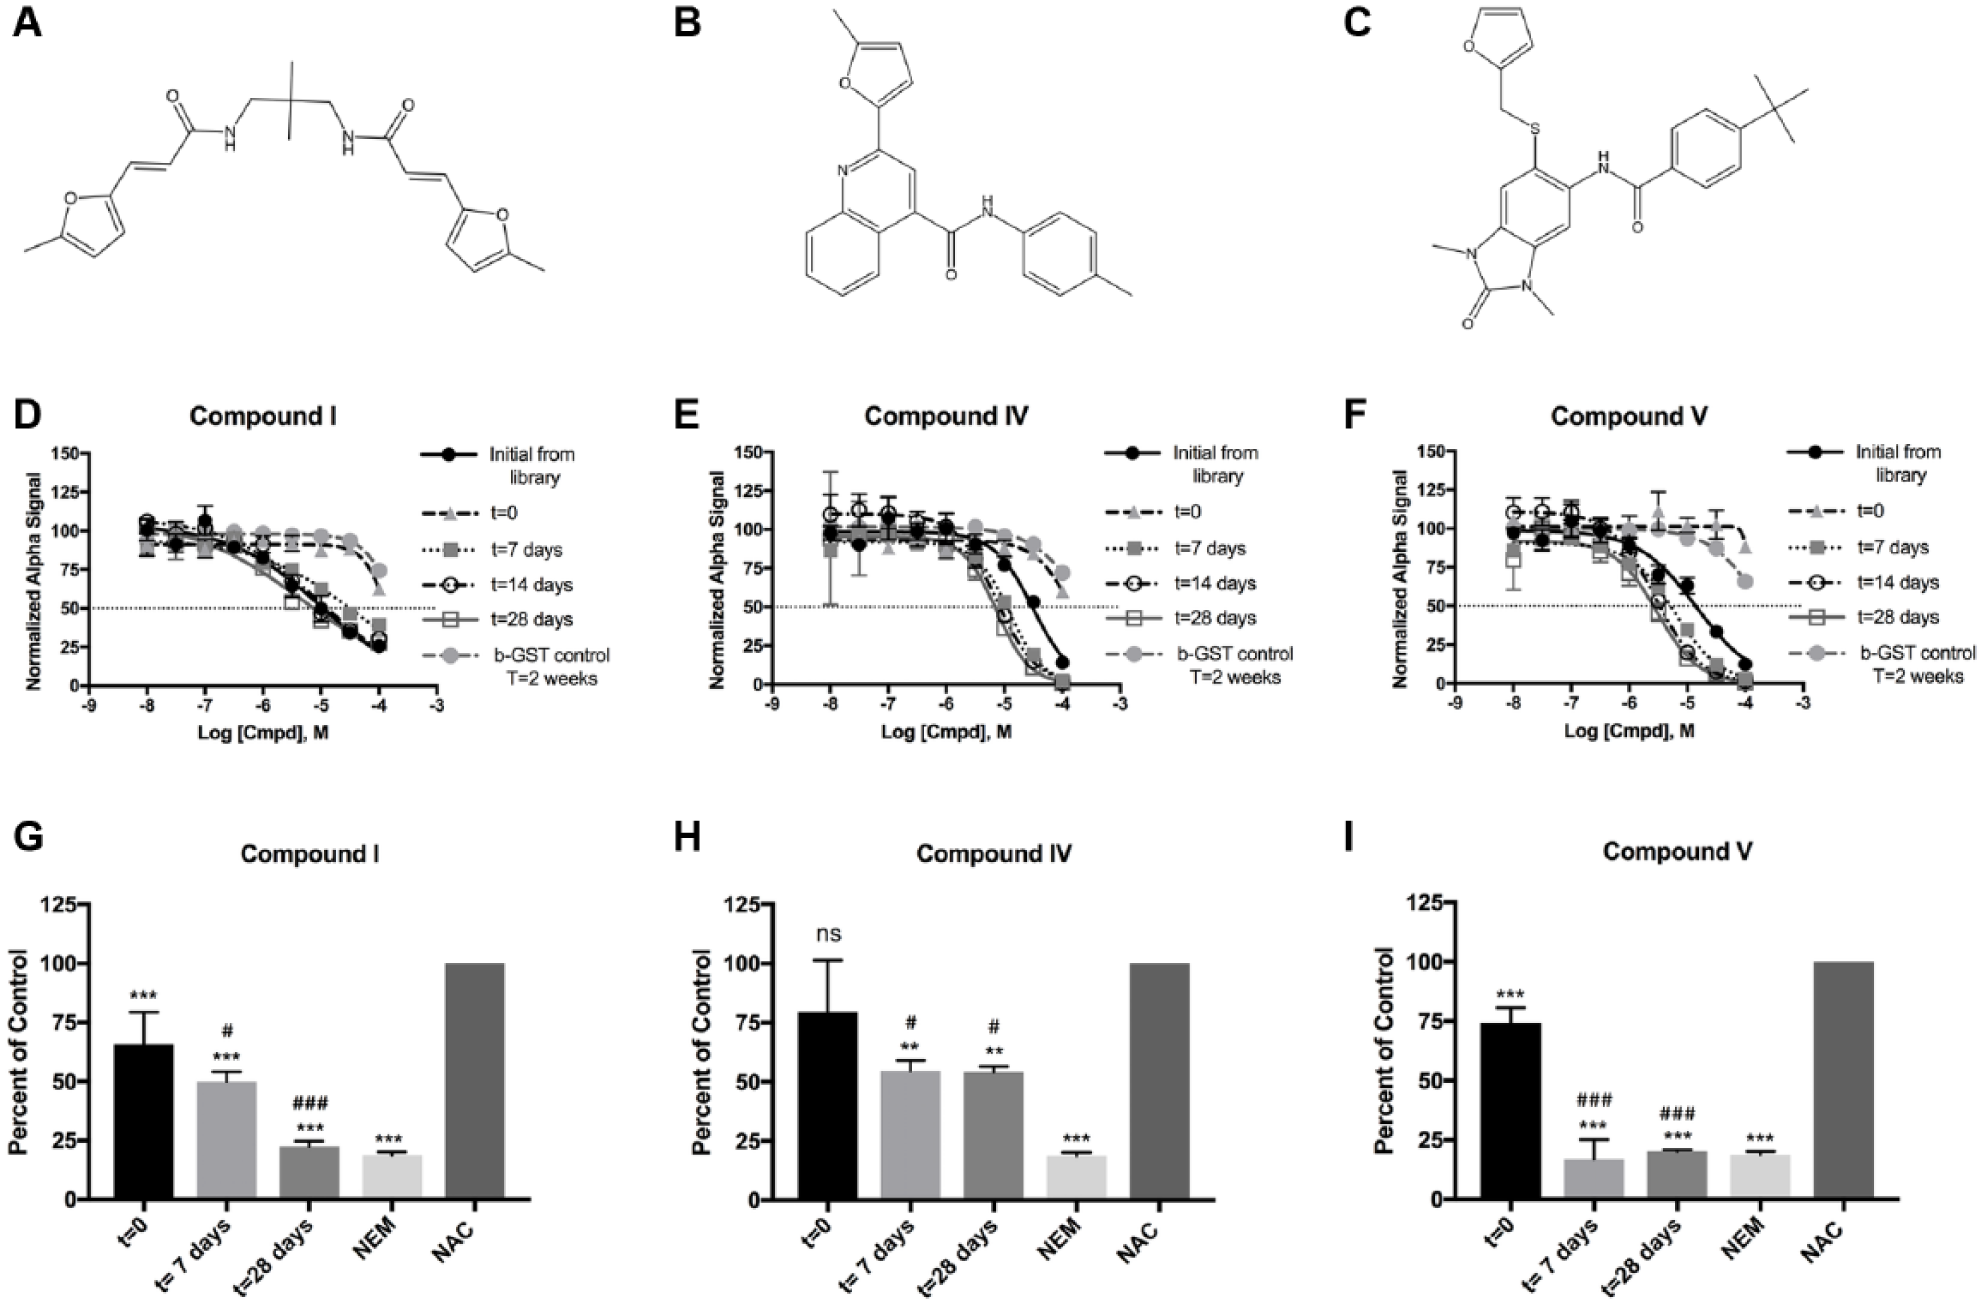
Three lead compounds decompose in DMSO. Compounds are depicted above their representative dose-response analysis. Initial from library data are n = 3 in duplicate. All other data are n = 2 in duplicate. All dose-response data are shown as mean ± standard error of the mean. Panels
As mentioned above, Olson and colleagues 31 identified at least five distinct decomposition products, some of which form reactive products containing α,β unsaturations and α,β unsaturated aldehydes. Given that compound decomposition results in the formation of reactive products, and given that initial follow-up efforts demonstrated that all lead compounds inhibited through interaction with cysteine, it was hypothesized that the increase in potency over time observed for compounds I, IV, and V was due to an increase in reactivity with cysteine. To test this hypothesis, Ellman’s reagent (DTNB) was used to assess the thiol reactivity of decomposition products at each time point. When incubated for 4 h using a 1:1 molar ratio of compound/NAC, compounds I, IV, and V demonstrated an increase in thiol reactivity corresponding to length of time allowed for compound decomposition ( Fig. 3G–I ). This indicates that the decomposition of these compounds in DMSO forms reactive products, which likely contribute to the increase in inhibition observed.
To assess whether these compounds were forming a single decomposition product or multiple products as was seen by Olson et al., 31 TLC and HPLC methodologies were employed. Assessment of the t = 0 and t = 28 days products for each of the three compounds by TLC demonstrated drastic changes in product migration with the mobile phase ( Suppl. Fig. S3 ). Compounds I and V demonstrated a reduction in intensity of the primary product from t = 0 to t = 28 days and also demonstrated a diffuse product band on TLC for the t = 28 days sample, indicating the presence of multiple decomposition products. Compound IV also demonstrated a diffuse product band and the formation of a product band not present in the t = 0 sample. Compound decomposition was also assessed using HPLC ( Suppl. Fig. S4 ). Compound I t = 0 product elutes as a single peak with a retention time of 36.93 min ( Suppl. Fig. S4A ). Assessment of the t = 7 days sample demonstrates the formation of multiple products with elution times ranging from 15.5 min to 36.93 min ( Suppl. Fig. S4B ). In addition, the elution peak at 36.93 min demonstrates peak splitting that is not present in the t = 0 sample. Assessment of the t = 14 days sample demonstrates an increase in intensity of the peaks that emerged at 7 days of decomposition ( Suppl. Fig. S4C ), a trend that continues for the t = 28 days sample ( Suppl. Fig. S4D ). Compound IV t = 0 product already demonstrates a degree of heterogeneity between the major elution peak (34.63 min) and multiple low-intensity peaks ( Suppl. Fig. S4E ). At 7 days of decomposition, the major elution peak shifts to 38.49 min, indicating a unique compound from that at t = 0 ( Suppl. Fig. S4F ). Assessment of t = 14 days for compound IV demonstrates an increase in intensity for multiple products with elution times ranging from 30.69 to 38.46 min ( Suppl. Fig. S4G ). The relative intensities of these peaks remain consistent from 14 days to 28 days of decomposition ( Suppl. Fig. S4H ). Finally, compound V t = 0 product elutes as primarily a single peak with a retention time of 40.95 min ( Suppl. Fig. S4I ). Assessment of the t = 7 days decomposition sample demonstrates the emergence of multiple products ( Suppl. Fig. S4J ). Of note is the peak at 43.59 min, which is the second most intense peak at this time point. Assessment of the t = 14 days decomposition sample demonstrates a near-total reduction of the original elution peak and a corresponding increase in intensity for the peak at 43.57 min ( Suppl. Fig. S4K ). Finally, assessment of the t = 28 days decomposition sample for compound V ( Suppl. Fig. S4L ) demonstrates that the product corresponding to the peak at 43.6 min is the primary compound product, with only a few other low-intensity product peaks detected.
The TLC and HPLC analyses indicate that compounds I, IV, and V are decomposing in DMSO into multiple products. The results for compound IV are in agreement with the results describing decomposition of furan quinolines by Olson et al., 31 but this is the first report of such decomposition for scaffolds such as compounds I and V. Assessment of thiol reactivity suggests that the decomposition results in the formation of reactive molecules and correlates to the increase in potency observed for the disruption of the RGS17-Gαo interaction. It is likely that the products responsible for inhibition are either the α,β unsaturation containing fumarate compounds or an aldehyde-containing product. Given that multiple decomposition products were formed, and given that these compounds likely inhibit through mechanisms that make the compounds susceptible to off-target effects, the exact identities of the decomposition products and identification of the active product(s) were not determined.
Stability of small-molecule libraries is an often discussed yet rarely published debate for labs that use HTS.27,28 An investigation by Zitha-Bovens et al. 27 with respect to stability of screening compounds demonstrated that a significant number of compounds were unstable in either DMSO or DMSO/H2O, even when stored at –20°C. This work represented the establishment of an online predictor tool for compound stability, a tool that was expanded upon by Liu et al. 29 to establish the online compound stability predictor ChemStable. However, assessment of the structures of compounds I, IV, and V using this online tool indicated that each of these compounds is predicted to be stable and not likely to decompose. 29 Yet we clearly observe decomposition with these compounds when stored at RT for just 1 week, and our results in comparing initial follow-up assessment to freshly prepared stocks indicate that these compounds are susceptible to decomposition under normal library storage conditions. This work, as well as that detailed by Olson et al., 31 indicates that rigorous verification is required for lead molecules that contain methyl furan and furan functionalities, as compounds containing these subgroups appear susceptible to decomposition in DMSO and form reactive products.
Compound II Exhibits SAR, Selectively Inhibits RGS17
As a drug target, RGS proteins have only recently been the focus of discovery efforts. Indeed, the first small-molecule inhibitor of RGS proteins was only discovered in 2007 in a screen targeting RGS4. 14 Consequently, reports detailing structural characterization of small-molecule binding to RGS proteins remain limited.19,21 SAR studies would help characterize the binding pocket(s) for these molecules, providing critical information for the design of future RGS protein inhibitors. To date, only one report has detailed SAR with respect to an RGS inhibitor, the RGS4 inhibitor CCG-50014. 22
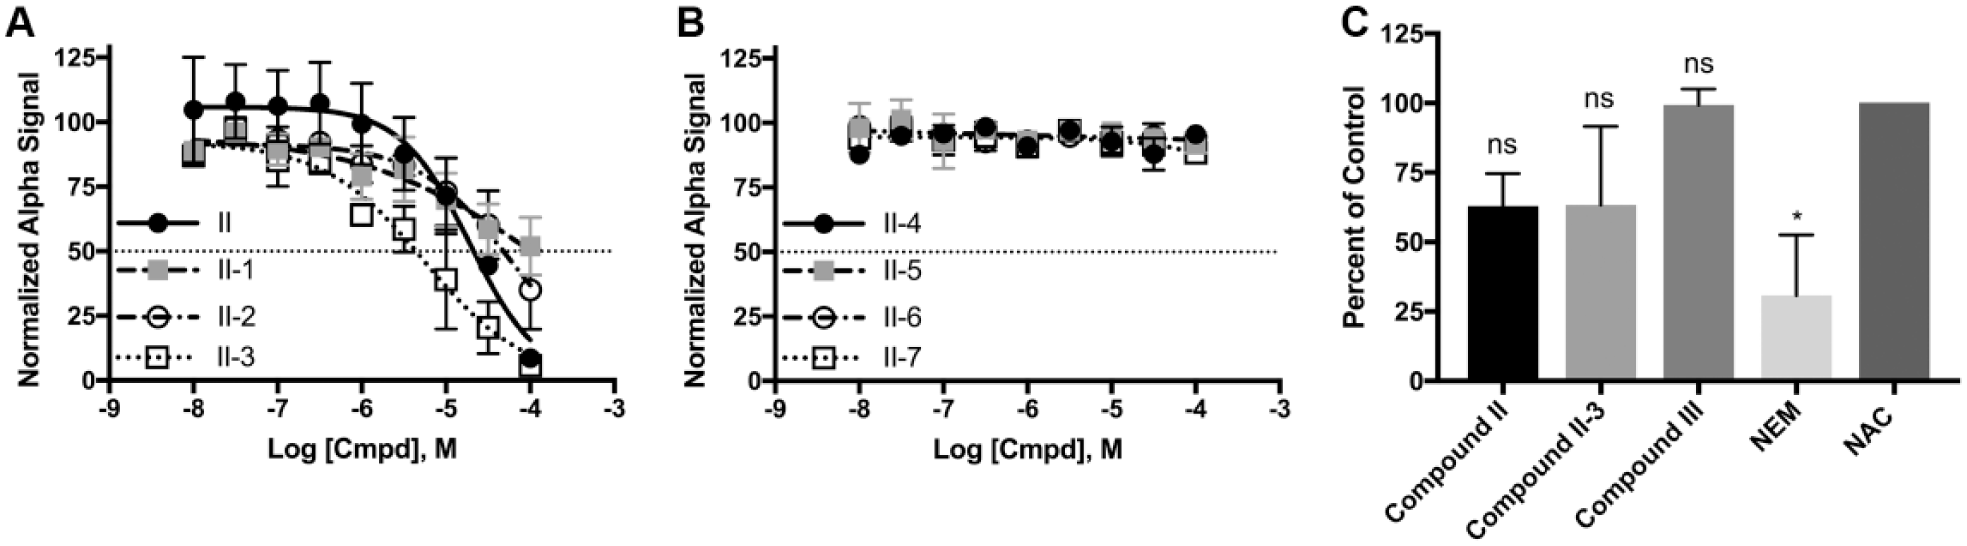
In an effort to establish a small-molecule binding profile for RGS17, analogues of compound II were tested for their ability to inhibit the RGS17-Gαo interaction ( Fig. 4 ). These compounds were selected to test distinct structural features of the parent compound and based on commercial availability. IC50 values for the compounds tested are listed in Supplementary Table SV . Only three of the seven analogues inhibited the protein-protein interaction, with compounds II-1 and II-2 demonstrating less potent inhibition compared to the parent compound and compound II-3 demonstrating more potent inhibition ( Fig. 5A , B ).
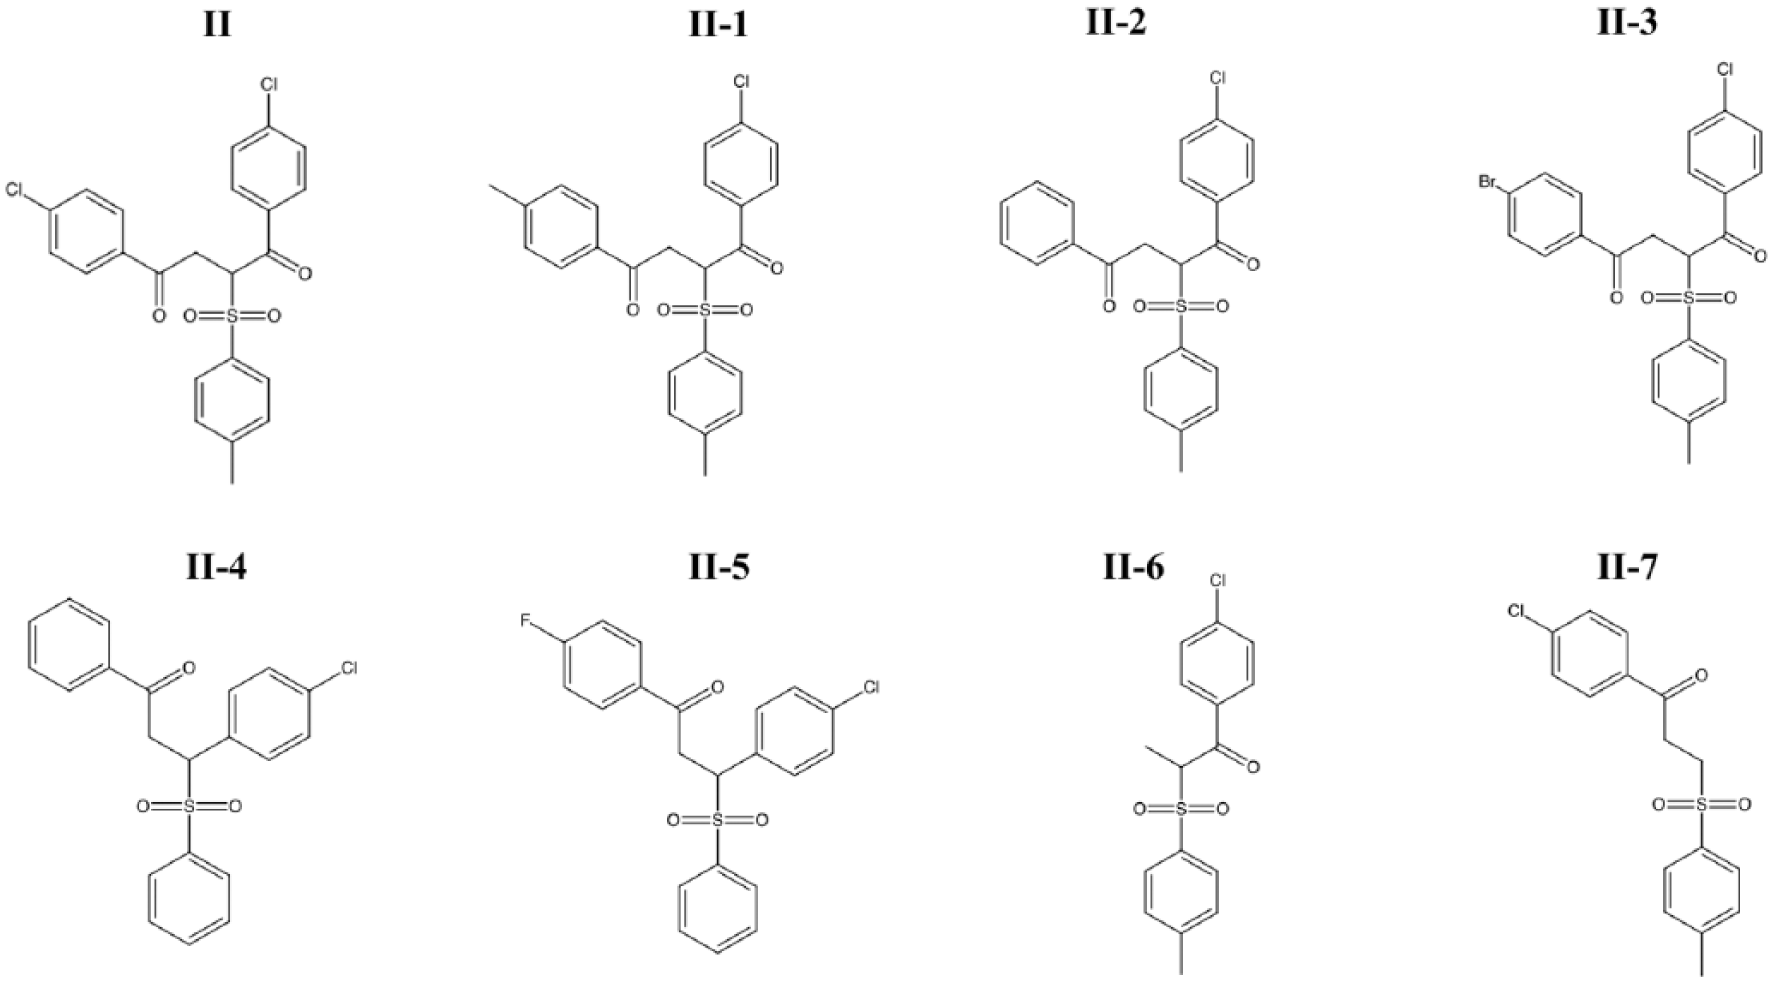
Analogues of compound II tested in Figure 5 .
(
Given that the parent compound II lost activity when tested against the cysteine null RGS17 mutant ( Fig. 2 ), which indicates that the compound is inhibiting through interaction with cysteine, it was assessed whether compound II-3 was a more potent RGS17-Gα interaction inhibitor due to an increased thiol reactivity ( Fig. 5C ). Compounds II, II-3, and III were assessed for thiol reactivity in a similar manner as above. Although compounds II and II-3 trended to have a degree of thiol reactivity, none of these three compounds deviated significantly from the N-acetyl cysteine control. Importantly, substitution of the chlorine in compound II for a bromine in compound II-3 did not result in an increase in thiol reactivity. This indicates that the increase in potency observed for compound II-3 is not due to an increase in compound reactivity but rather may be due to preferential conformation.
Having established that compounds II, II-3, and III inhibit the interaction of RGS17 and Gαo, it was next assessed whether the compounds were selective inhibitors of RGS17 or if they had similar inhibitory activity targeting other RGS proteins ( Fig. 6 ). The lead compounds were again tested against RGS17 along with RGS7, RGS10, and RGS18 using AlphaScreen at a final compound concentration of 31.6 µM (a concentration greater than the IC50 of each compound for RGS17; Fig. 6 ). In each case, the compounds inhibited RGS17 to a greater degree than the other RGS proteins tested (significance determined via one-way ANOVA, F(3, 8) = 53.68, p < 0.001 for compound II, F(3, 8) = 81.29, p < 0.001 for compound II-3, and F(3, 8) = 88.27, p < 0.001 for compound III). Thus, these three lead compounds demonstrate selectivity in inhibiting RGS17 over these other RGS proteins tested.
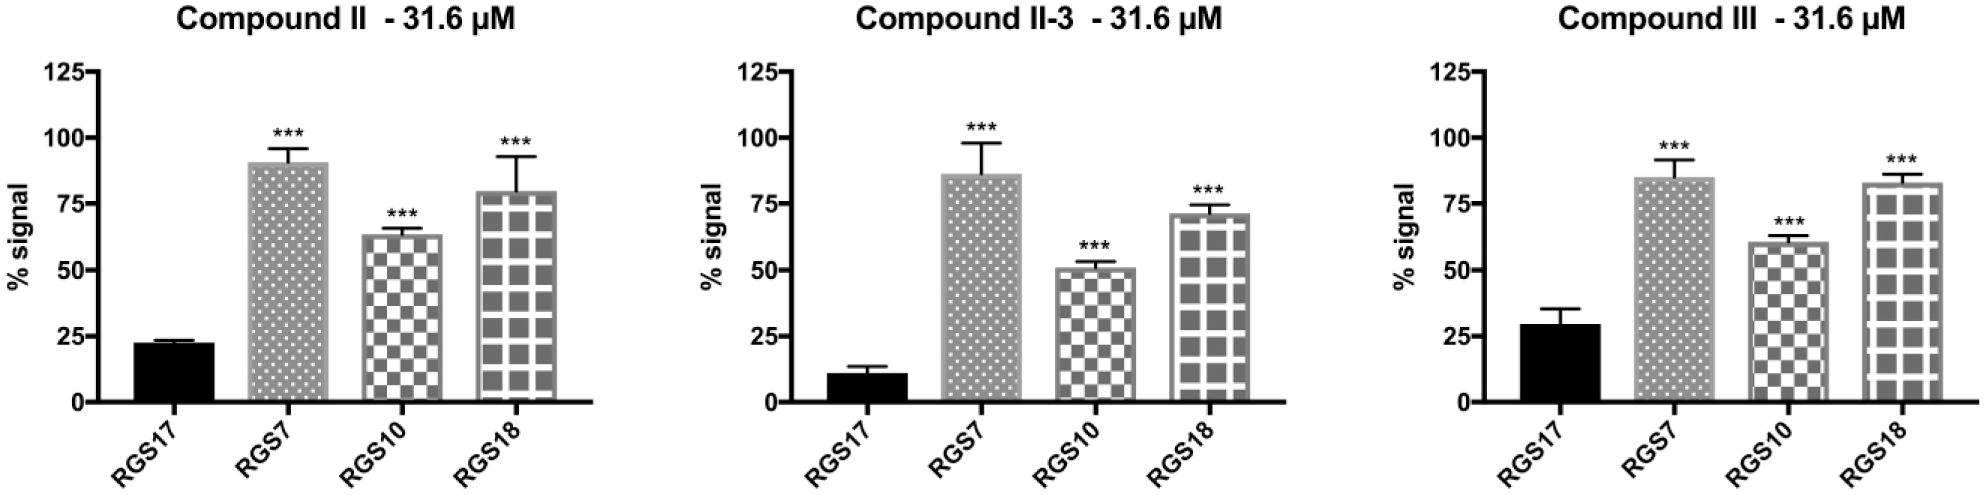
Compounds II, II-3, and III were tested for selective inhibition of RGS17 over RGS7, RGS10, and RGS18. For all three compounds, RGS17 was the most potently inhibited, with a statistically significant reduction in signal compared to the inhibition observed for RGS7, RGS10, and RGS18. Significance was determined via one-way analysis of variance with Holm-Sidak multiple-comparison post hoc analysis. Significance shown on graph is the multiple-comparison analysis with respect to RGS17, ***p < 0.001. Data are n = 3 in duplicate ± standard deviation.
The identification of compound II-3 represents the first report of compound SAR in the targeting of RGS17. Our investigation was limited due to the commercial availability of similar compounds. Therefore, a more in-depth synthetic investigation involving analogues of compound II is required to further probe important binding contacts for this compound. The presence of electron-withdrawing substitutions appears to be essential for the compound to impart inhibition, as substitution with electron-donating groups as with compound II-1 and II-2 results in reduced inhibitory activity. Since a common mechanism of RGS inhibitors is the covalent modification of or dependence on cysteine residues,15–18,21 it is notable that compound II-3 demonstrated increased potency while exhibiting no corresponding increase in thiol reactivity, leading to the deduction that increased potency is not merely due to compound II-3 being more reactive but rather through improved recognition or binding to a site on RGS17. While the parent compound II did lose activity against the cysteine null mutant, the result with compound II-3 indicates that there exists a degree of structural specificity that imparts compound inhibition.
Recent work focused on another RGS protein, RGS4, detailed a mechanism by which RGS proteins may be inhibited at allosteric cysteine residues. 21 Specifically, the conformational dynamics of RGS4 allowed the α5-α6 helix pair of this protein to swing out and cause the protein to adopt a high-energy open-like conformation, which allowed the RGS4 inhibitor CCG-50014 to bind the solvent-protected critical cysteine residue. Inhibitor binding then disrupts the RGS4-Gα protein-protein interaction by preventing RGS4 from reverting to the “closed” conformation and interfering with the formation of critical binding contacts at the G protein interaction interface. 21 If RGS17 is inhibited via a similar manner, then the presence of the larger halogen in compound II-3 may result in increased potency because it traps RGS17 in a more “open” conformation than the chlorine containing compound II. More work needs to be done, potentially through molecular dynamic simulations and protein NMR, to determine the mechanism by which inclusion of the bromine in compound II-3 imparts increased potency.
In conclusion, five hit compounds were identified from a screen of over 60,000 compounds that inhibited the RGS17-Gαo protein-protein interaction with low single to double-digit micromolar IC50s. Three of these compounds were shown to lose activity when freshly prepared, and the interaction was actually inhibited by reactive decomposition products of the parent compounds. This work, along with the work by Olson et al., 31 indicates that furan functionalities may be sensitive to decomposition in library storage and usage conditions, and as such, rigorous follow-up should be applied to lead compounds containing furan substructures. We also report the identification of compound II-3 through a small-scale SAR cohort, resulting in the first ever compound SAR for small molecules targeting RGS17. This compound and compounds II and III were shown to be selective inhibitors of RGS17. With respect to the SAR study, the scope of analogues tested was limited due to commercial availability, but this work indicates conformational compound selectivity is observable in targeting RGS proteins with small molecules. A more comprehensive investigation of SAR with respect to compound II through synthetic means, as well as structural characterization of inhibitor binding, is essential in the establishment of critical binding contacts at the allosteric binding site that will allow for the design of RGS17-specific small-molecule inhibitors.
Footnotes
Supplementary material is available online with this article.
Declaration of Conflicting Interests
The authors declared no potential conflicts of interest with respect to the research, authorship, and/or publication of this article.
Funding
The authors disclosed receipt of the following financial support for the research, authorship, and/or publication of this article: This work was supported by NIH 5RO1CA160470 (DLR), UIowa IRG-77-004-31 (DLR), UIowa Oberley Award Seed Grant (DLR), the American Foundation for Pharmaceutical Education Predoctoral Fellowship (CRB, MPH), the NIH T32 grant 2T32GM008365-26A1(JBO), the University of Iowa Center for Biocatalysis and Bioprocessing (JBO), and the University of Iowa College of Pharmacy.
References
Supplementary Material
Please find the following supplemental material available below.
For Open Access articles published under a Creative Commons License, all supplemental material carries the same license as the article it is associated with.
For non-Open Access articles published, all supplemental material carries a non-exclusive license, and permission requests for re-use of supplemental material or any part of supplemental material shall be sent directly to the copyright owner as specified in the copyright notice associated with the article.