
Abstract
The correction or removal of signal errors in high-throughput screening (HTS) data is critical to the identification of high-quality lead candidates. Although a number of strategies have been previously developed to correct systematic errors and to remove screening artifacts, they are not universally effective and still require fair amount of human intervention. We introduce a fully automated quality control (QC) pipeline that can correct generic interplate systematic errors and remove intraplate random artifacts. The new pipeline was first applied to ~100 large-scale historical HTS assays; in silico analysis showed auto-QC led to a noticeably stronger structure-activity relationship. The method was further tested in several independent HTS runs, where QC results were sampled for experimental validation. Significantly increased hit confirmation rates were obtained after the QC steps, confirming that the proposed method was effective in enriching true-positive hits. An implementation of the algorithm is available to the screening community.
Keywords
Introduction
High-throughput screening (HTS) has become a pivotal technology for modern drug discovery. It is applicable to both target identification via functional genomics screens and lead identification via chemical screens. In the past decade, advances in screening technologies have pushed the envelope to enable the utilization of higher density plate formats with reduced consumption of screening materials. It has become a routine practice to profile hundreds of small interfering RNA (siRNA) plates targeting the whole human genome 1 or thousands of compound plates comprising several million compounds within a single screening campaign. 2 Nevertheless, the very advantage of miniaturization and industrial scaling carries unique data quality challenges (i.e., HTS is more error prone, and its hits require a subsequent confirmation study than lower density and throughput screening). Quality control (QC) is a critical element for a successful screening campaign, as QC influences the quality of inputs to downstream hit picking and hit validation. Considering the large number of screening plates involved, traditional manual QC of screening hits is not viable; only automatable QC methods can be feasibly and routinely applied.
Data errors originate from many sources related to the HTS approach. Some are inherent to the assay formats and are difficult to avoid without sacrificing throughput. Two types of challenging errors to be addressed here are systematic errors and random artifacts. We here do not consider random statistical errors that require replicate measurements to correct. 3 Systematic errors are typically identifiable trends or deviations. For example, signal drift patterns associated with a row, a column, or around edges are usually caused by factors such as variance in liquid handling, incubation times, temperature, air flow, sample degradation, cellular toxicity, and evaporation of reagents. 4 Systematic errors are usually time dependent and can affect the entire HTS screen or just subsets of consecutive plates; they can be readily detected manually as nontrivial interplate signal patterns. Systematic errors may cause either inactive compounds to be called as hits (false positives) or real active compounds to be missed (false negatives).4,5 Random artifacts are due to a collection of numerous deterministic changes caused by errors in dispensing reagents and sample preparation. 6 They lead to large-magnitude unrepeatable screening signals (i.e., the true signals have been overwritten and are no longer recoverable). The affected wells must be removed from the hit list during QC. Artifacts are often plate specific and will be referred to as intraplate errors; they can be readily detected manually as large areas of hit regions.
Many methods have been developed to correct systematic errors. Most of them rely on normalization methods to first minimize interplate signal variations and then correct systematic errors within one plate at a time. However, correcting intraplate systematic errors is not a trivial task. Specific patterns such as row and column bias may be corrected by scoring systems such as B-score,3,7 where background signal bias is estimated by a two-way median polish method and removed afterward. 8 B-score is known to tend to overadjust when no significant row or column systematic errors are identified 9 and may not be effective in correcting irregular bias patterns. Makarenkov et al. 4 proposed a “well correction” (WC) method, which uses the linear least squares approximation of the values within each well measured across all plates to identify and remove the trend that deviates the well from the zero-mean center. Although the WC method was found to be the most robust and outperformed other methods, 4 it is insensitive to patterns affecting only a subset of plates. The existing methods, therefore, are not universally applicable.
Based on our QC experience, systematic error patterns tend to persist over a number of sequential plates and are mostly interplate in nature. The idea we adopted for this study was to take a reference group of plates sharing a similar error pattern and apply a well-based correction algorithm, in which the median of activity values of any given well location (except control locations) of all reference plates involved was used to normalize the well signal. The difference between our approach and the above-mentioned WC method lies in the fact that the WC method uses all screening plates, while our approach only uses a group of plates showing similar signal patterns to correct the signal of one target plate. The key challenge of our algorithm is plate grouping, since different reference plate groups are required for each individual target plate.
Previously published plate-grouping approaches include the time-based method and similarity-based method: the time-based method assumes that neighboring plates tend to preserve their homogeneity and groups plates via a time window or via change point detection (e.g., relating to batches of plates processed) 5 ; the similarity-based method employs an unsupervised k-means clustering method. 10 In practice, we found it is rather hard to either choose the appropriate time frame size or to determine the correct k value without human visual inspection. The first contribution of this study is to present a fully automated similarity-driven approach in generating overlapping reference plate sets and applying well-based error correction without human intervention.
Random artifact patterns require a different QC strategy. Due to the loss of true signal, wells affected by artifact are not correctable and should be removed from the remaining hit identification workflow.4,5 When visually inspected in plate heatmaps, intraplate local artifacts marked as hits appear as areas in random shape covering contiguous (or nearly contiguous) regions. The larger the area, the less likely it represents true hits, since compound libraries are typically designed to incorporate chemical diversity and true hits are rare events, typically representing <1% of the library screened. QC removal of artifacts by eye might be reliable but is extremely labor intensive. The second contribution of this study is to combine standard image-processing techniques with statistical simulation results to remove artifacts without human intervention.
In summary, as industrial-scale HTS campaigns generate data in large quantities, it is critical to have an automatic robust QC pipeline. Published QC methods have their limitations and require laborious manual intervention. We will present a two-step automation method that not only effectively corrects interplate systematic errors in signal bias but also reliably removes intraplate artifacts. The application of the pipeline to ~100 historical HTS assays enabled us to carry out a retrospective detailed structure-activity relationship (SAR)–based in silico validation of this method. We then applied the algorithm prospectively to several HTS experiments, where experimental validation of QC results was possible. This enabled us to demonstrate that the proposed method is able to robustly exclude true artifact wells, triage false positives, and rescue false negatives. The described automatic QC pipeline significantly improves the hit quality of HTS campaigns and expedites the hit-to-lead progression.
Materials and Methods
Data Normalization and Manual QC
For each plate, original signal readings were divided by plate median (i.e., signals from positive controls were around zero and plate medians were 1 after normalization). Wells with activity below a cutoff value 0.5 corresponded to greater than 50% inhibition and were designated as original hits. In existing QC workflow, various grayscale images representing well activities or hit status are generated for each plate to facilitate visual QC. An assay heatmap of 1536-well signals across all plates serves as a visual aid to identify well-based systematic patterns across multiple sequential plates. 5 Groups of plates containing similar unusual signal profiles are identified and interplate systematic errors are corrected by a well-based adjustment algorithm described later. Artifact areas of hits are visually identified and manually masked plate by plate using TIBCO Spotfire (TIBCO Software, Palo Alto, CA). However, to curate the entire screen using such a manual QC process would have taken days, which signifies the importance of an automated QC pipeline.
HTS Data Matrix
Historically, several hundred HTS campaigns have been run within the Genomics Institute of the Novartis Research Foundation (GNF). These screens cover both cell-based (toxicity, proliferation, etc.) and target-based (kinases, proteases, G protein–coupled receptors [GPCRs], etc.) assays, as well as a wide range of assay instruments and readout technologies.
11
We started from an initial matrix consisting of 244 assays across more than 3.6 million structures. After filtering out compounds existing in less than 60% of assays and assays that contained less than 30% of total compounds, we retained 1,998,441 structures and 98 assays for in silico validation purpose. The elements in the HTS matrices were compound activities, which were further Z score normalized (see
After systematically applying the auto-QC pipeline to all 98 screens, the post-QC HTS matrix contained 1,996,751 structures. In total, 1690 structures were removed due to the artifact identification. These two versions of the HTS matrices served as the input for in silico validation. We hypothesized that the activity data contained in the post-QC matrix to be of higher quality than the pre-QC matrix if the auto-QC pipeline was successful.
HTS for Experimental Validation
We were able to experimentally test the performance of the QC pipeline in five diverse HTS assays. For ease of description, these assays are labeled by the Greek alphabet based on their chronological order. The details regarding assay annotations, including their readouts, number of screening plates, criteria for primary hits, and criteria for validation, are described in the
Results
Overview of the QC Workflow
A full-deck HTS screen of 3.45 million compounds (assay α) was used as an example to explain the proposed automatic QC pipeline. The screen was chosen because it had medium quality with a median Z′ score of 0.17 compared with the >0.5 threshold that defines an excellent assay 12 ; visual inspection showed it provided a sufficient number of various test cases for our QC process (see Materials and Methods). A reasonable QC effort on the screen using our existing interactive QC workflow would had taken days, while a fully automatic QC process described below could be completed within an hour on a typical modern workstation.
A simple cutoff method (activity threshold <0.5; i.e., >50% inhibition) was initially applied to the normalized activity values, and 69,365 “original” hits were obtained. A well-based error correction algorithm was then introduced and applied to remove interplate systematic errors, and 40,876 “corrected” hits were obtained. A contiguous area detection algorithm was subsequently applied to the corrected signals and segregated wells into either “normal” or “artifact.” A total of 28,541 corrected hits were labeled normal and considered final hits. The above workflow is schematically shown in Figure 1 , where all the hits involved in the study could be divided into six categories based on their origin (“O” for “original” and “C” for “corrected”) and their assigned artifact status (“A” for “artifact” and “N” for “normal”).
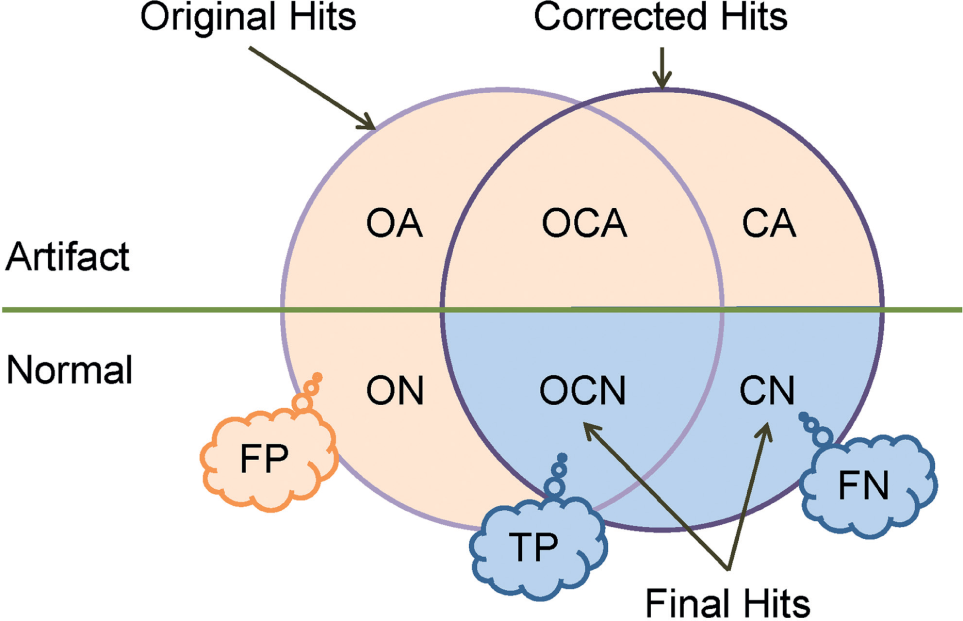
The two-step quality control (QC) process segregates all hits into six categories. Hits later identified as artifacts are denoted with *A; otherwise, *N. O stands for hits that were unique to the original list; C stands for hits that were unique to corrected hit list; OC stands for original hits that were retained in the corrected list. The callouts indicate the hypotheses we aimed to validate later—that is, OCN hits are true-positive (TP) enriched, CN hits are false-negative (FN) enriched, and the rest of the intermediate hit candidates are false-positive (FP) enriched.
If the above two-step automatic QC workflow works effectively, one would expect the final hits to have a significantly higher probability to be validated in follow-up confirmation studies compared with the other hit classifications. Moreover, we hypothesized that the OCN portion of the final hits was mostly enriched for true positives (TPs) and the CN portion was mostly enriched for false negatives (FNs) in the original hit classification, and the remaining four intermediate hit categories (ON, OA, OCA, and CA) were mostly false positives (FPs). In the following sections, we first describe the main QC algorithms, followed by a retrospective database-wise in silico validation and experimental validation.
Automatic Interplate Systematic Error Correction
Systematic HTS errors often generate similar signal patterns across multiple plates. Such patterns could be corrected by performing a well-based signal adjustment. For each plate within the screening campaign, pairwise similarity distances (see Materials and Methods) were calculated between this target plate and all other plates within the screen. Any plate that had a distance shorter than a cutoff value of 0.2 was considered to belong to the reference plate group for the specific target plate. If the total number of reference plates exceeded 10, the signals on the target plate were adjusted using a well-based correction algorithm. The threshold of 10 was taken from a recommendation made for a related HTS data modeling algorithm. 5 More specifically, for each well location w, the signal of the target well Sw was replaced by Sw/Sm, where Sm was the median value of signals at the same well location w from all reference plates. The idea of this algorithm was that Sm captured the deviation of the background signal for w from the unbiased median 1.0, if the number of reference wells was sufficient to represent a random compound pool. Error correction for the target plate would be skipped, if the size of reference group was too small (<10).
This well-by-well correction method not only is applicable to correct arbitrary systematic error patterns but also yields robust results even when no systematic error is present. In addition, by permitting one plate to serve as a reference for multiple target plates, the algorithm overcomes the limitations of previous partition-based plate grouping methods. 10 The algorithm is also computationally efficient, as it can be applied to all target plates in parallel. These unique properties make this first QC step particularly apt for full automation.
As an example, four plates sharing a similar signal pattern were selected from one plate group containing approximately 200 similar plates in the screen.
Figure 2a
shows their grayscale plate images, where well intensity represents normalized well activity (i.e., dark wells were active and light ones were inactive). Systematic error pattern was manifested as a darker signal band started from the lower left corner, stretched to the middle top, then reached the upper right corner (highlighted in
Fig. 1a
). Distribution of original hits (
Fig. 2b
) showed a clear bias in the area affected by the error pattern. This particular error pattern was quite different from row-based or column-based error patterns that most previous algorithms were designed for. Taking the first plate as the target plate, 237 reference plates were identified. Using well AE3 as an example, its signal value Sw was 0.41. The signals at AE3 collected from all 237 reference plates (
Fig. 2c
) formed a signal distribution with median Sm of 0.43 (
Fig. 2d
). Therefore, the signal at AE3 for the first plate was corrected to 0.98. Similar process was applied to the other three plates as well. Corrected plate signals are shown in
Figure 2e
, where the dark signal band is no longer detectable. The corrected hits of these four plates no longer show significant spatial correlation (
Fig. 2f
). After the automatic interplate systematic correction, well AE3 was no longer a hit; only 12 of the 81 original hits in the four plates were retained and one new hit was identified. Application of the WC method to the same example failed, because this error pattern only existed on about 9% of the plates (
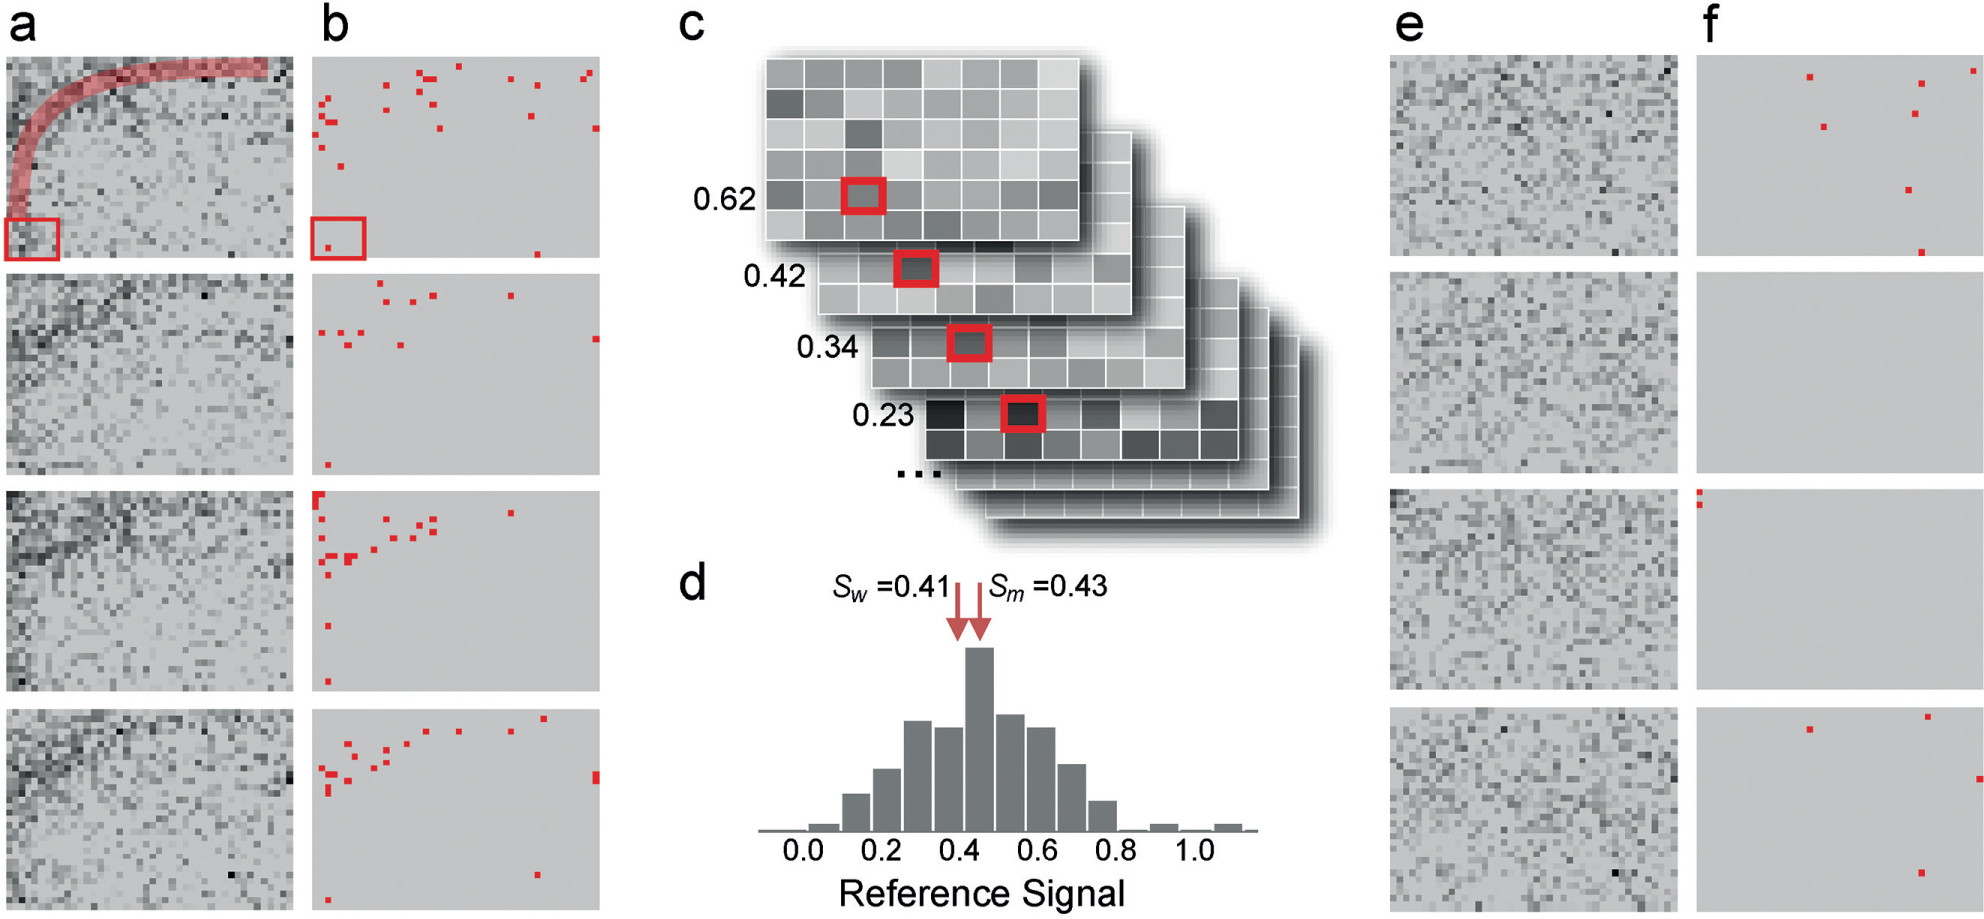
Signals and hits patterns for four example plates obtained before and after the application of the well-based correction algorithm. (
Automatic Intraplate Artifact Removal
HTS plates often contain areas of active wells. According to statistical simulation results, large hit areas are interpreted as nonsystematic artifacts and are removed during manual QC workflow. For example, taking a screen of a 10% hit rate, which is unusually high in real-world scenarios, simulation results were obtained by placing hits at random well locations of a 1536-well plate (summarized in Fig. 3a ). Only 1% of hit areas could reach a size of 6 or larger by chance; the p-value drops to 0.1% for hit areas 10 or larger. Considering the fact that most practical HTS assays have a much lower overall hit rate and the hit rate could vary significantly across plates as different compound libraries were profiled, we decided to estimate plate-specific hit area cutoffs for the purpose of artifact elimination. For all possible hit rate values (hit counts range between 1 and 1536 per plate), contiguous hit area sizes corresponding to a conservative 0.1% p-value were determined based on 2000 simulation runs and were stored as a lookup table. For each plate, a hit rate is calculated based on its total hit count, and a plate-specific hit area threshold is thus retrieved from the lookup table.
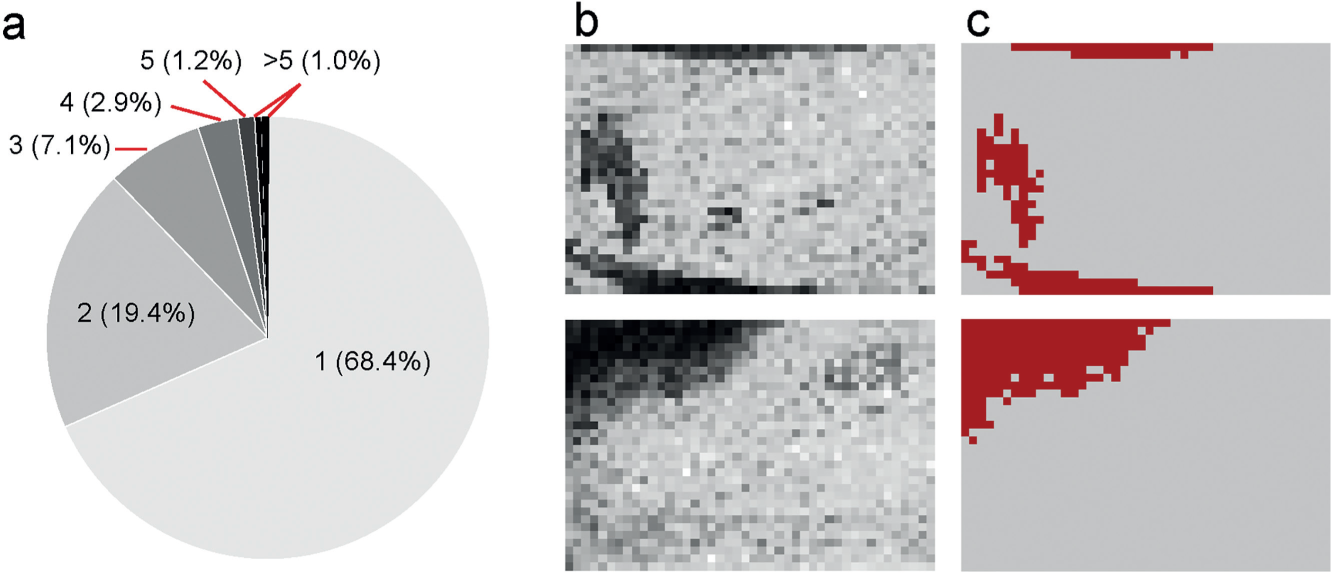
Contiguous hit areas formed due to artifacts. (
A recursive hit area identification algorithm works as the following: first, an arbitrary unvisited hit well is chosen as the starting point and the signals of the eight neighboring wells are sequentially examined. If a neighboring well is also an unvisited hit, then the wells are connected as a group and the same process is recursively applied. Eventually all hits connecting to the starting point are identified. The hit area will be flagged for removal if its size exceeds this threshold. The process is then repeated on the next unvisited hit on the plate until all hits are covered. In our study, a total number of 1074 artifact areas containing 23,929 hits were flagged for removal.
Figure 3b
,
c
shows the effect of this particular QC step on two example plates. Application of the median polish smoothing method to the same example failed, because such artifact patterns were not only irregular in shape but also plate specific (
Plates of Nonrandom Compounds
The artifact detection algorithm relies on the assumption that the plating of compounds within a plate is a random process; therefore, the within-plate hit frequencies are random. This assumption may not hold for a number of reasons. As compounds are added to the screening library from combinatorial chemistry synthesis or from medicinal chemistry on a particular scaffold, there are plates with an unusually large number of structurally similar compounds that could lead to high hit rate. Large contiguous hit areas may actually represent true hits on such plates. We carried out intraplate structure similarity analysis and flagged such nonrandom plates in the library (see
In Silico Validation across 98 HTS Assays
We retrospectively applied the auto-QC pipeline to reprocess hundreds of HTS assays conducted at GNF in the past few years and complied two large HTS activity matrices, each approximately consisting of 2 million structures across 98 assays (see Materials and Methods). The matrix elements are Z-transformed activity values, and the HTS fingerprint for a particular compound refers to its data vector across the 98 assays in an HTS matrix. If the auto-QC pipeline indeed improved the quality of the data, we predict a stronger structure-activity association to be observed between compound structures and their HTS fingerprints following application of the QC algorithm. That is, for a given pair of compounds with similar structures, their HTS fingerprints extracted from the post-QC matrix are expected to be more strongly correlated compared with the fingerprints extracted from the pre-QC matrix. To test this, we first identified compound pairs that had Tanimoto similarity coefficients above certain cutoffs (we used 0.85, 0.9, and 0.95 in this study); next HTS fingerprint similarities for each compound pair were calculated twice, rpreQC and rpostQC, using data from pre-QC and post-QC matrices, respectively. Changes in HTS correlation scores for each compound pair were then analyzed. As the HTS profiles for compounds that were not active in any screen represent screening noise, we selected compounds that hit at least a certain number (1, 2, 3, and 4) of assays for the correlation analysis. As the results are fairly consistent in all combinations of the similarity cutoff and minimum hit counts described above, we describe the results obtained under a similarity cutoff of 0.9 and minimum hit count of 3.
With 104,380 pairs of compound structures (similarity ≥0.9), Figure 4a shows the distributions of their fingerprint correlation coefficients obtained under the two HTS matrices, where the distribution mean increases from 0.35 to 0.38 (p < 10−100) after QC. For each given pair, the difference in its two correlation coefficients, rpreQC – rpostQC, was calculated and the distribution is shown in Figure 4b . It is clear that changes in fingerprint correlations are more often positive than negative (i.e., we do see a stronger SAR after auto-QC). For a given compound, application of the QC algorithm is only expected to significantly affect a few assays. Consequently, only a few elements of the 98-element fingerprint vectors would change, resulting in negligible effects on their overall correlation coefficients. As a result, 95% of the observed shifts in the correlation coefficient fall within the range of −0.2 to 0.2. However, when we focus on regions where QC makes a pronounced impact on the fingerprint correlation (i.e., |rpreQC – rpostQC| > 0.2; Fig. 4b ), there is a much higher chance (2.2-fold enrichment, p < 10−100) the shift is positive, pointing in the SAR-favorable direction.
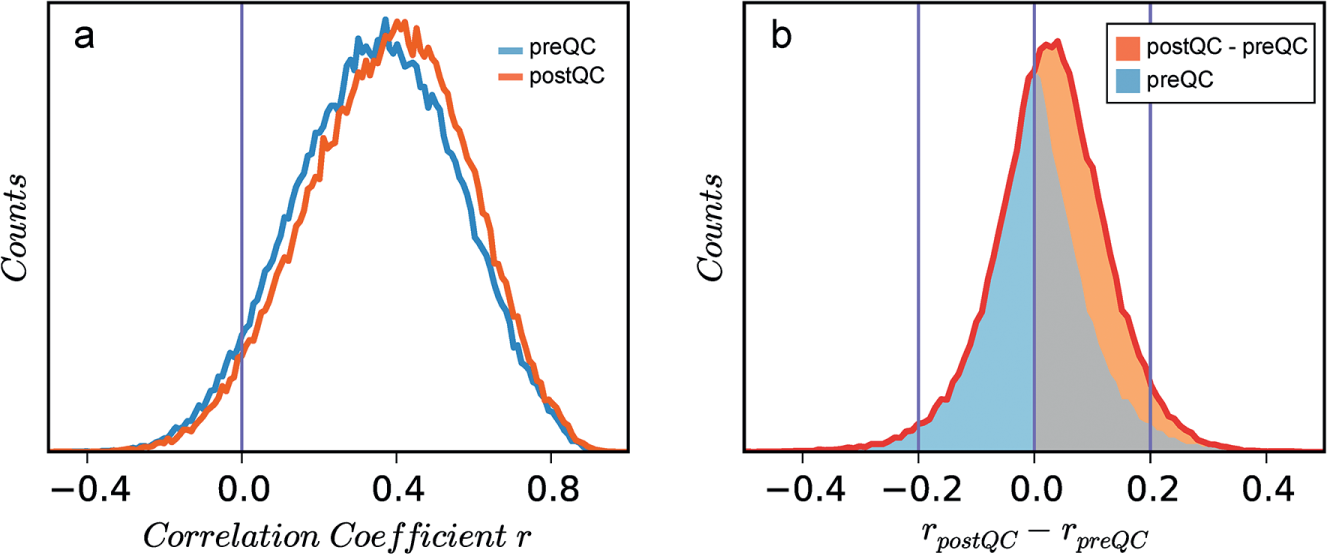
Activity correlation coefficients for structurally similar compound pairs differ before and after quality control (QC). (
We repeated this analysis using two different Z-transformations (see Materials and Methods), different fingerprint similarity metrics, and different cutoff parameters. The observation that the largest shifts in compound correlation scores were predominantly positive is always held; therefore, we conclude the auto-QC pipeline leads to an HTS matrix that shows stronger SAR, implying that the calculated assay activities of the compounds post-QC are closer to their true values.
Experimental Validation
Hits in historical screens were selected for confirmation subjected to a manual QC process (see Materials and Methods), and as such, it is not possible to retrospectively analyze true activity of the filtered hits. We therefore validated the QC algorithm by selecting hits from each QC category for five new screens, encompassing a variety of screening formats and biological relevance. These selected hits were used to objectively evaluate the results of our QC pipeline. Since the second artifact removal step was typically only applied to hits that survived the first systematic error correction step, we did not distinguish ON and OA hits (except for assay α) and instead just counted both as ON. Hits from auto-QC were assigned to one of five categories: ON (original hits), OCN (original, corrected, and normal), OCA (original, corrected, artifacts), CN (corrected, normal, not in original), and CA (corrected, artifacts, not in original). At least 50 compounds in each category were randomly selected or all hits in a category were selected if fewer than 50 were available. As most OCN and CN hits were already selected for validation due to their biological relevance, there are more data points for those two important categories. The validation results are analyzed and summarized in Table 1 for all five assays we tested (see Materials and Methods).
Hit Rate for Each Quality Control Category for Five Independent Assays.
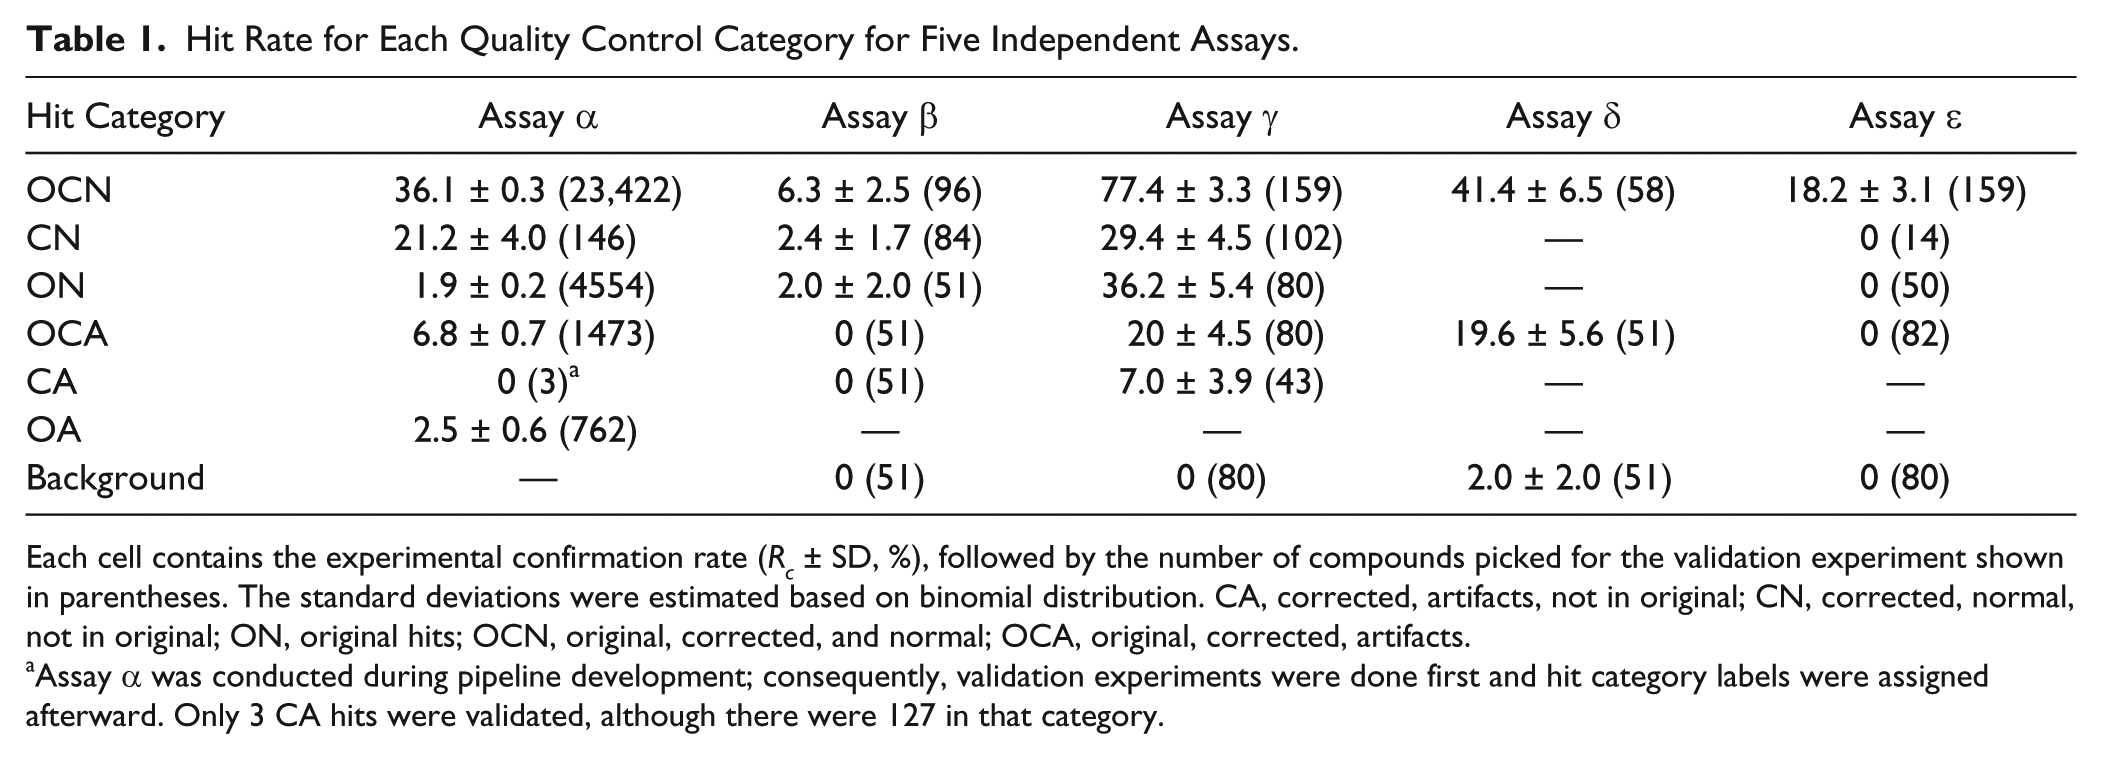
Each cell contains the experimental confirmation rate (Rc ± SD, %), followed by the number of compounds picked for the validation experiment shown in parentheses. The standard deviations were estimated based on binomial distribution. CA, corrected, artifacts, not in original; CN, corrected, normal, not in original; ON, original hits; OCN, original, corrected, and normal; OCA, original, corrected, artifacts.
Assay α was conducted during pipeline development; consequently, validation experiments were done first and hit category labels were assigned afterward. Only 3 CA hits were validated, although there were 127 in that category.
The QC pipeline prioritized hits in confidence in the following order: OCN, CN, ON, OCA, CA, and OA. The logic for this is that the hit confirmation rate for wells identified as being within artifact areas was substantially lower than that in normal wells (N > A); hits that survived step 1 (OC) showed a higher validation rate than hits rescued (N), which in turn showed a higher validation rate than hits removed (O). It is quite reassuring to see that this prioritization strategy agrees with the trend observed in experimental results listed in Table 1 . The hit categories OCN and CN almost always had higher hit validation rates than other categories, indicating they were indeed enriched by true positives and false negatives. Next, we examine the results from each individual assay in detail.
Assay α: Reduce False Positives and Retain True Positives
A total of 70,571 compound wells were labeled as hits either before or after the two QC steps during the analyses. These hits were segregated into six categories by their presence in the pipeline as described earlier ( Fig. 1 ). As experimental validation was conducted before we finished developing our QC algorithm, compounds identified as artifacts by the traditional manual QC process (see Materials and Methods) were excluded from further testing; therefore, we only have validation data for a subset of artifact wells. However, a small number of compounds tested in the validation screen were wells identified by auto-QC as artifacts but missed by manual QC. These represent subtle artifacts, not apparent from manual inspection, and the confirmation rate of the OCA class of hits at 6.8% is arguably an overestimation. Despite this limitation, this assay still has the most number of compounds that went into validation in five of six categories; therefore, its results are discussed to the greatest detail here.
The results of the six hit categories can be visualized by a Circos plot ( Fig. 5 ). 13 After the first interplate signal correction step, ~57% of the original hits (light purple) were retained as corrected hits (dark purple). Around 69% of the first-step corrected hits survived the large hit area elimination step. Among the 28,541 final hits, 27,462 (96%) were already included in the original list (OCN), and the correction step added only very few new hits (CN) (4%). All 70,571 unique hits were divided into six categories, and their corresponding confirmation status obtained in the validation was shown as callouts and used to estimate confirmation rates (shown as percentage values in Fig. 5 ).
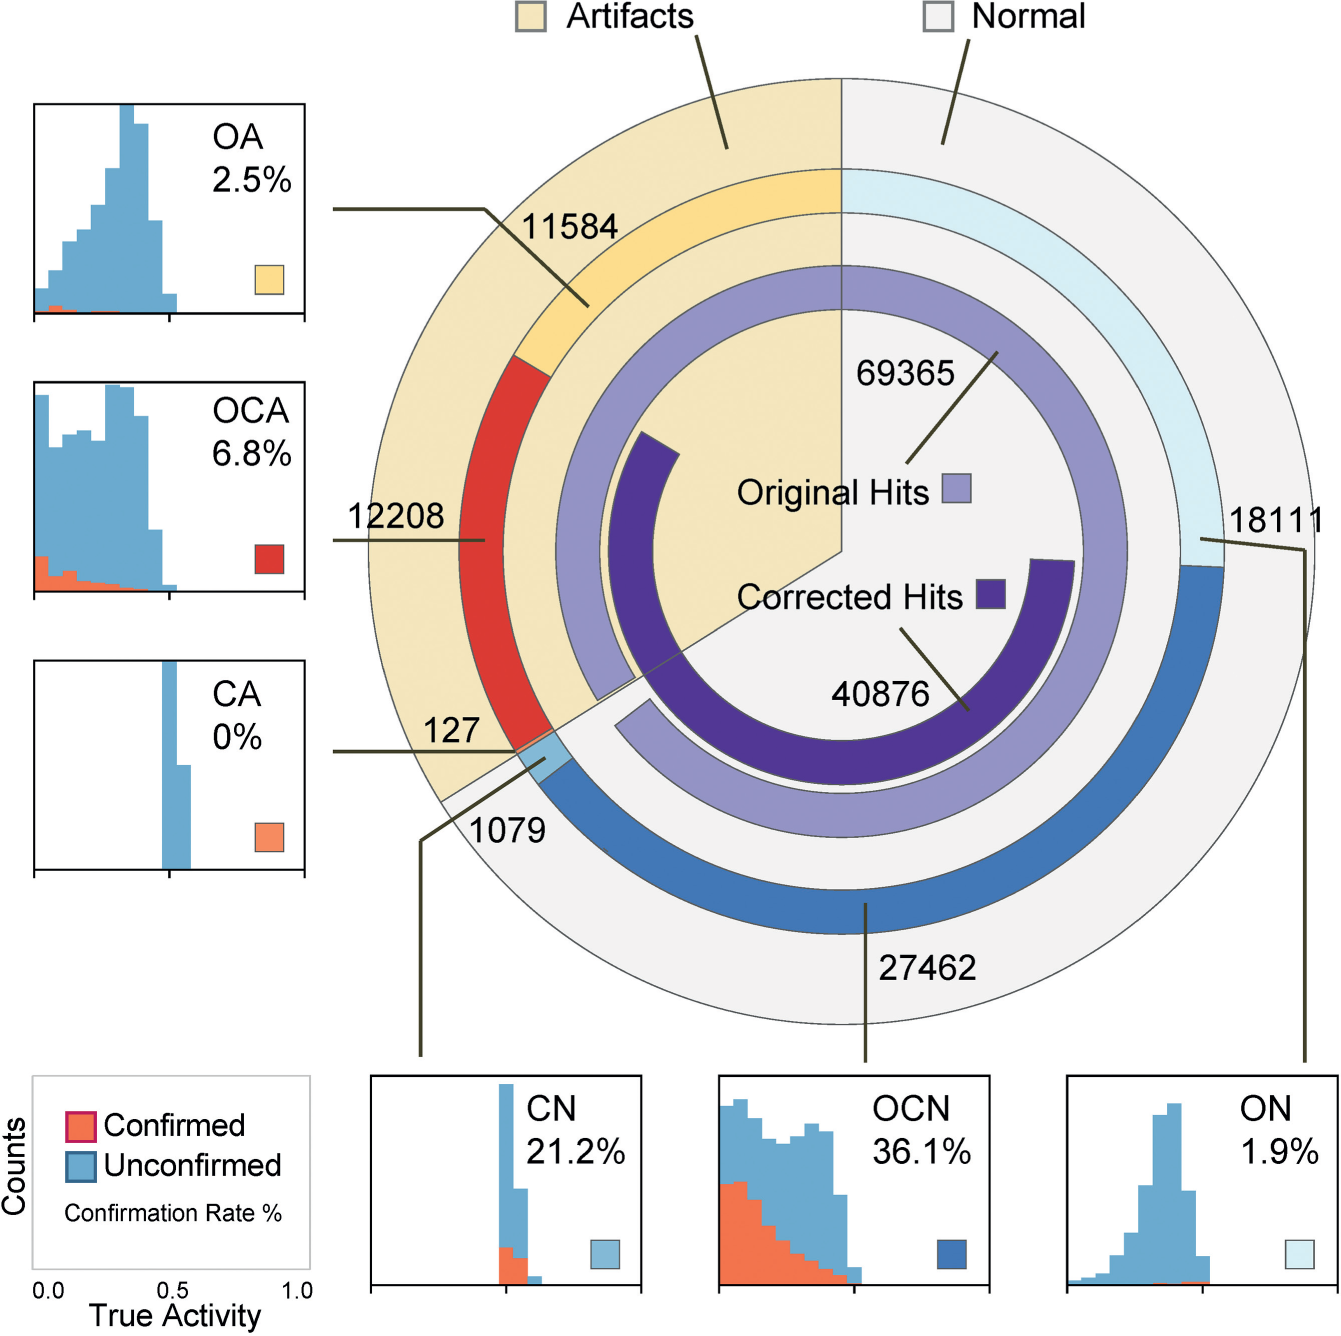
Hits of six categories and their confirmation rate estimations. All unique hits are laid out in a circular form, that is, the angular span of each arc is proportional to the corresponding number of hits (hit counts are shown near the arcs). Histograms of “true” hit activities are shown for each category, where confirmed hits with activities less than 0.5 are colored in orange. Estimated confirmation rates are the percentage values within each histogram.
Estimated confirmation rates enabled us to compare the three hit lists: 69,365 original hits (screening hit rate: 2%), 40,786 corrected hits, and 28,541 final hits after both QC steps. Although the total number of hits was significantly reduced by each QC step, the confirmation rate (the true confirmation rate based on validated compounds), Rc, steadily increased from 28.7% to 34.3% (p = 1 × 10−45) to 36.0% (p = 7 × 10⁻⁵), and the estimated total number of confirmable hits remained about the same. An alternative way of interpreting the result is, among all the estimated true hits, 87% were successfully captured by OCN and CN as TP hits. OCA and ON contained around 13% of the remaining FN hits each, and CA contained only a negligible portion. We believe the real result is even better, as the experiment overestimates the confirmation rate for OCA. If OCA validation candidates had been selected randomly without manual filtering, the majority of OCA hits would likely be true artifacts, and the QC pipeline would retain 98% of the TP hits by losing only 2% of FN hits.
Assay β
Among the ~1 million compounds screened, 7166 original hits (screening hit rate: 0.7%) were corrected as nonhits and 210 compounds were introduced as new hits by the first QC step. The large difference in the number of compounds in these categories suggested systematic errors existed in the screen. Two interplate patterns are shown as examples: a four-row stripe possibly due to pipetting errors (
Further visual examination shows nearly all positive hits were retained by QC. The 2% confirmation rate for ON, not statistically significantly different from 0%, is likely an overestimation. The majority of sampled ON hits, 48 of 51, originated from the dark region present on several plates (
Assay γ
Visual inspection showed that this screen is of good quality, agreeing with the observed Z′ factor >0.5 for most of the plates. The QC pipeline removed 2470 original hits (screening hit rate: 0.08%), introduced 2053 new hits, and flagged 1130 wells as artifacts. The comparable number of original hits (ON) and new hits (CN) indicates that the systematic errors in this screen are not significant; therefore, automatic QC only results in small shifts in compound activities. For those compounds near the hit cutoff, there is a roughly equivalent chance of being labeled as a hit or nonhit. Therefore, CN and ON have about the same true hit rate of 29% and 36% (with 5% standard deviation), respectively. OCN has the highest true hit rate of 77%. Artifact categories OCA and CA, as well as the nonhit category, have the lowest hit confirmation rates, decreasing from 20% to 0%. The outstanding true hit rates of OCN proved that our QC algorithm is apt at identifying and prioritizing true hits based on their category labels: OCN versus CN. Given the large number of true hits for this assay, it could be used to enable compound prioritization for subsequent assays, where the number of original hit compounds exceeds the capacity for follow-up.
The relatively high validation rate of OCA (20%) in this assay was due to plates being flagged to contain many redundant structures (i.e., colocation of structurally similar and active compounds on the same region of a plate led to some of the wells being labeled as artifacts). Due to the irregularity of such areas of hits, a subset of wells is typically retained as OCN hits, so the second QC step in effect performs a structural diversity selection on these hits. Alternatively, we could alter the algorithm to retain all hits from such plates and run a separate diversity selection using an SAR-based hit selection algorithm.14,15 In any case, it is normal to reduce the number of compounds selected for follow-up assays, where large clusters of compounds show low structural diversity, by selecting a representative subset from each cluster.
Assay δ
Similar to assay γ, there are no obvious systematic errors. The total hit rate is ~0.32%, and the 2% estimation of the background hit rate is an overestimation due to statistical sampling (only 1 of 51 samples was confirmed). After applying automatic QC, only one original hit was removed and no new hit introduced, so there were not enough data for validation in CN and ON. The OCN category has the highest Rc value of 41%. The OCA category has a confirmation rate of 20% due to plates containing redundant compounds, similar to assay γ. The QC pipeline prioritizes OCN and CN hits over OCA; however, one could certainly select OCA candidates for follow-up if feasible, but these were predicted to have a significantly lower confirmation rate.
Assay ε
Consistent with other results, the screening hit rate is 0.9%, the hits from the OCN category have the highest confirmation rate of 18%, and no hits were confirmed in all other categories. The automatic QC works perfectly in this assay.
It is noteworthy that the results from assay γ, assay δ, and assay ε indicate there is no penalty in applying the QC pipeline to an assay that is free of QC issues, which is an essential requirement to enable the method to be integrated into all existing HTS analysis pipelines.
These five screens were chosen purely based on the availability of collaboration opportunities without any bias. All five results show OCN, the category the QC pipeline labeled as the most reliable, to have the highest Rc value. Based on the significance of systematic errors, category CN could have a similar or higher hit rate than ON. Artifact categories OCA and CA generally had the lowest true hit rates, and alerts were issued to plates where artifact counts are high due to structural redundancies. These results, combined with the in silico validation results across ~100 assays, provide robust proof that the automatic QC algorithm we developed is very effective in removing/deprioritize false hits and enriching true hits in categories OCN and CN.
Discussion
Previous systematic error correction algorithms, such as median polish smoothing, parametric or nonparametric surface fitting, and orthogonal function expansion, were primarily designed for processing a single plate. 5 They are optimized for either smooth or stepwise background patterns but not for both. Algorithms, such as plate averaging and change point detection, take advantage of signals from multiple plates to overcome such limitations but face the challenge of how to effectively identify reference plates sharing similar error patterns. Interplate algorithms, such as plate averaging, tend to lose sensitivity if a reference group is too large, such as when the original WC method failed to correct the erroneous patterns in assay α. In algorithms such as change point detection, sensitivity is gained by relying heavily on the assumption that plates in temporal proximity share similar distortions; they do not handle exceptions reliably. Special plots such as assay heatmaps could help visually reveal interplate systematic errors, but determination of the exact number of plates involved in error correction and identification of the group boundaries still require careful human curation efforts. The key to achieve automated plate grouping in our pipeline is to generate overlapping plate groups (i.e., allow a plate to be used in multiple reference groups by converting a partition-based clustering problem into a straightforward pairwise plate similarity calculation problem, thus fully automating the identification of reference plates). We should bear in mind that although the majority of systematic errors can be effectively corrected using the new algorithm, a few target plates that fail to recruit a sufficient number of reference plates can certainly benefit from the more aggressive intraplate systematic error correction algorithms mentioned above. 5
The automated QC pipeline shall be applied at the beginning of an HTS data analysis workflow, before any structure-driven hit-picking analyses. This is because QC aims to produce high-quality data as inputs to downstream hit-picking algorithms; therefore, we do not compare this upstream QC pipeline with other downstream hit-picking algorithms. On one hand, the QC pipeline does not rely on biological properties of the assay or structural properties of the compounds, which means similar performance is expected across all screens. On the other hand, the QC pipeline still allows all published structure-based hit-picking algorithms 13 to be applied subsequently to the QC output to further enhance the hit quality and even address the “abnormal confirmation curve” challenge.15,16 The interpretation of the QC output could benefit from downstream analyses. Although the automated QC pipeline prioritizes hits into categories of decreasing confirmation rates, the exact confirmation rates vary across assays ( Table 1 ) and are not available prior to validation. In silico estimations of true-positive rates based on SAR and false-negative rates based on test screens 17 could lead to a better hit prioritization strategy.
Before this fully automated QC pipeline was implemented, performing QC on a large-scale screen as the ones used in this study had been very time-consuming. Although algorithms were developed to flag spots and stripes, each image had to be carefully examined, and there was no clear guideline on how large an area of hits had to exceed to be considered artifacts. For a screen involving more than 2000 plates, the process usually took a few days, and results could be rather inconsistent depending on the QC thresholds applied. With the aid of statistical simulations, the minimum size of the contiguous artifact hit areas was carefully studied for all possible hit rates, and the results could be applied to all screens. With both improvements, screens of similar size can now be automatically processed within an hour.
In this article, we proposed a fully automated high-throughput data QC pipeline that can identify and correct both interplate systematic signal errors and intraplate artifacts. Distinguishing from previously published approaches, it requires no human intervention, with significantly reduced analysis time. Experimental validation in five assays further validates that the QC process is adept at keeping as many of the true hits as possible while removing false-positive and picking up additional false-negative wells, leading to improved confirmation rates. Detailed in silico analysis based on pre- and post-QC HTS matrices reveals that the auto-QC process significantly strengthens SAR across 98 historical screens, which suggests the algorithm could be universally effective. This general pipeline can be integrated into existing analysis workflows in large screening facilities and accelerate the lead discovery process.
The Python implementation of the described auto-QC algorithms is made available to the screening community at http://carrier.gnf.org/publications/HTSQC.
Footnotes
Acknowledgements
We thank Jason Chyba, John Joslin, Annie Mak, and Yu Wang for their generous help performing the experimental validation.
Declaration of Conflicting Interests
The authors declared no potential conflicts of interest with respect to the research, authorship, and/or publication of this article.
Funding
The authors received no financial support for the research, authorship, and/or publication of this article.
References
Supplementary Material
Please find the following supplemental material available below.
For Open Access articles published under a Creative Commons License, all supplemental material carries the same license as the article it is associated with.
For non-Open Access articles published, all supplemental material carries a non-exclusive license, and permission requests for re-use of supplemental material or any part of supplemental material shall be sent directly to the copyright owner as specified in the copyright notice associated with the article.