
Abstract
In this article, we describe two complementary data-mining approaches used to characterize the GlaxoSmithKline (GSK) natural-products set (NPS) based on information from the high-throughput screening (HTS) databases. Both methods rely on the aggregation and analysis of a large set of single-shot screening data for a number of biological assays, with the goal to reveal natural-product chemical motifs. One of them is an established method based on the data-driven clustering of compounds using a wide range of descriptors,1 whereas the other method partitions and hierarchically clusters the data to identify chemical cores.2,3 Both methods successfully find structural scaffolds that significantly hit different groups of discrete drug targets, compared with their relative frequency of demonstrating inhibitory activity in a large number of screens.
We describe how these methods can be applied to unveil hidden information in large single-shot HTS data sets. Applied prospectively, this type of information could contribute to the design of new chemical templates for drug-target classes and guide synthetic efforts for lead optimization of tractable hits that are based on natural-product chemical motifs.
Relevant findings for 7TM receptors (7TMRs), ion channels, class-7 transferases (protein kinases), hydrolases, and oxidoreductases will be discussed.
Keywords
Introduction
Natural products (NPs) have been and still remain an important source of medicines. The World Health Organization (WHO) estimated in 1985 that approximately 65% of the global population relied on plant-derived, traditional medicines for their primary health care. 4
According to Cragg et al., 4 from 1981 to 2010, more than 60% of all small-molecule new chemical entities (NCE) were NPs, NP semisynthetics, or derived from an NP pharmacophore. This proportion is challenged by Bade et al. 5 to be closer to 30%, arising from differences in interpretation regarding whether an NP is indeed the origin of its derivatives or its progeny semisynthetic compounds. In any case, the significance of the NPs as a formative source of the marketed drugs is unquestionable. Following the explosion of combinatorial chemistry in the late 1990s, interest in drug discovery from NP sources became “unfashionable.” One consequence of this change from NP to combinatorial libraries was that drug discovery revolved around compound libraries of comparatively simpler structures, which contained chemical “scaffolds” that lacked the structural complexity and diversity afforded by NPs. Accordingly, combinatorial libraries with millions of compounds are perhaps better suited for rapid lead optimization than for the discovery of tractable hit compounds containing the structural elements of NPs, with properties that promote “molecular trafficking” to intracellular drug targets, and more favorable toxicity profiles.
Various authors have recently analyzed differences in molecular properties and structural features between NPs and synthetic molecules.6–8 Attending to the principal molecular descriptors, the NPs typically have increased rigidity, more sp 3 centers and ring fusions, and fewer aromatic rings; are oxygen rich; and have clogP values much lower than the “Rule of 5” limits. 9 The NP-likeliness score 6 is a useful measure that can help guide the design of molecules toward interesting regions of chemical space that have been identified as bioactive regions by natural evolution. The importance of the use of NP–like scaffolds for generating more useful combinatorial libraries has been emphasized by Borman et al. 10 In this article, it is stated that the NP–like compounds produced in diversity-oriented synthesis (DOS) have a much better shot at interacting with the desired molecular targets and exhibiting interesting biological activity. More recently, the concept of biology-oriented synthesis (BIOS) has been introduced as an approach to access unexplored NP chemical space. 11
Different data-mining approaches of high-throughput screening data have been fundamental tools for the establishment of quantitative structure-analysis relationships (QSAR) from primary data.12,13 Recent trends include the application of kernel-based machine-learning methods for the design of focused libraries and compilation of drug target-family biased compound collections. Lachance et al. have developed a scaffold-based, hierarchical classification of natural-product chemical space. 11 Scaffold Hunter, a Java-based computer program, facilitates interactively the visualization and navigation of NP chemical space through “scaffold trees.”
Since 2006, GlaxoSmithKline (GSK) has been maintaining the natural-products set (NPS) that today consists of approximately 13,000 compounds from various sources. In the period 2009–2011, more than 80 “single-shot” (SS) high-throughput screening (HTS) campaigns have seen all or part of the NPS. The campaigns are widely distributed in the GSK portfolio and include target classes such as enzymes, ion channels, protein kinases, and 7TM receptors. In this article, we describe two complementary data-mining approaches used to characterize the GSK NPS-based information from the HTS SS databases. Both methods rely on the aggregation and analysis of large amounts of data (SS activity) against a wide variety of discrete drug targets, with the aim to reveal patterns missed in smaller data sets. They both find structural features (here called frameworks and cores, respectively) that significantly hit different groups of targets, compared with their relative frequency of activity in a large number of screens.
In general, the complexity of NPs limits the synthesis of analog libraries, and also the exploration of their potential in biomedical research and drug discovery. 11 Applied prospectively, the information we provide in this article could contribute to the design of new chemical templates and guide synthetic efforts based on NP motifs.
Relevant findings for 7 TM receptors (7TMRs), ion channels, class-7 transferases (protein kinases), hydrolases, and oxidoreductases will be discussed.
Materials and Methods
Data Sources, Preprocessing, and Basic Definitions
The data sets, including the primary screens, were retrieved from the GSK HTS database. Typically, primary screens comprise more than 1 million single compounds at 10 µM concentration and discrete single recombinant human targets (biochemical and cellular assays).
Only one result per compound has been included in the matrix; in case of replicated data, the biggest response was taken (2–3% total replication). When there were discrepant replicates (i.e., hit and nonhit) for one compound, by default the hit mark was considered (discrepant data <1% of total duplicates). We have validated any agglomerative calculation (by column or row) when available data were more than 50%; by default, any missing data are designated as a nonhit (percentage of missing data for reported results <5%). As a general rule, only those groups with more than three targets have been considered in the analysis.
The GSK standard practice for hit marking (single shot) is based on the statistical significance of the individual compound responses with regard to the whole population of every screening campaign. 14 It basically depends on whether their single-shot activity in the corresponding screen has been higher than the mean plus a given number of standard deviations (calculated with a robust algorithm) 18 of the activity distribution. The methods described in this article consider a hit to be any compound over two or three standard deviations, respectively.
The Inhibition Frequency Index (IFI) is a promiscuity annotation per compound; it is defined as the ratio of the Number of Times the Median Value of % Inhibition > X % to the Number % Inhibition instances recorded in unique assays, where X can be referred to a fixed relevant value (typically, 50% inhibition), or to 2–3 times the robust standard deviation of the population. More than 95% compounds had been assayed in at least 10 unique assays (mode [50–100] assays per compound).
When required, data results were binary coded (0/1) according to their categories already reported (i.e., nonhit or hit; and nonpromiscuous or promiscuous).
Method to Identify Significant “Frameworks”
We have applied the data-driven clustering algorithm described by Harper et al. 1 The algorithm normally works with activity data approximately bounded in the 0–100 range, typical of single-shot screening results. To use the system for data sets corresponding to groups of targets or screens, we have implemented the following criterion: the “activity” value of a compound in a group of targets is defined as the percentage of targets in which the compound is a “hit.” Thus, if a compound is a hit in 30% of the targets of a given target group, an “activity” value of 30 is assigned to it when analyzing that target group with the data-driven clustering algorithm. The distorting effect that promiscuous, generally active compounds could have in the activity values so defined was prevented by removing from the analysis all the compounds hitting 15% or more of all the screens conducted in GSK (this eliminated 424 compounds from the data set). The algorithm was run with each target group analyzed to find significant chemical motifs associated with them. Only clusters with at least 10 members (individual compounds) were further considered for analysis. These clusters were ranked according to their average activity for prioritization.
As descriptors or chemical motifs for the algorithm, frameworks based on those of Bemis and Murcko 19 were used. These included three different types of frameworks, corresponding to increasing abstraction of the molecular graph: 1 those obtained by recursively removing all vertices with degree one from the graph; those obtained in addition by removing the atom type label (e.g., C, N, O, etc.) from the vertices, although keeping the bond order information; and those also removing the bond order information, leaving a simple graph with only vertices and edges.
The algorithm works by iteratively scoring the different possible clusters and removing from the set of unclustered molecules the cluster with the highest score at each step. The score is defined as equation 1:
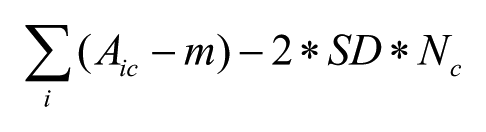
where Aic is the activity of molecule i of cluster c; m and SD are the median and the standard deviation of the whole data set, respectively; and Nc is the number of molecules in the cluster. This score penalizes the clusters with a large number of molecules with weak activity. The algorithm stops when no more clusters of a minimum user-defined size can be generated.
Method to Identify Significant “Cores”
The modeling program Molecular Operating Environment (MOE) contains a module called SA/Report 2 that is typically used to visualize structure–activity and structure–property relationships (SAR and SPR, i.e., the correlation of molecular scaffolds and their attached R-groups with target activity or physicochemical properties). Input for the program is a MOE database that includes a molecule field and multiple activity and/or property fields, and optionally a set of user-specified scaffold definitions with or without numbered R-groups. SA/Report has scaffold auto-detection functionality built in, using Schuffenhauer’s fragment decomposition algorithm 16 to extract additional scaffolds from the input molecules in addition to any user-specified ones. This functionality is, however, tuned to detect scaffolds from data sets that contain a few congeneric series, and it fails to find all frequent scaffolds within a diverse HTS data set. To achieve the latter aim, we have used an interactive algorithm [implemented in cmnfrag.svl, available in the MOE Scientific Vector Language (SVL) exchange] as described in this article.
Given a database of molecules, the method fragments them hierarchically by Schuffenhauer’s method,
16
so that one ring (whether aromatic or aliphatic) or outlying group is successively stripped away from each molecule until only a single ring remains. Molecules are then grouped by which fragments they contain, at each level of the hierarchy (level 1 being single rings and higher levels having larger connected or fused-ring systems). Fragments are then ranked using a score based on the product of their frequency (the number of molecules containing each fragment), size (the number of heavy atoms), and maximum MACCS fingerprint similarity
17
to the already selected scaffolds (to favor rapid selection and grouping of similar cores). As shown in the screen shots in
To find the cores that significantly hit groups of targets, we have applied dual hierarchical data clustering in TIBCO Spotfire (TIBCO®Spotfire®©2007–2012 Software Inc.). We used a heatmap visualization of coded screening results (0 inactive and 1 active), in which rows correspond to compounds and columns to assays. The weighted pair-group method with arithmetic mean (WPGM) with Euclidean distances was used as a hierarchical clustering algorithm to group data in both row and column dimensions. These hierarchically clustered heat maps were inspected, and cores were selected for further study if targets from a particular assay group with many active compounds were close together on the X-axis dendrogram while not being closely correlated with the IFI column in the tree (we consider a compound as promiscuous when its IFI value ≥5% for a 50% inhibition cutoff). Structure–activity relations (SARs) of the core members active within an assay group were also examined and used to prioritize cores, in particular while evaluating the structural similarity of the actives and differentiation from high-IFI compounds.
Another filter used to differentiate promising cores from background and noise was to compare the fraction of compounds active in an assay of interest, within the core, to that fraction in the entire NP set. For example, if a particular oxidoreductase from Class 14 had a background hit rate of 2%, a core in which 6 out of 300 members had that activity was not of interest, while one in which 8 out of 50 members (16%) had that activity was definitely interesting.
Finally, an enrichment criterion was used to report only scaffolds that were eight times or more frequent within the NP Set than in PubChem. Enrichment for a scaffold was calculated as the ratio of its frequency within the NP set (Number of Occurrences/12043 Unique Compounds) to frequency within PubChem (Number of Substructure Hits within PubChem/Number of Organic Molecules in PubChem, ~30 million). Substructure hits in PubChem were computed using a script making RESTful web service calls to the PubChem Search Server (http://tripod.nih.gov/pcs).
Results
With the goal to experimentally validate the data-driven clustering method applied to target groups, historical pIC50 data of the GSK databases were mined to see if the molecules containing a particular, salient chemical motif with a given target group are enriched in large pIC50 values for targets of that group. For instance, the results of three target classes—7TM receptors (7TMRs), ion channels, and protein kinases—are shown here. Table 1 collects the frameworks (FWs) with more than 10 members, showing the highest average activity for these three target groups. A total of 151, 1904, and 38 molecules were retrieved from the GSK screening collection that contained the respective frameworks. For each of these sets of molecules, all the pIC50 data available from HTSs run in GSK were retrieved and classified by target classes. The fraction of “active” data points (assumed as pIC50 > 6) was calculated for each target class. For a framework to be well validated experimentally for a given target class, one would expect that the fraction of pIC50 > 6 for that target class would be significantly higher than with other target classes, and that the fraction observed would be obtained from a large number of molecules.
Frameworks with the Highest Average Activity.
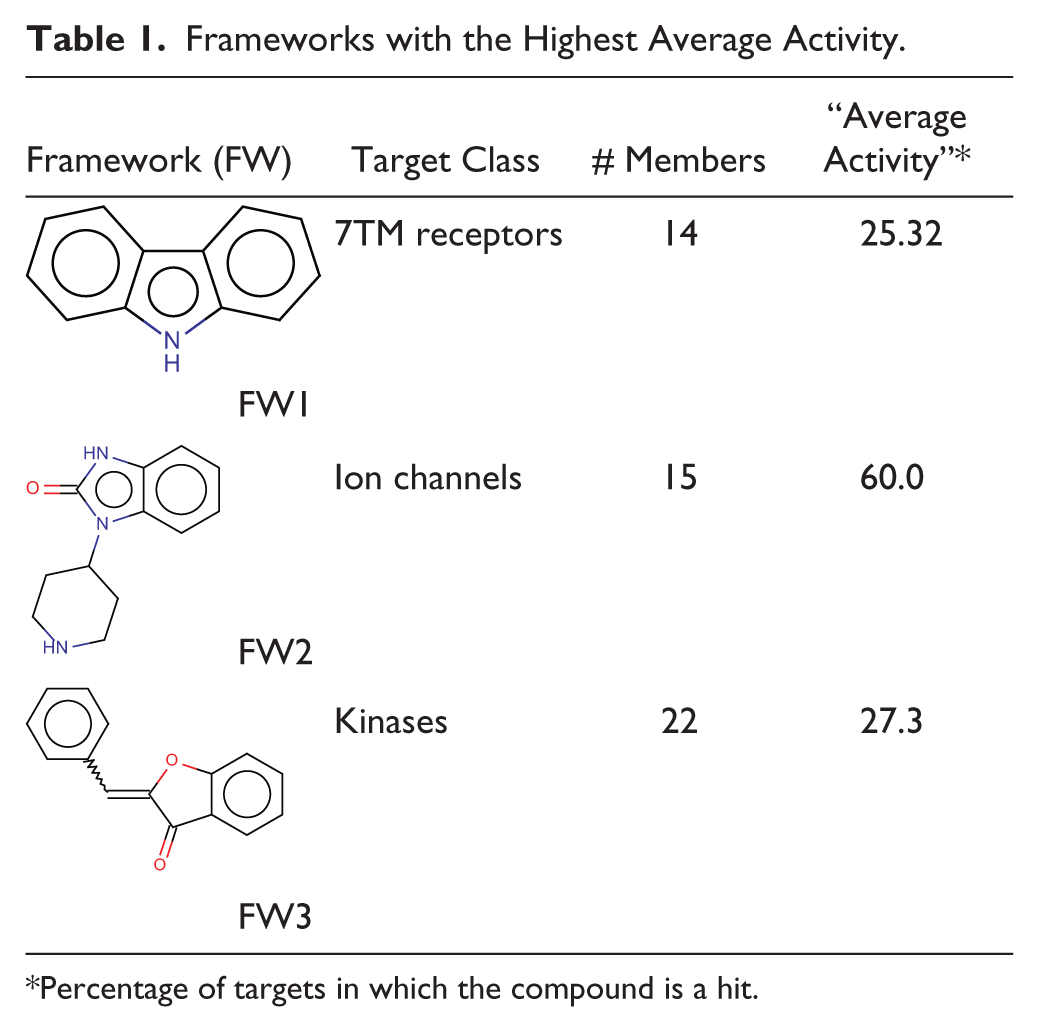
Percentage of targets in which the compound is a hit.
Figure 1 (A-C) displays the fractions of pIC50 > 6 for frameworks FW1, FW2, and FW3, respectively. In the case of FW1, a putative 7TMR chemical motif ( Figure 1A ), the highest fraction of pIC50s > 6 was obtained with transporters, followed by the 7TMR target class. It must be noted, however, that the transporter data come from only 17 measurements, whereas in the 7TMR case the fraction is calculated from many more data points, namely, 142. We could therefore conclude that FW1 appears as a well-validated 7TMR chemical motif, while showing some evidence as a transporter motif. To clearly discern the latter, more pIC50 data for this target class would be required.
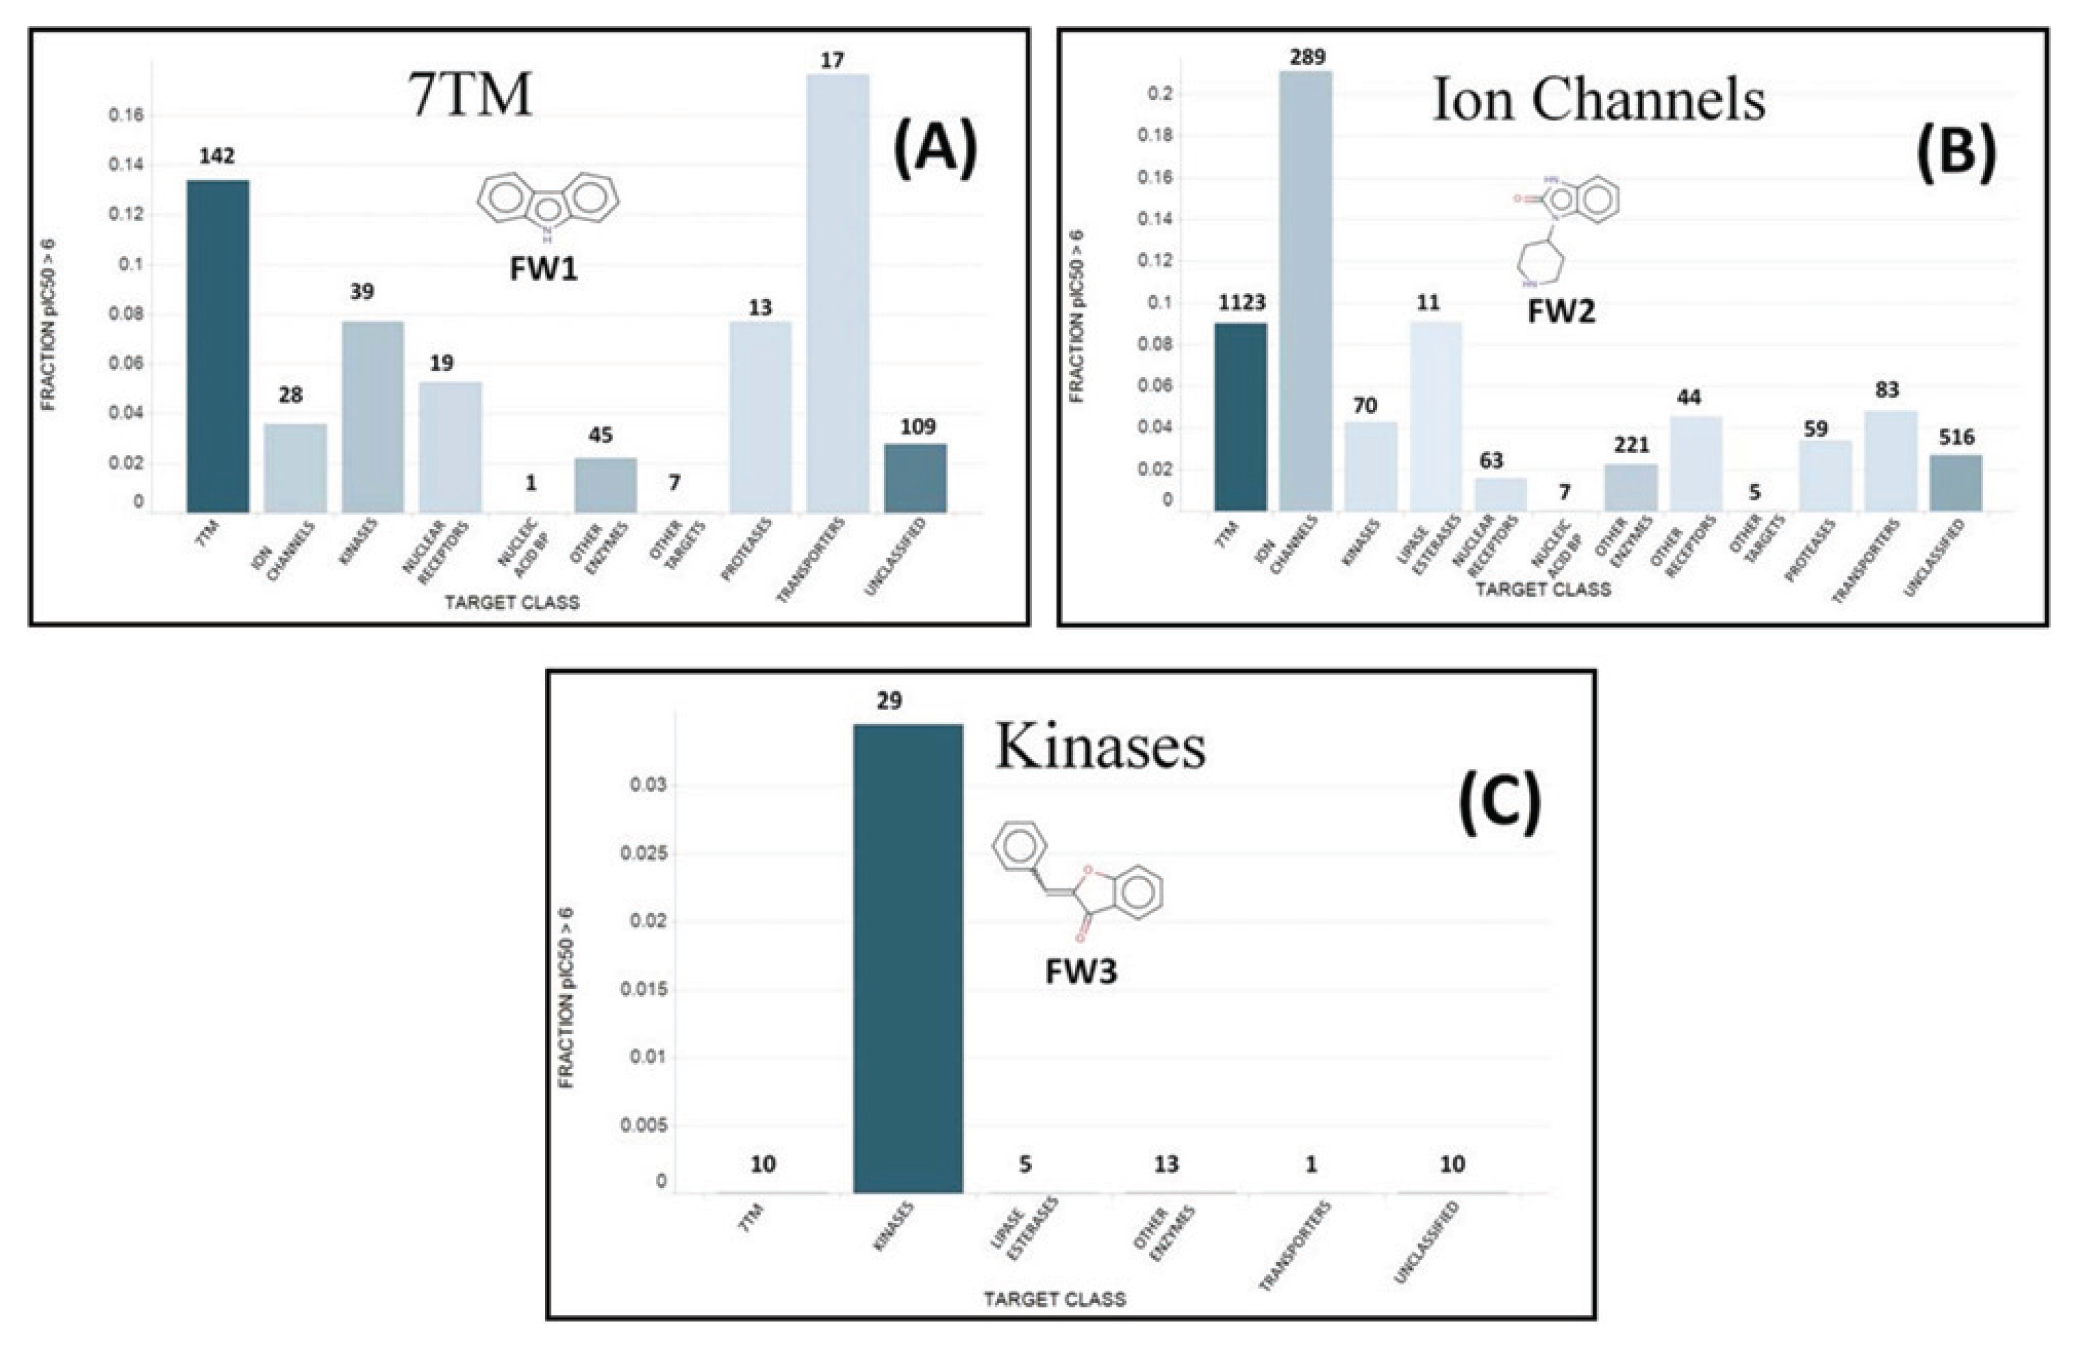
Fraction of pIC50 > 6 measurements for different target classes in the case of (
Figure 1B shows the fraction of pIC50 > 6 observed for different target classes for molecules containing the FW2 framework, standing out from the data-driven clustering algorithm as a possible ion channel motif. It can be seen that in this case, the highest fraction of pIC60 > 6 is obtained for the ion channel target class, as the data-driven clustering analysis had predicted. In addition, the fraction is well defined with a large number of data points (289). A well-defined fraction of pIC50 > 6 is also obtained for 7TMR screens (1123 measurements), but in this case the value is much lower than the one observed for ion channels.
Finally, Figure 1C displays the motif (i.e., FW3) detected by the data-driven clustering method for the protein kinase (Transferase Class 7) group. Interestingly, the motif is solely present in highly potent compounds acting on protein kinase targets but no others. The fraction is obtained from 29 measurements, and therefore it is not as well supported as in the case of FW1 and FW2. Nevertheless, the fact that it is identical to core 21, selected with the core detection method, reinforces the significance of this scaffold for the protein kinase target class.
Figure 2 illustrates 50 “cores” found in the GSK NP collection by the interactive core-selection method. We show the top 50 frequent scaffolds that were enriched ≥8 times compared to their frequency in the PubChem database. The results of a typical dendogram and the outcomes of one “core” are illustrated in Figure 3A ; out of 28 enzymatic screens, the 149 members of this core contain four from the oxidoreductase class 14 assay group (near the center of the X-axis dendrogram) that form a cluster with active compounds. The IFI column is the last one on the right-hand side of the hierarchical clustering, indicating a low likelihood of promiscuity related with the core. Figure 3B shows the core motif and five exemplars demonstrating SAR for one of the target assays. To validate findings, we retrieved the historical pIC50 data from GSK databases (“critical results”) for the cores of interest; similarly, we looked for evidence of target-class activity inferred from single-shot results being confirmed by full-curve measurements.
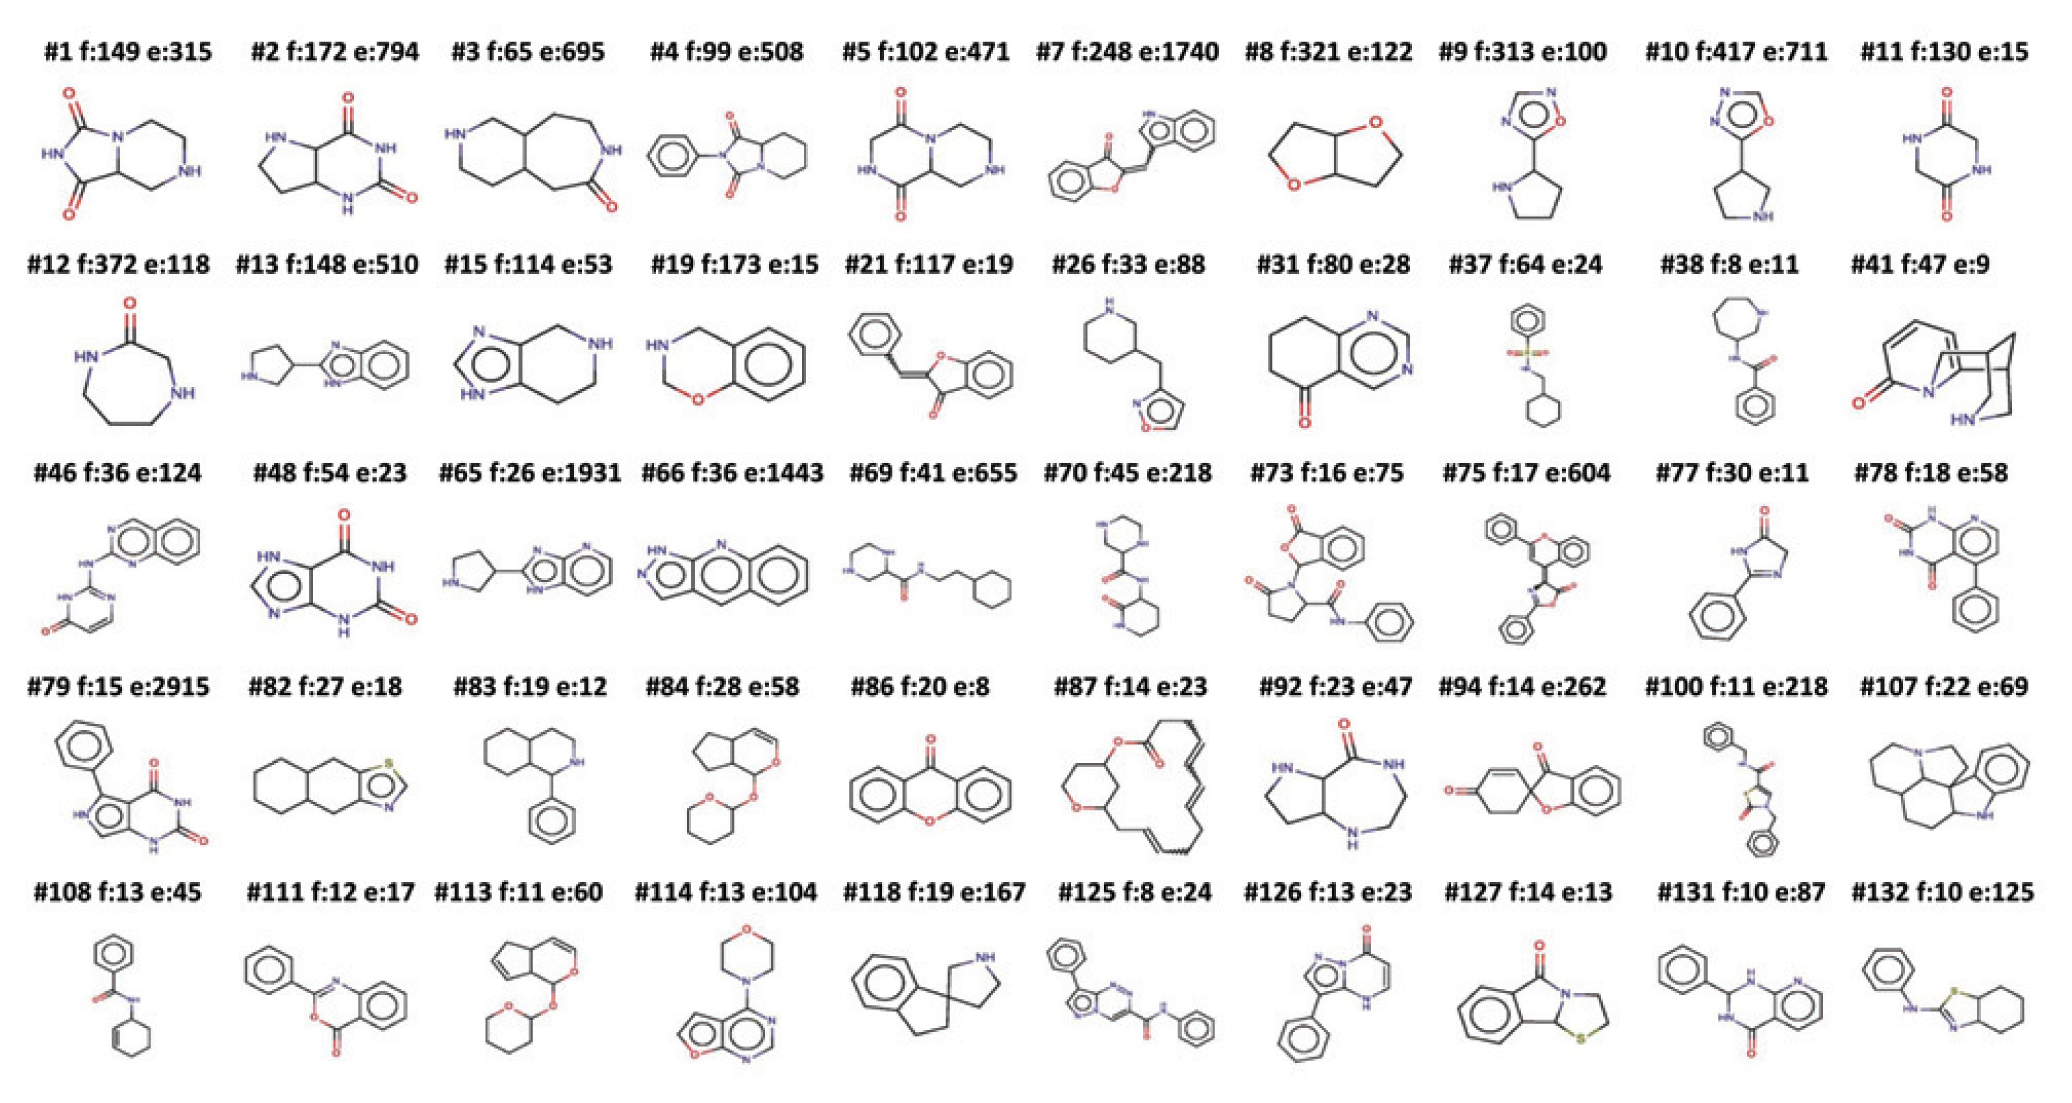
Top 50 frequent scaffolds that were enriched ≥8 times in the GlaxoSmithKline natural-product collection compared to their frequency in the PubChem database. Each scaffold is labeled as #, scaffold number; f, frequency in the natural-products set (NPS); and e, enrichment in NPS over PubChem; and is calculated as (f/12043) / (PubChem Frequency / 30 Million).
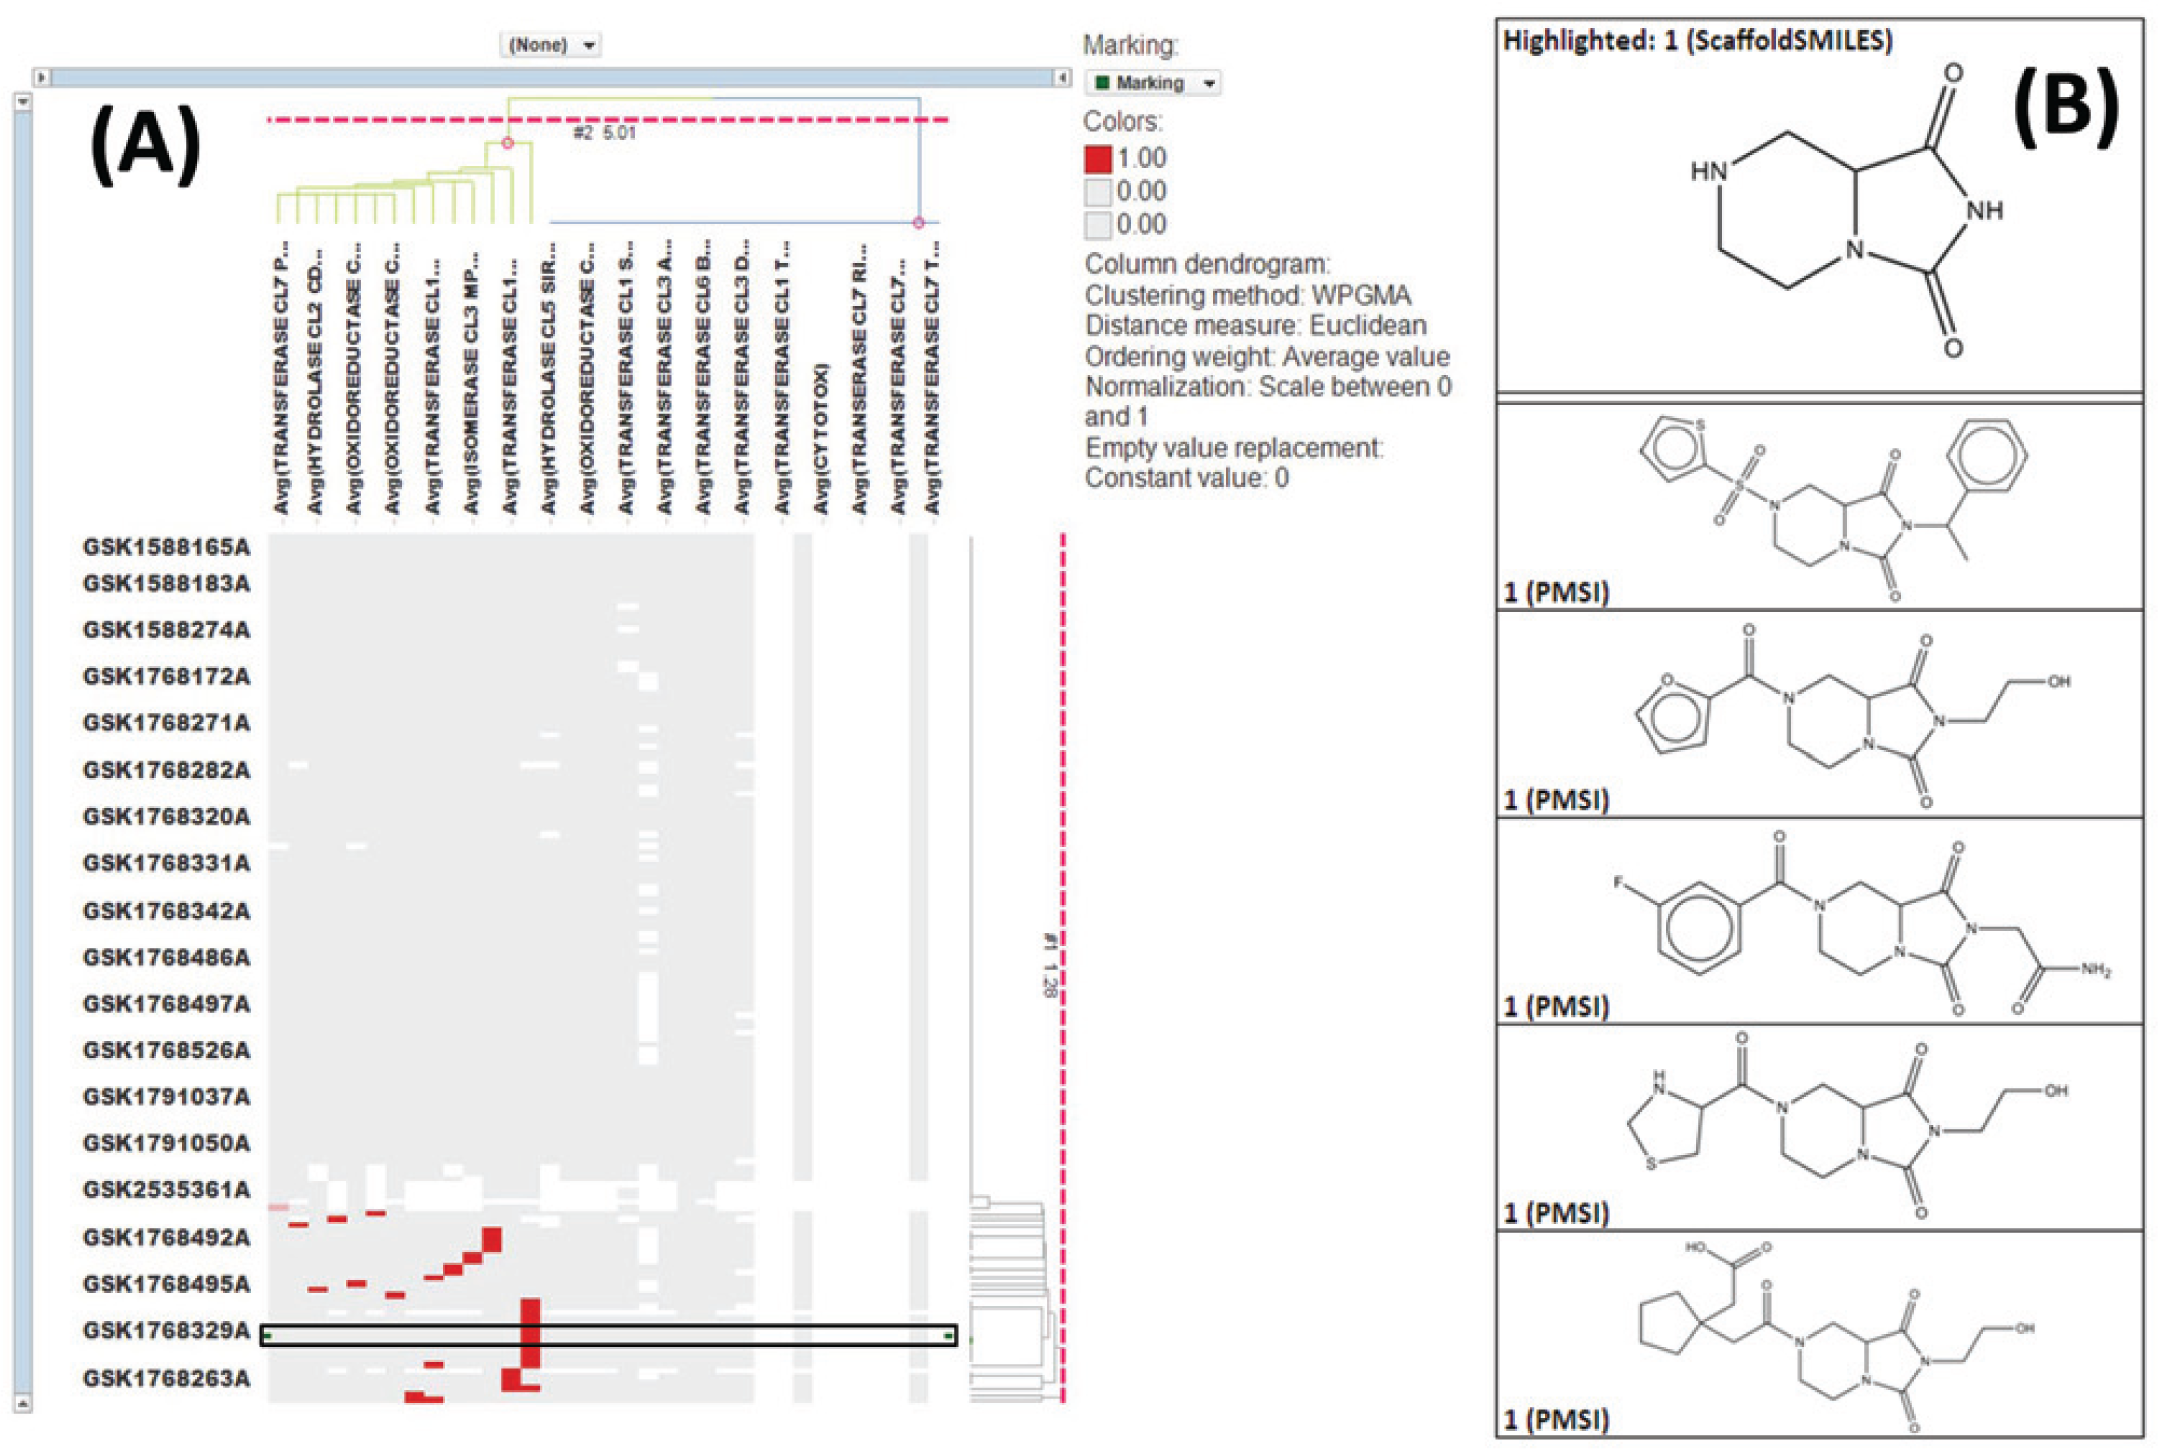
Results of a typical dendogram and outcomes of the core-selection method. (
In
Table 2
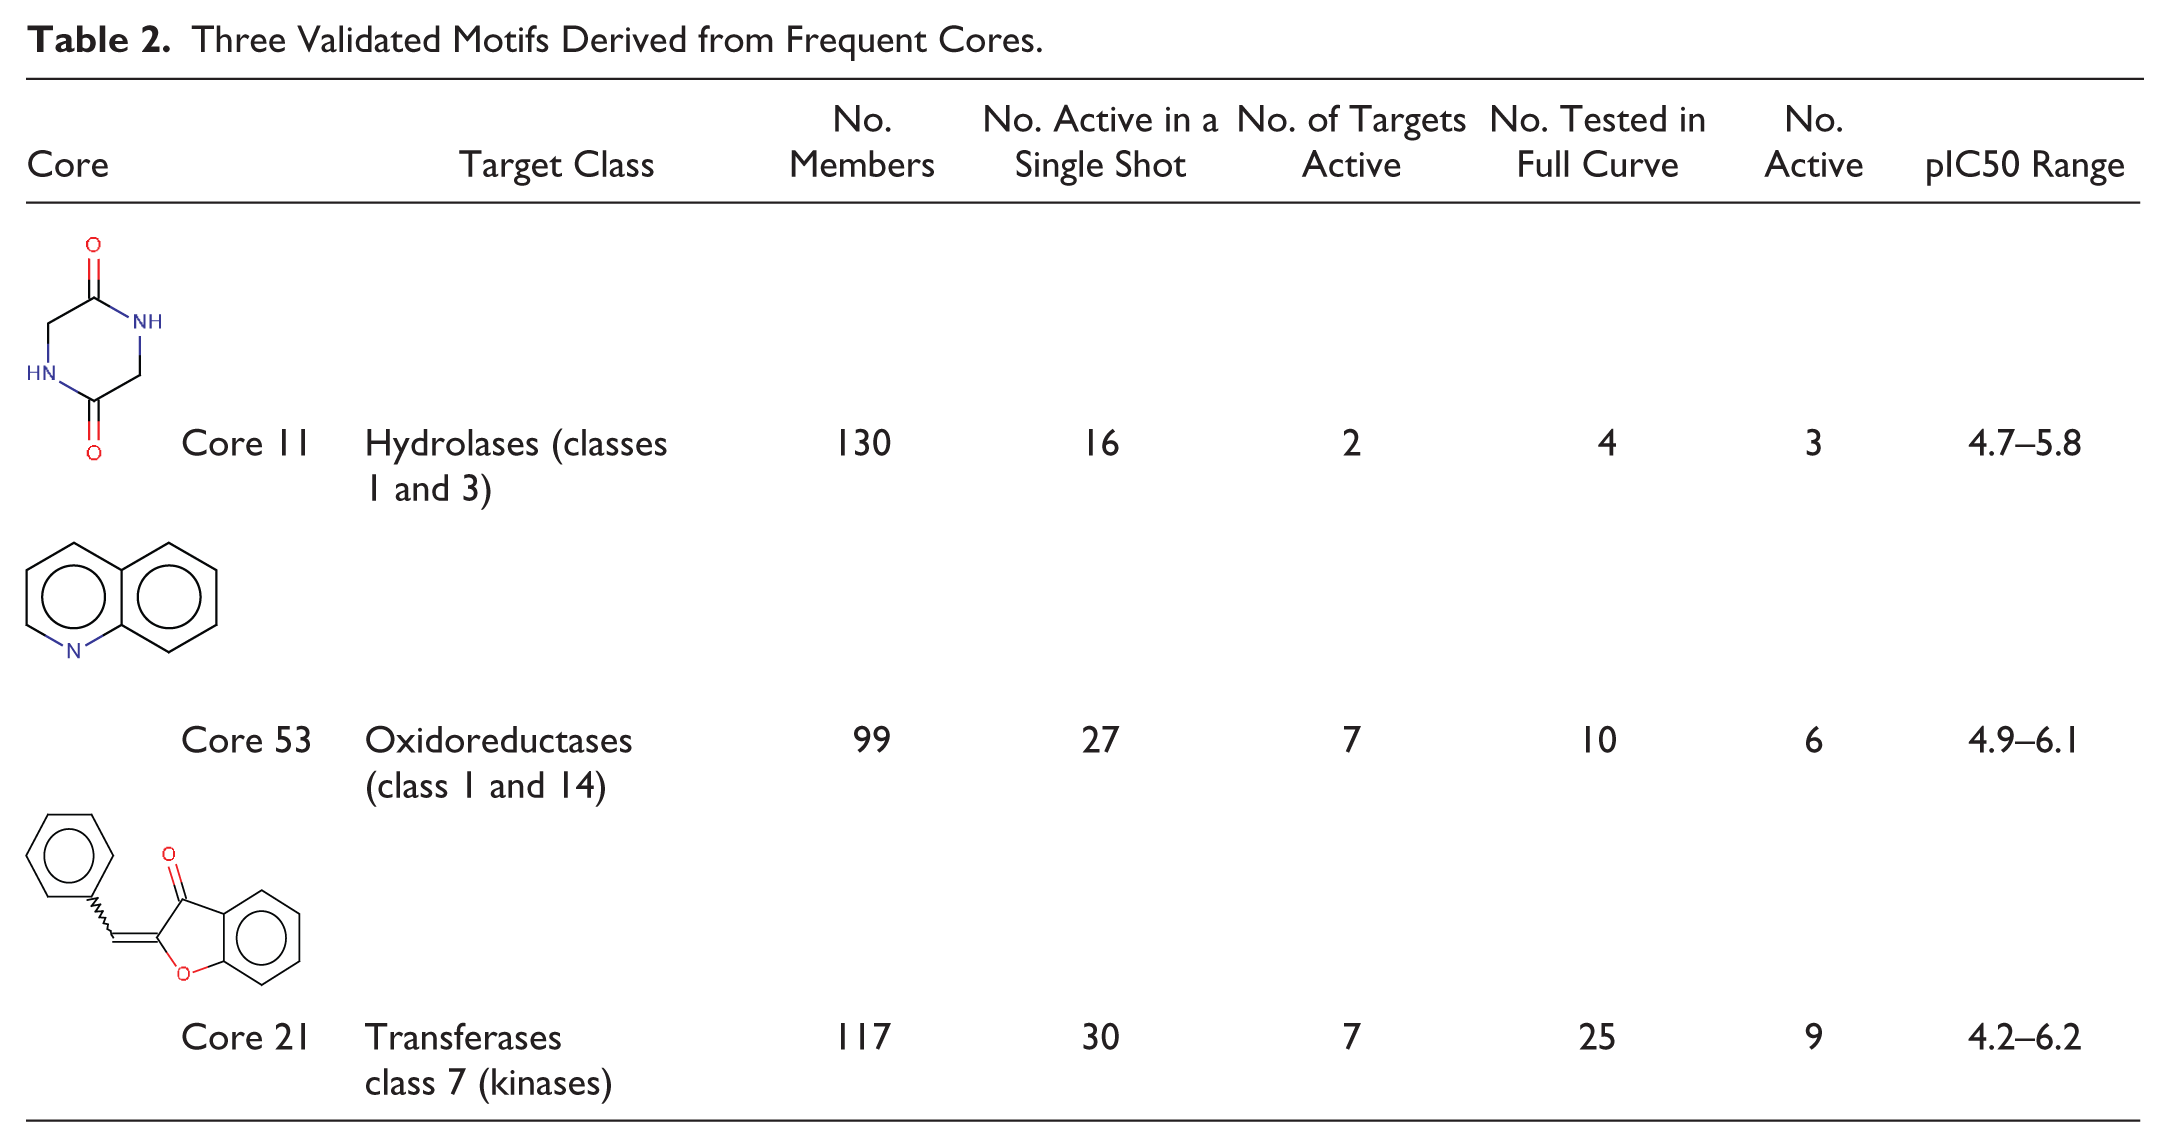
, we describe three validated motifs derived from frequent cores; many more cores with strong inferences for a target-class activity remained untested for activity in full-curve at the time of writing. In the first row of
Table 2
, we show core 11, with 130 members in the NPS, 16 of which formed a cluster in which hydrolase class activity was inferred from hierarchical clustering of the single-shot data. Among four of these compounds that were tested in full-curve for any hydrolase, three of them were active in either a Class 1 or a Class 3 hydrolase (pIC50: 4.7–5.8). The second row in
Table 2
displays core 53, with 99 members in the NPS, 27 of which formed a cluster with Class 1 and Class 14 oxidoreductase activity. Among 10 of these compounds that were tested to give full pIC50 values for 10 oxidoreductases from classes 1 and 14, 6 of them had activity (pIC50: 4.5–6.1) for 7 different oxidoreductases between them. Note that core 53 (quinoline) is enriched only 2 times in the NP Set over PubChem and thus was not shown as a novel core in
Figure 2
. Finally, core 21 (in the third row of
Table 2
) is enriched in protein kinase (Transferase Class 7) activity, with 30 out of 117 members active in one of four protein kinases, which clusters close together in the x-axis dendrogram within a different branch from the IFI. Among 25 of these compounds that were tested for any kinase activity, 9 were active (pIC50: 4.2–6.2) for 7 different protein kinases among them (corresponding dendograms are presented in
Three Validated Motifs Derived from Frequent Cores.
In
Figure 4
, we disclose examples of active molecules that were found in the global GSK database (critical results) by applying both methods within FW1, FW2, FW3/core 21, core 11, and core 53. The target abbreviations are expanded in
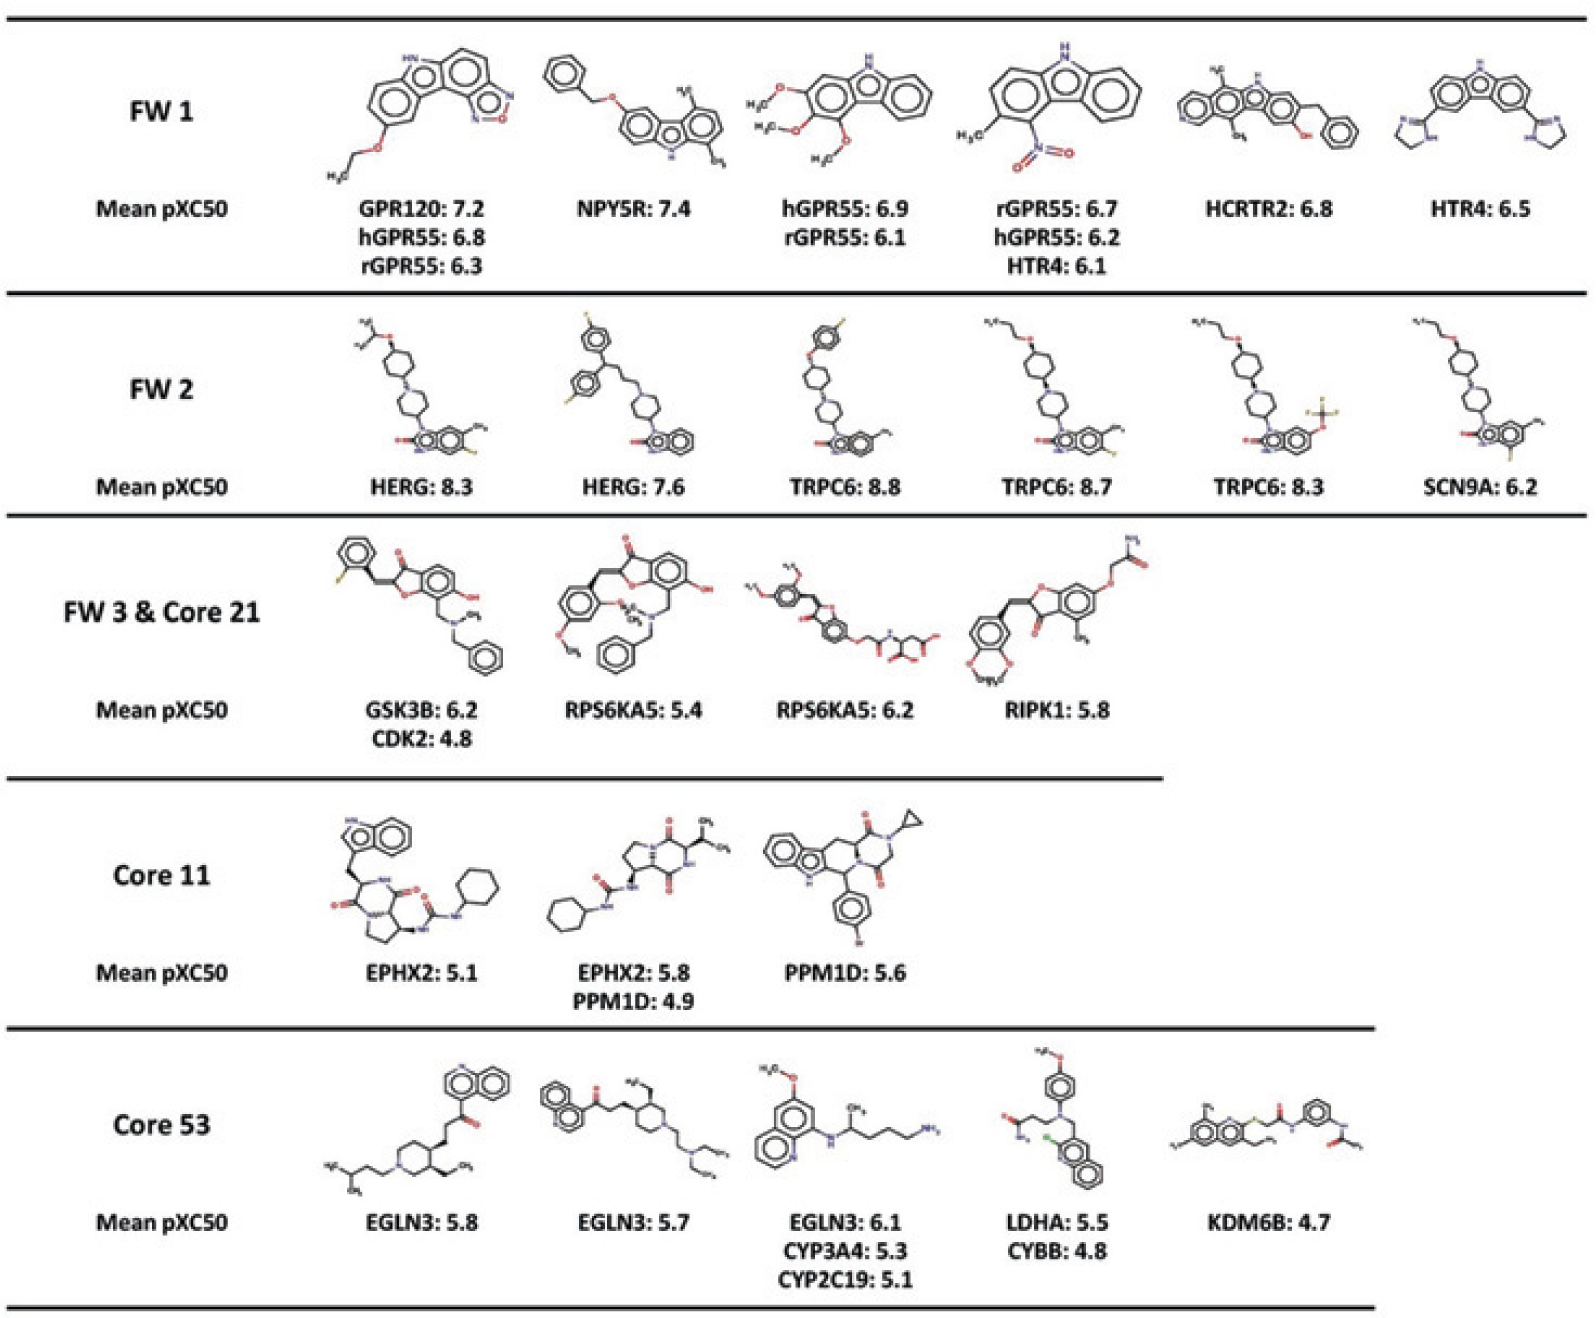
Examples of active molecules from the significant scaffolds reported in
Discussion
The use of HTS in early drug discovery has contributed during the last two decades to the identification of many new pharmacological chemical classes.20,21 The analysis of data generated in HTS has continuously evolved as the compound collections grew in size and chemical diversity; from the original simple activity-driven hit selection, HTS scientists today use more sophisticated methods and algorithms to enrich the chemical diversity of the output. There is, however, still room to better exploit the information that the HTS generates, in particular with the use of the single-shot data produced during the primary-screening campaigns. In this article, we aspire to provide insights on new ways to look at HTS data with the goal to identify hidden information on potentially biologically active structural motifs in target classes. For this purpose, we have focused this study on a NP screening set that is a subset of the GSK HTS collection.
To extract information from the NP set and address the need of a more diverse chemical space, we have investigated the primary screening results on a large collection of NPs. In line with the approach described by Lachance et al., 11 the traditional complexity seen in these sorts of chemical entities is simplified and made more amenable owing to the study of deconstructed molecules and their dominant chemical motifs. Often, one decisive part of the molecule contributes much of the biological relevance, which is widely explored in fragment-based drug discovery.
Although the two described methods share some relatively similar criteria with regard to compound promiscuity assumptions and data compression, they differ in decisive aspects such as the sequence and logic of the data input and the algorithms for identifying chemical motifs. The frameworks used in the data-driven clustering algorithm are whole-molecule descriptors computed by fragmenting the molecule at different levels of resolution. These frameworks initially overlap and do not partition the input data set, although the data-driven clustering algorithm ensures that in the end, a molecule is in only one selected frame. The scoring function used to pick the frameworks ensures that moieties that are closely linked with high activity and a large number of molecules get prioritized, so we have a quantitative view of the most promising series in an HTS data set. Promiscuous motifs are avoided by removing from the analysis all the promiscuous molecules in the NP set.
The analysis of the top-prioritized frameworks has allowed the proposal of chemical motifs that would be specific for different target classes. In particular, we have shown three motifs that appeared with the top scores in the data-driven clustering of the 7TMR, ion channel, and protein-kinase groups. The retrospective analysis of screening data in GSK for the molecules containing these motifs has allowed confirming that these molecules display on average enriched activity in the respective target classes when compared to other target classes, providing evidence of the validity and specificity of the proposed chemical motifs.
The scaffolds detected by common fragment analysis in MOE are essentially simple fragments and substructures. Because they are ranked by frequency (along with complexity and similarity) during the interactive selection process, this tends to favor smaller and more general cores (e.g., 5,6-ring systems such as benzimidazole); more specialized cores are hidden as subcores of the ones enumerated, or occasionally they are removed due to low frequency of activity. The cores do partition the data set because of the way they were chosen. They are more useful in delineating the data into series and observing the substituent SAR within these series, rather than finding “islands” of activity in an HTS data set. Although we found several (~50 of the 234) cores with a target-class activity bias in single-shot screening, confirming that association via existing full-curve data has been challenging, because most often these associations were not detected before, and it has been challenging for compounds that have not been tested for the particular target class in full-curve. Several cores confirmed for a single target within a target class, and if tested they might confirm for more. Of the few cores that have confirmed multiple predicted activities within a target class with historical pIC50 data, we have shown the three best ones in Table 2 .
The data used by the two methods in this article are primary single shot, which are noisier than, for example, pIC50 data. Thus, by using single-shot data, there could be in principle a risk of detecting nonsignificant motifs that could appear by chance. The methods, however, use activities averaged over sets of molecules and targets, which effectively remove noise, leaving only true signal. Figure 1 shows that motifs with clear specificity in target class have been identified, suggesting that the effect of promiscuous compounds or motifs is well removed.
We believe that our investigation provides founded evidence that the systems are identifying true significant motifs and are able to generalize from input data based on the convergence of the two methods on the same core 21 and FW3 for the protein kinase target class, the high number of significant potent cases we have retrospectively found in our databases for the corresponding cores or frameworks and target classes, and finally the presence of the here-described core 53 in the well-known marketed antimalarial drugs, the quinoline derivatives (quinine, chloroquine, mefloquine, etc.), whose mechanism is related with the redox regulation of the parasite 22 exactly as our methods have detected for this core.
In summary, we believe that the two mining methods described appear to be powerful in silico tools to detect motifs found in potent compounds for the given target group. These methods, on their own or in combination, could be applied to the design of focused sets for screening, or the proposal of scaffolds for chemical synthesis. Although in this article we have reported retrospective data, one could use these approaches prospectively to find common scaffolds for emerging target families and profile the chemical diversity around them.
Also, the analysis of larger screening data sets using this approach could help unveil hidden information in primary screens that has not yet been integrated into hit triage, because traditional priorization methods rely more on potency against a particular target.
Footnotes
Acknowledgements
We’d like to acknowledge Tomás Lopez-Jurado and Dolores Jimenez Alfaro for their help on data retrieval and GSK NP collection information. Thomas Meek is acknowledged for critical review. Stephen Pickett is acknowledged for his help with the data-driven clustering algorithm and script as well as fruitful discussions. Pat Brady is acknowledged for support on the promiscuity values. Alain Deschenes (Chemical Computing Group, or CCG) and Alex Clark (formerly at CCG) are acknowledged for the common fragment analysis SVL script that was used to find cores. Dac-Trung Nguyen, Tyler Peryea, Ajit Jadhav (National Center for Advancing Translational Sciences and US National Institutes of Health), and Jerome Verlin (GSK) are acknowledged for help with scripting the PubChem search server.
Declaration of Conflicting Interests
The authors declared no potential conflicts of interest with respect to the research, authorship, and/or publication of this article.
Funding
The authors received no financial support for the research, authorship, and/or publication of this article.
References
Supplementary Material
Please find the following supplemental material available below.
For Open Access articles published under a Creative Commons License, all supplemental material carries the same license as the article it is associated with.
For non-Open Access articles published, all supplemental material carries a non-exclusive license, and permission requests for re-use of supplemental material or any part of supplemental material shall be sent directly to the copyright owner as specified in the copyright notice associated with the article.